Embed Size (px)
Citation preview

Source of Acquisition NASA Goddard Space night Center
POPULAR SUMMARY
Principle Component Analysis of the Evolution of the Saharan Air Layer and Dust Transport: Comparisons between a Model Simulation and MODIS Retrievals
Every summer, large quantities of mineral dust are blown westward over the tropical Atlantic Ocean from the Saharan desert. The frequency of these dust outbreaks is modulated by the occurrence of African Easterly Waves, which propagate from the west coast of Africa across the tropical Atlantic Ocean. The dust is transported in an elevated (2 - 5 km altitude) layer of warm, dry air called the Saharan Air Layer (SAL) that moves above the relatively cool, moist marine boundary layer over the ocean surface. Recent investigations have linked the transport of the SAL with suppressed tropical cyclone activity in this region: the warm air anomalies within the SAL serve to stabilize the atmosphere, suppressing the convective activity which drives the tropical cyclone activity and plays a role in, for example, the development of hurricanes. Other investigations have demonstrated a spatial correlation of the warm air anomalies in the SAL with enhanced dust concentrations. In short, the radiative heating within the elevated dust layer plays a role in suppressing tropical cyclone activity. Numerical models (e.g., forecast models) that do not appropriately simulate the development of the SAL will have a tendency to overestimate the intensity of associated tropical cyclones.
In this study we investigate the evolution of the SAL and associated dust transport during the summer of 2002 using a combination of meteorological datasets, numerical models, and satellite observations. We apply the statistical technique of principle component analysis to meteorological data from the National Center for Evironmental PredictiodNational Center for Atmospheric Research (NCEPNCAR) reanalyses in order to diagnose the onset and direction of transport of SAL warm anomalies. Using the NASA/University of Colorado Community Aerosol and Radiation Model for Atmospheres ( C A W ) and the NCEPNCAR reanalyses we simulated the dust transport over this region for the same period. The validity of the model was assured through comparisons with dust aerosol observations made with the NASA Moderate Resolution Imaging Spectroradiometer (MODIS) onboard the polar-orbiting Terra satellite. We find that near the west African coast the presence of dust is spatially well correlated with the warm anomalies in the meteorological datasets, but that this correlation breaks down further westward. We also diagnose two main transport pathways for the dust, one directly west of Africa, and a second more northwestward, toward the mid-latitude Atlantic and Europe. The statistical analysis of the warm anomalies provides an index for diagnosing which pathway is more important at a given time. We further find a significant linkage between the evolution of the SAL and the Western African Monsoon, as diagnosed by the difference between high altitude winds and the winds in the SAL, although the physical mechanism for this correlation remains a subject of ongoing investigation. Furthermore, the apparent breakdown in the spatial correlation between warm anomalies and dust concentrations in the western tropical Atlantic needs to be investigated more. Although this discrepancy may be subject to dynamical controls such as the northward advection of warm air parcels from the deeper
https://ntrs.nasa.gov/search.jsp?R=20060013185 2018-07-19T00:24:20+00:00Z
tropical atmosphere, it may also be somewhat mitigated by the radiative heating of the dust, which is not accounted for in the current model and may not be properly accounted for in the meteorological analyses because of sparse data in this region, but can be considered in the context of newer NASA models for dust transport and data assimilation.
Sun Wong (l), Peter R. Colarco (2), Andrew E. Dessler (1)
(1) Department of Atmospheric Science, Texas A&M University, College Station, TX (2) Goddard Space Flight Center, NASA, Greenbelt, MD

2
Abstract
The onset and evolution of Saharan Air Layer (SAL) episodes during June-September
2002 are diagnosed by applying principal component analysis to the NCEP reanalysis
temperature anomalies at 850 hPa, where the largest SAL-induced temperature anomalies
are located. The first principal component (PC) represents the onset of SAL episodes,
which are associated with large warm anomalies located at the west coast of Africa. The
second PC represents two opposite phases of the evolution of the SAL. The positive
phase of the second PC corresponds to the southwestward extension of the warm
anomalies into the tropical-subtropical North Atlantic Ocean, and the negative phase
corresponds to the northwestward extension into the subtropical to mid-latitude North
Atlantic Ocean and the southwest Europe. A dust transport model (CARMA) and the
MODIS retrievals are used to study the associated effects on dust distribution and
deposition. The positive (negative) phase of the second PC corresponds to a
strengthening (weakening) of the offshore flows in the lower troposphere around 10"-
20"N, causing more (less) dust being transported along the tropical to subtropical North
Atlantic Ocean. The variation of the offshore flow indicates that the subseasonal
variation of African Easterly Jet is associated with the evolution of the SAL. Significant
correlation is found between the second PC time series and the daily West African
monsoon index, implying a dynamical linkage between West African monsoon and the
evolution of the SAL and Saharan dust transport.
3
Introduction
The Saharan Air Layer (SAL) is a well-mixed layer of dry, warm air located above the
marine boundary layer with the top extending to -500 hPa [Carlson and Prospero, 19721.
From late spring to early fall, it is advected westward with Saharan dust across the North
Atlantic Ocean [Carlson and Prospero, 1972; Prospero and Carlson, 19721. Recently,
Dunion and Velden [2004] used the Geostationary Operational Environmental Satellite to
track the SAL across the North Atlantic Ocean. They found a phenomenological
connection between the SAL and the suppression of the tropical cyclone (TC) activity.
They indicated that the dissipation of deep convection occurring in the interior of the
SAL plays a role in suppressing the development of TC activity. Using satellite-derived
aerosol optical thickness and cloud brightness temperature, Wong and Dessler [2005]
verified the suppression of deep convection associated with the warm and dry anomalies
of the SAL. A model that does not appropriately simulate the SAL will therefore tend to
overestimate the intensity of TCs that are interacting with the SAL [Dunion and Velden,
20041. Understanding the properties of the SAL and studying its evolution are therefore
important tasks for numerical prediction of TCs.
The SAL contains Saharan dust, which propagates with the SAL westward across the
North Atlantic Ocean. There have been many model studies about large-scale
intercontinental transport of dust. Tegen and Miller [1998], Mahowald et al. [2003], and
Colarco et al. [2003] all demonstrated that the downwind dust distribution is mainly
influenced by the dynamical transport rather than the source strength.
The relationship between the dynamical and dust fields has been studied previously.
Alpert et al. [ 19981 showed that there is a spatial correlation between the reanalysis warm
increments and the dust concentrations in the eastern tropical North Atlantic Ocean. A
model-simulated climatology by Jones et al. [2004] indicated that the westward transport
of dust is modulated by African Easterly Waves, which propagate fi-om the west coast of
Africa across the tropical Atlantic Ocean. Karyampudi et al. [ 19991 used lidar
observations to show detailed spatial relationships between the dust plumes and the

4
dynamical fields, with the maximum dust concentration located close to the mid-level jet.
These studies all imply a coherency between the migration of the SAL and the Saharan
dust, and that the linkage between them is related to the propagation of African Easterly
Waves.
With the availability of data from the Moderate Resolution Imaging Spectroradiometer
(MODIS) [Kaufman et al., 1998; King et al., 20031, sophisticated statistical analyses can
be performed on global-scale satellite data to reveal new information about the
interaction between the large-scale dynamical fields and intercontinental dust transport.
Kaufman et al. [2005] applied the aerosol optical thickness (AOT) from MODIS to
estimate the cross-Atlantic flux and deposition budgets of the Saharan dust. They
showed a high correlation during the summertime between the monthly averaged MODIS
dust AOT and westward wind speed at 750 hPa around the tropical-subtropical west coast
of Africa, verifying that the dust outflow from the African continent to the eastern North
Atlantic Ocean is modulated by the offshore easterlies during summer.
In this work, we study the evolution of the SAL and the associated dust transport and
deposition over subseasonal time scales using both model simulations and measurements
from the MODIS. In Section 2, we describe the dust transport model and the
meteorological data used to drive the model. We also describe the satellite retrievals
being used to evaluate the model results. In Section 3, we apply statistical techniques to
define two indices describing the onset and the evolution of each SAL episode during
June-September 2002. We identify different features of the evolution of the SAL and the
related pattern of West African circulation. We also estimate the relative distribution of
dust deposition between the eastern tropical North Atlantic and the northwest Africa to
southwest Europe. Conclusions are presented in the last section.
Model and Data
1. Model Simulation
5
Global dust distributions are simulated for the period June-September 2002 using the
offline Community Aerosol and Radiation Model for Atmospheres (CARMA, Toon et al.
[1988], Ackerman et al. [1995]), following a methodology similar to that in Colarco et al.
[2003]. Briefly, the NCEP/NCAR reanalysis package [Kalnay et al., 19961 and the
NCAR Model for Atmospheric Transport and Chemistry (MATCH, Rasch et al. [ 19971)
provide the meteorology and physical parameterizations (e.g., clouds, convection)
necessary to simulate the atmospheric state. Dust emissions are based on soil erodibility,
soil wetness, and 10-m wind speeds [Ginoux et al. 20011. Dry deposition is the most
important dust removal mechanism in terms of the total aerosol mass, and is highly
dependent on particle size, so to accurately simulate the evolution of the dust particle size
distribution we distribute the dust over eight size bins between 0.1 and 10 pm radius and
compute the fractional emissions for each bin. Dust emissions and meteorology are
archived every six hours over the simulation period. The horizontal spatial resolution of
these fields and the subsequent dust simulations is approximately 1.875' x 1.875' on a
regular longitude and Gaussian latitude grid. The vertical grid is resolved in 28 sigma
layers extending from the surface to approximately 35 km altitude; 18 of these layers are
below 10 km altitude. These fields are read into CARMA, which merges the emissions
and meteorology with the aerosol microphysical and transport continuity equation to
simulate the full dust lifecycle. The timestep in CARMA is 1800 seconds, so input fields
are linearly interpolated to the model current time. Dust removal is by dry deposition, in-
and below-cloud wet scavenging in large-scale cloud systems, and wet scavenging in
convective updrafts [Balkanski et al., 19931. The dust AOT at 550 nm is computed for
each model column from the CARMA column-integrated particle size distribution
assuming Mie scattering and a refractive index of 1.50 - 0.01i. Further details of the
model and its validation are presented in Colarco et al. [2003].
2. Satellite Data
The MODIS aerosol algorithm inverts the measured radiance from six MODIS bands
(0.55-2.1 pm) to retrieve aerosol properties at 10-km resolution [Kauhan et al., 1997;
Levy et al., 2003; Remer et al., 20021. Radiance at these wavelengths comes almost
6
entirely from reflected solar radiation; as a result, these measurements are only available
during daytime. Daily statistics of aerosol properties at grids of l 0 x l o resolution are
archived in the MOD08 level3 product (version 4) [King et al., 20031. We analyze here
the 0.55-pm AOT product measured between June and September 2002. We use
measurements made by the MODIS onboard the Terra satellite, which crosses the equator
around just before local noon. In this paper, we focus on the comparison over oceans
only, where the retrieved AOTs are more reliable than those over lands.
MODIS AOT include radiance extinction from all kinds of aerosols. In the tropical and
subtropical North Atlantic Ocean, the main contributions of AOT are from dust, maritime
aerosol, and aerosol from biomass burning in South Africa. Kaufman et al. [2005]
estimated the seasonal cycle of the relative contributions from these three types of
aerosols to the total AOT. In the region of tropical to subtropical North Atlantic Ocean,
contribution from dust to the total AOT is more than 50% during summer to early autumn
(June-September). The remaining contributions are mainly from maritime aerosol. Since
the CARMA simulation discussed in this paper includes only dust, we would expect a
difference of about a factor of 2 between the MODIS and CARMA AOT. The actual
difference is larger because CARMA in general underestimates AOT. In this study,
however, the important feature is the patterns of dust distribution. Differences between
MODIS and CARMA AOT values do not affect our main conclusions.
The warm anomalies associated with the S A L obtained from NCEP temperatures can be
compared by those obtained from the Atmospheric Infrared Sounder (AIRS) [Strow et al.,
2003; Susskind et al., 19981 onboard the Aqua satellite. AIRS measures upwelling
infrared radiance in 2378 spectral channels and uses those measurements to provide
accurate vertical profiles of atmospheric temperatures at a horizontal resolution of -50-
km at nadir. The temperature retrievals are validated to 1 K in 1-km vertical layers over
ocean [http://www-airs.jpl.nasa.gov/press/news_factsheets.html]. In this study, we used
the daily level-3 product (version 3) with l o x l o spatial resolution to evaluate a S A L episode that occurred in early September 2002.
7
Results
1. Principal Components and Time Evolution
We analyze the NCEP temperature data at 850 hPa, where the warm anomalies associated
with the SAL reach their maxima, in order to investigate the evolution of the SAL. We
first remove the seasonal cycle of the temperatures at 850 hPa for the summertime of
2002 (June 1 to September 30). The seasonal value of temperature at each grid on a
given day is estimated by taking the 31-day average of the temperatures from the -15 to
15 days counting from the given day. The anomalies are the difference between the
noon-time temperatures and the seasonal value for each day and each grid. Positive
(negative) anomalies mean that the temperatures are higher (lower) than the seasonal
values. We then apply principal component analysis (PCA, [Bretherton et al., 1992;
North et al., 1982; Wong and Wang, 20031) to the temperature anomalies in the region of
0"-80"W and 0"-40"N, which covers the areas of tropical to mid-latitude North Atlantic
Ocean and the west coast of Africa. The time series and the patterns of the empirical
orthogonal functions (EOFs) for the first two principal components (PCs) are shown in
Fig. 1 and the left two panels of Fig. 2. The first PC represents about 18% of the
variability of temperature anomalies over the region, and the second PC represents about
11%. The errors of the eigenvalues are estimated by the rule stated by North et al. [ 19821.
The eigenvalues and the associated errors for the first, second, and third PCs are
6.673Z0.85, 3.823Z0.49, and 3.123Z0.40, respectively. Although the spread of the second
and third PCs are marginally overlapped, the comparisons shown below between satellite
retrievals and CARMA dust simulation justify the physical reality of the second PC.
Similar analysis using summertime NCEP temperatures for longer period (1 99 1-2002,
not shown) also gives similar pattern for the second PC.
We also analyze the NCEP wind fields and the distributions of dust AOT from the model
associated with the two PCs. The altitude at which the winds are most correlated with the
transport of Saharan dust out of the African coast is about 700 hPa [Kaufman et al., 20051;
therefore, we analyze the NCEP winds at 700 hPa. We estimate the seasonal values of
8
the winds (and dust AOT) at each grid on a given day by the 31-day averages of
northward and eastward components (and dust AOT) from -15 to 15 days counting from
the given day, similar to what we do for the temperatures. The wind anomalies (hereafter,
referred to as the transient eddy winds) and the dust AOT anomalies are computed as the
residual components after the removal of the seasonal values. The wind anomalies reflect
the subseasonal variations from the seasonal values. Positive (negative) AOT anomalies
mean that the concentrations of dust are higher (lower) than the seasonal values. The
dust AOT anomalies and the eddy winds are then regressed on the time series of the two
PCs, in order to illustrate how the dust concentrations and the winds are associated with
the temperature anomalies. The results are shown in the right two panels of Fig. 2.
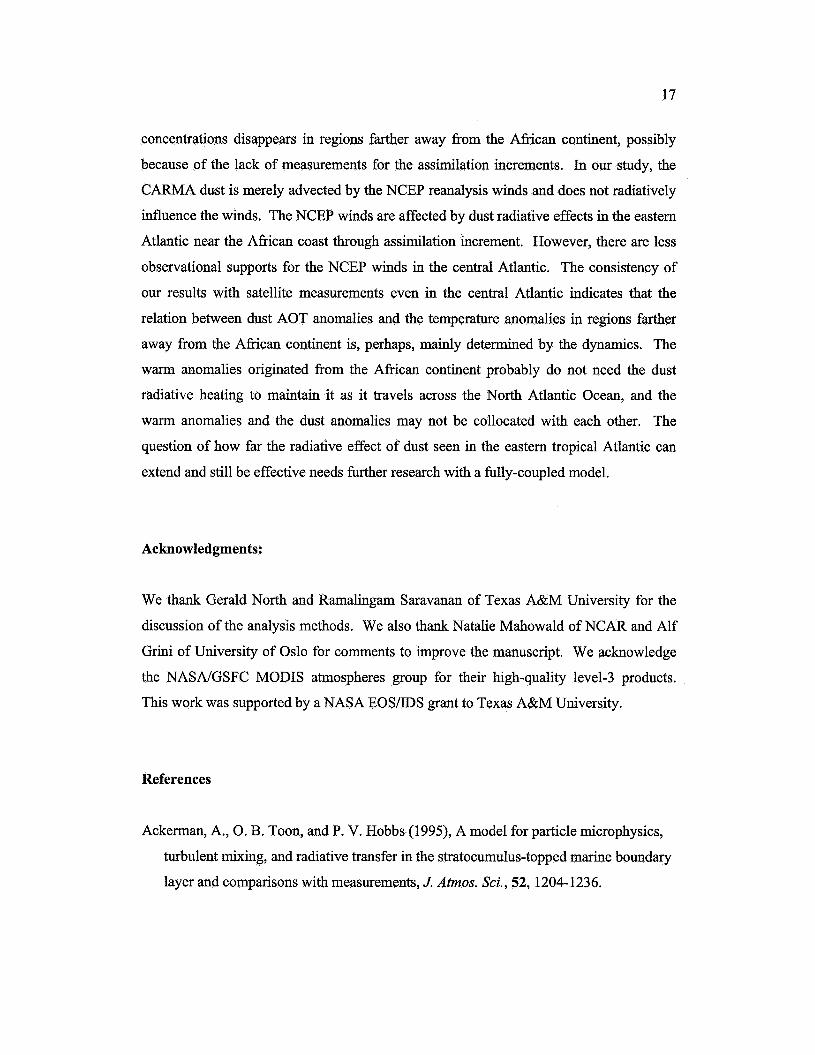
The first EOF (EOF-1, Fig. 2 top left) shows large warm anomalies located off the west
coast of Africa. The warm anomalies are centered at about 30"N and extend toward
Europe as well as into the tropical-subtropical North Atlantic Ocean. The regression of
the dust AOT anomalies on the first PC (Fig. 2 top right) is spatially well correlated with
the pattern of EOF-1. However, the maximum of dust AOT anomalies is located slightly
to the south of the warm anomalies and coincides with the location of the strong off-shore
eddy winds to the east and south of the maximum warm anomalies. This is in agreement
with the lidar measurements showing that dust anomalies tend to be close to the location
of mid-level easterly jet [Karyampudi et al., 19991. In the following, we will utilize the
time series of the first PC (Fig. 1 top) as an index to indicate the timing of the beginning
of SAL episodes at the west coast of Africa. We define the onset of SAL episodes as
when the index exceeds the value of one (meaning that the warm anomalies are more
than the lo-confidence level).
The second EOF (EOF-2, Fig. 2 bottom left) shows a dipole pattern. One end of the
dipole (positive values) is located at the west coast of Africa between about 15"N and
30"N, at the south of the maximum seen in EOF- 1. The other end of the dipole (negative
values) is located northward of 30"N over the northwest-African coast and southwest
Europe. The regression of dust AOT anomalies on the second PC also shows a similar
dipole pattern (Fig. 2 bottom right) with the centers located slightly southward of the
9
centers of the temperature anomalies. The second PC represents two different directions
for SAL migrations during June-September 2002. We utilize the time series of the
second PC (Fig.1 bottom) as an index to define the opposite phases of the evolution of
the SAL. The positive phase is when the index has positive values, corresponding to the
southward and westward migration of the SAL into the tropical-subtropical North
Atlantic Ocean; the negative phase is when the index has negative values, corresponding
to the westward and northward migration of the SAL into the subtropical to mid-latitude
North Atlantic Ocean and the southwest Europe.
The SAL'S two different migration pathways are related to the eddy wind pattern off the
west coast of Africa. For the positive phase (Fig. 2 bottom right), the northeasterly eddy
winds at the east and south boundaries of the warm anomalies around 15-20"N strengthen
the easterly trade winds transporting dust westward. For the negative phase, the direction
of eddy winds is reversed and becomes blowing onshore, weakening the offshore
transport of dust at 15-20"N into the Atlantic Ocean. Instead, more dust tends to be
distributed northward to northwest Africa and southwest Europe. In conclusion, the
migration of SAL from the African continent is correlated with the variation of the
offshore winds at about 15-20"N over the west coast of Africa. Previous studies also
found high correlations between dust AOT and westward winds off the west coast of
Africa at the same latitudes [Karyampudi and Carlson, 1988; Kaufman et al., 2005; 1.
2. Temporal Evolution
We pick from Fig. 1 four individual SAL outbreaks, starting on June 10 (I), June 21 (11),
July 23 (111), and September 5 (IV). All four episodes have the values of the first PC
index greater than one (meaning that the warm anomalies are more than 1-0 confidence
level at the onset). We examine the evolution of each episode by computing the time-lag
composites of the temperature and dust AOT anomalies. The time-lag composites are 4-
day averages of the anomalies with time lags fiom the onset dates. For example, for the
episode (IV) the zero day-lag composite is the 4-day averages of the anomalies from
September 5 to 8, the one day-lag composite is the 4-day averages from September 6 to 9,
10
the two day-lag composite from September 7 to 10, and so on. The composites of the
model variables allow us to compare the model results with the satellite data, because
missing values in the satellite observations due to the clouds or the orbital gaps are
mostly mended by the averages.
Since the temperature anomalies on each day can be expanded by the PCs, we can use the
time series of the first two PCs to give an overview of the evolution of the warm
anomalies near the west coast of Africa. Let T(x,t,) be the temperature anomalies at
position x on day ti, the 4-day averages of the anomalies starting on the day ti can be
expressed as
where c,(t) represents the time series for the m-th PC and ym(x) represents the m-th
EOF. Therefore, the time-lag composites of the PC time series, - c, (t, + n) , provide a
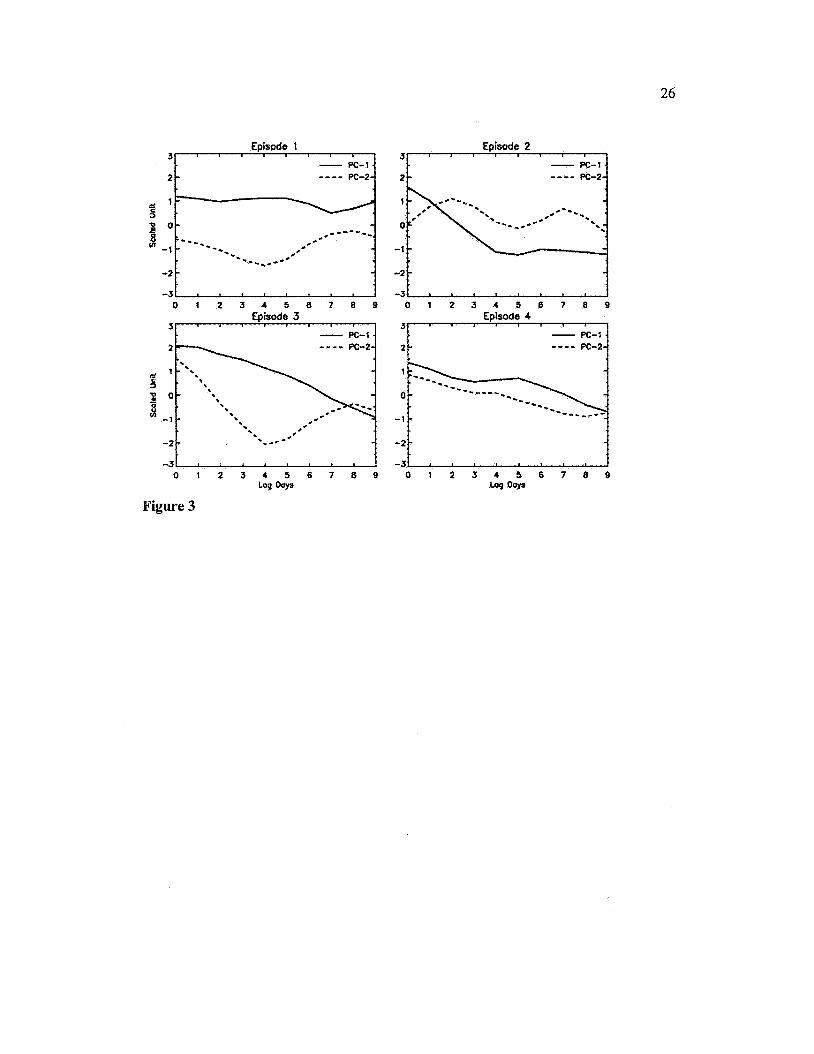
means to investigate the evolution of each episode. Figure 3 shows the time-lag
composites of the first two PC time series (i.e., -cc,(t , + n) , for rn = 42), beginning
on the individual onset dates of the four main episodes. Episode I has relatively flat time-
lag variation of the composites of the first PC time series, because of the several
successive events after the first episode (e.g., events from June 13 to 15, see Fig. 1 top
panel). The time-lag composites of the second PC time series are mainly negative for
Episode I, meaning that the eddy winds near the west coast of Africa are blowing onshore,
and are mainly positive for Episode 11, meaning that the eddy winds are blowing offshore.
l 3 4 n=O
l 3
4 n=O
Figure 4 shows the corresponding spatial distributions of the temperature anomalies and
CARMA dust AOT anomalies for the second-day lag of Episodes I and II. The
distributions of the warm anomalies of these two episodes (Fig. 4 left) are consistent with
the EOF-2 pattern (Fig 2. bottom left). The negative-phase dominated Episode I has
warm anomalies mainly distributed north of 20"N over the subtropical to mid-latitude
Atlantic Ocean. The positive-phase dominated Episode I1 has warm anomalies extending

11
southwestward into the tropical Atlantic Ocean. In Episode I, the transport of dust along
15-20"N is suppressed by the onshore eddy winds at the west coast of Africa.
Consequently, more dust tends to travel northward to Europe, and some heads
southwestward into the deep tropical Atlantic Ocean (Fig. 4, top right). The anomalies
seen in the central Atlantic Ocean around 15"-2OoN are the reminiscent from a previous
episode. In contrast, during Episode 11, the dust is transported into the Atlantic Ocean
around 15-30"N by the offshore eddy winds (Fig. 4, bottom right).
For Episode 111, the time-lag composite of the second PC time series (Fig. 3 bottom left)
changes sign around the second-day lag, implying that there is a change in the near-coast
wind direction, accordingly altering the evolution of the warm anomaly. For Episode IV,
the 4-day averaged second-PC time series remains positive for 4 to 5 days of time lag.
For this period, the offshore eddy winds at the west coast of Africa dominate for the
evolution of the SAL,. On the 5-th to 6-th day of time lag, the phase becomes negative
and onshore eddy winds dominate. In the next three subsections, we will focus on
Episodes I11 and IV and compare the reanalysis and model results with satellite retrievals.
3. Evolution of Episode I11
Figure 5 illustrates the evolution of the warm anomalies associated with the SAL for
Episode 111 (onset day on July 23). The spatial distributions of the warm anomalies are
qualitatively similar to the pattern of the SAL tracking imagery shown by Dunion and
Velden [2004] (comparing the Lag 2 and Lag 4 figures with their Fig. l), although they
showed the imagery in a different year. Figure 5 also shows the eddy wind field
composites associated with the warm anomalies on each day lag. The corresponding
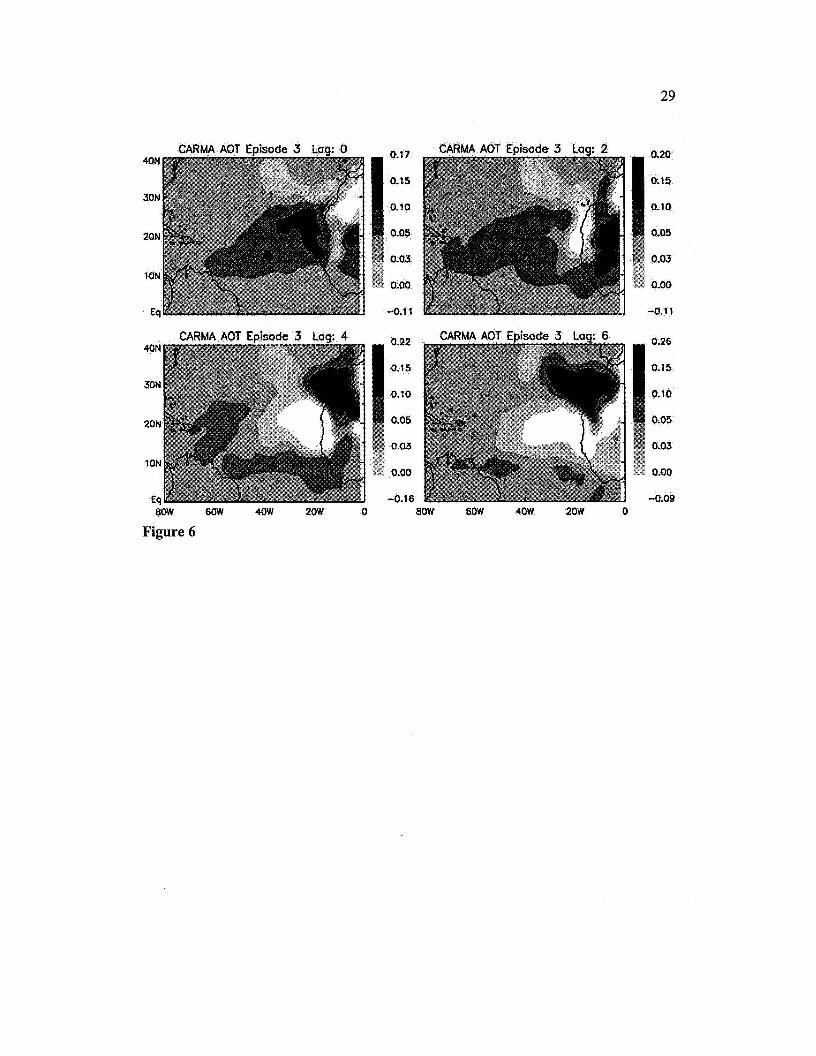
CARMA and MODIS dust AOT composites are shown in Figs. 6 and 7.
The composite on the 0-day lag (July 23-26) shows that the SAL warm anomalies at 850
hPa extend southwest toward the tropical Atlantic Ocean (Fig. 5 top left). The
corresponding composite of the second PC time series (Fig. 3 bottom left) is positive and
the distribution of the warm anomalies is consistent with the positive-phase of the second
12
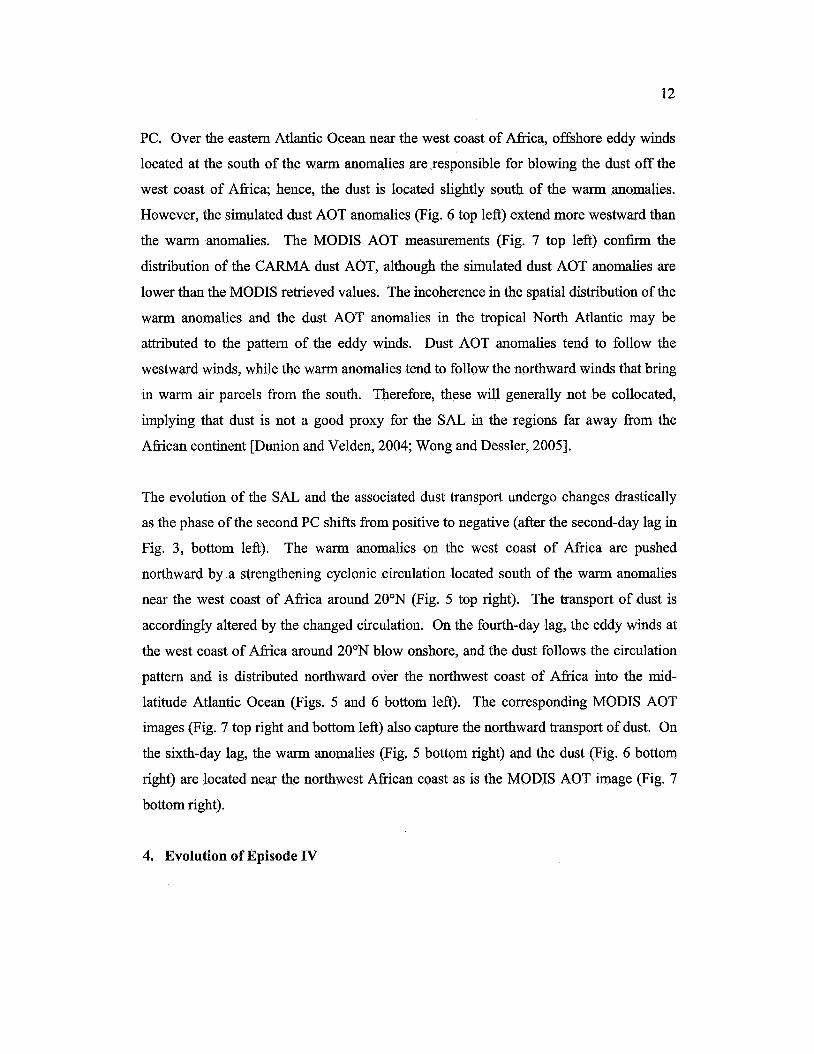
PC. Over the eastern Atlantic Ocean near the west coast of Africa, offshore eddy winds
located at the south of the warm anomalies are responsible for blowing the dust off the
west coast of Africa; hence, the dust is located slightly south of the warm anomalies.
However, the simulated dust AOT anomalies (Fig. 6 top left) extend more westward than
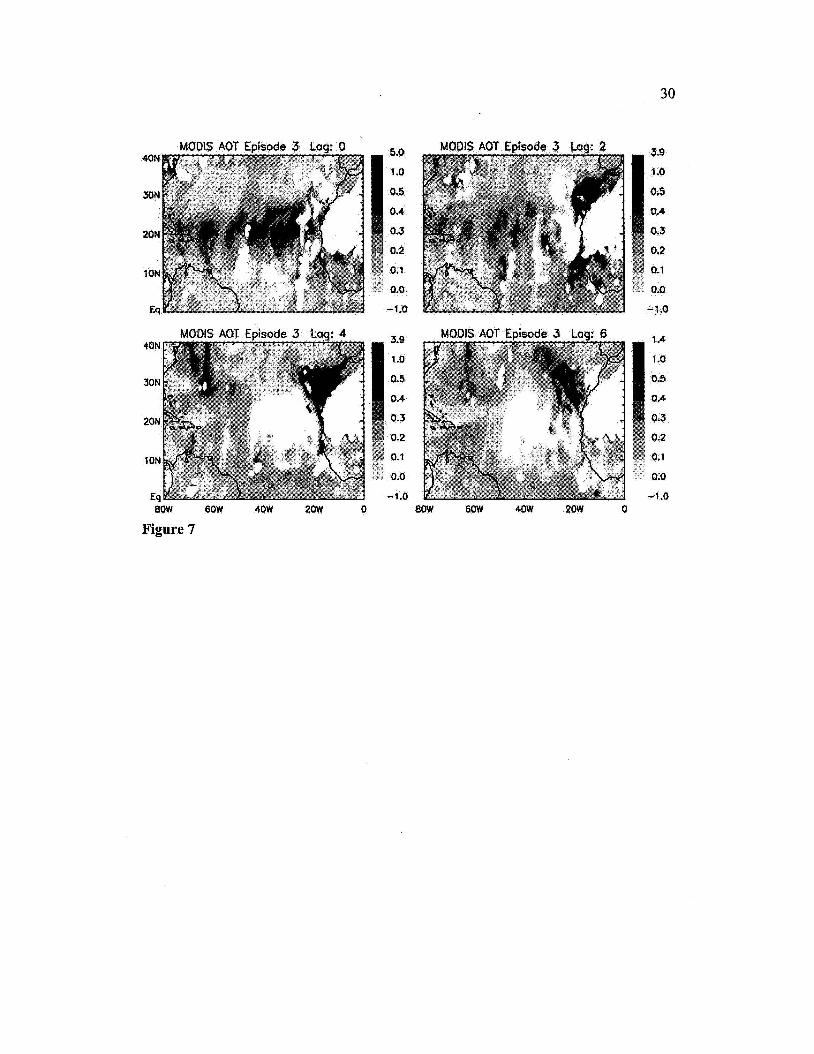
the warm anomalies. The MODIS AOT measurements (Fig. 7 top left) confirm the
distribution of the CARMA dust AOT, although the simulated dust AOT anomalies are
lower than the MODIS retrieved values. The incoherence in the spatial distribution of the
warm anomalies and the dust AOT anomalies in the tropical North Atlantic may be
attributed to the pattern of the eddy winds. Dust AOT anomalies tend to follow the
westward winds, while the warm anomalies tend to follow the northward winds that bring
in warm air parcels from the south. Therefore, these will generally not be collocated,
implying that dust is not a good proxy for the SAL in the regions far away from the
African continent [Dunion and Velden, 2004; Wong and Dessler, 20051.
The evolution of the SAL and the associated dust transport undergo changes drastically
as the phase of the second PC shifts from positive to negative (after the second-day lag in
Fig. 3, bottom left). The warm anomalies on the west coast of Africa are pushed
northward by a strengthening cyclonic circulation located south of the warm anomalies
near the west coast of Africa around 20°N (Fig. 5 top right). The transport of dust is
accordingly altered by the changed circulation. On the fourth-day lag, the eddy winds at
the west coast of Africa around 20"N blow onshore, and the dust follows the circulation
pattern and is distributed northward over the northwest coast of Africa into the mid-
latitude Atlantic Ocean (Figs. 5 and 6 bottom left). The corresponding MODIS AOT
images (Fig. 7 top right and bottom left) also capture the northward transport of dust. On
the sixth-day lag, the warm anomalies (Fig. 5 bottom right) and the dust (Fig. 6 bottom
right) are located near the northwest African coast as is the MODIS AOT image (Fig. 7
bottom right).
4. Evolution of Episode IV

13
Figure 8 shows the evolution of the warm anomalies of Episode-IV (onset on September
5) and the associated eddy wind composites. We also compare in Fig. 9 the evolution of
this episode with that seen in A I R S retrieved temperatures for the second and fourth-day
lags. Since we have only AIRS data for September of 2002, we obtain the warm
anomalies in Fig. 9 by subtracting the monthly mean temperatures of September 2002,
instead of the averages of the -15 to +15 days from the onset day. Comparing the lag-2
and lag-4 panels of Fig. 9 with the corresponding panels of Fig. 8, we can see that the
various methods of determining the anomaly field produce quantitatively similar results.
Fig. 9 shows that the evolution of the warm anomalies captured by the NCEP reanalysis
temperatures is remarkably consistent with that by the AIRS retrieved temperatures. In
this episode, the warm anomalies move westward along the latitude of about 20"-30"N.
The associated CARMA and MODIS dust AOT anomalies are shown in Figs. 10 and 11 , respectively. On the 0- and second-day lags, the SAL warm anomalies are located just
off the west coast of Africa. The offshore eddy winds at the south boundary of the warm
anomalies (Fig. 7 top) are again responsible for blowing the dust off the west coast of
Africa, and the maxima of the dust AOT anomalies are located slightly southward of the
maxima of warm anomalies. On the second- to fourth-day lags, the phase of the second
PC is still positive (Fig. 3 bottom right), and the warm anomalies and the dust are moving
westward into the tropical-subtropical North Atlantic Ocean by the enhanced easterly
trade winds.
On the fourth- and sixth-day lags, the warm anomalies have detached from the west coast
of Africa and been moving toward the central Atlantic Ocean (Fig. 8 bottom panels).
This feature is captured by the AIRS measurements (Fig. 9 bottom panels). The
corresponding westward transport of dust is captured by the CARMA simulation (Fig. 10
bottom panels) and the MODIS measurements (Fig. 11 bottom panels), although detailed
difference in dust distributions between CARMA and MODIS becomes more evident in
later time-lag composites.
5. Distribution of Dust Deposition
14
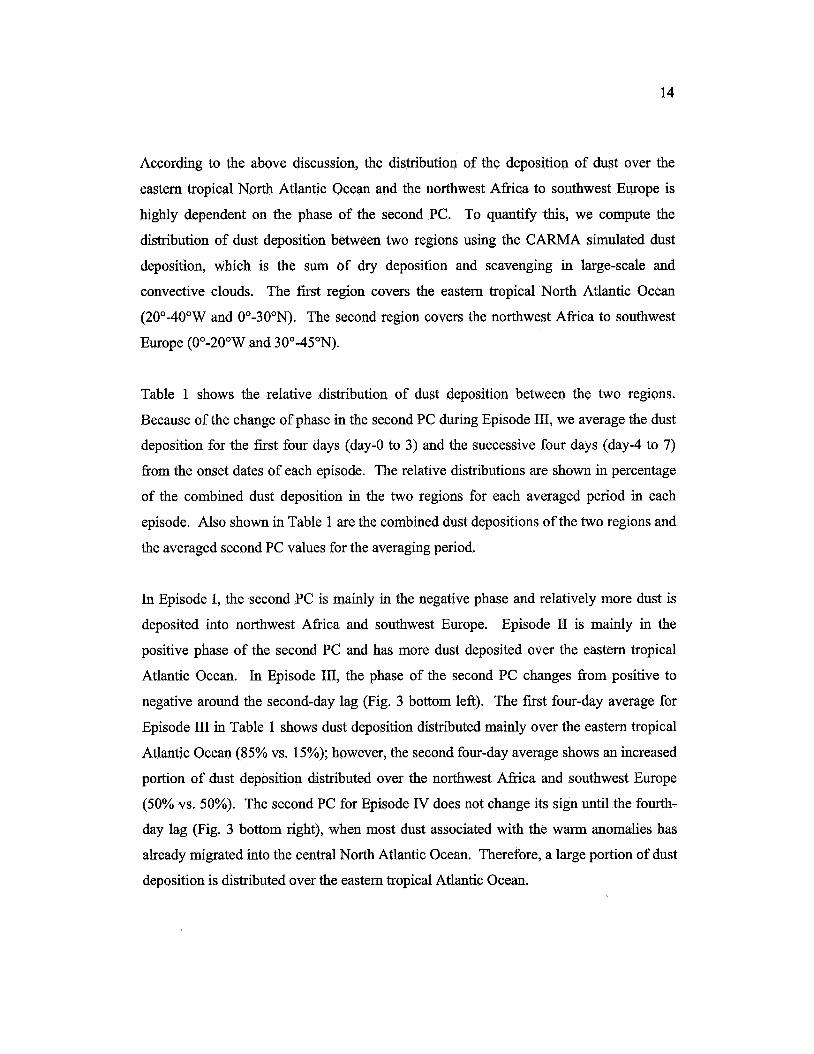
According to the above discussion, the distribution of the deposition of dust over the
eastern tropical North Atlantic Ocean and the northwest Africa to southwest Europe is
highly dependent on the phase of the second PC. To quantify this, we compute the
distribution of dust deposition between two regions using the CARMA simulated dust
deposition, which is the sum of dry deposition and scavenging in large-scale and
convective clouds. The first region covers the eastern tropical North Atlantic Ocean
(2Oo-40"W and 0"-30"N). The second region covers the northwest Africa to southwest
Europe (0"-2O"W and 30°-45"N).
Table 1 shows the relative distribution of dust deposition between the two regions.
Because of the change of phase in the second PC during Episode 111, we average the dust
deposition for the first four days (day-0 to 3) and the successive four days (day-4 to 7)
from the onset dates of each episode. The relative distributions are shown in percentage
of the combined dust deposition in the two regions for each averaged period in each
episode. Also shown in Table 1 are the combined dust depositions of the two regions and
the averaged second PC values for the averaging period.
In Episode I, the second PC is mainly in the negative phase and relatively more dust is
deposited into northwest Africa and southwest Europe. Episode I1 is mainly in the
positive phase of the second PC and has more dust deposited over the eastern tropical
Atlantic Ocean. In Episode 111, the phase of the second PC changes from positive to
negative around the second-day lag (Fig. 3 bottom left). The first four-day average for
Episode I11 in Table 1 shows dust deposition distributed mainly over the eastern tropical
Atlantic Ocean (85% vs. 15%); however, the second four-day average shows an increased
portion of dust deposition distributed over the northwest Africa and southwest Europe
(50% vs. 50%). The second PC for Episode IV does not change its sign until the fourth-
day lag (Fig. 3 bottom right), when most dust associated with the warm anomalies has
already migrated into the central North Atlantic Ocean. Therefore, a large portion of dust
deposition is distributed over the eastern tropical Atlantic Ocean.
15
In conclusion, there are two transport pathways for North African dust. The first is
directly westward into the tropical to subtropical Atlantic, while the second is
northwestward toward mid-latitude Atlantic and Europe. The second PC of the
temperature anomaly gives us a measure of the importance at any given time of this
pathway: more (less) dust is deposited over northwest Africa and southwest Europe than
over the eastern tropical North Atlantic Ocean, if the second PC has negative (positive)
phase.
Conclusions and Discussion
Principal component (PC) analysis is applied to NCEP temperature anomalies at 850 hPa
for June-September 2002. The first PC represents the onset of SAL episodes, which are
associated with large warm anomalies located just off the west coast of Africa. The
second PC has a dipole pattern that represents opposite phases of the evolution of the
SAL,. In the positive phase, the SAL tends to migrate southwestward into the subtropical
to tropical Atlantic Ocean. In the negative phase, the SAL tends to migrate into the
subtropical to mid-latitude Atlantic Ocean, the northwest Africa and southwest Europe.
The phase of the second PC is related to the direction of transient eddy winds at the west
coast of Africa around 15-20"N. In its positive phase, the transient eddy winds
strengthen the climatological northeasterly, which blows offshore. In the negative phase,
the eddy circulation pattern is reversed and the offshore flow at the west coast of Africa
around 20"N is weakened.
The NCEP meteorology is used to drive the CARMA model to simulate the
corresponding dust distribution and deposition. We find that dust deposition is more
likely to occur over northwest Africa and southwest Europe during the negative phase of
the second PC than during the positive phase. The dust AOT anomalies simulated by
CARMA have patterns in agreement with those seen in MODIS AOT anomalies,
although the CARMA model underestimates the total AOT. Compared with the AIRS
temperature retrievals in September 2002, NCEP temperatures at 850 hPa reproduce the
migration of the warm anomalies associated with the SAL of our Episode IV. These
16
agreements between independent satellite measurements and model simulations increase
our confidence in the reliability of our analysis and the quality of NCEP reanalysis and
CARMA simulation.
Several issues discussed in this paper need further research. We have identified that the
evolution of SAL described by the second PC is associated with the strengthening of the
easterlies at 700 hPa around 15-2OoN, because of the thermal wind relation. Several
studies [Carlson and Prospero, 1972; Cook, 1999; Dunion and Veldon, 2004; etc.] have
indicated or implied the relation between the SAL and the African Easterly Jet, a
component of the West African Monsoon (WAIM). It will be interesting to further
investigate the relationship between the evolution of the SAL and the subseasonal
variation of the WAM. The traditional WAM index (WAMI) is defined by the difference
of 200-hPa monthly mean zonal winds and the monthly mean modulus of the 850-hPa
winds, averaged over 2O0W-20"E and 3"-13"N [Fontaine et al., 1995; Moron et al., 2004;
Palmer et al., 19921. Because we are studying the subseasonal scale variation of the
circulation, we apply the same definition of the WAMI but replace monthly mean data
with our daily noon-time wind anomalies. We have correlated our second PC time series
with the daily WAMI and found significant correlations (-0.5 over 99% confidence level),
if the PC time series lag behind the WAMI by 4-5 days. This implies a dynamical
linkage between the variation of the WAM and the evolution of SAL. However, it is still
not clear to us what the detailed physical mechanism behind these significant time-lag
correlations is. It is necessary to further investigate whether the radiative effect of dust
can influence the subseasonal variation of the monsoon-type wind patterns, and how the
variation of the monsoon-type wind patterns affects the transport of dust.
The second issue we would like to raise is about the dust radiative effect. It is clear fkom
studies of simple models that heating from dust can alter the circulation pattern of the
atmosphere [Stephens et al., 20041. Alpert et al. [1998] and Jones et al. [2004], by
comparing the spatial distributions of temperature increments in data assimilations and of
dust, suggested that dust has a w&g effect at least over the eastern tropical North
Atlantic Ocean. The correlation between the temperature increments and the dust
17
concentrations disappears in regions farther away from the African continent, possibly
because of the lack of measurements for the assimilation increments. In our study, the
CARMA dust is merely advected by the NCEP reanalysis winds and does not radiatively
influence the winds. The NCEP winds are affected by dust radiative effects in the eastern
Atlantic near the African coast through assimilation increment. However, there are less
observational supports for the NCEP winds in the central Atlantic. The consistency of
our results with satellite measurements even in the central Atlantic indicates that the
relation between dust AOT anomalies and the temperature anomalies in regions farther
away from the Afiican continent is, perhaps, mainly determined by the dynamics. The
warm anomalies originated from the Afi-ican continent probably do not need the dust
radiative heating to maintain it as it travels across the North Atlantic Ocean, and the
warm anomalies and the dust anomalies may not be collocated with each other. The
question of how far the radiative effect of dust seen in the eastern tropical Atlantic can
extend and still be effective needs further research with a fully-coupled model.
Acknowledgments:
We thank Gerald North and Ramalingam Saravanan of Texas A&M University for the
discussion of the analysis methods. We also thank Natalie Mahowald of NCAR and Alf
Grini of University of Oslo for comments to improve the manuscript. We acknowledge
the NASNGSFC MODIS atmospheres group for their high-quality level-3 products.
This work was supported by a NASA EOS/IDS grant to Texas A&M University.
References
Ackerman, A., 0. B. Toon, and P. V. Hobbs (1995), A model for particle microphysics,
turbulent mixing, and radiative transfer in the stratocumulus-topped marine boundary
layer and comparisons with measurements, J. Atmos. Sci., 52, 1204-1236.
18
Alpert, P., Y. J. Kaufman, Y. Shay-El, D. T a d , A. da Silva, S . Schubert, and J. H.
Joseph (1 998), Quantification of dust-forced heating of the lower troposphere,
Nature, 395, 367-370.
Balkanski, Y. J., D. J. Jacob, G. M. Gardner, W. C. Graustein, and K. K. Turekian (1993),
Transport and residence times of tropospheric aerosols inferred from a global three-
dimensional simulation of 210Pb, J. Geophys. Res., 98,20573-20586.
Bretherton, C. S., C. Smith, and J. M. Wallace (1992), An intercomparison of methods
for finding coupled patterns in climate data, J. Clim. , 5,541 -560.
Carlson, T. N., and J. M. Prospero (1972), The large-scale movement of Saharan air
outbreaks over the northern equatorial Atlantic, J. Appl. Meteor., 11,283-297.
Colarco, P. R., 0. B. Toon, and B. N. Holben (2003), Saharan dust transport to the
Caribbean during PRIDE: 1. Influence of dust sources and removal mechanisms on
the timing and magnitude of downwind aerosol optical depth events from simulations
of in situ and remote sensing observations, J. Geophys. Res., 108, 8589,
doi: 10.1029/2002JD002658.
Cook, K. H. (1999), Generation of the African Easterly Jet and its role in determining
west African precipitation, J. Clim., 12, 1165-1 184.
Dunion, J. P., and C. S. Velden (2004), The impact of the Saharan air layer on Atlantic
tropical cyclone activity, Bull. Amer. Meteor. SOC. , 353-365.
Fontaine, B., S. Janicot, and V. Moron (1995), Rainfall anomaly patterns and wind field
signals over West Africa in August (1958-1989), J. Clim., 8, 1503-1510.
Ginoux, P., M. Chin, I. Tegen, J. M. Prospero, B. Holben, 0. Dubovik, and S.-J. Lin
(200 l), Sources and distributions of dust aerosols simulated with the GOCART
model, J. Geophys. Res., 106 (D17), 20255-20273.
Jones, C., N. Mahowald, and C. Luo (2004), Observational evidence of African desert
dust intensification of easterly waves, Geophys. Res. Lett. , 31, L17208,
doi: 10.1029/2004GL020107.
Kalnay, E. et al. (1996), The NCEP/NCAR 40-year reanalysis project, Bull. Am.
Meteorol. Soc. , 77,437-47 1.

19
Karyampudi, V. M., and T. N. Carlson (1988), Analysis and numerical simulations of
the Saharan air layer and its effect on easterly wave disturbances, J. Atmos. Sei., 45,
3103-3 136.
Karyampudi, V. M., S. P. Palm, J. A. Reagen, H. Fang, W. B. Grant, R. M. Hoff, C.
Moulin, H. F. Pierce, 0. Torres, E. V. Browell, and S. H. Melfi (1999), Validation of
the Saharan dust plume conceptual model using lidar, meteosat, and ECMWF data,
Bull. Amer. Meteor. SOC., 80, 1045-1075.
Kaufman, Y. J., I. Koren, L. A. Remer, D. TanrC, P. Ginoux, and S. Fan (2005), Dust
transport and deposition observed from the Terra-Moderate Resolution Imaging
Spectroradiometer (MODIS) spacecraft over the Atlantic Ocean, J. Geophys. Res.,
110, D10S12, doi: 10.1029/2003JD004436.
Kaufman, Y. J., D. Tam& L. A. Remer, E. Vermote, A. Chu, and B. N. Holben (1997),
Operational remote sensing of tropospheric aerosol over land from EOS moderate
resolution imaging spectroradiometer, J. Geophys. Res., 102, 17,05 1 - 17,067.
King, M. D., Member, IEEE, W. P. Menzel, Y. J. Kaufman, D. TanrC, B. -C. Gao, S.
Platnick, S. A. Ackerman (2003), L. A. Remer, R. Pincus, and P. A. Hubaaks, Cloud
and aerosol properties, precipitable water, and profiles of temperature and water
vapor from MODIS, IEEE Trans. Geosci. Remote Sensing, 41,442-458.
Levy, R. C., L. A. Remer, D. TanrC, Y. J. Kaufman, C. Ichoku, B. N. Holben, J. M.
Livingston, P. B. Russell, and H. Maring (2003), Evaluation of the Moderate-
Resolution Imaging Spectroradiometer (MODIS) retrievals of dust aerosol over the
ocean during PRIDE, J. Geophys. Res., 108@19), 8594, doi: 10.1029/2002JD002460.
Mahowald, N., C. Luo, J. del Corral, C. S. Zender (2003), Interannual variability in
atmospheric mineral aerosols from a 22-year model simulation and observational data,
J. Geophys. Res., 108,4352, doi:l0.1029/2002JD002821.
Moron, V., N. Philippon, and B. Fontaine (2004), Simulation of West African monsoon
circulation in four atmospheric general circulation models forced by prescribed sea
surface temperature, J. Geophys. Res., 109, D24105, doi: 10.1029/2004JD004760.
North, G. R., T. L. Bell, R. F. Cahalan, F. J. Moeng (1982), Sampling errors in the
estimation of empirical orthogonal functions, Mon. Wea. Rev. , 110,699-706.
20
Palmer, T. N., C. Brankovice, P. Viterbo, and M. J. Miller (1992), Modeling inter-annual
variations of summer monsoons, J. Clim., 5,399-417.
Prospero, J. M., and T. N. Carlson (1 972), Vertical and area distributions of Saharan dust
over the western equatorial North Atlantic Ocean, J. Geuphys. Res., 77,5255-5265.
Rasch, P. J., N. M. Mahowald, and B. E. Eaton (1997), Representations of transport,
convection, and hydrologic cycle in chemical transport models: Implications for the
modeling short-lived and soluble species, J. Geuphys. Res., 102 (D23), 28127-28138.
Remer, L. A., D. TanrC, Y. J. Kaufhan, C. Ichoku, S. Mattoo, R. Levy, D. A. Chu, B.
Holben, 0. Dubovik, A. Smirnov, J. V. Martins, R. -R. Li, and Z. Ahmad (2002),
Validation of MODIS aerosol retrieval over ocean, Geuphys. Res. Lett., 29, 16 18,
doi: 10.1029/2001 GLO 13204.
Stephens, 6. L., N. B. Wood, and L. A. Pakula (2004), On the radiative effects of dust
on tropical convection, Geuphys. Res. Lett., 31, L23 1 12, doi: 10.1029/2004GL021342.
Strow, L. L., S. E. Hannon, S. De Souza-Machado, H. E. Motteler, and D. Tobin (2003),
An overview of the AIRS radiative transfer model, IEEE Trans. Geosci. Remote
Sensing, 41,303-313.
Susskind, J., C. Barnet, and J. Blaisdell(1998), Determination of atmospheric and surface
parameters from simulated AIRS/AMSU/HSB/soundg data: Retrieval and cloud
clearing methodology, Adv. Space Res., 21(3), 369-384.
Tegen, I., and R. Miller (1998), A general circulation model study on the interannual
variability of soil dust aerosol, J. Geuphys. Res., 103(D20), 25,975-25,995.
Toon, 0. B., R. P. Turco, D. Westphal, R. Malone, and M. S. Liu (1988), A
multidimensional model for aerosols: Description of computational analogs, J. Atm.
Sci., 45 (15), 2123-2143.
Wong, S. and A. E. Dessler (2005), Suppression of deep convection over the tropical
North Atlantic by the Saharan air layer, Geuphys. Res. Lett. 32, L09808,
doi: lO.l029/2004GLO22295.
Wong, S. and W. -6. Wang (2003), Tropical-extratropical connection in interannual
variation of the tropopause: Comparison between NCEPNCAR reanalysis and an
atmospheric general circulation model simulation, J. Geuphys. Res., 10S(D2), 4043,
doi: 10.1029/2001JD0020 16.

21
Figure Captions
Figure 1. Time series of the first (top) and the second (bottom) principal components of
the variation of 850 hPa NCEP reanalysis temperature anomalies for June-September
2002 over 10"-20"N and 20"-8O"W. The abscissa is the Julian day number starting
from June 1, 2002. The ordinate is scaled by the standard deviation of the time series
(e.g., *l means at the *1-o levels). The contributions of the PCs to the total
variability are also shown in the figure titles. The arrows in the top panel show the
four main episodes being discussed in the text.
Figure 2. Geographical distributions of the first two (left panels) empirical orthogonal
functions (units in K) of the variation of 850 hPa NCEP reanalysis temperature
anomalies for June-September 2002 over 10"-20"N and 20"-8O"W. The right panels
show the CARMA dust AOT (at 0.55 pm) and the NCEP transient eddy winds at 700
hPa projected onto the time series of the first (top right) and second (bottom right)
PCS.
Figure 3. Time-lag evolutions of the 4-day averages of the first (solid lines) and second
(dashed lines) PC time series, starting from the onset dates of four main warm
episodes. The ordinates are scaled by the standard deviations of the time series.
Figure 4. The second-day lag composites of the 850-hPa NCEP temperature anomalies
(in K) and 700-hPa transient eddy winds (left) and of CARMA dust AOT (right). The
top panels show the composites for Episode I and the bottom panels show the
composites for Episode II.
Figure 5. Time-lag composites of the 850-hPa NCEP temperature anomalies (in K) and
700-hPa transient eddy winds for Episode III. The zero-, second-, fourth-, and sixth-
day lags are shown.

22
Figure 6. Time-lag composites of the CARMA dust AOT computed at 0.55pm for
Episode III. The zero-, second-, fourth-, and sixth-day lags are shown.
Figure 7. Similar to Figure 6 but for MODIS AOT at 0.55 pm. Missing data are set as
negative and in white color.
Figure 8. Similar to Figure 5 but for Episode IV.
Figure 9. Comparisons of time-lag composites computed fkom the 850-hPa NCEP
temperature anomalies and the 850-hPa AIRS temperature anomalies (units in K) for
Episode IV. In this figure, the anomalies are computed as the difference of the
temperature fields and the September mean. The top panels show the results for the
second-day lag and the bottom panels show the results for the fourth-day lag.
Figure 10. Similar to Figure 6 but for Episode IV.
Figure 11. Similar to Figure 7 but for Episode IV.

23
Total Deposition
(Tg) 0.18 0.19 0.19 0.3 1 0.24 0.2 1 0.27 0.19
lame I . uust aeposition over me eastern tropical iuortn xtiantic wean (LU--L)U-W ana
0°-300N) and the northwest Africa and southwest Europe (0'-20"W and 30°-45'N)
for the four S A L episodes in June-September 2002. The first row in each episode is
the average of dust deposition for the frrst four days (day 0 to 3) of the episode; the
second row is the average over the next four days (day 4 to 7). Relative distributions
over each region are also shown in percentage.
E. Atlantic (%)
34 27 61 53 85 50 94 95
Episode N.W. Africa and S. W. Europe
(YO)
66 I
I1
IIl
IV
Averaged 2"4PC Index
-0.58 73 39 47 15 50 6 5
-1.69 0.04 0.12 1.55
-2.07 0.84 0.07

24
T850 PC-1 18.3%
152 1 82 232 243 273 T850 PC-2 10.5%
3 ' 8 . * . * - ' f " - ' - " ' ~ ' - - - I II 111 w
S 52 I82 2f2 243 273 JULIAN DAYS
Figure. 1
25
0.09 0.69
0.60 0.08
0.40 0.07
0.30 .*+..--..-..* 0.06
0.04 0.20
0.00 0.00
-0.16 -0.05
AOT and 700 hPo Wi T850 PC-1 18.3%
e*.. -. . . . , z,,.,.-.+*r\
r,,, r r . . **-.. -..* .... . .... .-... , . .a \ . . . . . . . , . . . . . .
AOT and 700 hPa Winds on PC-2 o.,2 0.47
0.40 0.08
0.30 0.06
20N 0.20 0.04
0.00 0.00
-0.40 -0.04
T850 PC-2 10.5% 40N
30N
1 ON
-0.61 -0.06 80W 60W 40%' 25%' 0 Bow 60W 40W 20w 0
Figure 2
26
"t I Episode 3
3 - Pc-1
-29 -3 0 1 2 3 4 5 8 7 8 9
Episode 4 ' . * " * " - Pc-1
--*- pc-2
Figure 3

27
0.18
0.15
0.10
0.05
0.03
0.00
-0.10
40N
30N
20N
ION
8.0 0.20
4.0 0.15
............ 0.10 , , 3.0 , ........... I?
0.05 2.0
1 .0 0.03
0.0 0.00
-4.5 -0.12
40N
30N
............ .......... I* *----,,-.., ,..-.,,,-..I-. ............. ........... ..- .-..-.-.
20N
1 ON
BOW 60W 40W 20w 0 80W 60W 40W 20W 0
Figure 4

28
4 .O 4.0
3.0 3.0
40N
30N
20N
ION
Eq
80W 6ow 4aw 2aw 0 80W 6OW 40W 20w 0
Figure 5
29
CARMA AOT Edsode 3 Loa: 0
CARMA AOT Eoisode 3 Lao: 4 40N
30N
20N
1 ON
Ea
0.17 CARMA AOT Episode 3 Lag: 2 0.20
0.15 0.15
0.10 0.10
0.05 0.05
0.03 0.03
0.00 0.00
-0.1 1 -0.1 1
o.22 CARMA AOT Episode 3 Lag: 6 0.26
0.1 5 0.15
0.10 0.10
0.05 0.05
0.03 0.03
0.00 0.00
-0.16 -0.09 SOW 60W 40%' 2OW 0 %OW 60W 4 0 W 20W 0
Figure 6
30
Bow 60W 40” 20W 0 60W 40W 20w 0
Figure 7

31
40N
30N
20N
1 ON
-1.6
8.0
4.0
3.0
2.0
1.0
0.0
-4.3
8.0
4.0
3.0
2.0
1 .o
0.0
-2.4 -2.9 BOW 60W 40w 20w 0 8ow 60W 40w 20w 0
Figure 8

32
5.
4.0 4.
3.0 3.
2.0 2.
1 .o 1.
0.0 0.
-3.3 - 8.
AIRS T850 Episode 4 Lag: 2 8.0 NCEP T850 Episode 4 Lag: 2
5.
4.
3.
2.
1.
0.
-4. sow 60W 40W 2ow 0 80W 6W 4QW 2ow 0
Figure 9

33
0.40
0.1 5
0.10
CARMA AOT Episode 4 Lag: 0 40N
30N
20N 0.05
0.03
0.00
-0.08
1 ON
0.40
0.15
0.10
CARMA AOT Episode 4 Lag: 4 40N
30N
20N 0.0s
0.03
0.00
-0.1 3
1 ON
CARMA AOT Episode 4 Lag: 2 0.17
0.15
0.10
0.05
0.03
0.00
-0.09
0.40
0.15
0.10
0.05
0.03
0.00
-0.09
CARMA AOT Episode 4 Laq: 6
BOW 60W 40W 20w 0 8OW 60W 4ow 20w 0
Figure 10

34
4.5 MODIS AOT Episode 4 Lag: 2 4.5 MODIS AOT Episode 4 Lag: 0
1 .o 1 .o
0.5 0.5
0.3 0.3
0.2 0.2
0.0 0.0
-1.0 -1.1
1.7 MODIS AOT Episode 4 Lag: 6 1.9 MODIS AOT Episode 4 Lag: 4 40N
1 -0 1.0
0.5 0.5
20N 0.3 0.3
0.2 0.2
0.0 0.0
-1.0 -1.0
30N
1 ON
85% 60W 4ow 20w 0 BOW 60W *OW 20w 0
Figure 11


![PRINCIPLE COMPONENT ANALYSIS AND FUZZY … COMPONENT ANALYSIS AND FUZZY LOGIC BASED THROUGH WALL IMAGE ENHANCE- ... image fusion [22,23] and statical ... weight assignment using fuzzy](https://img.pdfslide.net/doc/110x75/5aaf62277f8b9aa8438d3a5f/principle-component-analysis-and-fuzzy-component-analysis-and-fuzzy-logic-based.jpg)