Embed Size (px)
Citation preview
Population and Community structureSpecies: a group of organisms which share the same characteristics and are capable of interbreedingPopulation: a group of organisms of the same species which live in the same habitat so that random interbreeding takes placeCommunity: all the plants and animals living in a defined areaEcosystem: the study of living things and their relationship to each other and to the environmentEcology: the study of living things and their relationship to each other and to the environmentEcological niche: the functional position of an organism in its environmentEnvironmental resistance: the combined effect of all the limiting factors that limit the growth of a populationLimiting factor: factors (density dependent or density independent) that limit the rate of population growth
l
Natality: the birth rate. It’s the production of new individuals by birth, hatching, germination or division.Mortality: the death rate. Immigration: the process that occurs when an organism enter a new place to settle permanentlyEmigration: the process that occurs when an organism leaves one place to go and live in another placeMigration: a group of birds, or other animals that are moving together from one region or country to another to avoid harsh environmental conditions.

Population size

Factors affecting population size

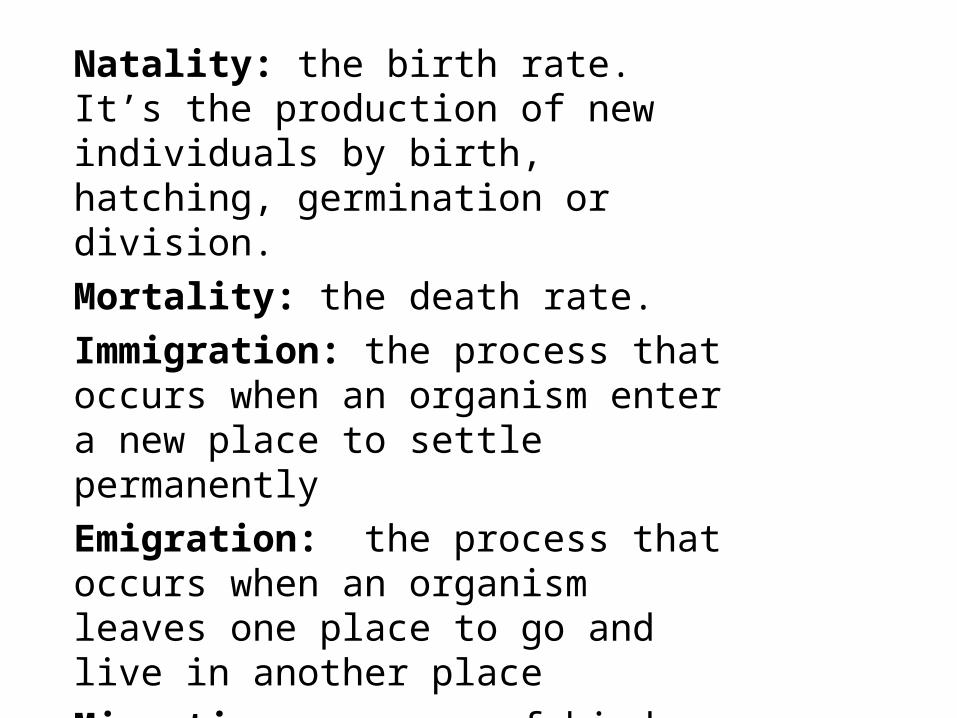
Migration of zebra and wildebeest in the Serengeti

Yearly migration of wildebeest in the Serengeti. Migration is most common amongst birds, mammals
and some insects (monarch butterflies)
Wildebeest migration: migration is a response to seasonal change. The function of migration is to keep
animals in a suitable environment throughout the year.

Migration of birds: If habitat quality declines, animals improve their chances of survival and reproduction by going elsewhere
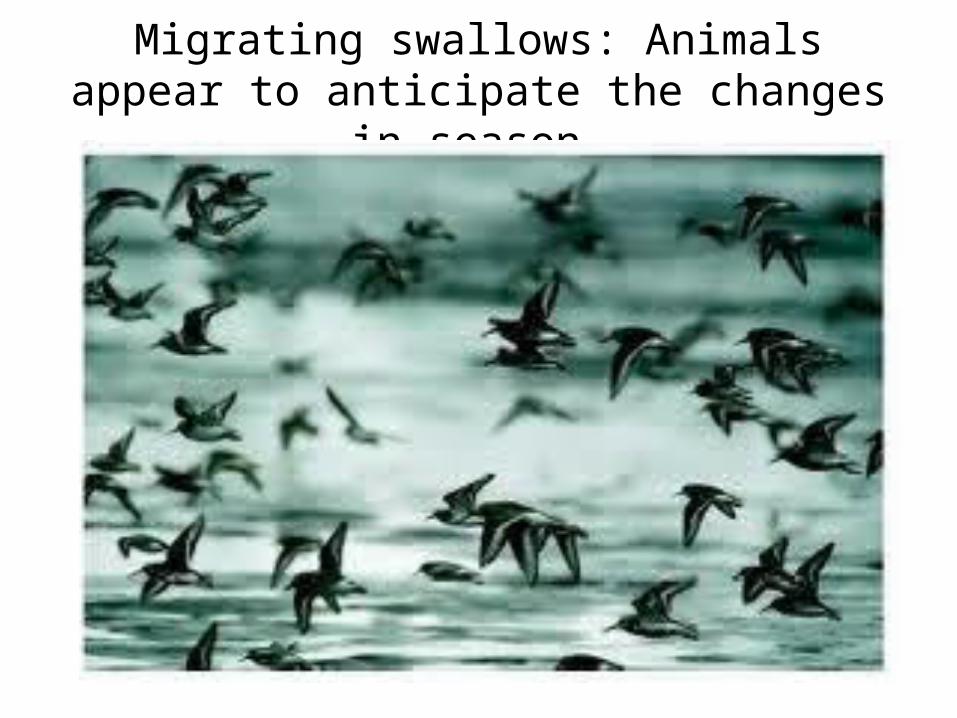
Migrating swallows: Animals appear to anticipate the changes in season.
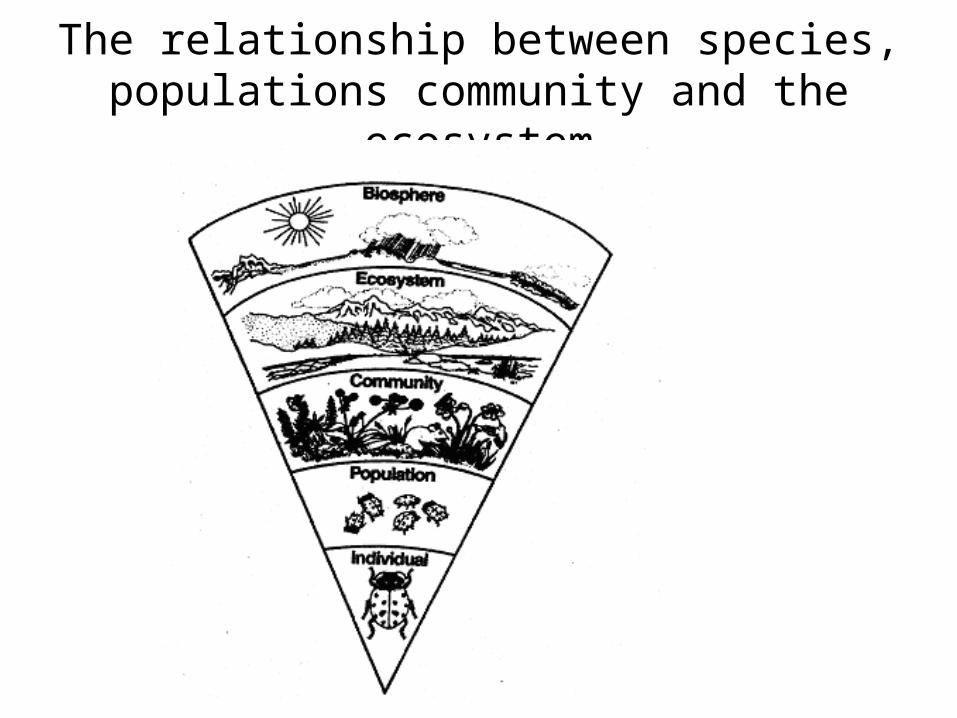
The relationship between species, populations community and the ecosystem
Carrying capacity is the maximum population size a certain environment can support for an extended period of time, for a population of a particular species.
Under ideal conditions, a population naturally increases until it overshoots the carrying capacity. At this point, the environment can no longer provide for the species, due to a number of different environmental resistances, including food, crowding, competition, etc. The population, due to lack of resources, will begin to die out, allowing the environment to recover. As the environment recovers, the species population is able to flourish once more. This leads to a fluctuation between the prosperity of the species and the prosperity of the environment (hence the fluctuations in the graph).

Carrying capacity
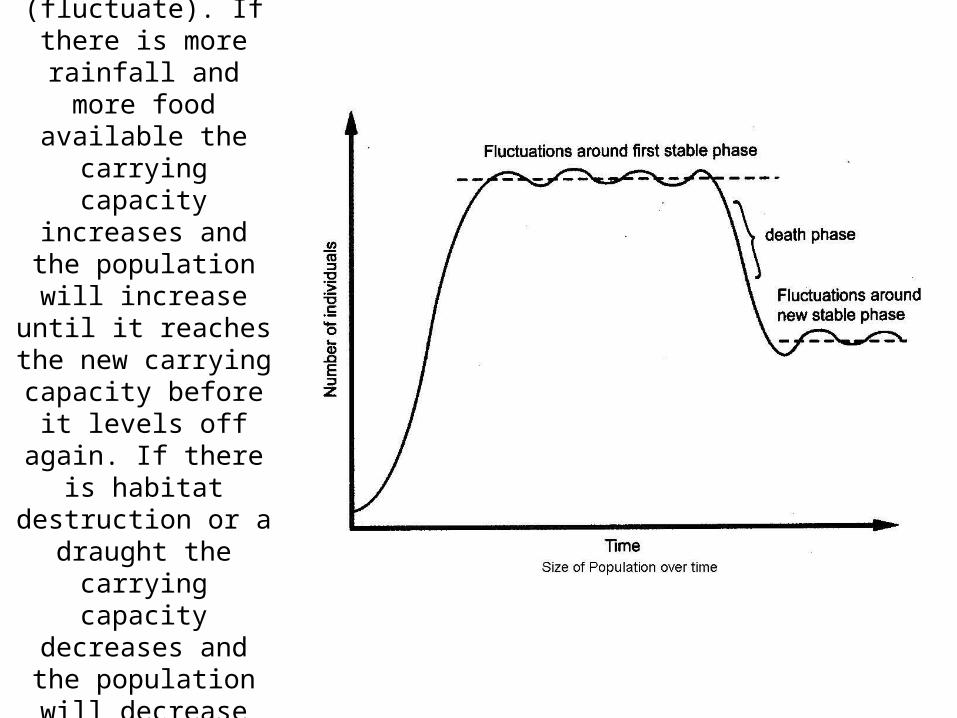
If a population reaches carrying capacity it can remain stable or move
up and down (fluctuate). If there is
more rainfall and more food available the carrying capacity increases and the
population will increase until it reaches the new carrying capacity before
it levels off again. If there is habitat
destruction or a draught the carrying capacity
decreases and the population will decrease until it reaches the new
carrying capacity and levels off again.
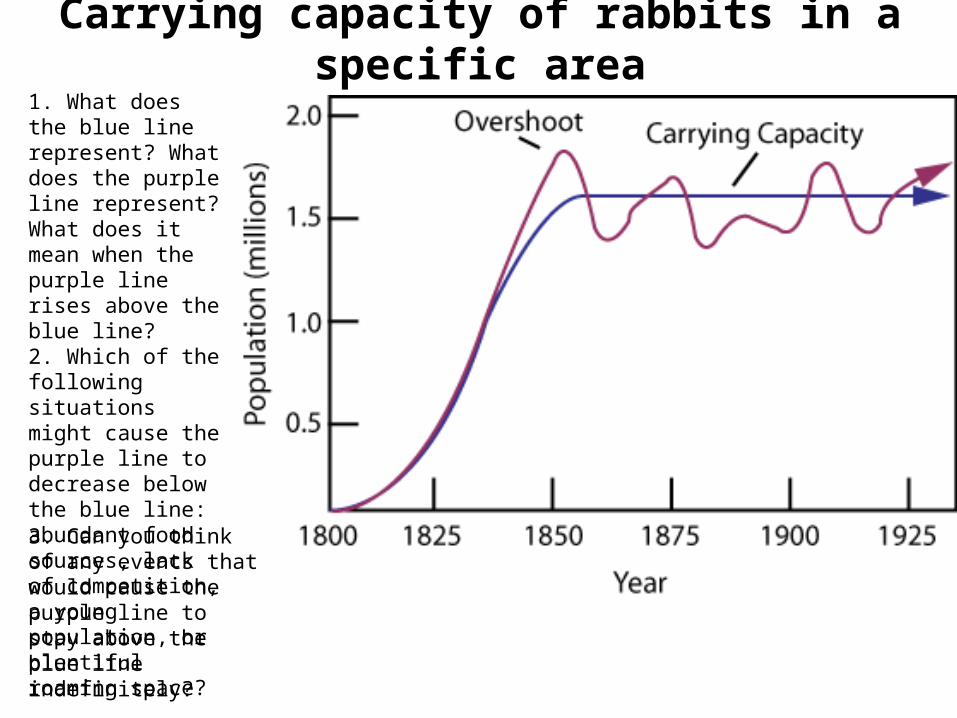
Carrying capacity of rabbits in a specific area1. What does the blue line represent? What does the purple line represent? What does it mean when the purple line rises above the blue line? 2. Which of the following situations might cause the purple line to decrease below the blue line: abundant food sources, lack of competition, a young population, or plentiful roaming space?
3. Can you think of any events that would cause the purple line to stay above the blue line indefinitely?
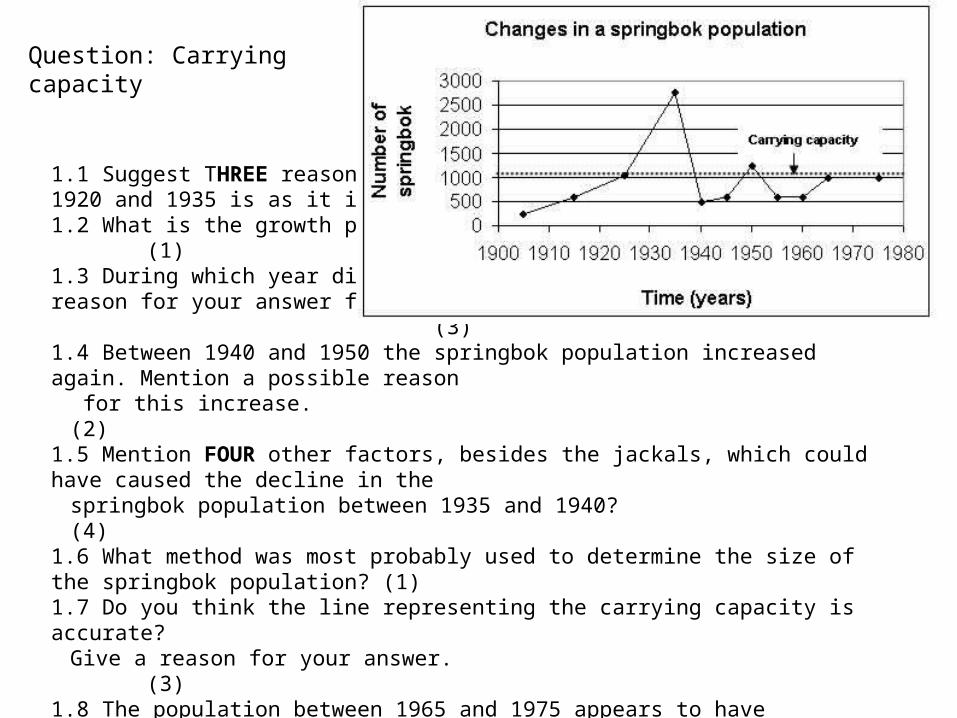
1.1 Suggest THREE reasons why the growth form between the period 1920 and 1935 is as it is.1.2 What is the growth phase called between 1910 and 1920? (1)1.3 During which year did the jackal enter the fenced area? Give a reason for your answer from
the information supplied. (3)1.4 Between 1940 and 1950 the springbok population increased again. Mention a possible reason
for this increase. (2)1.5 Mention FOUR other factors, besides the jackals, which could have caused the decline in the
springbok population between 1935 and 1940? (4)1.6 What method was most probably used to determine the size of the springbok population? (1)1.7 Do you think the line representing the carrying capacity is accurate?
Give a reason for your answer. (3)1.8 The population between 1965 and 1975 appears to have stabilised. Suggest how the farmer
might be controlling the population. (2)1.9 What do you notice about the growth from 1915 – 1925 and 1940 – 1950? (1)
(20)
Question: Carrying capacity
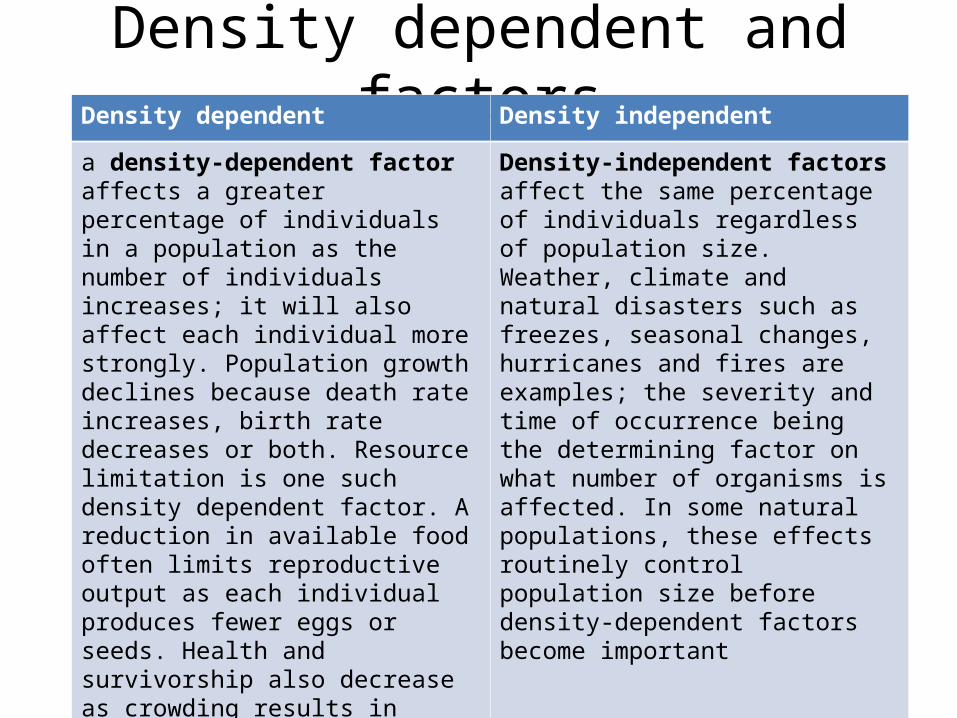
Density dependent and factors
Density dependent Density independent
a density-dependent factor affects a greater percentage of individuals in a population as the number of individuals increases; it will also affect each individual more strongly. Population growth declines because death rate increases, birth rate decreases or both. Resource limitation is one such density dependent factor. A reduction in available food often limits reproductive output as each individual produces fewer eggs or seeds. Health and survivorship also decrease as crowding results in smaller, less robust individuals. Many predators concentrate on a particular prey when its population density is high, taking a greater percentage than usual.
Density-independent factors affect the same percentage of individuals regardless of population size. Weather, climate and natural disasters such as freezes, seasonal changes, hurricanes and fires are examples; the severity and time of occurrence being the determining factor on what number of organisms is affected. In some natural populations, these effects routinely control population size before density-dependent factors become important
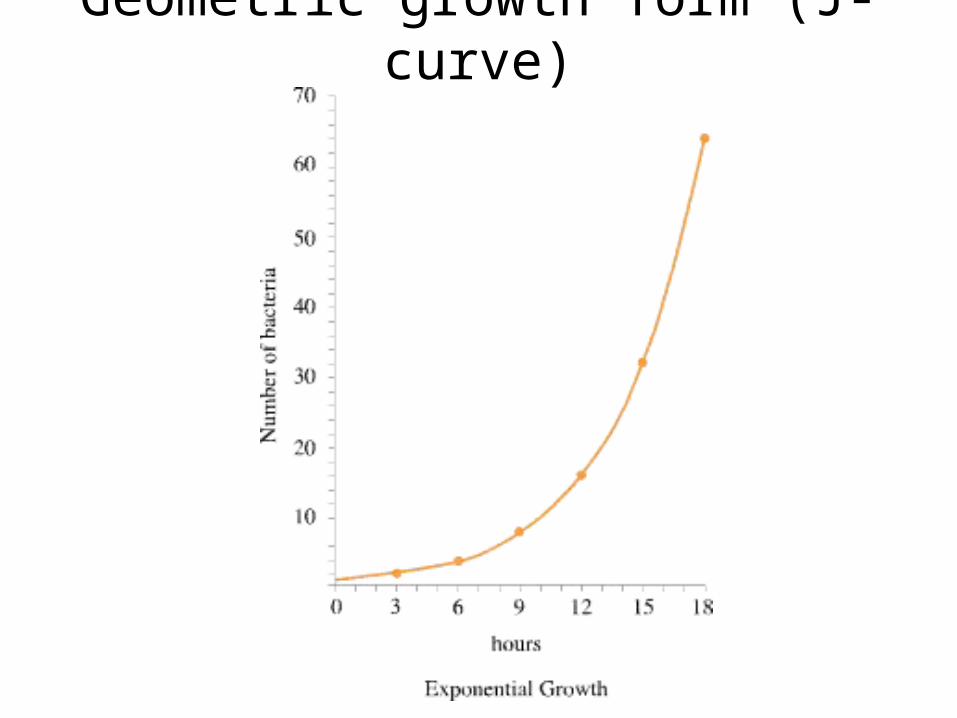
Geometric growth form (J- curve)

Logistic growth form (S-shaped curve)
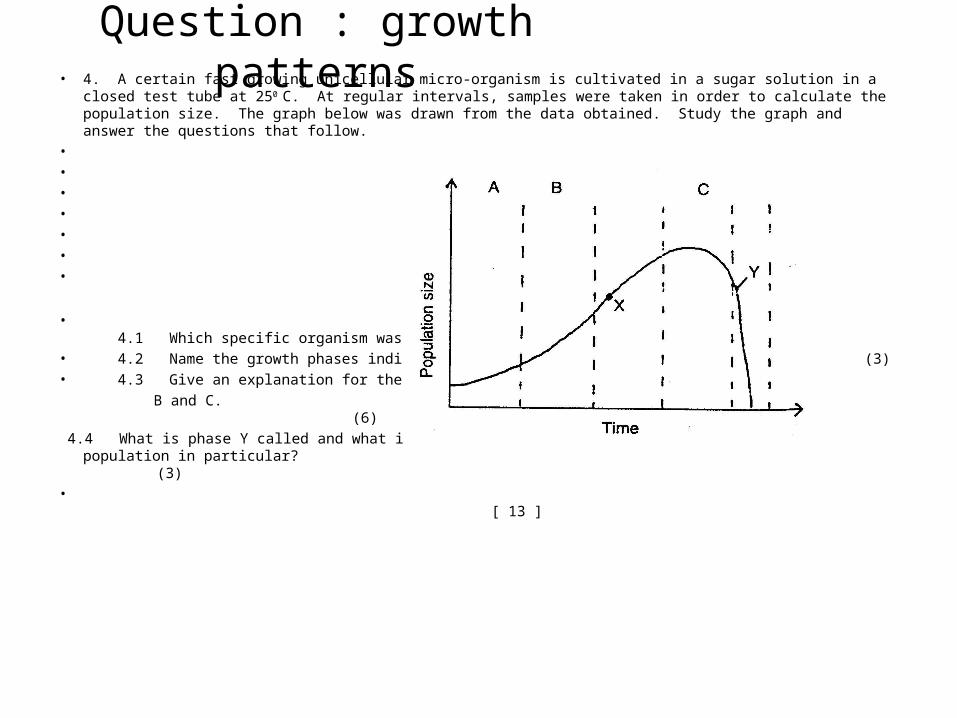
Question : growth patterns• 4. A certain fast growing unicellular micro-organism is cultivated in a sugar solution in a closed test tube at
250 C. At regular intervals, samples were taken in order to calculate the population size. The graph below was drawn from the data obtained. Study the graph and answer the questions that follow.
• • • • • • •
• 4.1 Which specific organism was most probably cultivated in the test tube? (1)
• 4.2 Name the growth phases indicated by A, B and C respectively. (3)• 4.3 Give an explanation for the specific growth pattern of each of the phases A, B and C. (6) 4.4 What is phase Y called and what is the possible cause, thereof, for this specific population in particular?
(3)• [ 13 ]
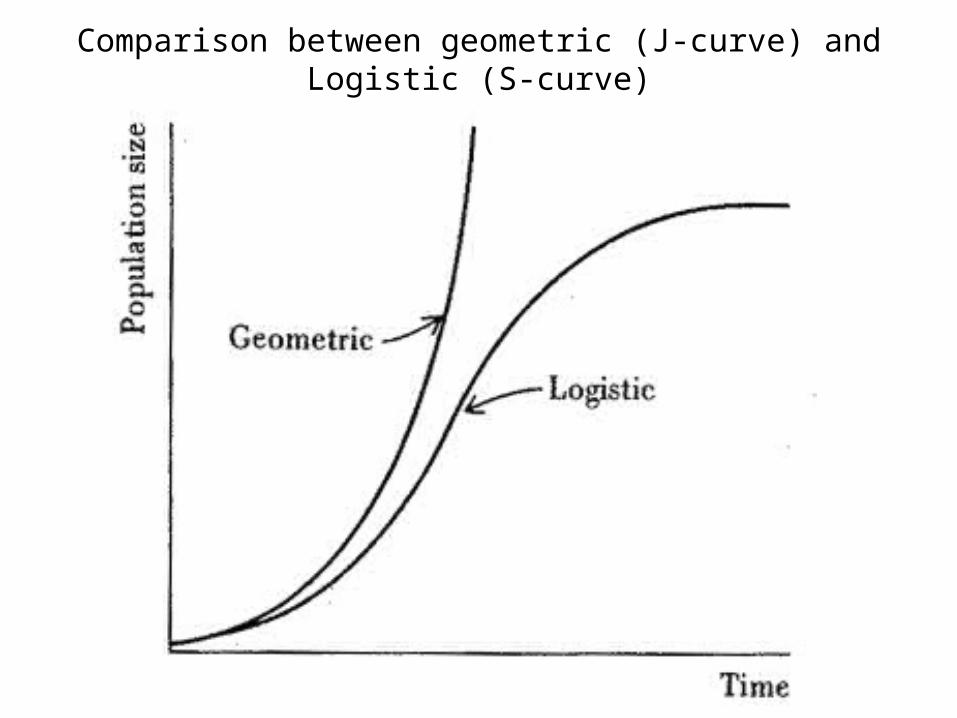
Comparison between geometric (J-curve) and Logistic (S-curve)

Methods to determine population size1. Direct method: census
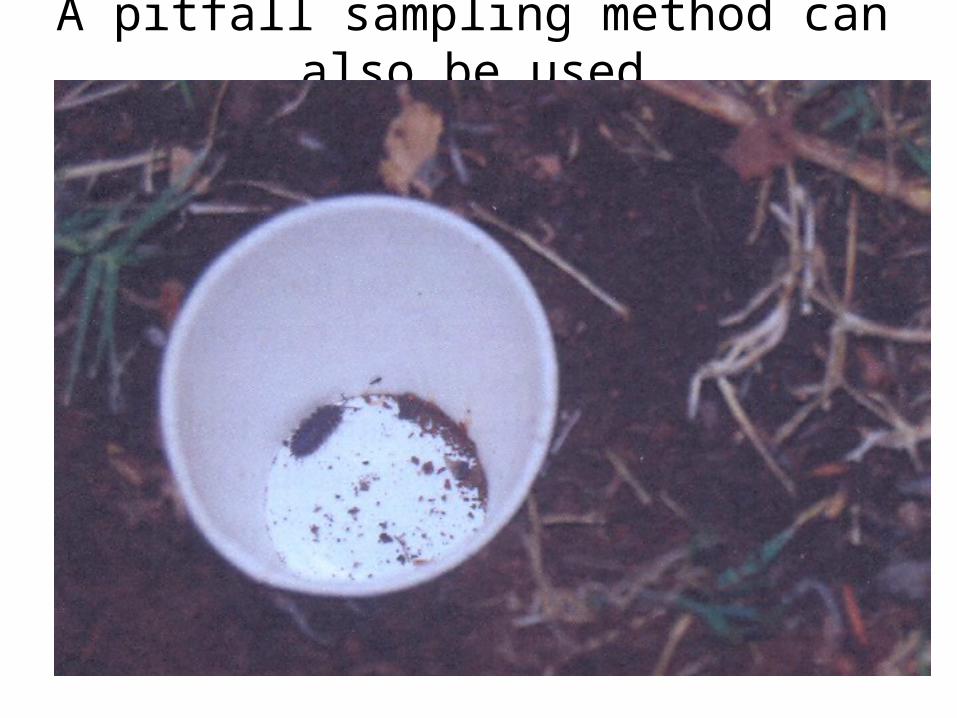
A pitfall sampling method can also be used

Methods to determine population size2. Indirect method: simple sampling
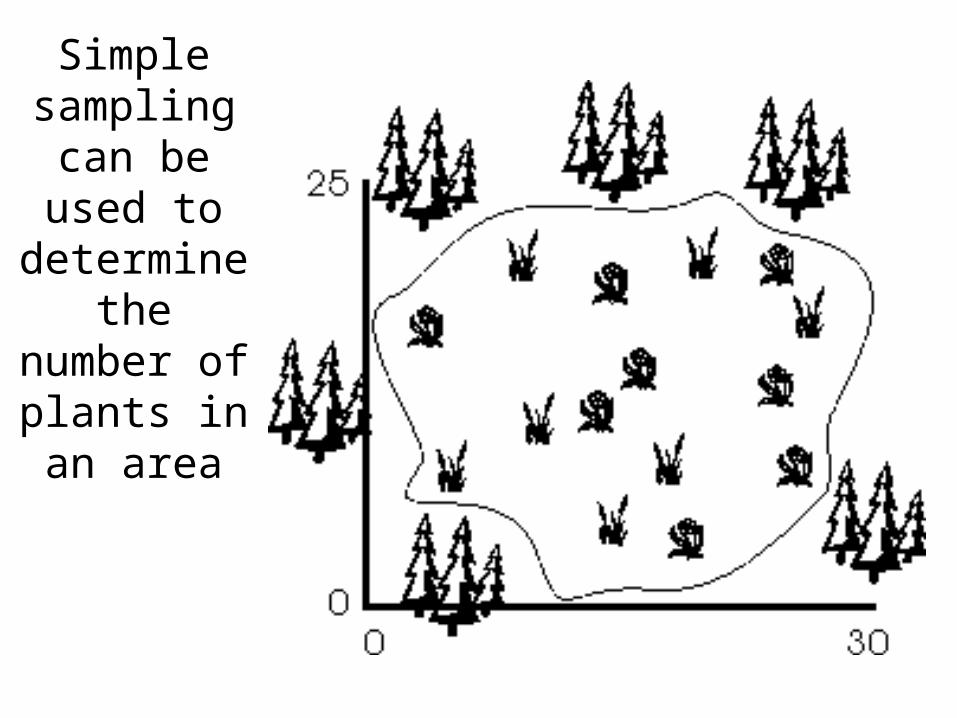
Simple sampling can
be used to determine the
number of plants in an
area
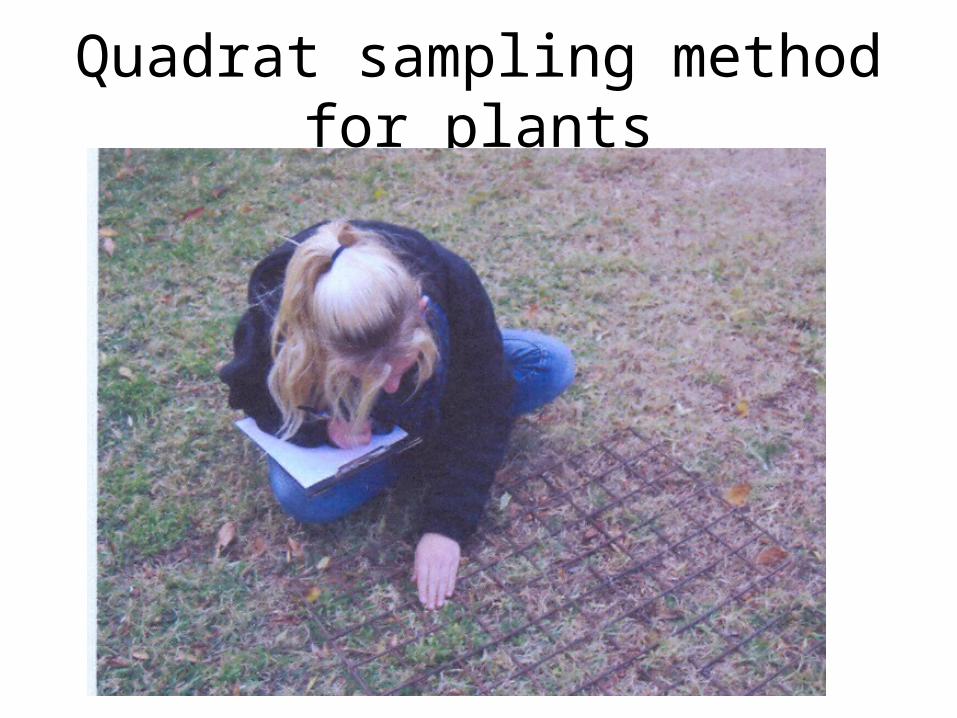
Quadrat sampling method for plants

In simple sampling a physical count of all the animals/plants under investigation in a small sample are of the habitat is done. The total population in the big area is calculated as follows: Estimate number of = number of individuals in sample x habitat sizeindividuals in the __________________________population sample size

Activity 1: simple samplingMethod
Mix an unknown number of tiny beads with sea sand thoroughly to fill a 500 ml jar.
Remove a level teaspoon (5 ml) of the mixture from the jar.
Spread the mixture on a saucer and count the number of beads.
Use the formula below to estimate the total number of beads in the bottle :
Total nr. of beads = nr. of beads in sample x total volume of mixture (500 ml)
____________________________
volume of teaspoon (5ml)
Place the bead and sea sand mixture back into the jar.
Mix thoroughly and repeat the exercise a few more times.
Obtain an average estimate of the number of beads in the jar
Results
Complete the table :-
Questions
1.Why is it necessary to repeat the
investigation a number of times?
2. How is this investigation limited?
Investigation Total population
1
2
3
4
5
Ave estimate of beads/jar
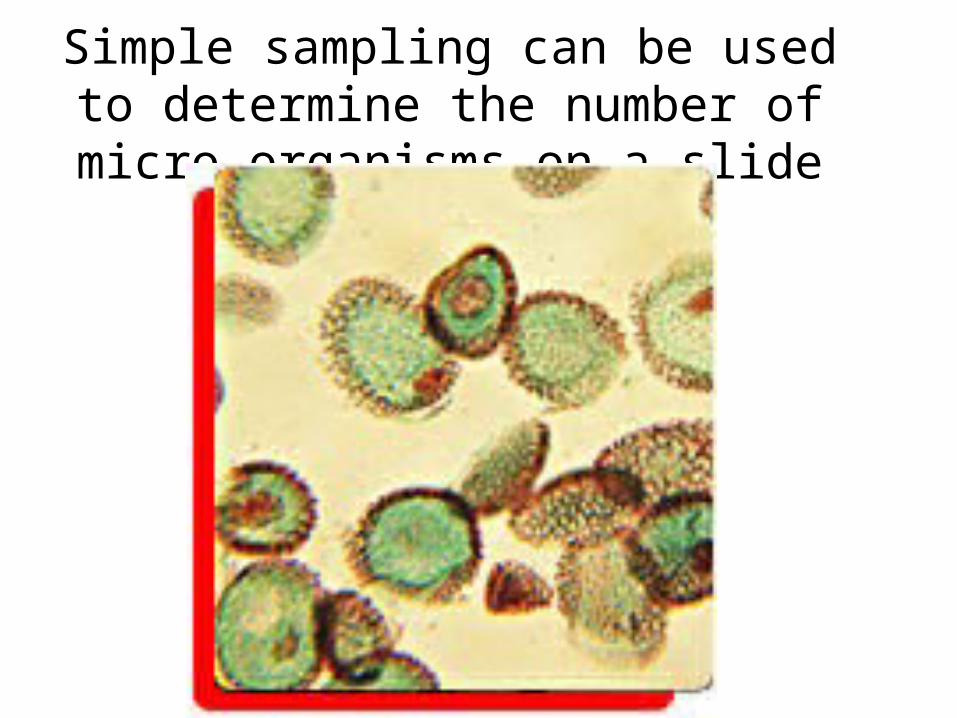
Simple sampling can be used to determine the number of micro organisms on a slide

A leading Kwa-Zulu entomologist ( a person that studies insects ) decided to work out the number of worms that occurred in Kwa-Mashu. The total area in Kwa Mashu where the worms occurred was 2000 m2. He chose five 10 m2 plots and found 120, 100, 150, 130 and 100 worms in each plot respectively. (i) Estimate the total number of worms in the Kwa-Mashu area. (Show ALL calculations). (5) (ii) Describe two ways how the entomologist could improve the reliability of these results. (2)
(7)
Question : Simple sampling
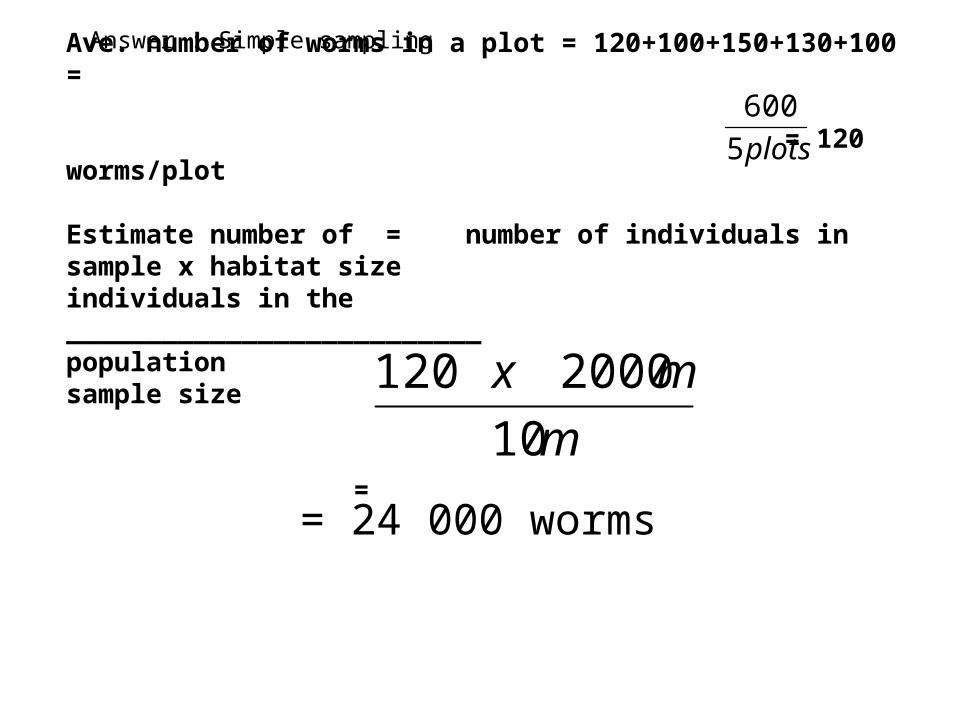
Ave. number of worms in a plot = 120+100+150+130+100 =
= 120 worms/plot
Estimate number of = number of individuals in sample x habitat sizeindividuals in the __________________________population sample size
=
plots5
600
m
mx
10
2000120
= 24 000 worms
Answer : Simple sampling

Methods to determine population size2. Indirect method: mark recapture
A number of animals are caught and marked

In theory, mark / recapture techniques involve sampling a population of animals and then marking all of the individuals captured in a recognizable way. The
marked animals are then released back into the population and left to mingle for a suitable period of time. Once they have become thoroughly mixed into the population again, the population is re-sampled.The assumption is then made that the proportion of marked animals in the second sample is the same as
the proportion of marked animals to non-marked within the whole population. Enough time must be
allowed to elapse for complete mixing to have occurred.
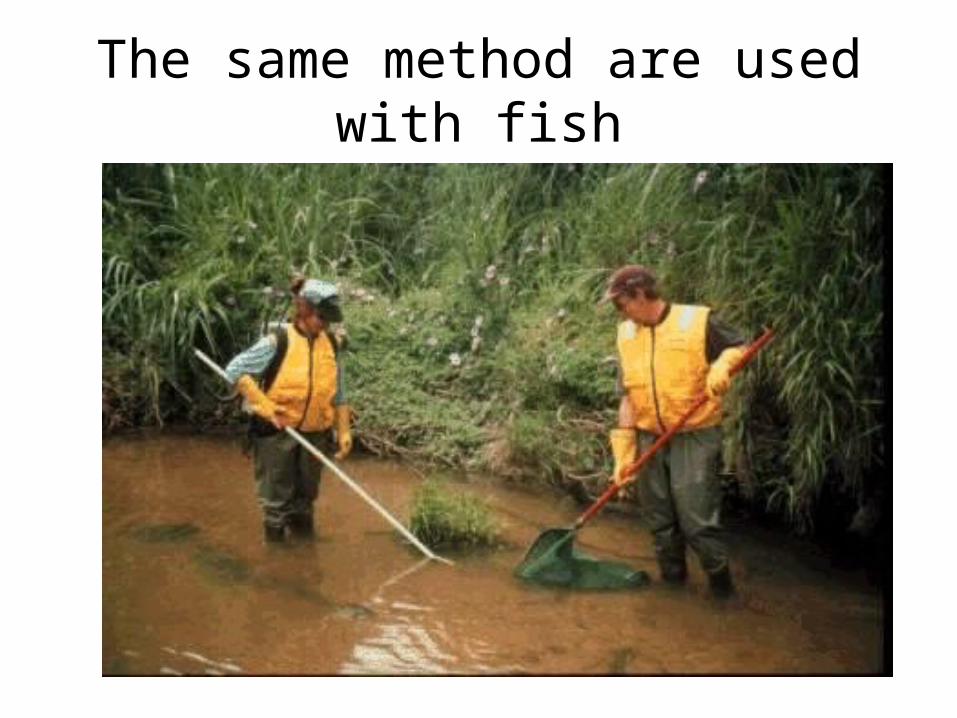
The same method are used with fish
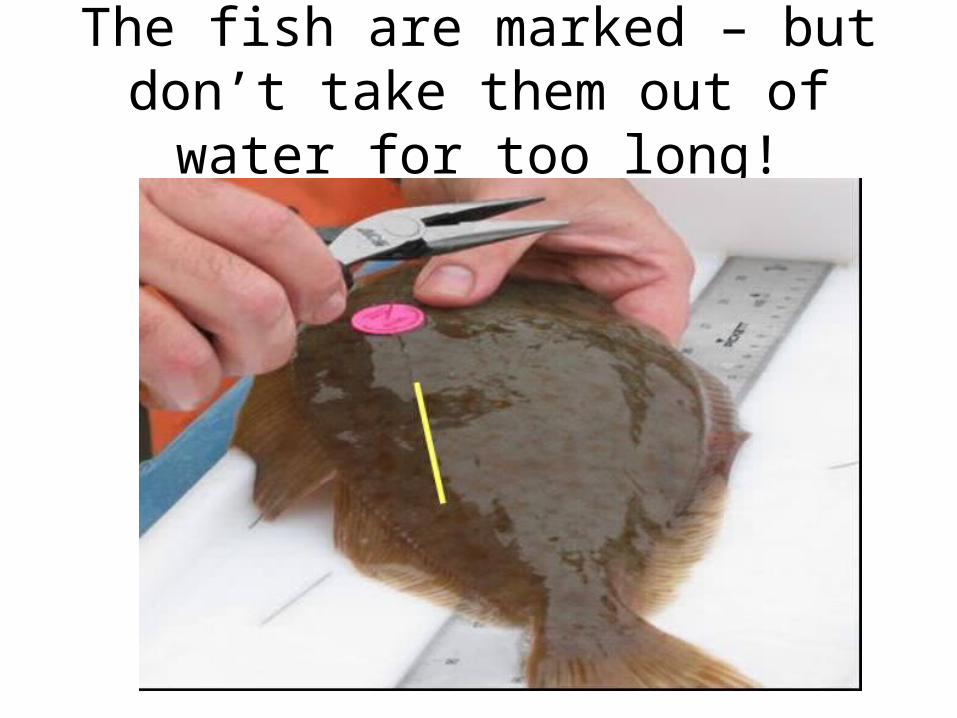
The fish are marked – but don’t take them out of water for too long!
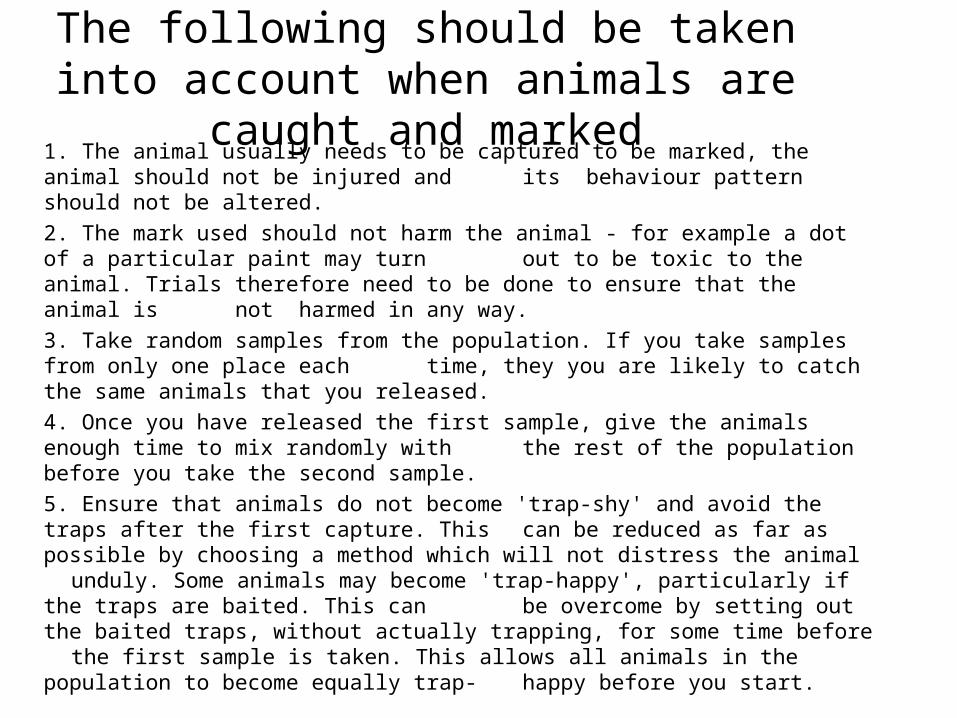
The following should be taken into account when animals are caught and marked
1. The animal usually needs to be captured to be marked, the animal should not be injured and its behaviour pattern should not be altered.
2. The mark used should not harm the animal - for example a dot of a particular paint may turn out to be toxic to the animal. Trials therefore need to be done to ensure that the animal is not harmed in any way.
3. Take random samples from the population. If you take samples from only one place each time, they you are likely to catch the same animals that you released.
4. Once you have released the first sample, give the animals enough time to mix randomly with the rest of the population before you take the second sample.
5. Ensure that animals do not become 'trap-shy' and avoid the traps after the first capture. This can be reduced as far as possible by choosing a method which will not distress the animal unduly. Some animals may become 'trap-happy', particularly if the traps are baited. This can be overcome by setting out the baited traps, without actually trapping, for some time before the first sample is taken. This allows all animals in the population to become equally trap-happy before you start.
Trap-shyness results in population overestimates, while trap-happiness results in population underestimation

They are released back into the water and some are caught again after a period of time
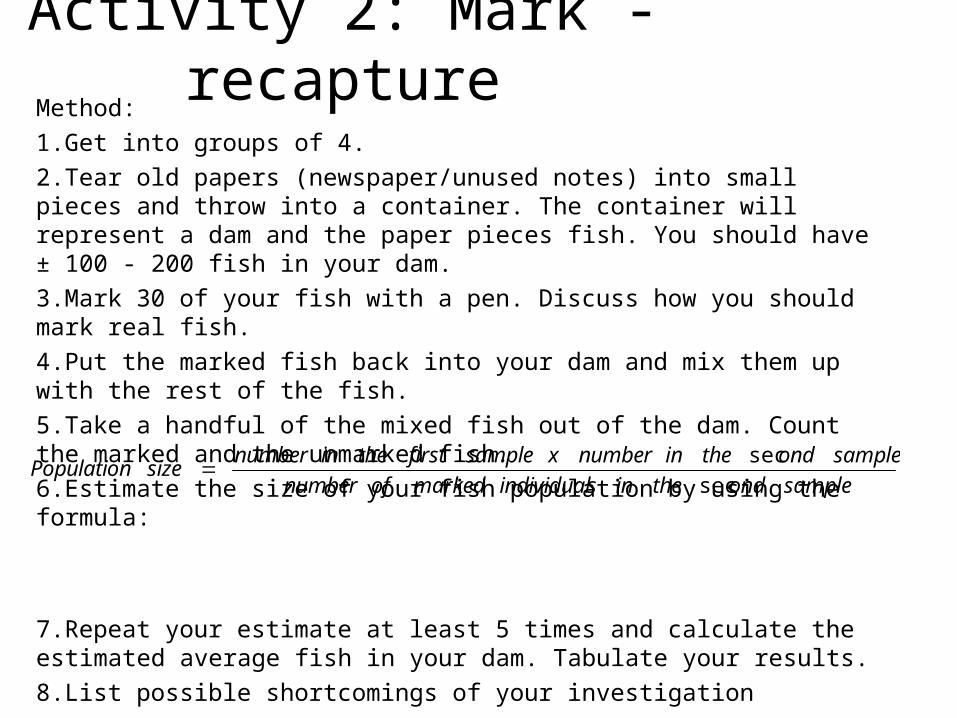
Activity 2: Mark -recaptureMethod:
1.Get into groups of 4.
2.Tear old papers (newspaper/unused notes) into small pieces and throw into a container. The container will represent a dam and the paper pieces fish. You should have ± 100 - 200 fish in your dam.
3.Mark 30 of your fish with a pen. Discuss how you should mark real fish.
4.Put the marked fish back into your dam and mix them up with the rest of the fish.
5.Take a handful of the mixed fish out of the dam. Count the marked and the unmarked fish.
6.Estimate the size of your fish population by using the formula:
7.Repeat your estimate at least 5 times and calculate the estimated average fish in your dam. Tabulate your results.
8.List possible shortcomings of your investigation
sampleondtheinsindividualmarkedofnumber
sampleondtheinnumberxsamplefirsttheinnumbersizePopulation
sec
sec