Embed Size (px)
Citation preview
Population Ecology
Chapter 40
Population Ecology
• Certain ecological principles govern the
growth and sustainability of all
populations
• Human populations are no exception
Limits to Growth
• A population’s growth depends on the
resources of its environment
• Deer introduced to Angel Island
– Population outstripped resources
Human Population Problems
• Over 6 billion people alive
• About 2 billion live in poverty
• Most resources are consumed by the
relatively few people in developed
countries
Population
• A group of individuals of the same
species occupying a given area
• Can be described by demographics
– Vital statistics such as size, density,
distribution, and age structure
Population Age Structure
• Divide population into age categories
• Population’s reproductive base includes
members of the reproductive and pre-
reproductive age categories
Changes in Population Size
• Immigration adds individuals
• Emigration subtracts individuals
• Births add individuals
• Deaths subtract individuals
Zero Population Growth
• Interval in which number of births is
balanced by number of deaths
• Assume no change as a result of
migration
• Population size remains stable
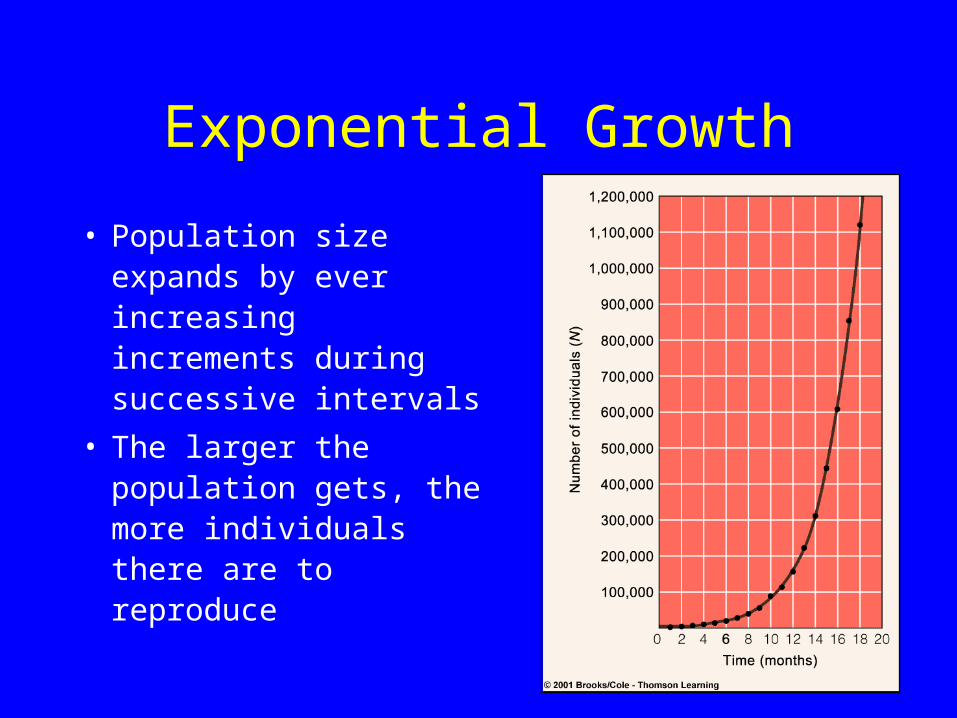
Exponential Growth
• Population size expands by ever increasing increments during successive intervals
• The larger the population gets, the more individuals there are to reproduce
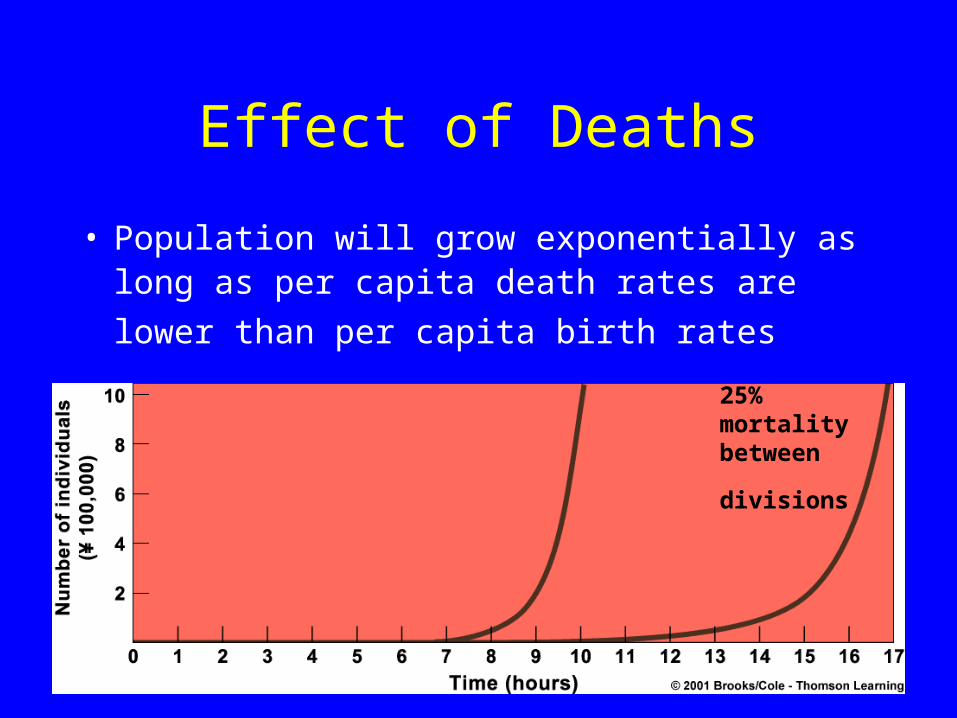
Effect of Deaths
• Population will grow exponentially as long as per capita death rates are lower than per capita birth
rates 25% mortality between
divisions

Biotic Potential
• Maximum rate of increase per individual
under ideal conditions
• Varies between species
• In nature, biotic potential is rarely
reached
Limiting Factors
• Any essential resource that is in
short supply
• All limiting factors acting on a
population dictate sustainable
population size
Carrying Capacity
• Maximum number of individuals that
can be sustained in a particular habitat
• Logistic growth occurs when population
size is limited by carrying capacity

Logistic Growth
• As size of the population increases, rate of reproduction decreases
• When the population reaches carrying capacity, population growth ceases
carrying capacity
Time
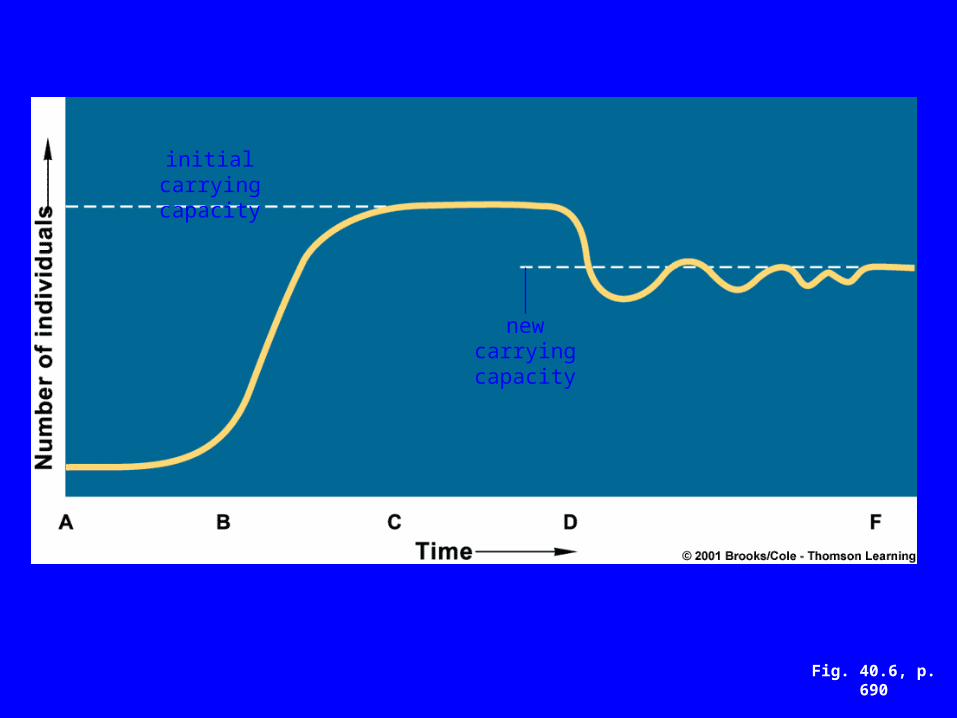
Fig. 40.6, p. 690
initial carrying capacity
new carrying capacity
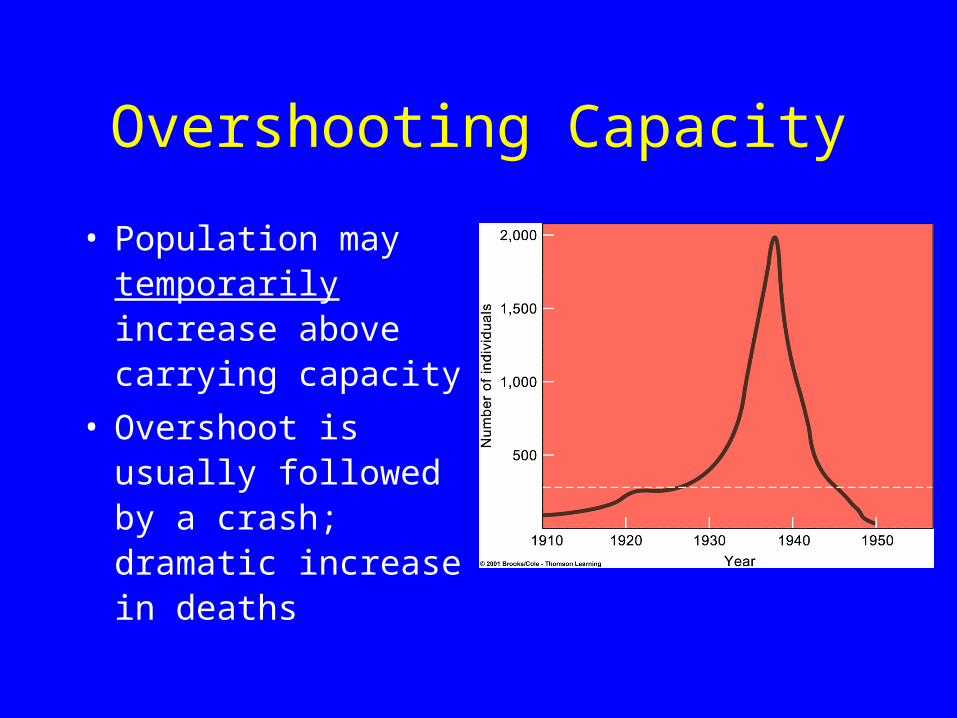
Overshooting Capacity
• Population may temporarily increase above carrying capacity
• Overshoot is usually followed by a crash; dramatic increase in deaths
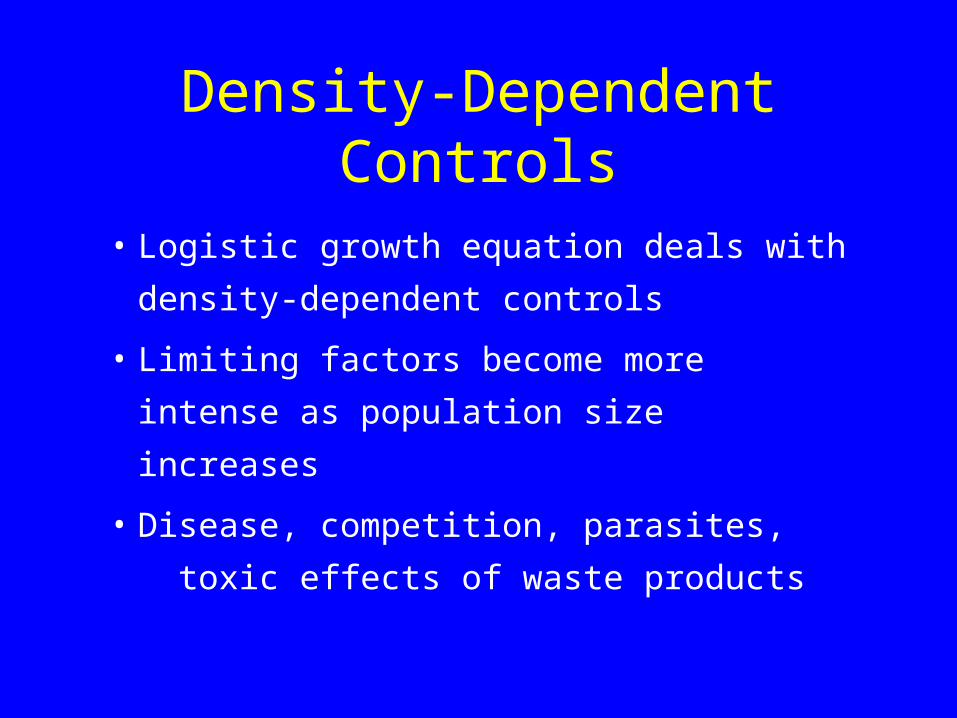
Density-Dependent Controls
• Logistic growth equation deals with
density-dependent controls
• Limiting factors become more
intense as population size increases
• Disease, competition, parasites,
toxic effects of waste products
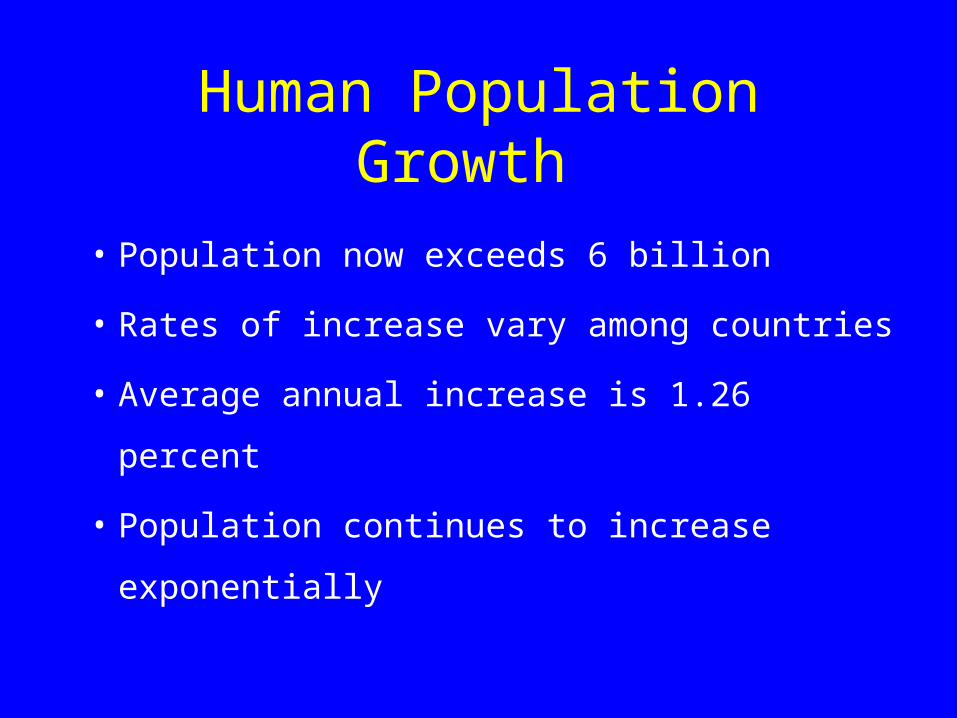
Human Population Growth
• Population now exceeds 6 billion
• Rates of increase vary among countries
• Average annual increase is 1.26 percent
• Population continues to increase
exponentially
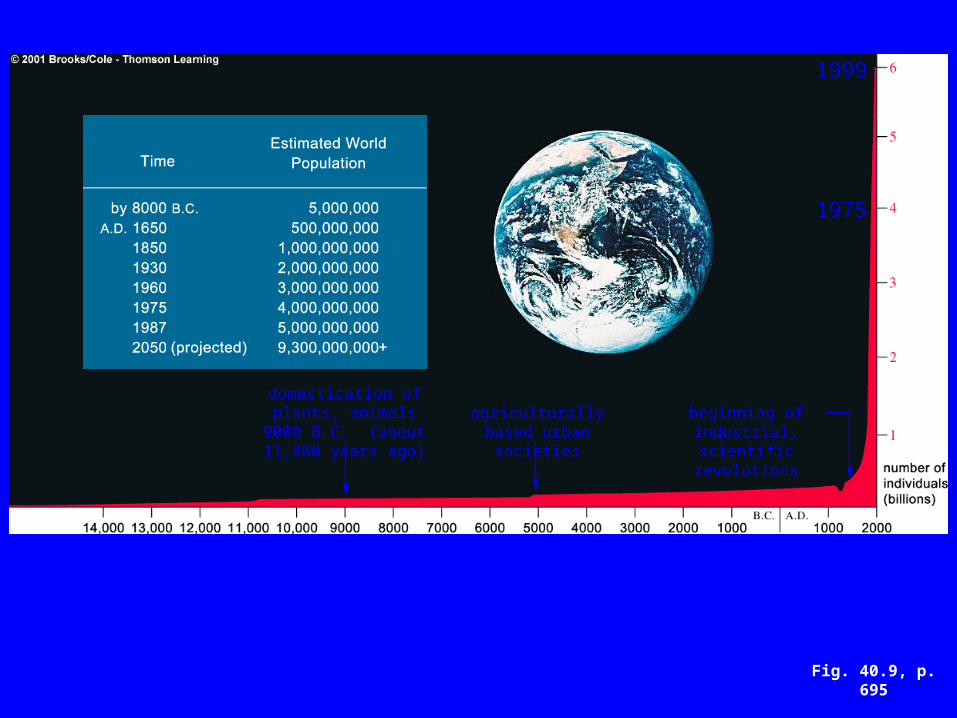
1999
1975
domestication of plants, animals 9000 B.C. (about
11,000 years ago)agriculturally based
urban societiesbeginning of industrial, scientific revolutions
Fig. 40.9, p. 695
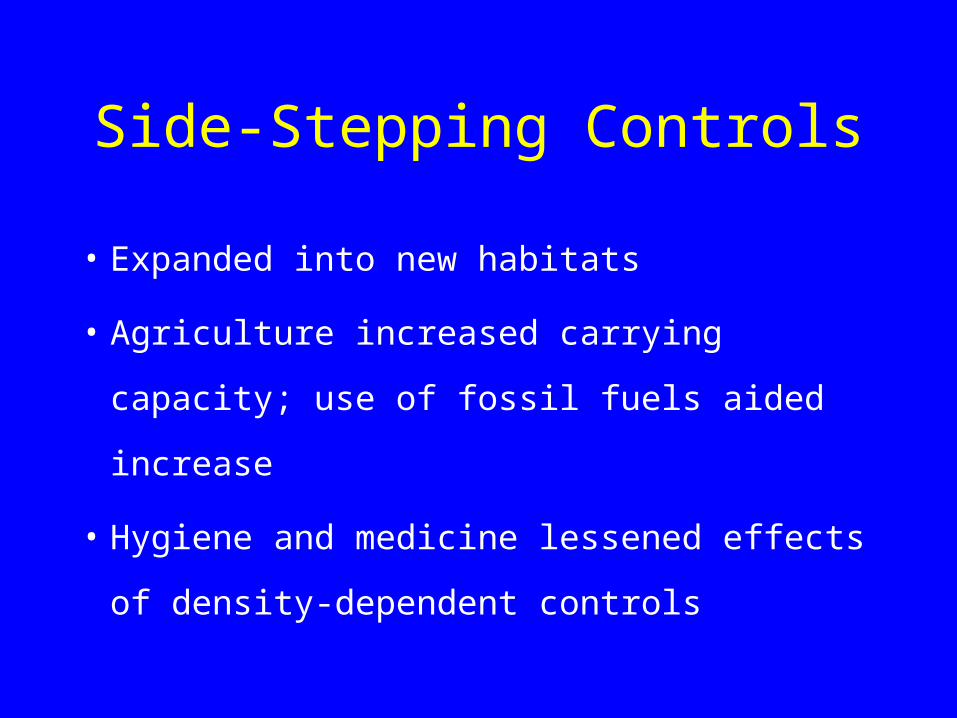
Side-Stepping Controls
• Expanded into new habitats
• Agriculture increased carrying capacity;
use of fossil fuels aided increase
• Hygiene and medicine lessened effects
of density-dependent controls
Future Growth
• Exponential growth cannot continue
forever
• Breakthroughs in technology may
further increase carrying capacity
• Eventually, density-dependent factors
will slow growth
Fertility Rates
• Worldwide, average annual rate of
increase is 1.26%
• Total fertility rate (TFR) is average
number of children born to a woman
• Highest in developing countries, lowest
in developed countries
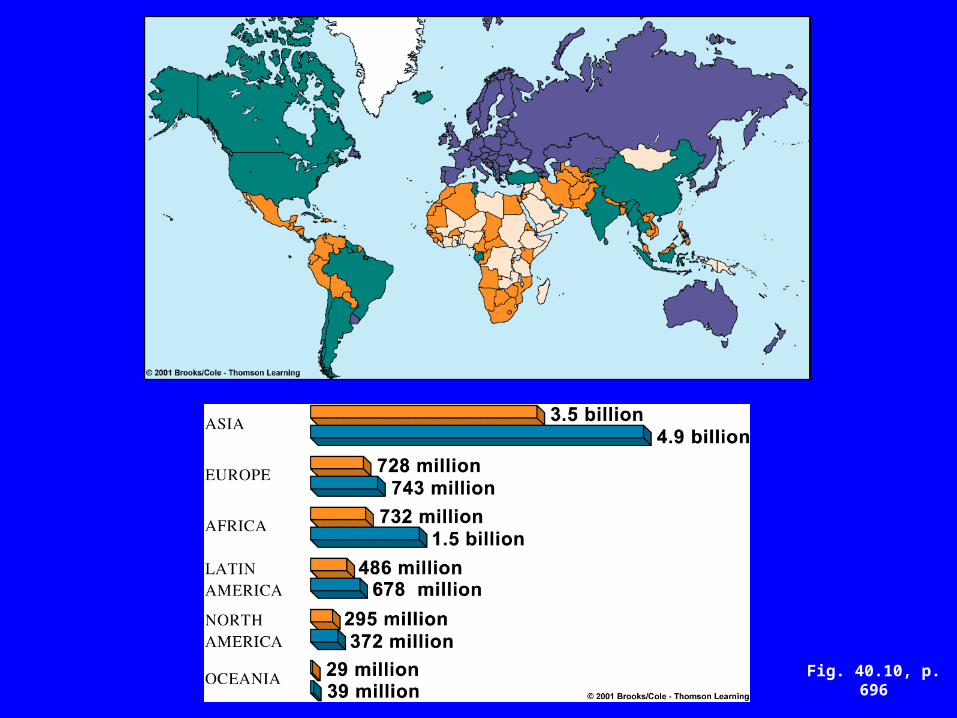
Fig. 40.10, p. 696
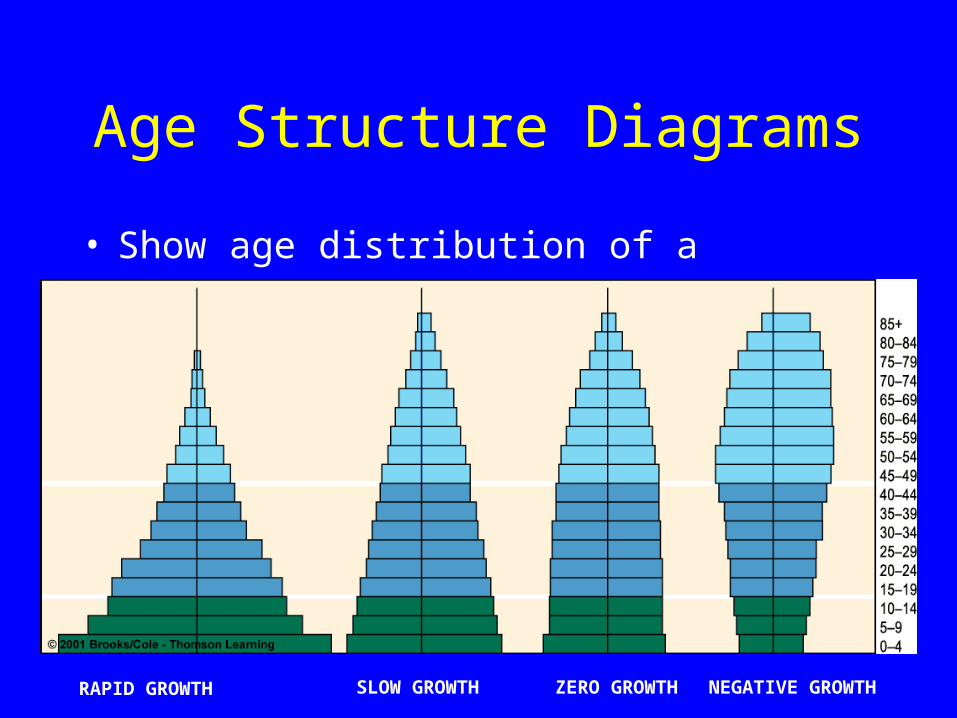
Age Structure Diagrams
• Show age distribution of a population
RAPID GROWTH SLOW GROWTH ZERO GROWTH NEGATIVE GROWTH
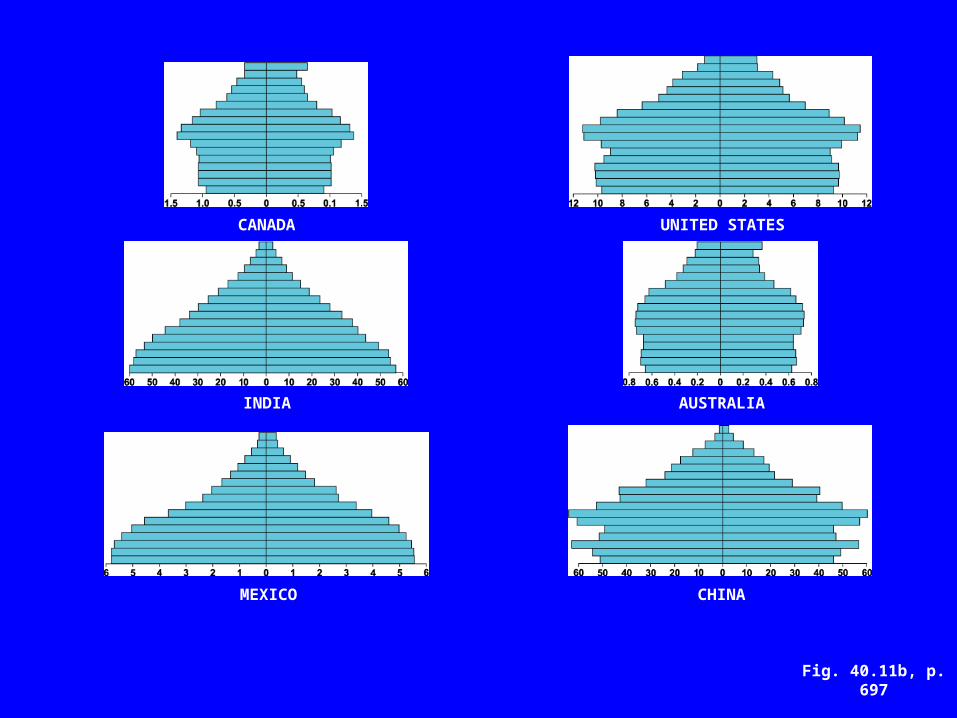
Fig. 40.11b, p. 697
CANADA UNITED STATES
INDIA AUSTRALIA
MEXICO CHINA
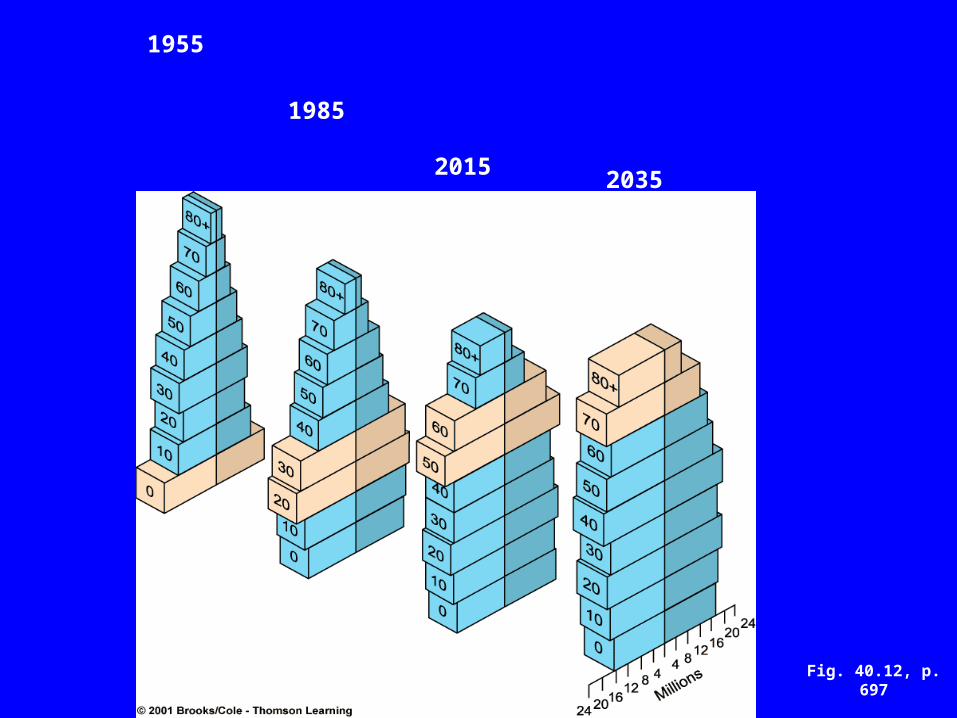
Fig. 40.12, p. 697
1955
1985
2015 2035
Population Momentum
• Lowering fertility rates cannot immediately slow population growth rate
• Why? There are already many future parents alive
• If every couple had just two children, population would still keep growing for another 60 years

Slowing Growth in China
• World’s most extensive family planning
program
• Government rewards small family size,
penalizes larger families, provides free
birth control, abortion, sterilization
• Since 1972, TFR down to 1.8 from 5.7
Effects of Economic Development
• Total fertility rates (TFRs) are highest in
developing countries, lowest in
developed countries
• When individuals are economically
secure, they are under less pressure to
have large families
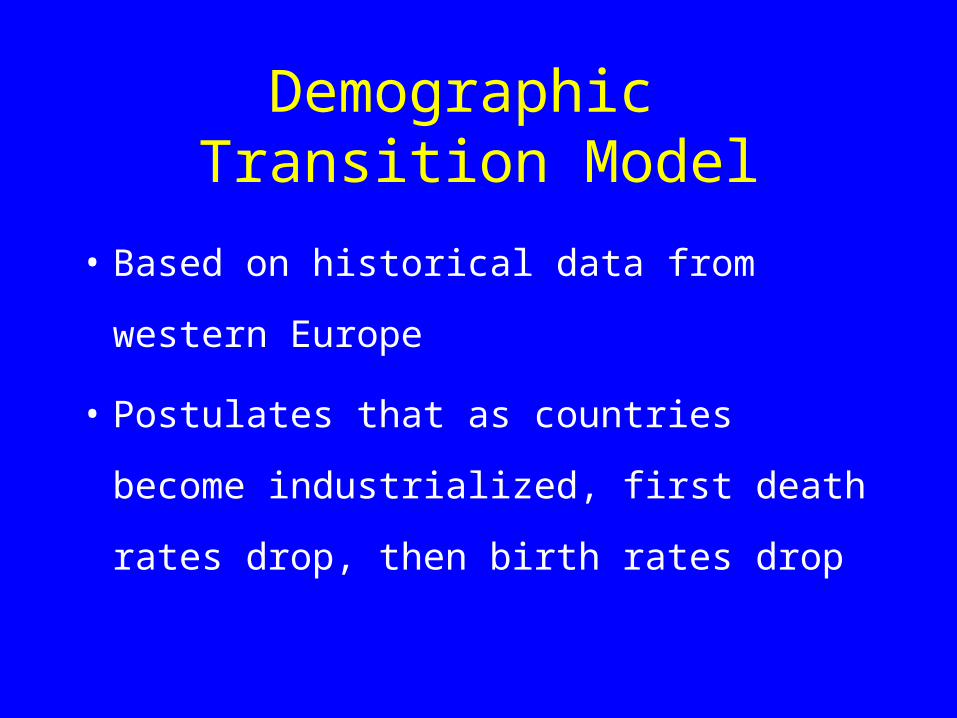
Demographic Transition Model
• Based on historical data from western
Europe
• Postulates that as countries become
industrialized, first death rates drop,
then birth rates drop
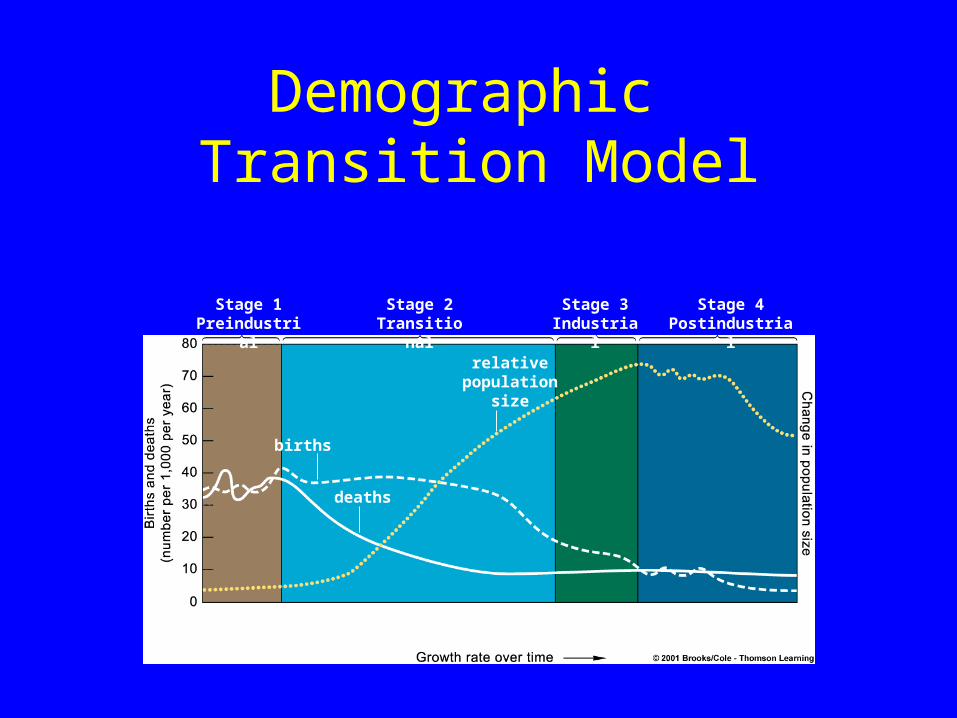
Demographic Transition Model
Stage 1 Preindustrial
Stage 2 Transitional
Stage 3 Industrial
Stage 4 Postindustrial
births
deaths
relative population
size
low increasing very high decreasing low zero negative
Resource Consumption
• United States has 4.7 percent of the world’s population
• Americans have a disproportionately large effect on the world’s resources
• Per capita, Americans consume more resources and create more pollution than citizens of less developed nations
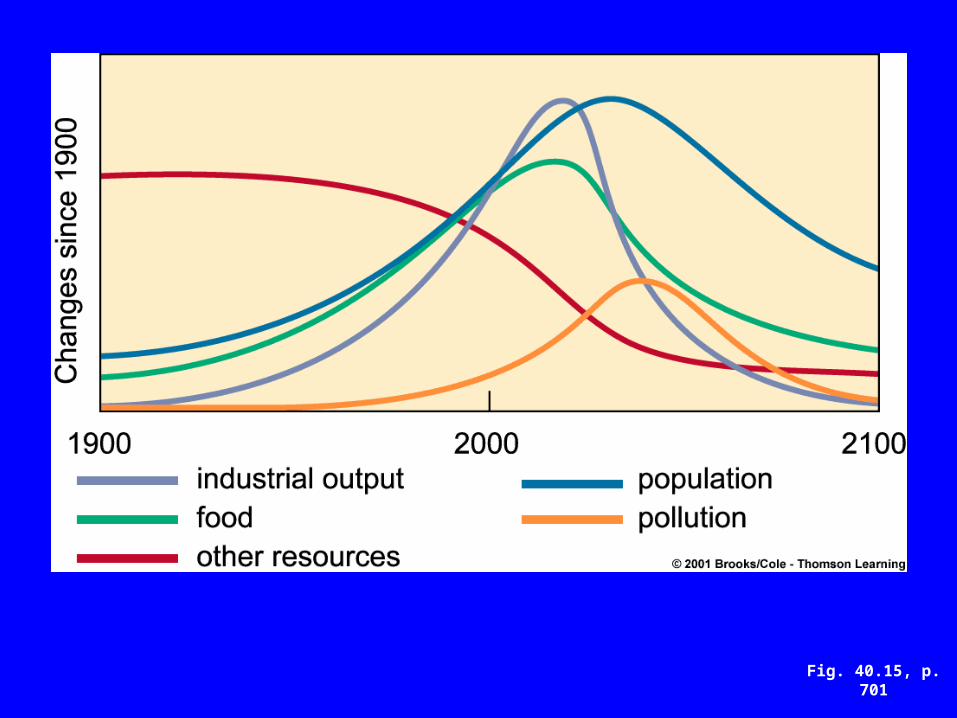
Fig. 40.15, p. 701