Embed Size (px)
Citation preview

WWW.CT.GOV/DPH/POPULATIONDATA
CT Dept Public Health, Health Statistics & Surveillance, Statistics Analysis & Reporting v11/2016 p. 1
Population Estimates for ConnecticutPrepared by Karyn Backus and Lloyd Mueller
CT Department of Public Health
Introduction
If you asked three people to find the population of your town for a given year, you wouldprobably expect that each person would report back the same number. After all, thereis only one actual population count for your town for a given year, you might think.Instead, each person reported back with a different number!
Welcome to Population Estimates. With this document, I strive to educate you on howpopulation estimates are derived. This complexity can result in different numbers forthe same point in time. The complexity also means that one dataset may be a better fitfor your project than another. Understanding the differences between the variouspopulation estimates will allow you to choose the population dataset that is mostappropriate for your needs.
Before moving on, it is important to convey that population numbers are ALWAYSestimates. Since it is impossible to count each and every person in the United Statesat a single point in time, the population data available to us are always an estimate ofthe true population. By its very nature, estimation is an inexact science and theoutcome of the estimate is dependent on the methods that were applied to create theestimate. No one knows the actual true count of the population at any given time, butseveral estimation methods have been developed in order to provide to us a reasonableapproximation of the actual count. These multiple methodologies lead to multiplepopulation estimates for the same population which leads to three people providing adifferent count for the same town and year. None of these three persons are wrong perse, but how you will be using the population estimates may dictate that one estimate ismore appropriate than another.
In Public Health, populations as a whole are of limited interest. Drilling down to identifypopulation subsets based on age, sex, race and/or Hispanic ethnicity are often asignificant component of our evaluations. When choosing a dataset, the methodologyused is important to consider, yet the level of demographic breakdown can be thedefining factor in which estimate is ultimately chosen. These interests can becompeting as one dataset may be more accurate but fails to provide the necessary levelof detail (e.g., age*sex breakdown). The necessity of an age*sex breakdown may leadyou to use a less accurate estimate in order to meet the demographic demands of yourproject.
In the next few pages, I briefly review the various population estimates datasets that areutilized by the CT Department of Public Health. All of the population estimates originatefrom the United States Census Bureau (USCB). The decennial census is thefoundation for all of the estimation methods. After the decennial census, the USCB

WWW.CT.GOV/DPH/POPULATIONDATA
CT Dept Public Health, Health Statistics & Surveillance, Statistics Analysis & Reporting v11/2016 p. 2
provides annual estimates of the population. The National Center for Health Statistics(NCHS) provides modified versions of the USCB’s annual estimates. Once anotherdecennial census is completed, the USCB publishes revisions to the annual estimatesbetween the two decennial censuses. At the same time that the USCB is providingannual estimates, the USCB is also conducting the American Community Survey whichprovides annual, 3-year, and 5-year estimates of the population with limiteddemographic detail. This results in a variety of population estimates - each of which isslightly different.
The amount of population data available can be overwhelming. Once you narrow yourscope by identifying any required demographic subgroups, by identifying the years ofinterest, and/or by identifying the level of geography, the amount of populationestimates available is greatly reduced. The following pages discuss each of theavailable population estimate sources along with their level of demographic andgeographic breakdown.

WWW.CT.GOV/DPH/POPULATIONDATA
CT Dept Public Health, Health Statistics & Surveillance, Statistics Analysis & Reporting v11/2016 p. 3
WWW.CT.GOV/DPH/POPULATIONDATA
CT Dept Public Health, Health Statistics & Surveillance, Statistics Analysis & Reporting v11/2016 p. 4
Decennial Census Counts
The estimation process that is closest to providing a true count of our Nation is thedecennial census. The US Census Bureau (USCB) takes a census of the population ofthe United States every 10 years which is known as the decennial census. A majorsource of population data for CT, the decennial census attempts to provide a true countof the population rather than an estimate. By conducting an actual census, this methodis the best estimation of a true count.
Although the census is described as a count, the population numbers provided to us arestill estimates. The USCB is unable to truly count each person accurately on April 1st.To account for the failure of some persons to be counted, adjustments are made to thetrue counts to generate population numbers that better represent a full count. In theend, the decennial census is an estimate based off of a true count.
Strengths:• Considered the best representation of the actual population.• Provides estimates for every level of geography supported by the USCB.
o Nation, State, County, MCD (Town), Tract, Block Group, Block and other political units• Provides demographic estimates that can be cross-tabulated to access specific demographic
sub-groups at every level of geography.o Counts by age, sex, race and ethnicity are available at the town level.
• American FactFinder provides easy access to data.
Weaknesses:• Estimates are for April 1st
o All other population estimates use July 1st making the decennial census inconsistento The population change between April 1 and July 1 may or may not lead to
underrepresentation of the population that is large enough to affect analyses• Data is published as reported by the respondents
o Corrections and reallocations are not applied to the decennial census datasetso Extra Race categories: Some Other Race & Two or More Races
In addition to the standard race groups (White, Black, American Indian/AlaskanNative, Asian, Hawaiian and Pacific Islander), the Census also collects data forMultiple Races and Some Other Race.
These Multiple Race and Some Other Race categories can make it difficult to usedecennial Census data as denominators when analyzing numerator data that doesnot contain these extra categories.
The tendency for Hispanic persons to self-identify as Some Other Race means thatHispanics are significantly under-counted in the standard race groups.
Town ASRH:• The USCB publishes town-level demographic data for April 1, 2010; however, this
dataset has several major limitations that undermine its utility (see weaknessesabove). Use with caution.

WWW.CT.GOV/DPH/POPULATIONDATA
CT Dept Public Health, Health Statistics & Surveillance, Statistics Analysis & Reporting v11/2016 p. 5
Census 2010 datasets available @ http://www.ct.gov/dph/populationdata:
Connecticut Profile of General Population and Housing Characteristics, 2010This profile provides population figures from April 1, 2010 by state, county
and town with some demographic breakdowns.
Connecticut Town Population by Age Sex Race and Hispanic Ethnicity, 2010This dataset contains population figures from April 1, 2010 by town, single
year of age, sex, race group, and Hispanic status. (xls, 9,804KB)(Source: Census 2010 Summary File 1)
WWW.CT.GOV/DPH/POPULATIONDATA
CT Dept Public Health, Health Statistics & Surveillance, Statistics Analysis & Reporting v11/2016 p. 6
Annual Post-censal Estimates
The populations of Connecticut at the state, county and town level are estimated at thecalendar year midpoint (July 1) each year and are known as annual or mid-yearestimates. Annual estimates are also known as post-censal estimates because theUSCB uses a variety of population change factors (births, deaths, Federal tax returns,Medicare enrollment, and immigration) to update the decennial census base countsfrom April 1, 2010. Once the inputs are updated, the estimates for each year back tothe decennial census are revised and this new series of population estimates arepublished. The latest year in each series denotes the vintage of the dataset.
Although the April 1, 2010 census is an actual count of the population on that day, amid-year estimate (July 1) better represents the population count for an entire year.Thus, annual post-censal estimates are created to serve as the best representation of asingle year’s population and to provide a consistent reference point across years. ThePopulation Estimates Program (PEP) of the USCB publishes the annual, post-censaldatasets about a year following the estimate date (e.g., July 1, 2012 data will bepublished around July 1, 2013).
Connecticut General Statutes mandates that CT DPH provide the Office of Policy andManagement the state, county, and town population totals. These totals are usedthroughout the State to distribute per capita funds. Once the USCB releases theirannual estimate, our DPH reviews the USCB’s annual estimates and makes anynecessary adjustments. Our DPH then releases the official population estimates forConnecticut at the state, county, and town levels by October of the year following theestimate date.
Included with each release of data is a discussion of the methodology used to calculatethe estimates with special attention to changes in the USCB methodology and to anyDPH adjustments. Usually the official CT estimates are identical to the USCB’spublication; however, occasionally, there has been cause for DPH to adjust the USCB’sfigures resulting in CT official estimates that are not the same as the USCB’s. Due tothe potential modifications, it is important to use the official CT estimates whenever yourdata should be consistent with State of Connecticut publications.
Using the official CT estimates is always a reasonable option when trying to choose anappropriate population estimate dataset. First, these are the official estimates so it iseasy to rationalize why these were used for your rates. Second, the official CTestimates are static. Unlike other series which are updated each year, the official CTestimates come from the first vintage published for that year. They are not updated orrevised with subsequent vintages, which keeps them static. Third, there may be timeswhen consistency with prior estimates is a key concern. For instance, if users will becomparing new disease rates with rates based on official CT estimates, it makes senseto use the original CT estimates for the new disease rates as well. Maintaining thesame denominator series minimizes confusion. The gains in accuracy from a newerseries of estimates may be lost if the revised rates create confusion among users ofthose statistics. Even small changes in the value of a rate can create significantconfusion when specific values have been previously quoted (e.g., to the news media,legislators, the commissioner), but then those values are no longer available. Both the

WWW.CT.GOV/DPH/POPULATIONDATA
CT Dept Public Health, Health Statistics & Surveillance, Statistics Analysis & Reporting v11/2016 p. 7
costs and benefits should be considered before modifying the population denominatorseries used to calculate rates.
Strengths:• Based off of the decennial census.• Provides estimates for July 1st.• The Some Other Race category has been reallocated so these estimates better represent
Hispanic numbers.• Corrections to inputs (births, deaths, migration, etc.) are applied
Weaknesses:• Does not provide any estimates for geographies lower than MCD (Town), such as tracts.• Demographic breakdowns are not available at the MCD (Town) level.• Demographic breakdowns that are available for County-level and up are not as complete as the
decennial census.• The Two or More Race category is retained.• Inputs (births, deaths, migration) are often delayed limiting true-to-date estimates• A new vintage is published each year
o Revision of the previous estimates each time a new year is added to the series createsmultiple datasets for any given year. These multiple datasets will have differentestimates for the same year which may cause confusion.
o Methodology may change over time. Changes in the estimation process may obfuscatethe actual trend in population change when years from different vintages are compared.
o Data citations must specify the vintage of the dataset.
Town ASRH:• The USCB publishes town-level population totals for July 1st annually; however,
no demographic data is provided.• CT DPH developed demographic data at the town-level for July 1, 2000 and July
1, 2010 (discussed in subsequent sections of this document).
Annual, post-censal datasets available @ http://www.ct.gov/dph/populationdata:
Town & County: Population (without demographic breakdowns)
Special notes about data availability and population changes:
Changes in Estimates Methodology: The Vintage 2009 population estimates reflect four majorimprovements in the estimates methodology. At the national level, the result of the variousmethodological changes is an upward shift of the Vintage 2009 post-censal population estimateswhen compared to those from the Vintage 2008 series. At the State and county level, some raceand age groups experienced substantial changes (comparison of July 1, 2008 estimates from theVintage 2008 series with the July 1, 2008 and July 1, 2009 estimates from the Vintage 2009 series).The Vintage 2008 post-censal population estimates reflect three major improvements in theestimates methodology. These methodology changes go beyond the extensive methodologychanges implemented for the Vintage 2007 estimates. The net impact of the various methodologicalchanges is a downward shift of the Vintage 2008 post-censal population estimates when comparedto those from the Vintage 2007 series; the Vintage 2007 post-censal estimates also reflected adownward shift when compared to the 2006 estimates.

WWW.CT.GOV/DPH/POPULATIONDATA
CT Dept Public Health, Health Statistics & Surveillance, Statistics Analysis & Reporting v11/2016 p. 8
Annual Bridged-ASRH Post-censal Estimates
The National Center for Health Statistics (NCHS) has developed a method to produceannual estimates at the state and county levels by age, sex, race and Hispanic ethnicity(ASRH) using four single-race categories instead of the 31 single and multiple-racecategories published by the U.S. Census in 2000 and 2010.
The NCHS bridged estimates are created directly from the USCB’s annual post-censalestimates. Through a process known as ‘bridging’, the multiple race groups are partiallyreallocated into single race groups to produce annual post-censal population estimatesusing four mutually-exclusive race categories (White, Black, American Indian/AlaskanNative, and Asian/Pacific Islander).
NCHS’ bridged population estimates are particularly useful since many health datasystems still collect information using single-race categories (White, Black, AmericanIndian/Alaskan Native, and Asian/Pacific Islander). By providing these bridged racecategories, DPH can calculate race-specific rates to monitor many health indicators thatwould have been difficult to evaluate using the unbridged, multiple race populationestimates.
NCHS’ ASRH data contains estimates annually as of July 1 by state/county, single yearof age, sex, race (White, Black/African American, American Indian/Alaska Native,Asian/Pacific Islander) and ethnicity (Hispanic/Latino, not Hispanic/Latino).
Strengths:• Same strengths as the annual post-censal estimates because the data inputs are identical:
o Based off of the decennial census.o Provides estimates for July 1st.o The Some Other Race category has been reallocated so these estimates better
represent Hispanic numbers.o Corrections to inputs (births, deaths, migration, etc.) are applied.
• Conforms to the 1977 OMB Standards which may be more aligned with DPH data collectioncategories for race.
o Reallocates multiple race groups into single race groups Creates denominator categories that are consistent with numerator categories
o Fewer demographic (ASRH) combinations with a cell size of zero.
Weaknesses:• Same weaknesses as the annual post-censal estimates because the data inputs are identical:
o Does not provide any estimates for geographies lower than MCD (Town), such as tracts.o Demographic breakdowns are not available at the MCD (Town) level.o Demographic breakdowns that are available for County-level and up are not as complete
as the decennial census.o Inputs (births, deaths, migration) are often delayed limiting true-to-date estimateso A new vintage is published each year
Revision of the previous estimates each time a new year is added to the seriescreates multiple datasets for any given year. These multiple datasets will havedifferent estimates for the same year which may cause confusion.
Methodology may change over time. Changes in the estimation process mayobfuscate the actual trend in population change when years from differentvintages are compared.
Data citations must specify the vintage of the dataset.

WWW.CT.GOV/DPH/POPULATIONDATA
CT Dept Public Health, Health Statistics & Surveillance, Statistics Analysis & Reporting v11/2016 p. 9
• Collapsing the Asian race group with the Native Hawaiian and Other Pacific Islander race groupmay be a weakness for some users.
• County-level ASRH is not available for vintage 2000 or vintage 2001.
Town ASRH:• NCHS does not publish ASRH data at the town-level because the USCB
does not publish data at the town-level.
Annual, bridged-ASRH post-censal datasets available @http://www.ct.gov/dph/populationdata:
State & County: Population by Age, Sex, Race and Hispanic Ethnicity (ASRH)
Special notes about data availability and population changes:
County level ASRH estimates that are consistent with the original state level figures are notavailable for 2000 and 2001. NCHS did not publish July 1, 2000 estimates or July 1, 2001 estimatesat the county level when the original state level estimates were produced. County level estimatesfor 2000 and 2001 were produced at a later date, with the release of the 2002 estimates. However,these "vintage 2002" data include modified county level 2000 and 2001 estimates that differ fromthe official CT State Population estimates.
Changes in Estimates Methodology: The Vintage 2009 population estimates reflect four majorimprovements in the estimates methodology. At the national level, the result of the variousmethodological changes is an upward shift of the Vintage 2009 post-censal population estimateswhen compared to those from the Vintage 2008 series. At the State and county level, some raceand age groups experienced substantial changes (comparison of July 1, 2008 estimates from theVintage 2008 series with the July 1, 2008 and July 1, 2009 estimates from the Vintage 2009 series).The Vintage 2008 post-censal population estimates reflect three major improvements in theestimates methodology. These methodology changes go beyond the extensive methodologychanges implemented for the Vintage 2007 estimates. The net impact of the various methodologicalchanges is a downward shift of the Vintage 2008 post-censal population estimates when comparedto those from the Vintage 2007 series; the Vintage 2007 post-censal estimates also reflected adownward shift when compared to the 2006 estimates.
WWW.CT.GOV/DPH/POPULATIONDATA
CT Dept Public Health, Health Statistics & Surveillance, Statistics Analysis & Reporting v11/2016 p. 10
July 1, 2000 & July 1, 2010 Town-level Bridged-ASRH Post-censal Estimates
Population estimates by age, sex, race and Hispanic ethnicity (ASRH) are invaluable forthe estimation of rates of health and illness in Connecticut’s towns and counties.Unfortunately, the annual post-censal town population estimates do not include theASRH components and the population change between April 1 and July 1 is substantialenough to prohibit the direct substitution of demographic counts. To address this, ourDPH developed a town-level ASRH dataset for July 1, 2000.
This town-level dataset provides population estimates that are consistent with theofficial mid-year state and town estimates of the population for July 1, 2000 thatprovides a consistent reference point with the annual estimates for 1991-1999 and2001-2009. These estimates also allow rates of health and illness to be calculated atthe town level using the mid-year 2000 population rather than the lower populationestimate from the Census in April.
This dataset was created by taking the demographic distribution of age, sex, race, andethnicity by town for April 1, 2000 and adjusting it to fit both the town population totalsfor July 1, 2000 and the county demographic totals by age, sex, bridged race/ethnicity.The result is a town-level bridged ASRH dataset where the totals are consistent withother existing July 1, 2000 datasets.
It is important to note that the town-level ASRH uses a collapsed race*ethnicitystructure. The race/ethnicity groups remain mutually-exclusive, but they are nowconjoined by Hispanic status. The four race groups are provided for non-Hispanicpersons only and the Hispanic ethnicity is provided for Hispanic persons of any race.This structure results in 5 mutually-exclusive race/ethnicity categories: White-NH,Black-NH, American Indian-NH, Asian/Pacific Islander-NH, or Hispanic/Latino-any race.
The town-level ASRH July 1, 2000 file contains estimates of the resident population ofConnecticut as of July 1, 2000 by town, five-year age group, sex, mutually exclusiverace/ethnicity categories (White-NH, Black/African American-NH, AmericanIndian/Alaska Native-NH, Asian/Pacific Islander-NH, or Hispanic/Latino-any race).
After the 2010 decennial Census, DPH created a 2010 town-level ASRH dataset in thesame manner.
Strengths:• The only dataset that provides a single-year, town-level estimate with demographic cross-
tabulations for a July 1st time point.• Same strengths as the annual post-censal estimates because the data inputs are identical:
o Based off of the decennial census.o Provides estimates for July 1st.o The Some Other Race category has been reallocated so these estimates better
represent Hispanic numbers.o Corrections to inputs (births, deaths, migration, etc.) are applied.
• Conforms to the 1977 OMB Standards which may be more aligned with DPH data collectioncategories for race.
o Reallocates multiple race groups into single race groups Creates denominator categories that are consistent with numerator categories
o Collapses the Hispanic ethnicity into a single race*ethnicity category

WWW.CT.GOV/DPH/POPULATIONDATA
CT Dept Public Health, Health Statistics & Surveillance, Statistics Analysis & Reporting v11/2016 p. 11
Substantially reduces the number of Hispanic age*sex*race combinations with acell size of zero.
More consistent with numerator data which often collapses Hispanic persons intoa single race*ethnicity group representing Hispanic persons of any race.
Weaknesses:• Data are provided using 5-year age groups only.
o Aggregating individual years into 5-year age groups was important to achieving a reliablere-distribution across all ages (most notably for non-whites over age 45).
• Same weaknesses as the annual post-censal estimates because the data inputs are identical:o Does not provide any estimates for geographies lower than MCD (Town), such as tracts.o Demographic breakdowns are not available at the MCD (Town) level.o Demographic breakdowns that are available for County-level and up are not as complete
as the decennial census.o Inputs (births, deaths, migration) are often delayed limiting true-to-date estimates
• Collapsing the Asian race group with the Native Hawaiian and Other Pacific Islander race groupmay be a weakness for some users.
• Collapsing all Hispanic persons into a single race*ethnicity category may be a weakness for someusers.
Town ASRH:• NCHS does not publish ASRH data at the town-level because the USCB does
not publish data at the town-level.• CT DPH developed town-ASRH estimates for July 1, 2000 and July 1, 2010
only.
July 1, 2000 & July 1, 2010town-level bridged-ASRH post-censal dataset available @
http://www.ct.gov/dph/populationdata:
Town: Population by Age, Sex, Race and Hispanic Ethnicity (2000 & 2010)

WWW.CT.GOV/DPH/POPULATIONDATA
CT Dept Public Health, Health Statistics & Surveillance, Statistics Analysis & Reporting v11/2016 p. 12
Intercensal Estimates
As previously discussed, the USCB publishes annual, post-censal estimates of thepopulation that use the most recent decennial census as the base for the estimationprocess. When another decennial census is completed, the USCB producesintercensal estimates. Intercensal estimates are created for the years between twodecennial censuses when both the beginning (e.g., Census 2000) and ending (e.g.,Census 2010) populations are known – hence the term INTER-censal versus the termPOST-censal. Intercensals are produced once a decade by adjusting the existing timeseries of post-censal estimates for the entire decade to create a smooth transition fromone decennial census count to the next. They differ from the post-censal estimates thatare released annually because they rely on a mathematical formula that redistributesthe difference between the April 1 post-censal estimate and April 1 census count for theend of the decade across the estimates for that decade.
The U.S. Census Bureau’s (USCB) intercensal estimates are published a few yearsafter the latest decennial census. The USCB’s intercensal estimate series mirrors thepost-censal estimates series. Likewise, the National Center for Health Statistics(NCHS) also publishes intercensal estimates that mirror their annual post-censalbridged-race ASRH estimates. This means that intercensal estimate series for 2000-2009 are available for the following post-censal datasets:
• Total population for State, County, and Town as of July 1 from USCB• Demographic (ASRH) population estimates for State and County as of July 1
from NCHS

WWW.CT.GOV/DPH/POPULATIONDATA
CT Dept Public Health, Health Statistics & Surveillance, Statistics Analysis & Reporting v11/2016 p. 13
For dates when both post-censal and intercensal estimates are available, intercensalestimates are usually preferred.
Strengths:• Uses decennial census figures for both the starting and ending points of the regression line so
these are considered to better represent overall change throughout the decade.• Only one intercensal series is provided
o Intercensals are produced once, so they are not subject to the same vintaging that occurswith annual estimates
o Revisions are possible. The USCB may publish a revised version of the intercensaldataset at a subsequent date.
• Maintains the same strengths as the dataset (annual, post-censal or annual bridged-ASRH) uponwhich the intercensal estimates are based.
• Intercensal series are provided for each of the USCB PEP’s annual population estimate products.Weaknesses:
• Smoothing the years between the two end points is a mathematical adjustment that may notaccurately reflect the true population change from year to year.
• Maintains the same weaknesses as the dataset (annual, post-censal or annual bridged-ASRH)upon which the intercensal estimates are based.
Town ASRH:• The USCB publishes town-level intercensal population totals for July 1st
annually; however, no demographic data is provided.
Intercensal datasets available @ http://www.ct.gov/dph/populationdata:
Connecticut intercensal datasets are not yet available on the DPH website.Please contact Karyn Backus ([email protected]) for access to intercensal
datasets.
WWW.CT.GOV/DPH/POPULATIONDATA
CT Dept Public Health, Health Statistics & Surveillance, Statistics Analysis & Reporting v11/2016 p. 14
American Community Survey (ACS) Estimates
The American Community Survey (ACS) is an ongoing statistical survey by the U.S.Census Bureau that gathers information previously contained only in the long form ofthe decennial census. It is the largest survey other than the decennial census that theCensus Bureau administers.
The ACS provides yearly estimates of the population and various demographic,economic, and health measures for all states, as well as all cities, counties, metropolitanareas, and population groups of 65,000 people or more. For smaller areas, it isnecessary to combine multiple survey years to obtain reliable estimates: three surveyyears in areas with 20,000 to 65,000 people, and five survey years in areas with fewerthan 20,000 people.
The quality of these samples was originally intended to match that of the decennialcensus long form, but because the sample size of the ACS is smaller than originallyexpected, ACS estimates are less precise than the comparable estimates from Census2000 and prior decennial census years. Because these estimates are from survey data,Margins of Error (MOEs) are now at play. ACS provides MOEs for each estimate aswell as directions for using MOEs.
Strengths:• The only dataset that provides demographic data below the county-level on an ongoing basis.
o Town, tract, block group, and block level data are available in 5-year datasets.• The ongoing collection of sample data makes this survey the most current available.
o Decennial census information becomes increasingly out-of-date as the decadeprogresses whereas ACS data collection is ongoing throughout the decade.
• Provides demographic estimates as of July 1st and is consistent with geographic totals for state,county, and town that are provided in the annual, post-censal estimates
o The ACS constrains its population totals (but not demographics) with the PEP’spopulation totals for the US, state, county and town geographies. This ensures that thetwo data sources are reporting the same overall population figures.
Weaknesses:• Only the largest geographies (state, county, large cities) are available annually.
o Town and tract data are limited to rolling 5-year estimates.o ACS provides the population as a single year representation of the 3-year or the 5-year
period; when using a multiple year numerator (e.g., 2009-2011), ACS figures need to bemultiplied by the same number of years (e.g., 3).
• The distributions of demographic characteristics within a given geography are NOT constrained.Although totals by geography are constrained, the age, sex, race, or ethnicity distribution in theACS may differ from the annual, post-censal estimates.
• Demographic breakdowns are limited in comparison to other products.o Age is only available 5-year age groups and selected age categories. The older 5-year
age groups are combined into 10-year age groups when crossed with race/ethnicity.o Race and ethnicity tables are provided independently. A race*ethnicity cross-tabulation
is available in Table DP05 only.o When cross-tabulating race*ethnicity with age or sex, the only combined race/ethnicity
group is White-NH. There is no estimate for non-Hispanic for any race group other thanWhite when including age or sex in the breakdown.
o These categories can make it difficult to use ACS data as denominators when attemptingto analyze age*race independent of Hispanic ethnicity.
• Uses the decennial census race categories
WWW.CT.GOV/DPH/POPULATIONDATA
CT Dept Public Health, Health Statistics & Surveillance, Statistics Analysis & Reporting v11/2016 p. 15
o The Some Other Race category is collected but not reallocatedo The Multiple Race category is collected, but bridged-ASRH datasets are not available.
• Requires using Margins of Error (MOEs) when performing statisticso ACS provides documentation on calculating MOEso When combining variables (e.g.,” married” with “college degree”), MOEs need to be
recalculated appropriately.
Town ASRH:• ACS does not publish complete ASRH data at the town-level. Limited ASRH
data is available for all CT towns for 5-year periods.• CT DPH discourages using the ACS data for town-level estimates that
include demographics due to the large margins of error and the limiteddemographic breakdowns. We have found the margins of error are oftenlarger than the estimate itself and can be erratic from year to year.
WWW.CT.GOV/DPH/POPULATIONDATA
CT Dept Public Health, Health Statistics & Surveillance, Statistics Analysis & Reporting v11/2016 p. 16
Vintages
One of the first major hurdles of understanding the universe of population estimates ismastering the concept of vintages.
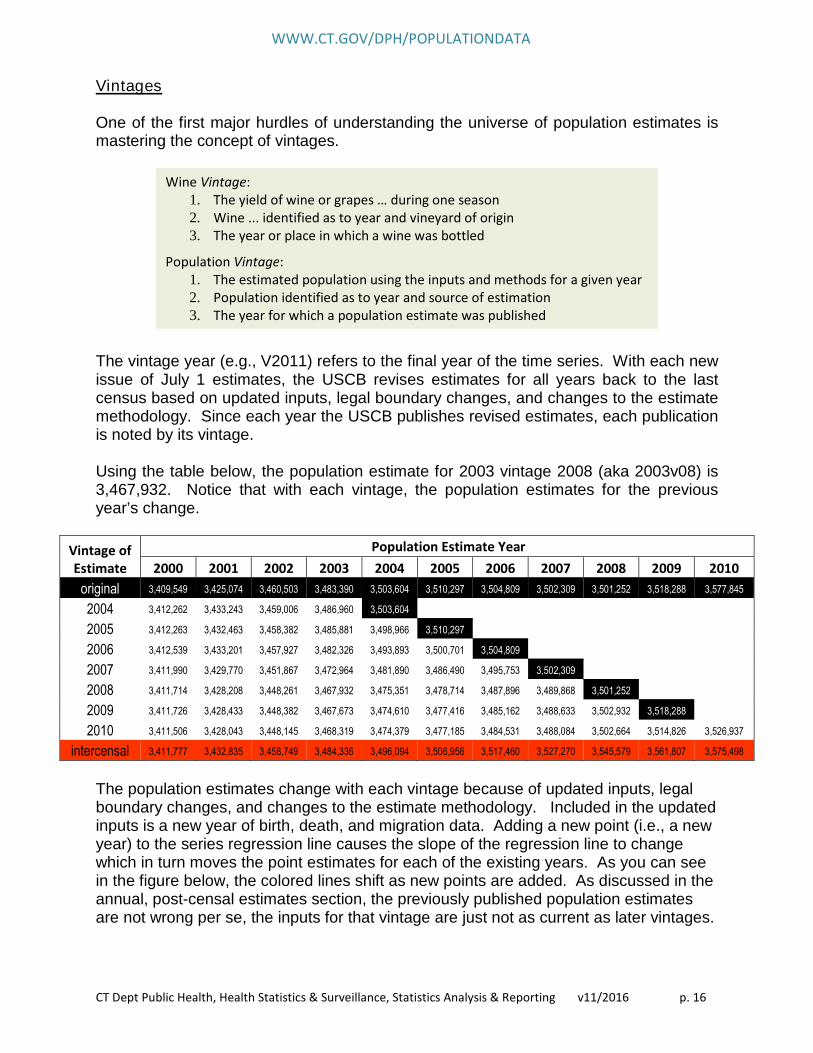
The vintage year (e.g., V2011) refers to the final year of the time series. With each newissue of July 1 estimates, the USCB revises estimates for all years back to the lastcensus based on updated inputs, legal boundary changes, and changes to the estimatemethodology. Since each year the USCB publishes revised estimates, each publicationis noted by its vintage.
Using the table below, the population estimate for 2003 vintage 2008 (aka 2003v08) is3,467,932. Notice that with each vintage, the population estimates for the previousyear’s change.
Vintage ofEstimate
Population Estimate Year
2000 2001 2002 2003 2004 2005 2006 2007 2008 2009 2010
original 3,409,549 3,425,074 3,460,503 3,483,390 3,503,604 3,510,297 3,504,809 3,502,309 3,501,252 3,518,288 3,577,845
2004 3,412,262 3,433,243 3,459,006 3,486,960 3,503,604
2005 3,412,263 3,432,463 3,458,382 3,485,881 3,498,966 3,510,297
2006 3,412,539 3,433,201 3,457,927 3,482,326 3,493,893 3,500,701 3,504,809
2007 3,411,990 3,429,770 3,451,867 3,472,964 3,481,890 3,486,490 3,495,753 3,502,309
2008 3,411,714 3,428,208 3,448,261 3,467,932 3,475,351 3,478,714 3,487,896 3,489,868 3,501,252
2009 3,411,726 3,428,433 3,448,382 3,467,673 3,474,610 3,477,416 3,485,162 3,488,633 3,502,932 3,518,288
2010 3,411,506 3,428,043 3,448,145 3,468,319 3,474,379 3,477,185 3,484,531 3,488,084 3,502,664 3,514,826 3,526,937
intercensal 3,411,777 3,432,835 3,458,749 3,484,336 3,496,094 3,506,956 3,517,460 3,527,270 3,545,579 3,561,807 3,575,498
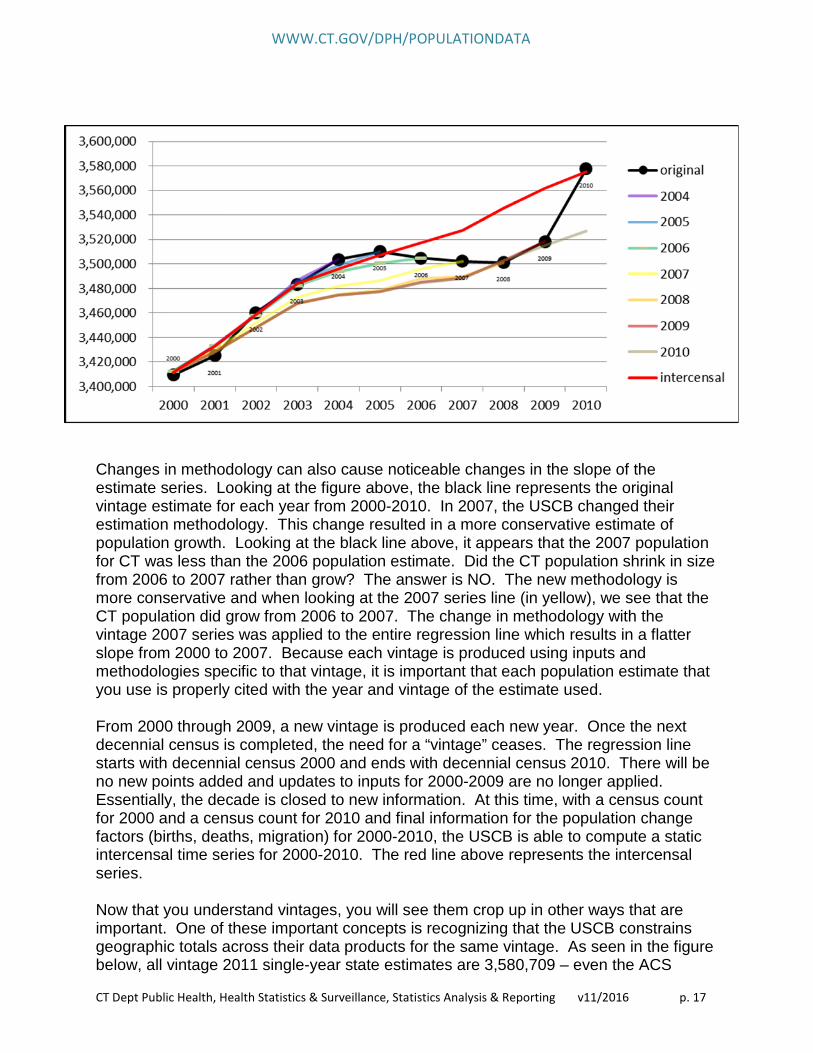
The population estimates change with each vintage because of updated inputs, legalboundary changes, and changes to the estimate methodology. Included in the updatedinputs is a new year of birth, death, and migration data. Adding a new point (i.e., a newyear) to the series regression line causes the slope of the regression line to changewhich in turn moves the point estimates for each of the existing years. As you can seein the figure below, the colored lines shift as new points are added. As discussed in theannual, post-censal estimates section, the previously published population estimatesare not wrong per se, the inputs for that vintage are just not as current as later vintages.
Wine Vintage:1. The yield of wine or grapes … during one season2. Wine ... identified as to year and vineyard of origin3. The year or place in which a wine was bottled
Population Vintage:1. The estimated population using the inputs and methods for a given year2. Population identified as to year and source of estimation3. The year for which a population estimate was published
WWW.CT.GOV/DPH/POPULATIONDATA
CT Dept Public Health, Health Statistics & Surveillance, Statistics Analysis & Reporting v11/2016 p. 17
Changes in methodology can also cause noticeable changes in the slope of theestimate series. Looking at the figure above, the black line represents the originalvintage estimate for each year from 2000-2010. In 2007, the USCB changed theirestimation methodology. This change resulted in a more conservative estimate ofpopulation growth. Looking at the black line above, it appears that the 2007 populationfor CT was less than the 2006 population estimate. Did the CT population shrink in sizefrom 2006 to 2007 rather than grow? The answer is NO. The new methodology ismore conservative and when looking at the 2007 series line (in yellow), we see that theCT population did grow from 2006 to 2007. The change in methodology with thevintage 2007 series was applied to the entire regression line which results in a flatterslope from 2000 to 2007. Because each vintage is produced using inputs andmethodologies specific to that vintage, it is important that each population estimate thatyou use is properly cited with the year and vintage of the estimate used.
From 2000 through 2009, a new vintage is produced each new year. Once the nextdecennial census is completed, the need for a “vintage” ceases. The regression linestarts with decennial census 2000 and ends with decennial census 2010. There will beno new points added and updates to inputs for 2000-2009 are no longer applied.Essentially, the decade is closed to new information. At this time, with a census countfor 2000 and a census count for 2010 and final information for the population changefactors (births, deaths, migration) for 2000-2010, the USCB is able to compute a staticintercensal time series for 2000-2010. The red line above represents the intercensalseries.
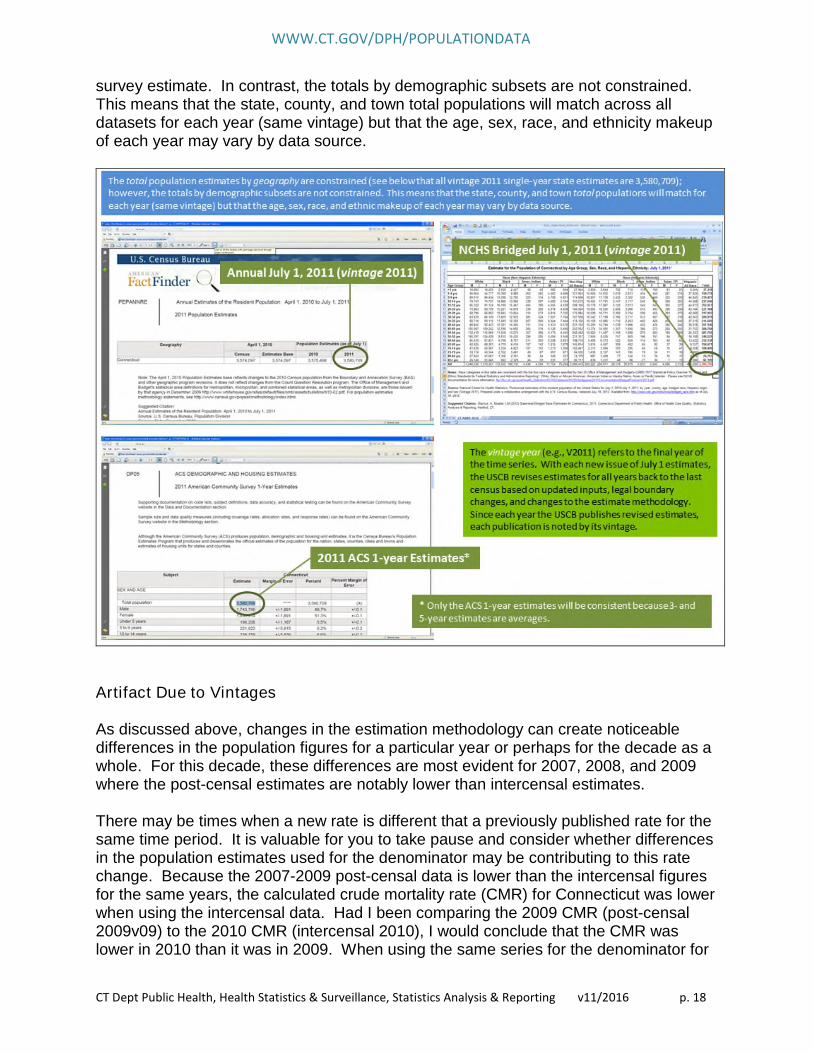
Now that you understand vintages, you will see them crop up in other ways that areimportant. One of these important concepts is recognizing that the USCB constrainsgeographic totals across their data products for the same vintage. As seen in the figurebelow, all vintage 2011 single-year state estimates are 3,580,709 – even the ACS
WWW.CT.GOV/DPH/POPULATIONDATA
CT Dept Public Health, Health Statistics & Surveillance, Statistics Analysis & Reporting v11/2016 p. 18
survey estimate. In contrast, the totals by demographic subsets are not constrained.This means that the state, county, and town total populations will match across alldatasets for each year (same vintage) but that the age, sex, race, and ethnicity makeupof each year may vary by data source.
Artifact Due to Vintages
As discussed above, changes in the estimation methodology can create noticeabledifferences in the population figures for a particular year or perhaps for the decade as awhole. For this decade, these differences are most evident for 2007, 2008, and 2009where the post-censal estimates are notably lower than intercensal estimates.
There may be times when a new rate is different that a previously published rate for thesame time period. It is valuable for you to take pause and consider whether differencesin the population estimates used for the denominator may be contributing to this ratechange. Because the 2007-2009 post-censal data is lower than the intercensal figuresfor the same years, the calculated crude mortality rate (CMR) for Connecticut was lowerwhen using the intercensal data. Had I been comparing the 2009 CMR (post-censal2009v09) to the 2010 CMR (intercensal 2010), I would conclude that the CMR waslower in 2010 than it was in 2009. When using the same series for the denominator for

WWW.CT.GOV/DPH/POPULATIONDATA
CT Dept Public Health, Health Statistics & Surveillance, Statistics Analysis & Reporting v11/2016 p. 19
the 2009 CMR and the 2010 CMR, the 2010 CMR is slightly higher than the 2009 CMR.In most cases, the population variation from series to series is low and will have aninsignificant effect on your analyses. A possible exception to this is the jump in thepopulation change between vintage 2009 series and vintage 2010 series.
When comparing rates over time, verify the denominators used for the rates at eachtime point before making conclusions about the significance of the change
• As discussed in the vintages slide, the estimated population for a given yearchanges over time as inputs and methodologies are revised. Care should betaken to ensure that rate differences are not due to differing populationdenominators.
• For example, when evaluating the past decade for rate changes, thedenominator for the rates should come from the same vintage/series. Thisprevents artifactual differences in population numbers (from varying inputs andmethods) from impacting the results.
• Recognize that historical data and rates will use population estimates that differfrom current data for the same year. Use caution when comparing your analysesto historical rates.
• Review and verify that all population estimates used in your analyses areappropriate for your project.
Rate changeis an artifact
of thedenominator.

WWW.CT.GOV/DPH/POPULATIONDATA
CT Dept Public Health, Health Statistics & Surveillance, Statistics Analysis & Reporting v11/2016 p. 20
Citing Population Data
Using the citation “US Census Bureau” is not acceptable. Although each of thedatasets discussed here originate with the U.S. Census Bureau, each dataset has aunique citation that properly documents the production of the dataset. The citationincludes details about the data source that will allow the reader of your report torecreate the same analyses. Elements such as the vintage and date of publication aresignificant components when properly identifying the datasets. Do not skip the details infavor of a generic citation.
It is also important that you provide the citation that specifies where YOU accessed thedata. For example, if you use the state population data that was published by CT DPH,you will use the CT DPH citation for that dataset even though the CT DPH cites theUSCB as the data source.
The good news is that citations are usually provided. Each of the DPH populationdatasets is published with a recommended citation. Both the Census Bureau andNCHS provide recommended citations in the documentation associated with thedataset. The documentation files are located on the same webpages as the datasets.Data downloaded from American FactFinder can be difficult to cite because of thenature of the query system. The USCB has provided details on how to properly citedata from AFF:
https://ask.census.gov/faq.php?id=5000&faqId=519.
A recommended citation contains all of the information necessary to properly identifythe dataset. The “recommended” qualifier applies to the format of the citation, not theinformation provided within the citation. For DPH, we use the American PsychologicalAssociation’s editorial style that many of the social and behavioral sciences haveadopted to present written material in the field. Detailed information about the APAStyle and how to format your citations in APA Style can be found at www.apastyle.org.
SAS DatasetsSelected population datasets are available in SAS format. If the SAS version of thedataset is not posted on the webpage near the excel version, you may contact KarynBackus ([email protected]) to see if one is available.

WWW.CT.GOV/DPH/POPULATIONDATA
CT Dept Public Health, Health Statistics & Surveillance, Statistics Analysis & Reporting v11/2016 p. 21
Population Statistics: Q & A
I need the CT population data for the state, a county, or a town.
Population tables are published on the DPH website:
DPH HOME PAGE > STATISTICS & RESEARCH > POPULATION STATISTICS
The population tables provided on-line are in a tabular format. If you would like thepopulation data in non-tabular form (SAS, DBF, Excel) for analytic purposes, you maycontact Karyn Backus directly to request a dataset.

WWW.CT.GOV/DPH/POPULATIONDATA
CT Dept Public Health, Health Statistics & Surveillance, Statistics Analysis & Reporting v11/2016 p. 22
What are the USCB’s Minor Civil Divisions?While many of states throughout the nation use county as the primarypolitical/municipal entity at the local level, about 20 states use smaller geographies(towns, townships) as the primary local governmental unit. These legally definedcounty subdivisions are referred to as minor civil divisions (MCDs) by the USCB. TheUSCB produces estimates at the MCD level (in addition to higher levels) for thesestates. In CT, there are 169 official towns and all 169 are MCDs. Incorporated placesare subordinate to the MCDs in which they are located.
Why do the official CT annual estimates for state, county, or town differ from theUSCB annual mid-year estimates?Official CT estimates and USCB figures may differ for a variety of reasons.
a) In some years, CT needed to make adjustments to the Census' estimates whichresulted in the official CT estimates being slightly different than the Censusestimates. All such adjustments are discussed in the Methods of Estimation sectionof our town-level population estimate reports or in the Notes section of the ASRHestimates data file.
b) Also, different estimates for the same year may be due to comparing differentestimate vintages. CT’s official estimates use the first vintage available for a givenyear and are not revised/updated for later vintages. With each new issue of July 1estimates, the USCB revises estimates for all years back to the last census. Mostadministrative record data sources lag the current estimate year (by as much as two
WWW.CT.GOV/DPH/POPULATIONDATA
CT Dept Public Health, Health Statistics & Surveillance, Statistics Analysis & Reporting v11/2016 p. 23
years), therefore, the USCB projects the data for the current year based on pastyears’ data. As updated data become available, they revise the projected input dataso that each vintage’s estimates are always based on the most recent dataavailable. Revisions to estimates also incorporate changes in methodology andlegal boundary changes. Since each year the USCB publishes revised estimates,each publication is noted by its vintage.
Why do the official CT annual estimates for state, county, or town differ from theACS estimates?The annual post-censal USCB estimates and the ACS estimates use different methods.
a) The official CT annual estimates are based on the annual post-censal USCBestimates. The Population Estimates Program (PEP) at the Census Bureaudevelops and prepares estimates of the population by age, sex, race, and Hispanicorigin for the nation, states, counties, and towns. These estimates are consistentwith the decennial census residence definition of usual residence and represent theCensus Bureau's official estimates of updated census counts for these areas. TheUSCB annual estimates are used for a variety of purposes including the annualallocation of over $400 billion in federal funds, as denominators for statisticalindicators, and the basis for program planning and development.
b) Variants of these estimates are used as controls for the American CommunitySurvey (ACS). The population levels by age, sex, race, and Hispanic origin forstates and counties, the population totals for places, and the number of housingunits for states and counties which result from the ACS will not agree with theUSCB official estimates. This is because the weighting specifications employed bythe ACS use various aggregations of the estimates for states and counties.
Thus, ACS estimates of population levels and housing unit estimates should not beused for state, county, or town when then USCB annual population estimates can beused instead.
Why do the ACS tract totals differ from the 2010 Census tract totals?The 2010 Census tracts totals represent the population count as of April 1, 2010 foreach tract. The ACS tract totals represent an estimate by ACS for each tract as ofJuly 1st over a five year period that is averaged together.
I need tract level population counts for 2010.The decennial census will provide population counts by census tract for April 1, 2010.USCB tract level estimates are not available for any other time point. ACS providestract level estimates for July 1 for 5-year estimates only.
I need block group level economic data for 2010.The decennial census will not provide economic data. Economic data is availablethrough the ACS or other Census Bureau products. Block group level data will beavailable for 5-year estimates only.
I need town level data by age, sex, race, or ethnicity for each year 2010-2019.Annual estimates with demographics are not available at the town level for individualyears. Annual population estimates with demographics at the town level are not
WWW.CT.GOV/DPH/POPULATIONDATA
CT Dept Public Health, Health Statistics & Surveillance, Statistics Analysis & Reporting v11/2016 p. 24
published by the USCB. The ACS will publish town level estimates withdemographics, but only the 5-year estimates will provide all 169 CT towns.
I want to find the population count for a particular demographic group at both thetown level and tract level.
If you are going to compare town and tract for the same analysis, the same datasource (census 2010 or ACS) should be used. Both data sources will providedemographic data. The Census 2010 data will be for April 1, 2010. The ACS data fortown or tract will be for 5-year estimates only.
I want to compare the change in the rate of a health indicator for a particulargeography over a series of years. Which population figures should I use fordenominators?
Each year the USCB publishes a new series (vintage) of estimates in which the entireseries of years are updated to reflect the most current input data and methodology.When using CT population estimates as denominators for rates (e.g., prevalencerates) for several years, it is important to use the same vintage for all years. Forexample, if you want to calculate the birth rate for each town by year for the decade,the same vintage of town population estimates should be used to pull the denominatorcounts for each year.
The USCB’s annual population estimates for CT are available at several levels ofgeography, such as state, county, town/MCD, and incorporated place/borough. TheUSCB does NOT publish annual estimates based on decennial census geographiessuch as tracts, block groups, or blocks. If looking to calculate rates for small areassuch as these, you will need to use ACS data. Be aware that the ACS estimate isindependent of the USCB annual estimates and derived using different inputs andmethodologies. If seeking to compare rates between different geography levels, werecommend that you stay within the same estimate source: if comparing town rateswith tract rates, both denominators should come from ACS since only ACS providestract-level data.