Embed Size (px)
Citation preview

RESEARCH ARTICLE
Population genetic structure and history of fragmentedremnant populations of the New England cottontail(Sylvilagus transitionalis)
Lindsey E. Fenderson • Adrienne I. Kovach •
John A. Litvaitis • Marianne K. Litvaitis
Received: 22 June 2010 / Accepted: 7 February 2011
� Springer Science+Business Media B.V. 2011
Abstract The New England cottontail (Sylvilagus tran-
sitionalis) has suffered from extensive loss and fragmen-
tation of its habitat and is now a species of conservation
priority in the northeastern United States. Remnant New
England cottontail populations currently occur in five
geographically disjunct locations: southern Maine and
southeastern New Hampshire (MENH); the Merrimack
Valley in central New Hampshire (NH-MV); Cape Cod,
Massachusetts (CC); parts of eastern Connecticut and
Rhode Island (CTRI); and western Connecticut, south-
eastern New York and southwestern Massachusetts
(CTNY). We used microsatellite genotyping to discern
patterns of population structure, genetic variability, and
demographic history across the species’ range and to assess
whether the observed patterns are a consequence of recent
habitat loss and fragmentation. Our findings show that the
geographic populations are highly differentiated (overall
FST = 0.145; P \ 0.001). Using Bayesian clustering
analyses, we identified five genetic clusters, which corre-
sponded closely to the geographic populations, but grouped
MENH & NH-MV together (ME/NH) and identified an
isolated population in eastern Connecticut (Bluff Point).
The genetic clusters showed little evidence of recent gene
flow and are highly influenced by genetic drift. The CC and
Bluff Point populations show signs they experienced a
genetic bottleneck, whereas the ME/NH population shows
evidence of ongoing decline. Populations in Bluff Point,
CC, and ME/NH also show significantly reduced genetic
variation relative to the other clusters (CTNY and CTRI
without Bluff Point). Without immediate human interven-
tion, the short-term persistence of New England cottontail
populations in Maine, New Hampshire and Cape Cod is at
great risk. Conservation efforts at this time should focus on
within-population sustainability and eventually restoring
connectivity among these isolated populations.
Keywords Fragmentation � Population genetic structure �New England cottontail � Genetic bottleneck �Microsatellite � Conservation � Genetic drift �Sylvilagus transitionalis
Introduction
The extent to which landscape effects promote or prevent
genetic exchange is becoming increasingly important to
consider in conservation efforts of wild plant and animal
species. Habitat loss and fragmentation reduce connectivity
among wildlife populations and can ultimately drive pop-
ulations to extinction (Reed 2004). Isolated populations
have smaller effective sizes and incur a greater risk of
extinction due to stochastic effects (Frankham et al. 2002).
As evidenced in many recent studies (e.g., White and
Searle 2007; Dixo et al. 2009), when populations become
isolated, they lose genetic diversity. The loss of genetic
diversity limits evolutionary potential (Johansson et al.
2007) and populations are more likely to experience
inbreeding depression (Keller and Waller 2002; Willi et al.
Electronic supplementary material The online version of thisarticle (doi:10.1007/s10592-011-0197-x) contains supplementarymaterial, which is available to authorized users.
L. E. Fenderson � M. K. Litvaitis
Zoology Graduate Program, University of New Hampshire,
Durham, NH 03824, USA
A. I. Kovach (&) � J. A. Litvaitis � M. K. Litvaitis
Department of Natural Resources and the Environment,
University of New Hampshire, 56 College Rd, Durham,
NH 03824, USA
e-mail: [email protected]
123
Conserv Genet
DOI 10.1007/s10592-011-0197-x

2006; Wright et al. 2008). Without habitat connectivity,
populations cannot exchange individuals and maintain
genetic diversity. Consequently, understanding the genetic
structure of threatened and endangered species is important
in management and conservation efforts.
Population genetic studies, especially in combination
with other ecological research, can aid our understanding
of population history (Hansen and Taylor 2008) and pro-
vide necessary information for the designation of man-
agement units (Gonzalez-Suarez et al. 2009). Such data
also provide information about population connectivity and
the genetic diversity of populations, which are beneficial
when making translocation or captive breeding decisions
(Johnson 2000) and for successful reintroductions to
increase the genetic exchange of individuals (Maudet et al.
2002). Whether the goal is to increase genetic diversity or
to conserve locally adapted populations, by recognizing the
degree of genetic divergence among populations, wildlife
professionals can make more informed management
decisions.
One species that is threatened with extinction as a result
of habitat loss and fragmentation is the New England
cottontail (Sylvilagus transitionalis). This habitat specialist
requires densely vegetated areas, such as coastal thickets or
early-successional habitat with extensive understory vege-
tation (Litvaitis et al. 2003). Its historic range extended
throughout most of New England and eastern New York
(Hall and Kelson 1959; Godin 1977; Chapman et al. 1992,
Fig. 1), a landscape that has undergone vast transforma-
tions since European settlement. Beginning in the early
1600s, forests were gradually cleared for agriculture,
peaking in deforestation around 1850 (Foster et al. 2002).
Wide-spread farm abandonment throughout New England
in the latter half of the nineteenth and early twentieth
centuries initially resulted in an increase of early-succes-
sional habitat, with a concurrent increase in New England
cottontail populations (Litvaitis 1993). However, this type
of habitat is ephemeral and is only ideal for cottontails for a
span of approximately 15 years. About 25 years after
abandonment, idle fields become reforested, causing much
Fig. 1 Historic range (ca. 1960)
and current distribution of the
New England cottontail (NEC)
in the northeastern United
States. Remnant populations are
found in five geographic
locations: seacoast region of
southern Maine and New
Hampshire (MENH);
Merrimack River valley of
New Hampshire (NH-MV);
Cape Cod, Massachusetts (CC);
eastern Connecticut and Rhode
Island (CTRI); western
Connecticut, southeastern
New York, and southwestern
Massachusetts (CTNY). Historic
range GIS data obtained from
Patterson et al. (2007) and
modified based on Tash and
Litvaitis (2007)
Conserv Genet
123

of the understory vegetation to die out and hence become
unsuitable for cottontails (Litvaitis et al. 2008). By about
1960, most abandoned agricultural lands had become
reforested and New England cottontail habitat drastically
diminished, resulting in New England cottontail population
decline (Litvaitis 2003). Increased development in New
England in the last 50 years has resulted in further frag-
mentation of the remaining suitable habitat. Consequently,
New England cottontails have not simply returned to pre-
settlement population levels, but instead are suffering
continuous population decline (Litvaitis 2003; Litvaitis
et al. 2006; Tash and Litvaitis 2007).
As a consequence of forest maturation and land-use
changes, current habitat of New England cottontails is
largely characterized as small, isolated patches of native
shrublands or young forests. Remnant patches span
approximately 14% (12,180 km2) of the 90,000 km2 his-
torically occupied range (ca. 1960; Fig. 1; Litvaitis et al.
2006). A recent range-wide inventory found that the spe-
cies currently exists in five geographically disjunct loca-
tions (hereafter referred to as geographic populations):
southern Maine and southeastern New Hampshire
(MENH); the Merrimack Valley in central New Hampshire
(NH-MV); Cape Cod, Massachusetts (CC); parts of eastern
Connecticut and Rhode Island (CTRI); and western Con-
necticut, southeastern New York and southwestern Mas-
sachusetts (CTNY). The approximate area occupied by
these populations ranges from 1,260 km2 for NH-MV to
4,760 km2 for CTNY (Litvaitis et al. 2006). Cottontail
abundance within these areas is unknown, with the
exception of a rough estimate of approximately 300 rabbits
in Maine (the majority of the area occupied by the MENH
population; Litvaitis and Jakubas 2004); recent evidence
shows this population has declined further since that esti-
mate (Fenderson and Kovach, unpublished data). Range-
wide, Litvaitis et al. (2006) only detected New England
cottontails in 7% of the 2,301 patches of suitable habitat
searched. Further, many of these patches were small
(\3 ha) and likely only supported 3–4 rabbits within a
highly fragmented landscape. The long-term viability of
remnant New England cottontail populations is at risk
(Litvaitis and Villafuerte 1996; Litvaitis 2001; Litvaitis
et al. 2006). For these reasons, the New England cottontail
is currently a candidate for federal listing under the
Endangered Species Act and is considered to be, along with
several other early-successional obligate species, one of the
species of greatest conservation need in all New England
states and New York (USFWS 2006, 2009).
As a result of the severe habitat loss, range contraction,
and population decline, the New England cottontail may be
at risk for deleterious population effects such as loss of
genetic diversity and extinction (e.g., Ciofi and Bruford
1999; Bijlsma et al. 2000). Its protection and recovery will
require an understanding of not only its ecology but also its
population genetic structure. The latter will yield insight
into the genetic connectivity of remnant populations and
indicate which populations are the most genetically iso-
lated and most in need of restoration management.
To address these needs, we investigated the genetic
structure of the remaining New England cottontail popu-
lations. Our objectives were to assess levels of genetic
variation within, as well as genetic differentiation and gene
flow among, the five geographically isolated populations.
We also infer patterns of demographic history, including
tests to assess the relative influence of genetic drift versus
drift-migration equilibrium and to determine if there are
genetic signatures of recent population bottlenecks. Our
results are aimed to inform resource managers about the
processes that have shaped the genetic diversity of these
remnant populations and what they imply for the conser-
vation of the species given the current landscape structure.
Methods
Sample collection and DNA extraction
New England cottontail tissue (n = 153) and fecal pellet
(n = 81) samples were obtained from range-wide live-
trapping or noninvasive surveys conducted between 1990
and 2009. Two opportunistically collected road-kill samples
were also used. Both pellet and tissue sample locations were
distributed throughout the range of each of the five geo-
graphic populations, to the extent occupied patches were
present (Fig. 1). Pellets comprised 3% (in CTRI) to 73% (in
CC) of the samples from each geographic population. All
samples were stored at -20�C prior to extraction.
DNA was extracted from the tissue samples using a
standard phenol–chloroform–isopropanol extraction (Lit-
vaitis and Litvaitis 1996) or by using the DNeasy Blood
and Tissue Kit (Qiagen, Valencia, Calif.), following the
manufacturer’s instructions. DNA was extracted from fecal
pellets using the QIAamp� DNA Stool Mini Kit (Qiagen,
Valencia, Calif.), following the manufacturer’s instructions
with minor modifications, as described in Kovach et al.
(2003). Due to the possible presence of other sympatric
lagomorph species (snowshoe hare, Lepus americanus;
eastern cottontail, Sylvilagus floridanus) in the surveyed
sites, all pellets were first identified to species using a
diagnostic RFLP analysis (Litvaitis and Litvaitis 1996;
Kovach et al. 2003).
Microsatellite genotyping
DNA samples were amplified at 16 microsatellite markers
using multiplexed PCR and published protocols optimized
Conserv Genet
123
for this study (Electronic supplementary Table S1). These
loci were developed for the European wild rabbit (Oryc-
tolagus cuniculus—Sol03—Rico et al. 1994; Sol44—Sur-
ridge et al. 1997; Sat3, Sat7, Sat 12, Sat13—Mougel et al.
1997; INRACCDDV016, INRACCDDV021, INRACCDD
V0100, INRACCDDV0106, INRACCDDV0241, INRACC
DDV0259, INRACCDDV0326 (SRY marker)—Chantry-
Darmon et al. 2005 (hereafter, all INRA primer names have
been abbreviated to ‘INRA’ followed by the last three
digits of the primer name); D6Utr4—Korstanje et al. 2003)
and two South African hares (Lepus saxatilis and L. cap-
ensis—Lsa1, Lsa8—Kryger et al. 2002). Samples were
genotyped using fluorescent dye-labeled primers and an
automated DNA sequencer (ABI 3130, Applied Biosys-
tems, Foster City, CA). Alleles were manually scored and
genotypes determined for each individual using Peak
Scanner 1.0 (Applied Biosystems, Foster City, CA).
We used a multiple-tubes approach of at least three
amplifications to detect and eliminate genotyping errors for
the pellet samples, since they yielded lower quality and
quantity of DNA than the tissue samples (Taberlet et al.
1996). If the DNA sample was exhausted before three
replicate genotypes could be obtained, we retained a
genotype at a given locus if it successfully amplified twice
and an identical genotype was obtained each time. While
we may have slightly overestimated homozygosity with
this method, pellets comprised only a quarter of the sam-
ples in our dataset, and of those, only 12% of the single
locus pellet genotypes were determined to be homozygous
from only two replicates. Raw genotypes were binned
using FlexiBin V2 (Amos et al. 2007) and a consensus
multilocus genotype for each sample was manually created.
Samples missing data at four or more loci were excluded
from analyses.
To quantify pellet sample genotyping error rates, we
manually compared all replicate genotypes to the consen-
sus genotype and calculated per allele and per locus error
rates as the number of mismatches between the consensus
and replicate genotypes, following Eqs. 1 and 2 of Pomp-
anon et al. (2005). Mean genotyping error was 0.04 per
allele and 0.08 per locus (see Electronic Supplementary
Table S2 for per locus error rates). Because we were unable
to use species-specific primers, the possible presence of
null alleles was a concern. The program INEST (Chybicki
and Burczyk 2009) was used to simultaneously estimate
the presence of null alleles and inbreeding coefficients,
using the individual inbreeding model and 1,000,000 iter-
ations of the Gibbs sampler. We also estimated null allele
frequencies using the method of Dempster et al. (1977) and
generated a null allele (NA) corrected dataset in FreeNA
(Chapuis and Estoup 2007) using 10,000 replicates. We
used this dataset in addition to the original dataset for
determining the degree of population differentiation.
Descriptive statistics
To ensure that resampled individuals were not used in these
analyses, we identified unique genotypes using the com-
puter program DROPOUT (McKelvey and Schwartz
2005). We evaluated the discriminatory power of our loci
using the more conservative probability of identity statistic
for related individuals (PID-SIB), as it is appropriate for
wildlife populations that may be comprised of close rela-
tives or for small populations that may be inbred (Waits
et al. 2001).
We tested for deviations from Hardy–Weinberg and
linkage equilibrium with GENEPOP 3.4 (Raymond and
Rousset 1995) and significance was evaluated using an
adjusted P-value corresponding to a = 0.05 after false
discovery rate (FDR) control (Benjamini and Hochberg
2000) as implemented in Excel Spreadsheet Tabulator
(Verhoeven et al. 2005). Observed and expected hetero-
zygosities and the number and frequency of private alleles
were also calculated in GENEPOP. The inbreeding coef-
ficient FIS was calculated in FSTAT (Goudet 1995) and
significance determined using the FDR control. Number of
alleles, allelic richness, and private allelic richness were
calculated in HP-RARE (Kalinowski 2005), which uses the
rarefaction method to correct for sample size differences.
Population differentiation and structure
Genetic differentiation among geographic populations was
measured using pairwise FST calculated in FSTAT, with
significance determined using the FDR control. A Mantel
test was performed in the R statistical software (R Devel-
opment Core Team 2006) with the vegan package (Oksa-
nen et al. 2010) to test for isolation by distance among
populations. We used the natural log of the shortest esti-
mated overland distance between the approximate centers
of the geographical populations and FST/(1 - FST) as the
genetic distance.
Population structure was also evaluated using two
individual-based, Bayesian clustering methods: STRUC-
TURE 2.3.3 (Pritchard et al. 2000) and TESS 2.3 (Chen
et al. 2007). We conducted 20 runs of STRUCTURE at
each K (the number of putative genetically-defined popu-
lations) from 1 to 10 with a burn-in of 100,000 iterations
and run-length of 500,000 iterations. Because the five
geographic populations are spatially disjunct, we used the
no admixture model and assumed independent allele fre-
quencies. The optimal K was determined both by exam-
ining the plateau of the ln Pr(X|K) as suggested by
Pritchard et al. (2000) and by calculating the second order
rate of change in the likelihood of K (DK) (Evanno et al.
2005). Although STRUCTURE has a model to incorporate
data with null alleles (Falush et al. 2007), it was not
Conserv Genet
123
utilized due to its reported lack of improved performance
over the other models and because the influence of null
alleles on these types of analyses is most likely minimal
(Carlsson 2008).
For comparison, we also used TESS 2.3 (Chen et al.
2007) to estimate the number and locations of genetically
similar clusters. Unlike STRUCTURE, TESS incorporates
the spatial sampling locations into the analyses to assess
genetic cluster membership. We used the no admixture
model and conducted twenty runs at each K from 2 to 10
with 600,000 total sweeps including a burn-in of 100,000
sweeps. The interaction parameter was set to 0.6 and the
deviance information criterion (DIC) was averaged across
runs for each K. The average DIC was then plotted against
K and the optimal K was determined from the beginning of
the plateau as well as stabilization of the barplots, as rec-
ommended by Durand et al. (2009).
Detection of migrants and recent gene flow
Using the results from the cluster analyses described above,
samples from the geographic populations were regrouped
according to their genetic cluster assignment (hereafter
referred to as genetic populations or genetic clusters) and
this prior knowledge was incorporated in STRUCTURE to
detect migrants and individuals with migrant ancestry. We
tested a range of migration values (0.001–0.1) and assessed
whether individuals or their immediate ancestors (up to two
generations back) had migrant ancestry by setting GENS-
BACK = 2 (Pritchard et al. 2000).
Self-assignment tests and population simulations to test
for first generation migrants were also conducted in
GENECLASS 2.0 (Piry et al. 2004). The assignment test
was performed using the Rannala and Mountain (1997)
Bayesian method. Detection of migrants was conducted
using the L_home/L_home_max criterion with Monte
Carlo resampling (Paetkau et al. 2004) and an alpha level
of 0.01.
Population history and genetic diversity
We performed several analyses to examine genetic vari-
ability and recent population processes. To assess genetic
variability among the genetic clusters, we compared allelic
richness using a one-way analysis of variance (ANOVA),
blocked by locus in JMP8 (SAS Institute, Cary, NC).
Effective population sizes (Ne) of each genetic cluster were
estimated using two methods—a linkage disequilibrium
method as performed in LDNe (Waples 2006), using 0.05
as the lowest allele frequency, and a Bayesian method
implemented in ONeSAMP (Tallmon et al. 2008). To test
for recent genetic bottlenecks, we used two approaches
known to differ in their sensitivity for detecting bottlenecks
of different time scales and durations (Williamson-Natesan
2005): BOTTLENECK 1.2.02 (Piry et al. 1999) and the
M-ratio method (Garza and Williamson 2001). We ran
1000 replications in BOTTLENECK with all mutation
models, assuming 88% stepwise mutation and 12% infinite
allele mutation to coincide with the model parameters used
in the M-ratio test (see below), and set the variance among
multiple steps to 12. We assessed the results with the
Wilcoxon signed-rank test of heterozygosity excess and the
allele frequency mode-shift test (Luikart et al. 1998). To
calculate the M-ratio, since historic effective population
sizes are unknown, we compared results using both an
approximation of a maximum, historic Ne of 5,000 per
population and the mean of our estimates of the current Ne
of each cluster obtained using LDNe and ONeSAMP. We
considered these to be the two extremes of effective pop-
ulation sizes; the upper estimate of 5,000 is based on the
large population sizes that would have had to exist to
support historic reports of large cottontail harvests (e.g.,
33,000 cottontails hunted annually in Vermont in 1944;
Foote, as cited in Eabry 1983). We then calculated Hassuming l = 5 9 10-4. The softwares M_P_Val.exe and
Critical_M.exe were used for the simulations (available at
http://swfsc.noaa.gov/textblock.aspx?Division=FED&id=
3298). The mean size for non-single step mutations was set
to 2.8 and the percent of mutations larger than single step
was 0.12, as these were the average parameter values found
in a literature survey by Garza and Williamson (2001).
We further evaluated how long populations have been
isolated by examining whether populations have been more
affected by genetic drift or are in migration-drift equilibrium.
We tested this with the program 2MOD, using 100,000
iterations (Ciofi and Bruford 1999). This analysis compares
the relative likelihood that a population’s gene frequencies
are the result of a balance between drift and immigration or if
the gene frequencies are the result of the population
diverging in isolation. We evaluated the relative importance
of drift to gene flow in each population by modeling the
posterior distribution of F. We used LOCFIT (Loader 1999)
implemented in the R statistical package to graph the pos-
terior distributions and summarized the distribution by the
mode and 95% highest posterior density interval (HPDI),
which were calculated using the hdrcde (Hyndman 2010)
and boa (Smith 2005) packages, respectively.
Results
Descriptive statistics
Two hundred samples successfully amplified (tissue:
n = 149; pellet: n = 51) at 13 or more loci and were
examined for duplicate genotypes. PID-SIBS for females at
Conserv Genet
123

the fifteen autosomal loci was 5.340 9 10-4, meaning for
every 1873 (closely-related) females, each individual
should have a unique multilocus genotype. Males could be
distinguished with even greater certainty, with a PID-SIBS of
2.892 9 10-4. This was due to the polymorphism of the
SRY marker, as well as a characteristic of this marker
(probably a gene duplication event—see Geraldes and
Ferrand 2006) that resulted in many male individuals
having heterozygous genotypes at this locus. These prob-
abilities of identity indicate sufficient power for detecting
unique individuals. Eight pairs of duplicated samples were
found. For each pair, a randomly selected sample was
removed from the dataset, unless one duplicate was a tissue
sample and the other a pellet sample, in which case the
tissue sample was retained. The sex ratio was slightly
male-biased overall, with 0.9 females identified for every
male. The sex ratio within most populations was nearly
equal, although there were twice as many male samples
analyzed from CC (1 M:0.47 F), while more females were
sampled in MENH (1 M:1.23 F).
Two loci (INRA100 and INRA021) exhibited very low
polymorphism (Ho: 0.014 and 0.016, respectively) and
were excluded from further analyses. Null allele frequency
estimates from FreeNA ranged from essentially 0 to 20%
and INEST estimates, while comparable in most cases,
were slightly higher for all loci in all populations (range
3.7–27.6%; Electronic Supplementary Table S3). Devia-
tions from HWE at a number of loci in each population
were detected (Electronic Supplementary Table S4).
Overall, only the NH-MV population did not show sig-
nificant deviation from HWE (P = 0.0881). Several locus
pairs also showed evidence of linkage disequilibrium,
primarily within the CTNY population (Sat12/Lsa1,
D6Utr4/INRA241, Sol44/INRA259) and one pair was
significant for the CTRI population (Sat3/INRA16). Given
the population-specific nature of the linkage disequilib-
rium, it is not likely a result of physical chromosomal
linkage nor a concern for further analyses. Linkage dis-
equilibrium is often found in small populations and may be
a result of subdivisions within the population sample or
recent fragmentation (Frankham et al. 2002; Zartman et al.
2006).
The number of alleles in each population, averaged across
loci, ranged from 2.9 to 4.7 (Table 1). Average allelic rich-
ness was lowest in the MENH population (2.6) and highest in
the CTNY population (4.0). Observed heterozygosity ranged
from 0.223 in MENH to 0.492 in CTNY and was lower in all
cases than the unbiased expected heterozygosity (range
0.288–0.555). Numerous private alleles were found in the
CC and CTNY population and only the NH-MV population
lacked any private alleles (see Electronic Supplementary
Table S5 for per locus allele frequency distributions in each
geographic population). Estimated FIS values calculated in
INEST were much smaller than those calculated in FSTAT.
All inbreeding coefficients calculated in FSTAT with the
original dataset were significantly positive; however none
were significantly different from zero when null alleles were
acknowledged.
Population differentiation and structure
All geographic populations were significantly differenti-
ated from each other, using both the original (overall
FST = 0.145) and the null allele corrected datasets (overall
FST = 0.121; Table 2). In general, the MENH population
was most differentiated from the remaining populations,
but had the lowest FST when compared with the NH-MV
population. Cape Cod was also highly differentiated from
the other populations. There was a significant signal of
isolation by distance among the five populations (Mantel
test, y = 0.1132x - 0.4766; r2 = 0.5649; P = 0.03).
Analyses in STRUCTURE indicated the presence of five
genetic clusters (Fig. 2), however not exactly correspond-
ing to the five geographically delimited populations. The
MENH and NH-MV populations clustered together (here-
after referred to as ME/NH) and the eastern CTRI popu-
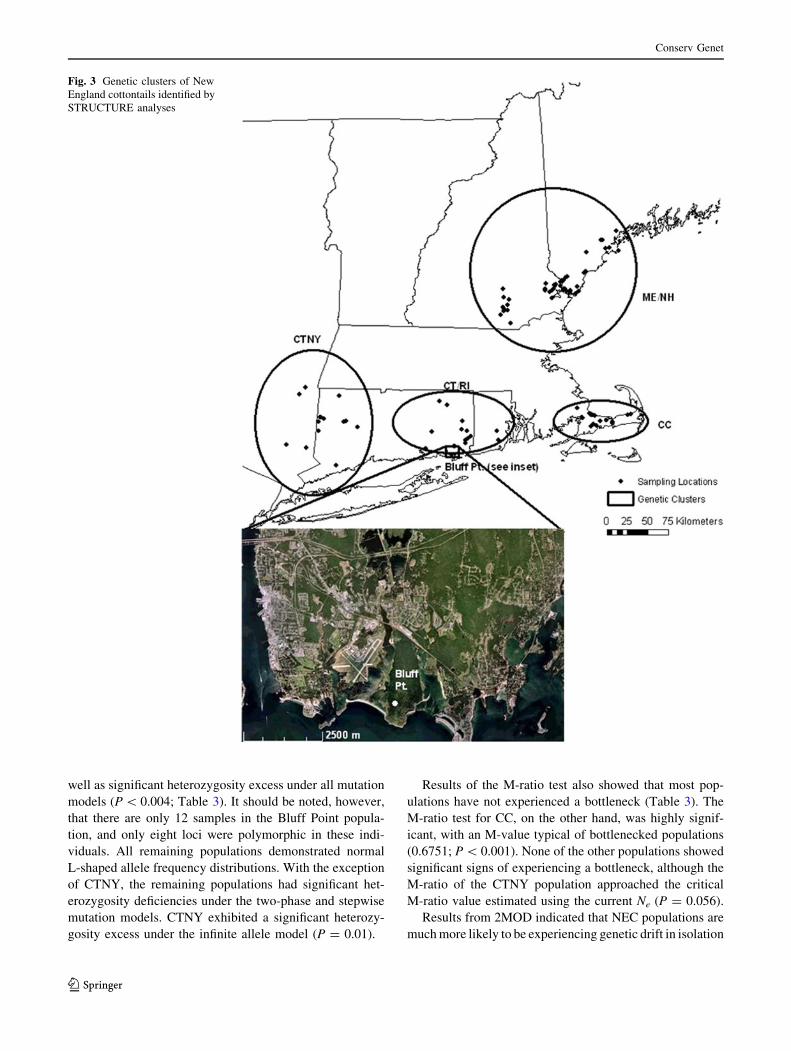
lation differentiated into two clusters (Fig. 3). Closer
examination of the eastern CTRI populations revealed that
Table 1 Genetic diversity of the five geographic populations of the New England cottontail
Populationa (N) Alleles Allelic Richness Ho UHe Private alleles FIS FSTAT/INEST
MENH (58) 3.2 2.6 0.223 0.288 1 (0.17) 0.229*/0.017
NH-MV (14) 2.9 2.9 0.287 0.338 0 (0.12) 0.157/0.017
CC (25) 3.7 3.1 0.277 0.346 9 (0.62) 0.203*/0.013
CTRI (57) 4.6 3.4 0.371 0.442 2 (0.20) 0.162*/0.036
CTNY (38) 4.7 4.0 0.492 0.555 8 (0.77) 0.115*/0.012
a Population abbreviations as in Fig. 1; sample size in parentheses. Alleles, allelic richness, observed heterozygosity (Ho), Nei’s unbiased
heterozygosity (UHe) and FIS (calculated both in FSTAT using the original dataset and in INEST using a null-allele corrected dataset—see text)
are averaged across loci. Private alleles are the total number of private alleles (and private allelic richness, averaged across loci) for all loci in
each population. FIS significance at the P \ 0.05 level after FDR control is indicated by an asterisk
Conserv Genet
123

one cluster corresponded primarily to a group of individ-
uals found in Bluff Point State Park, a designated coastal
reserve on a peninsula in Groton, CT (Fig. 3; hereafter the
Bluff Point cluster is referred to as ‘Bluff Point’ and
the remaining eastern CT and RI cluster is referred to as
‘CT/RI’).
Results of analyses in TESS were similar to those of
STRUCTURE, as it also grouped MENH and NH-MV and
differentiated the remaining geographic populations.
However, TESS only detected four clusters, as it did not
identify the Bluff Point individuals as a separate cluster
(Figs. 2, 4).
Detection of migrants and recent gene flow
Increasing the migration rate used in the STRUCTURE
assignment test only slightly increased the number of
individuals detected as putative migrants and reduced the
individual resident probabilities by a small amount. As the
differences were minimal and did not affect overall con-
clusions, we only report the results for MIGPRIOR = 0.05.
Given the significant genetic divergence between MENH
and NH-MV, as well as the extensive geographic distance
between the two populations (at least 44 km, which likely
exceeds cottontail dispersal ability), we tested for migrants
using K = 6, keeping MENH and NH-MV as separate
populations and considering Bluff Point as a separate
cluster in both STRUCTURE and GENECLASS assign-
ment tests.
Assignment tests revealed that most individuals were
residents of their sampled populations (82.8% correctly
assigned in GENECLASS, also see Fig. 4). Six individuals
were identified as putative migrants in STRUCTURE and
four individuals may have recent migrant ancestry (Elec-
tronic Supplementary Table S6). GENECLASS identified
the same six individuals as possible migrants, but also three
others, which were considered to have possible migrant
ancestry. Thirteen individuals that were not detected as
migrants in either program but were assigned by both
programs to populations other than the one in which they
were sampled, or had nearly equal Q values in two clusters,
were also considered to be of admixed ancestry. The
majority (17 of 26) of migrants and admixed individuals
were identified as migrating into or out of the CT/RI
population.
Population history and genetic diversity
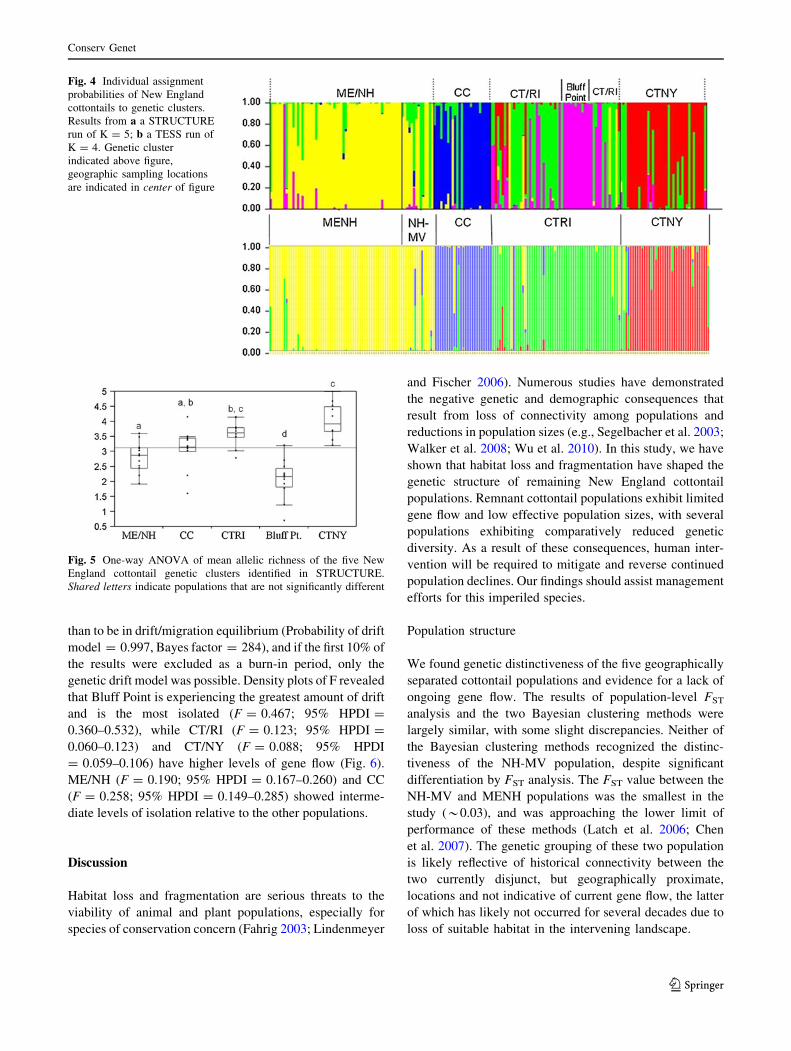
Comparisons of allelic richness using a nested ANOVA
showed significant differences among the five clusters
identified by STRUCTURE (F = 17.05, df = 4, 44,
P \ 0.0001, Fig. 5). The Bluff Point population has sig-
nificantly lower allelic richness than any of the other
populations. The allelic richness of ME/NH was signifi-
cantly reduced compared to the CT/RI and CT/NY popu-
lations, and allelic richness of CC was significantly reduced
relative to CT/NY.
With the exception of CT/RI, estimates of current Ne
from both LDNe and ONeSAMP were similar and had
overlapping confidence intervals (Table 3). Ne estimates in
all populations were relatively low and ranged from 13 in
Bluff Point to 233 in CT/RI.
The two methods we used to test for population bottle-
necks produced slightly different results. BOTTLENECK
tests showed evidence of a recent bottleneck for the Bluff
Point population, which had a shifted-mode distribution as
Table 2 Pairwise FST values for the five geographic New England
cottontail populations, calculated using original (above diagonal) and
null allele-corrected FreeNa (below diagonal) datasets
MENH NH-MV CC CTRI CTNY
MENH 0.0343 0.2002 0.1434 0.1753
NH-MV 0.0317 0.1305 0.1045 0.1122
CC 0.1808 0.1249 0.1281 0.1565
CTRI 0.1274 0.0930 0.1267 0.0649
CTNY 0.1609 0.1018 0.1378 0.0622
All FST values were significant after FDR control (a = 0.05)
Fig. 2 Determination of K, the number of genetic clusters of New
England cottontails from: a STRUCTURE analyses: solid line
indicates ln Pr(X|K) (right y-axis); dashed line indicates DK (lefty-axis). b TESS analyses
Conserv Genet
123
well as significant heterozygosity excess under all mutation
models (P \ 0.004; Table 3). It should be noted, however,
that there are only 12 samples in the Bluff Point popula-
tion, and only eight loci were polymorphic in these indi-
viduals. All remaining populations demonstrated normal
L-shaped allele frequency distributions. With the exception
of CTNY, the remaining populations had significant het-
erozygosity deficiencies under the two-phase and stepwise
mutation models. CTNY exhibited a significant heterozy-
gosity excess under the infinite allele model (P = 0.01).
Results of the M-ratio test also showed that most pop-
ulations have not experienced a bottleneck (Table 3). The
M-ratio test for CC, on the other hand, was highly signif-
icant, with an M-value typical of bottlenecked populations
(0.6751; P \ 0.001). None of the other populations showed
significant signs of experiencing a bottleneck, although the
M-ratio of the CTNY population approached the critical
M-ratio value estimated using the current Ne (P = 0.056).
Results from 2MOD indicated that NEC populations are
much more likely to be experiencing genetic drift in isolation
Fig. 3 Genetic clusters of New
England cottontails identified by
STRUCTURE analyses
Conserv Genet
123
than to be in drift/migration equilibrium (Probability of drift
model = 0.997, Bayes factor = 284), and if the first 10% of
the results were excluded as a burn-in period, only the
genetic drift model was possible. Density plots of F revealed
that Bluff Point is experiencing the greatest amount of drift
and is the most isolated (F = 0.467; 95% HPDI =
0.360–0.532), while CT/RI (F = 0.123; 95% HPDI =
0.060–0.123) and CT/NY (F = 0.088; 95% HPDI
= 0.059–0.106) have higher levels of gene flow (Fig. 6).
ME/NH (F = 0.190; 95% HPDI = 0.167–0.260) and CC
(F = 0.258; 95% HPDI = 0.149–0.285) showed interme-
diate levels of isolation relative to the other populations.
Discussion
Habitat loss and fragmentation are serious threats to the
viability of animal and plant populations, especially for
species of conservation concern (Fahrig 2003; Lindenmeyer
and Fischer 2006). Numerous studies have demonstrated
the negative genetic and demographic consequences that
result from loss of connectivity among populations and
reductions in population sizes (e.g., Segelbacher et al. 2003;
Walker et al. 2008; Wu et al. 2010). In this study, we have
shown that habitat loss and fragmentation have shaped the
genetic structure of remaining New England cottontail
populations. Remnant cottontail populations exhibit limited
gene flow and low effective population sizes, with several
populations exhibiting comparatively reduced genetic
diversity. As a result of these consequences, human inter-
vention will be required to mitigate and reverse continued
population declines. Our findings should assist management
efforts for this imperiled species.
Population structure
We found genetic distinctiveness of the five geographically
separated cottontail populations and evidence for a lack of
ongoing gene flow. The results of population-level FST
analysis and the two Bayesian clustering methods were
largely similar, with some slight discrepancies. Neither of
the Bayesian clustering methods recognized the distinc-
tiveness of the NH-MV population, despite significant
differentiation by FST analysis. The FST value between the
NH-MV and MENH populations was the smallest in the
study (*0.03), and was approaching the lower limit of
performance of these methods (Latch et al. 2006; Chen
et al. 2007). The genetic grouping of these two population
is likely reflective of historical connectivity between the
two currently disjunct, but geographically proximate,
locations and not indicative of current gene flow, the latter
of which has likely not occurred for several decades due to
loss of suitable habitat in the intervening landscape.
Fig. 4 Individual assignment
probabilities of New England
cottontails to genetic clusters.
Results from a a STRUCTURE
run of K = 5; b a TESS run of
K = 4. Genetic cluster
indicated above figure,
geographic sampling locations
are indicated in center of figure
Fig. 5 One-way ANOVA of mean allelic richness of the five New
England cottontail genetic clusters identified in STRUCTURE.
Shared letters indicate populations that are not significantly different
Conserv Genet
123

The genetic clustering method of STRUCTURE (but not
TESS) recognized a subdivision within the CTRI popula-
tion, consisting of individuals in Bluff Point State Park.
This coastal reserve is located on a peninsula in south-
eastern Connecticut and is geographically proximate to
nearby cottontail populations (\20 km). However, it is
surrounded by extensive development, including the
Groton-New London Airport, major highways, and the
Northeast Corridor, the busiest passenger rail line in the
U.S. Despite strong evidence of genetic differentiation
(FST = 0.09 between Bluff Point and CT/RI), it is likely
that TESS did not differentiate the Bluff Point individuals
from the rest of CTRI due to the interaction parameter
between the spatial coordinates and genetic data used in the
TESS algorithm. The genetic distinctiveness of the Bluff
Point individuals suggests that they have been isolated
from CT/RI for a relatively long time (for comparison,
FST = 0.03 for MENH vs NH-MV populations, which are
currently separated by a minimum of 44 km, but were
connected several decades ago). Alternately, this may be
the result of a founder effect with little to no recent contact
between groups. The limited genetic variability of this
population and results from tests of population history (see
below) further support the isolation of the Bluff Point
population. Due to the highly fragmented nature of
remaining New England cottontail habitat, small, isolated
patches or clusters of patches, such as Bluff Point, exist
across the species’ current range. These ‘‘populations’’ may
become differentiated due to lack of genetic exchange and
the rapid effects of genetic drift. It is likely that we were
able to identify the genetic distinctiveness of Bluff Point
Table 3 Estimated effective population sizes (Ne) and results of genetic bottleneck tests of New England cottontail genetic clusters
Population Ne LDNea Ne ONeSAMPb BOTTLENECKc Wilcoxon test
probability
BOTTLENECK
mode-shift
M—ratiod Mc
(Ne = 5,000)
Mc
(Ne current)
I.A.M. T.P.M. S.M.M.
ME/NH 152.6
(53.3–infinite)
78.2
(47.1–316.0)
0.867 0.999 1.000 Normal L-shaped 0.865 0.785 0.856
CC 39.2
(11.5–infinite)
34.9
(26.5–55.6)
0.867 0.974 0.995 Normal L-shaped 0.675* 0.731 0.865
CT/RI 47.7
(28.8–99.3)
232.6
(126.4–922.7)
0.368 0.980 0.999 Normal L-shaped 0.886 0.762 0.851
Bluff Point 17.0
(2.2–infinite)
13.4
(11.1–18.8)
0.002* 0.002* 0.004* Shifted mode 0.901 0.801e 0.869
CTNY 35.7
(23.6–61.3)
76.7
(44.3–193.0)
0.011* 0.812 0.980 Normal L-shaped 0.865 0.755 0.864
* P \ 0.05a Ne values for LDNe method are based on the lowest allele frequency used of 0.05 and the parametric 95% confidence interval is reported in
parenthesesb The mean Ne is reported for the ONeSAMP method with 95% confidence intervalsc For the tests performed in BOTTLENECK, the Wilcoxon one-tail probability of heterozygosity excess for the three mutation models are given,
as well as results of the allelic mode shift testd The M-ratio for each genetic cluster is specified; critical M values (Mc) were calculated both using the mean estimated current Ne for each
population and with Ne = 5,000e Due to the small size of the peninsula, the historic H for Bluff Point was calculated with an estimated Ne of 500
Fig. 6 Posterior density distribution plots of F, the probability of any
two genes sharing a common ancestry within a population, under the
genetic drift in isolation model for each New England cottontail
genetic cluster
Conserv Genet
123

due to a relatively large number of samples collected from
this location, relative to the broader scale sampling effort
across the remainder of CTRI and the other geographic
populations.
Sampling scheme is known to have a significant impact
on the outcome of genetic clustering analyses (Schwartz
and McKelvey 2009; Segelbacher et al. 2010). The broad-
scale sampling effort employed in our study did not enable
us to address substructuring within each geographic pop-
ulation. Given the extent of habitat fragmentation, such
substructuring is likely to occur, especially among occu-
pied patches separated by relatively large geographic dis-
tances. Additional fine-scale sampling of cottontails within
each of the geographic populations would allow detection
of other isolated and genetically distinct patches, such as in
Maine, where a recent fine-scale study detected four dis-
tinct genetic clusters within that population (Fenderson
2010). This finding suggests that numerous genetically
distinct populations might also occur within CTNY and
CTRI, the two geographic populations with the largest
occupied areas.
Although assignment tests in STRUCTURE and
GENECLASS assigned the majority of individuals to their
population of origin, they also identified several individuals
with migrant ancestry and a few individuals as potential
migrants from distant source populations. Of all of the
putative migrants and admixed individuals, the majority
were found to migrate into or out of the CT/RI population.
Assignment test results are typically interpreted as direct
genetic evidence of individual dispersal events (Paetkau
et al. 2004; Bergl and Vigilant 2007). Given the extensive
distances between geographic populations, however, we
interpret these findings as reflective of past connectivity
consistent with the CT/RI population’s central location and
not as evidence for ongoing dispersal between the popu-
lations. Extensive habitat loss throughout the range, espe-
cially between geographic populations, must inhibit, if not
completely prevent, current gene flow across this broad
scale. While there may be unsampled stepping-stone pat-
ches between populations, it is doubtful there are enough
persistently occupied patches to allow for connectivity
between populations (Barbour and Litvaitis 1993). Further,
although long-distance dispersal is not unheard of, it is
uncommon and is unlikely to exceed 10–20 km, based on
maximum dispersal distances of other lagomorphs (e.g.,
Gillis and Krebs 1999; Estes-Zumpf and Rachlow 2009).
Thus, with the exception of perhaps the Bluff Point and
CT/RI genetic clusters, which are less than 20 km apart,
the extensive distances between remnant populations make
it highly improbable that they are currently exchanging
individuals. More likely, we are detecting historic genetic
signatures of connectivity. This interpretation is further
substantiated by the results of population history analyses
in 2MOD, which indicate that the current genetic structure
has been shaped by genetic drift in isolation and that dis-
persal among populations is negligible.
Population history and genetic diversity
The two tests for recent population bottlenecks showed
different results, likely indicative of differences in the
time-scales of population reductions. Only the Bluff Point
population showed a significant bottleneck effect according
to all BOTTLENECK analyses, while the M-ratio method
only detected a significant bottleneck in the CC population.
Based on known differences in the performance of these
methods (BOTTLENECK tests are more likely to detect
recent bottlenecks, e.g., within 40 generations, whereas the
M-ratio tests tend to detect bottlenecks that occurred longer
ago and persisted for a comparatively longer duration;
Williamson-Natesan 2005), the Bluff Point population
likely experienced a more recent population bottleneck
than the CC population, which may have experienced a
more historic reduction that lasted several generations.
The Cape Cod Canal, which opened in 1914, was wid-
ened significantly in the late 1930s. With a current width of
146 meters at depth, it is the widest sea-level canal in the
world. As such, it is likely a significant dispersal barrier for
the cottontail, and its isolating effect in combination with
habitat loss in this highly developed landscape may have
led to the earlier bottleneck observed in this population.
Estimates of an effective population size below 50 indi-
viduals and reduced allelic richness both point toward a
severe and long-lasting bottleneck of the Cape Cod
population.
Isolation or founding of the Bluff point population, on
the other hand, appears to have occurred more recently
than the isolation of the CC cottontails, as evidenced by
detection of a bottleneck effect by the BOTTLENECK but
not the M-ratio test. Bluff Point State Park, acquired in
1963 and designated a coastal reserve in 1975, is the last
significant piece of undeveloped land along the Connecti-
cut coast. The surrounding development likely functions to
limit or prevent exchange between these individuals and
the closest nearby patches. Arrival of cottontails in Bluff
Point was not the result of wildlife management activities
as there have been no known translocations of cottontails to
the park (H. Kilpatrick, personal communication). Esti-
mates of effective population size indicate that this is a
very small population of less than 20 breeding adults. The
high F-value estimated by 2MOD (F = 0.47) and the
lowest allelic diversity (mean allelic richness = 2.08)
observed in our study further confirm that genetic drift is
acting rapidly in this small, isolated population and influ-
encing its genetic differentiation from the nearest cotton-
tails in CT/RI.
Conserv Genet
123

There was a significant indication of a genetic bottle-
neck in the CTNY population with the heterozygosity
excess test when the I.A.M. model was used and the
M-Ratio method approached significance when H was
calculated with the current effective population size
(P = 0.056). This may indicate that this population has
experienced a recent demographic and genetic bottleneck
as well.
While we did not find evidence for bottleneck effects in
the remaining New England cottontail populations, our
results merit some caveats because of the methods used.
First, both approaches are suited for detecting relatively
rapid losses of genetic diversity and may not be able to
recognize slow and steady or very recent declines, situa-
tions that may be representative of the remaining New
England cottontail populations. Further, the performance of
the tests may have been limited by the presence of null
alleles, which may have influenced the allele distributions
and heterozygosity estimates used in BOTTLENECK
(Cornuet and Luikart 1996).
Results from 2MOD and tests of allelic richness are
consistent with the bottleneck results in showing that the
Bluff Point and CC populations have reduced allelic
diversity and elevated F-values, and thus have been most
strongly influenced by genetic drift. The ME/NH popula-
tion cluster also shows reduced allelic richness relative to
the CT/RI and CTNY populations and is similar to the CC
population in terms of allelic diversity and F-values.
Additionally, the MENH geographic population and the
Bluff Point population are monomorphic at 33% of the loci
examined. These results confirm recent survey efforts
(Fenderson 2010), which indicate the ME/NH population
cluster is suffering an ongoing decline. The genetic data
indicate that the CTNY and CT/RI populations, while also
experiencing appreciable genetic drift, have suffered the
least in terms of reductions in population size and genetic
diversity.
Null alleles and deviations from Hardy–Weinberg
equilibrium
The primers used in this study were developed for distantly
related lagomorph species, which likely contributed to the
relatively high frequency of null alleles observed. Most
methods of null allele estimation assume populations are in
HWE (e.g., van Oosterhout et al. 2004). However, we did
not consider this a valid assumption for the New England
cottontail. Given the geographical segregation of currently
occupied patches (Litvaitis et al. 2006) and short expected
dispersal distances typical of lagomorphs (*3 km on
average, Gillis and Krebs 1999; Estes-Zumpf and Rachlow
2009), we considered inbreeding to be possible. Therefore,
we utilized INEST to simultaneously estimate null allele
frequencies and inbreeding within populations. This
method determined relatively low inbreeding coefficients
for each population, indicating that the observed homozy-
gosity excess was driven primarily by null alleles and not
inbreeding.
Deviations from HWE may also be a result of the Wa-
hlund effect. The linkage disequilibrium found among
three pairs of loci in CTNY and one locus pair in CTRI
point toward this possibility. While it is quite probable that
subdivisions exist within each of the geographic popula-
tions, our sampling scheme was not on a fine enough scale
to detect them (Fenderson 2010). Further, the Bayesian
clustering methods we used are designed to group indi-
viduals so as to minimize deviations from HWE that would
be caused by the Wahlund effect. FIS values and Hardy–
Weinberg probabilities were not significantly different
before and after genetic clustering (data not shown), sug-
gesting that the Wahlund effect was not the primary cause
of the deviations from HWE.
Conservation implications
All remnant New England cottontail populations have
relatively low genetic diversity and small effective popu-
lation sizes. Small effective population sizes are cause for
concern because they are indicative of increased suscepti-
bility to genetic stochasticity and are correlated with
reduced genetic diversity and increased inbreeding, all of
which heighten the probability of population extinction
(Palstra and Ruzzante 2008). The estimated effective
population sizes for New England cottontails are insuffi-
cient for long-term, and in some cases short-term, popu-
lation persistence (Franklin 1980; Soule 1980; Franklin and
Frankham 1998; Lynch and Lande 1998). Given the
observed genetic consequences, and the lack of current
gene flow among remnant populations, human intervention
is warranted to mitigate further declines.
Conservation measures should focus on maintaining and
expanding current populations, as well as promoting con-
nectivity within and among populations (Tash and Litvaitis
2007). These efforts should include augmenting population
sizes in all portions of the species’ range, but especially in
the ME/NH and CC populations, as well as stabilizing the
Bluff Point population. These three populations show the
greatest reduction in genetic diversity and the strongest
effects of genetic drift. The CC and Bluff Point populations
show signs of significant past population size reductions,
while a reduction in ME/NH appears to be ongoing. From a
conservation standpoint, efforts to maintain all geographi-
cally distinct populations are advisable, to decrease the risk
of stochastic extinction (Frankham et al. 2002). In addition,
the strong differentiation among these populations indi-
cates that each population could represent a potential
Conserv Genet
123

reservoir of genetic diversity available to the others. From
a practical standpoint, conservation of the CC and ME/NH
populations warrants prioritization, as these comprise the
last remaining New England cottontails from a large geo-
graphic area—Maine, New Hampshire and Massachusetts,
whereas the cottontails in Bluff Point comprise a small
(both geographically and in terms of population size),
recently isolated subpopulation of the larger CT/RI geo-
graphic population.
Given their small population sizes and reduced genetic
diversity, it may be prudent to consider genetic rescue of
the ME/NH, CC (and Bluff Point) populations via trans-
locations from the more diverse CT/RI & CTNY popula-
tions. Although translocations may alleviate the risk of
inbreeding depression, the risk of outbreeding depression is
also a serious concern, as it has been shown to diminish
reproductive success, decrease viral resistance, and nega-
tively impact survival (e.g., Marr et al. 2002; Goldberg
et al. 2005). Conservative measures propose minimizing
the risk of outbreeding depression by only initiating
translocation plans when inbreeding depression is apparent
(Edmands 2007; Hedrick and Fredrickson 2010). Our
results do not provide conclusive evidence that New Eng-
land cottontails are currently inbred. While all populations
exhibited relatively low mean heterozygosity, which is
often correlated with inbreeding (e.g., Slate et al. 2000;
Shikano and Taniguchi 2002; Reed and Frankham 2003;
but see Coltman and Slate 2003; Balloux et al. 2004; Alho
et al. 2009), this may have been confounded by the pres-
ence of null alleles; the inbreeding coefficient was very low
once null alleles were taken into account. Further research
is needed to assess whether there are manifestations of
inbreeding depression in individual rabbits. Additionally,
non-native eastern cottontails (S. floridanus), while now
sympatric throughout most of the New England cottontail
range, have not yet expanded into Maine. Thus transloca-
tion of cottontails from other geographic populations into
Maine also risks accidental introduction of eastern cot-
tontails into a state where they have not previously existed.
Such an introduction may exacerbate New England cot-
tontail decline and hinder management and conservation
efforts in Maine. These concerns should be given serious
consideration prior to initiation of inter-population trans-
locations. Therefore, we suggest that it may be more ben-
eficial in the short-term to promote genetic exchange within
populations via translocation and reintroduction methods,
while habitat reconstruction projects are pursued.
Species recovery for the New England cottontail will
require habitat reconstruction and restoration of connectivity
within and among remnant populations, while further
research is conducted to assess if there is evidence of
inbreeding depression and reduced fitness. Extensive
research has been conducted on the habitat requirements of
New England cottontails (e.g., Barbour and Litvaitis 1993;
Litvaitis et al. 2003). Litvaitis (2001) described several
recommendations on how to maintain and establish early
successional habitat, and Tash and Litvaitis (2007) identified
habitats across the species’ range that are highly suitable for
restoration. Remaining populations are so fragmented that
they will first require intensive management to restore con-
nectivity among patches within the populations, and within
population translocations to simulate gene flow in the short-
term may be necessary. Once geographic populations are
sustainable, reestablishing connectivity among populations
and eventually reintroducing cottontails to historically
occupied parts of the range (e.g., Vermont) will help ensure
the persistence of this species.
In conclusion, we make the following recommendations
for future research and immediate conservation actions on
behalf of the New England cottontail.
• Implement habitat restoration efforts immediately to
increase available habitat and connectivity among
patches within each geographic population.
• Continue monitoring occupancy and population status
of all range-wide populations to ensure that goals of
population sustainability are being met.
• Initiate intensive surveys and fine-scale sampling
efforts within each geographic region to identify
additional population subdivisions and to better esti-
mate effective population sizes range-wide; these
efforts will also allow for the identification of poten-
tially isolated populations that may require focused
resource management to restore connectivity.
• Conduct studies of reproductive fitness to assess
whether there is evidence of inbreeding depression;
knowledge of reproductive and demographic parame-
ters will also be useful in constructing population
viability models for the species.
• Based on occupancy monitoring, employ reintroduc-
tions to restored habitat, if necessary, to promote
genetic exchange and population augmentation within
geographic populations.
• Avoid translocations between geographic populations
unless it becomes justified by future findings of inbreed-
ing depression; if translocations become warranted, use
geographically proximate source populations.
Acknowledgments We are grateful to the many agency biologists,
volunteers, former students and technicians for their assistance with
trapping and pellet collection, including, Walter Jakubas, Kate
O’Brien, Kelly Boland, Steven Fuller, Howard Kilpatrick, Paul
Novak, Brian Tefft, Mike Marchand, Brian Johnson, Robin Innes,
Vanessa Johnson, and Jim Panaccione. Melanie Schroer, Elisha Allan,
Grace Smarsh, Samantha Petren, Cynthia Sirois and Allison Citro
helped with DNA extractions and species identifications. Funding for
this research was provided by the United States Fish and Wildlife
Service, Maine Department of Inland Fisheries and Wildlife, and the
Conserv Genet
123

Maine Outdoor Heritage Fund. We thank Anthony Tur, Kate O’Brien
and Walter Jakubas for their support. Stephanie Coster, Jennifer
Walsh, Daniel Brubaker, Charlotte Gabrielsen and two anonymous
reviewers provided helpful comments on earlier versions of this
manuscript. Partial funding was provided by the New Hampshire
Agricultural Experiment Station. This is Scientific Contribution
Number 2447.
References
Alho JS, Lillandt B-G, Jaari S, Merila J (2009) Multilocus hetero-
zygosity and inbreeding in the Siberian jay. Conserv Genet
10:605–609
Amos W, Hoffman JI, Frodsham A, Zhang L, Best S, Hill AVS
(2007) Automated binning of microsatellite alleles: problems
and solutions. Mol Ecol Notes 7:10–14
Balloux F, Amos W, Coulson T (2004) Does heterozygosity estimate
inbreeding in real populations? Mol Ecol 13:3021–3031
Barbour MS, Litvaitis JA (1993) Niche dimensions of New England
cottontails in relation to habitat patch size. Oecologia
95:321–327
Benjamini Y, Hochberg Y (2000) On the adaptive control of the false
discovery rate in multiple testing with independent statistics.
J Educ Behav Stat 25:60–83
Bergl RA, Vigilant LA (2007) Genetic analysis reveals population
structure and recent migration within the highly fragmented
range of the Cross River gorilla (Gorilla gorilla diehli). Mol
Ecol 16:501–516
Bijlsma R, Bundgaard J, Boerema AC (2000) Does inbreeding affect
the extinction risk of small populations?: predictions from
Drosophila. J Evol Biol 13:502–514
Carlsson J (2008) Effects of microsatellite null alleles on assignment
testing. J Hered 99:616–623
Chantry-Darmon C, Urien C, Hayes H, Bertaud M, Chadi-Taourit S,
Chardon P, Vaiman D, Rogel-Gaillard C (2005) Construction of
a cytogenetically anchored microsatellite map in rabbit. Mamm
Genome 16:442–459
Chapman JA, Cramer KL, Dippenaar NJ, Robinson TJ (1992)
Systematics and biogeography of the New England cottontail,
Sylvilagus transitionalis (Bangs, 1895), with the description of a
new species from the Appalachian Mountains. Proc Biol Soc
Wash 105:841–866
Chapuis M-P, Estoup A (2007) Microsatellite null alleles and estima-
tion of population differentiation. Mol Biol Evol 24:621–631
Chen C, Durand E, Forbes F, Francois O (2007) Bayesian clustering
algorithms ascertaining spatial population structure: a new
computer program and a comparison study. Mol Ecol Notes
7:747–756
Chybicki IJ, Burczyk J (2009) Simultaneous estimation of null alleles
and inbreeding coefficients. J Hered 100:106–113
Ciofi C, Bruford MW (1999) Genetic structure and gene flow among
Komodo dragon populations inferred by microsatellite loci
analysis. Mol Ecol 8:S17–S30
Coltman DW, Slate J (2003) Microsatellite measures of inbreeding: a
meta-analysis. Evolution 57:971–983
Cornuet JM, Luikart G (1996) Description and power analysis of two
tests for inferring recent population bottlenecks from allele
frequency data. Genetics 144:2001–2014
Dempster AP, Laird NM, Rubin DB (1977) Maximum likelihood
from incomplete data via the EM algorithm. J Roy Stat Soc B
Met 39:1–38
Dixo M, Metzger JP, Morgante JS, Zamudio KR (2009) Habitat
fragmentation reduces genetic diversity and connectivity among
toad populations in the Brazilian Atlantic Coastal Forest. Biol
Conserv 142:1560–1569
Durand E, Chen C, Francois O (2009) TESS version 1.3—reference
manual
Eabry S (1983) The New England cottontail, Sylvilagus transitionalis:
an annotated bibliography. Unpublished report, 50 pp (Available
by request from corresponding author)
Edmands S (2007) Between a rock and a hard place: evaluating the
relative risks of inbreeding and outbreeding for conservation and
management. Mol Ecol 16:463–475
Estes-Zumpf WA, Rachlow JL (2009) Natal dispersal by the pygmy
rabbit (Brachylagus idahoensis). J Mammal 90:363–372
Evanno G, Regnaut S, Goudet J (2005) Detecting the number of
clusters of individuals using the software structure: a simulation
study. Mol Ecol 14:2611–2620
Fahrig L (2003) Effects of habitat fragmentation on biodiversity.
Annu Rev Ecol Syst 34:487–515
Falush D, Stephens M, Pritchard JK (2007) Inference of population
structure using multilocus genotype data: dominant markers and
null alleles. Mol Ecol Notes 7:574–578
Fenderson LE (2010) Landscape genetics of the New England
cottontail: effects of habitat fragmentation on population genetic
structure and dispersal. M.S. thesis, University of New Hamp-
shire, Durham, NH
Foster DR, Motzkin G, Bernardos D, Cardoza J (2002) Wildlife
dynamics in the changing New England landscape. J Biogeogr
29:1337–1357
Frankham R, Ballou JD, Briscoe DA (2002) Introduction to conser-
vation genetics. Cambridge University Press, New York
Franklin I (1980) Evolutionary change in small populations. In: Soule
ME, Wilcox BA (eds) Conservation biology: an evolutionary-
ecological perspective. Sinauer Associates, Sunderland,
pp 135–149
Franklin IR, Frankham R (1998) How large must populations be to
retain evolutionary potential? Anim Conserv 1:69–70
Garza JC, Williamson EG (2001) Detection of reduction in population
size using data from microsatellite loci. Mol Ecol 10:305–318
Geraldes A, Ferrand N (2006) A 7-bp insertion in the 30 untranslated
region suggests the duplication and concerted evolution of the
rabbit SRY gene. Genet Sel Evol 38:313–320
Gillis EA, Krebs CJ (1999) Natal dispersal of snowshoe hares during
a cyclic population increase. J Mammal 80:933–939
Godin AJ (1977) Wild mammals of New England. John Hopkins
University Press, Baltimore
Goldberg TL, Grant EC, Inendino KR, Kassler TW, Claussen JE,
Philipp DP (2005) Increased infectious disease susceptibility
resulting from outbreeding depression. Conserv Biol 19:455–462
Gonzalez-Suarez M, Flatz R, Aurioles-Gamboa D, Hedrick PW,
Gerber LR (2009) Isolation by distance among California sea
lion populations in Mexico: redefining management stocks. Mol
Ecol 18:1088–1099
Goudet J (1995) FSTAT (Version 1.2): a computer program to
calculate F-statistics. J Hered 86:485–486
Hall ER, Kelson KR (1959) The mammals of North America. Ronald
Press Company, New York
Hansen BD, Taylor AC (2008) Isolated remnant or recent introduc-
tion? Estimating the provenance of Yellingbo Leadbeater’s
possums by genetic analysis and bottleneck simulation. Mol Ecol
17:4039–4052
Hedrick PW, Fredrickson R (2010) Genetic rescue guidelines with
examples from Mexican wolves and Florida panthers. Conserv
Genet 11:615–626
Hyndman RJ (2010) Package ‘hdrcde’—highest density regions and
conditional density estimation. Version 2.14. http://robjhyndman.
com/software/hdrcde. Accessed 15 April 2010
Conserv Genet
123

Johansson M, Primmer CR, Merila J (2007) Does habitat fragmen-
tation reduce fitness and adaptability? A case study of the
common frog (Rana temporaria). Mol Ecol 16:2693–2700
Johnson MS (2000) Measuring and interpreting genetic structure to
minimize the genetic risks of translocations. Aquacult Res
31:133–143
Kalinowski ST (2005) HP-RARE 1.0: a computer program for
performing rarefaction on measures of allelic richness. Mol Ecol
Notes 5:187–189
Keller LF, Waller DM (2002) Inbreeding effects in wild populations.
Trends Ecol Evol 17:230–241
Korstanje R, Gillissen GF, Versteeg SA, van Oost BA, Bosma AA,
Rogel-Gaillard C, van Zutphen LFM, van Lith HA (2003)
Mapping of rabbit microsatellite markers using chromosome-
specific libraries. J Hered 94:161–169
Kovach AI, Litvaitis MK, Litvaitis JA (2003) Evaluation of fecal
mtDNA analysis as a method to determine the geographic
distribution of a rare lagomorph. Wildl Soc Bull 31:1061–1065
Kryger U, Robinson TJ, Bloomer P (2002) Isolation and character-
ization of six polymorphic microsatellite loci in South African
hares (Lepus saxatilis F. Cuvier, 1823 and Lepus capensisLinnaeus, 1758). Mol Ecol Notes 2:422–424
Latch EK, Dharmarajan G, Glaubitz JC, Rhodes OE Jr (2006) Relative
performance of Bayesian clustering software for inferring
population substructure and individual assignment at low levels
of population differentiation. Conserv Genet 7:295–302
Lindenmeyer DB, Fischer J (2006) Habitat fragmentation and
landscape change. Island Press, Washington
Litvaitis JA (1993) Response of early successional vertebrates to
historic changes in land use. Conserv Biol 7:866–873
Litvaitis JA (2001) Importance of early successional habitats to
mammals in eastern forests. Wildl Soc Bull 29:466–473
Litvaitis JA (2003) Are pre-Columbian conditions relevant baselines
for managed forests in the northeastern United States? For Ecol
Manage 185:113–126
Litvaitis JA, Jakubas WJ (2004) New England cottontail (Sylvilagustransitionalis) assessment 2004, 73 p
Litvaitis MK, Litvaitis JA (1996) Using mitochondrial DNA to
inventory the distribution of remnant populations of New
England cottontails. Wildl Soc Bull 24:725–730
Litvaitis JA, Villafuerte R (1996) Factors affecting the persistence of
New England cottontail metapopulations: the role of habitat
management. Wildl Soc Bull 24:686–693
Litvaitis JA, Johnson B, Jakubas W, Morris K (2003) Distribution and
habitat features associated with remnant populations of New
England cottontails in Maine. Can J Zool 81:877–887
Litvaitis JA, Tash JP, Litvaitis MK, Marchand MN, Kovach AI, Innes
R (2006) A range-wide survey to determine the current distribu-
tion of New England cottontails. Wildl Soc Bull 34:1190–1197
Litvaitis JA, Barbour MS, Brown AL, Kovach AI, Oehler JD, Probert BL,
Smith DF, Tash JP, Villafuerte R, Litvaitis MK (2008) Testing
multiple hypotheses to identify causes of the decline of a lagomorph
species: the New England cottontail as a case study. In: Alves P,
Hacklander K (eds) Biology of lagomorphs-evolution, ecology and
conservation. Springer-Verlag, New York, pp 167–185
Loader C (1999) Local regression and likelihood. Springer, New York
Luikart G, Allendorf FW, Cornuet JM, Sherwin WB (1998) Distortion
of allele frequency distributions provides a test for recent
population bottlenecks. J Hered 89:238–247
Lynch M, Lande R (1998) The critical effective size for a genetically
secure population. Anim Conserv 1:70–72
Marr AB, Keller LF, Arcese P (2002) Heterosis and outbreeding
depression in descendants of natural immigrants to an inbred
population of song sparrows (Melospiza melodia). Evolution
56:131–142
Maudet C, Miller C, Bassano B, Breitenmoser-Wursten C, Gauthier
D, Obexer-Ruff G, Michallet J, Taberlet P, Luikart G (2002)
Microsatellite DNA and recent statistical methods in wildlife
conservation management: applications in Alpine ibex [Capraibex (ibex)]. Mol Ecol 11:421–436
McKelvey KS, Schwartz MK (2005) DROPOUT: a program to
identify problem loci and samples for noninvasive genetic
samples in a capture-mark-recapture framework. Mol Ecol Notes
5:716–718
Mougel F, Mounolou JC, Monnerot M (1997) Nine polymorphic
microsatellite loci in the rabbit, Oryctolagus cuniculus. Anim
Genet 28:58–59
Oksanen F, Blanchet FG, Kindt R, Legendre P, O’Hara RB, Simpson
GL, Solymos P, Stevens MHH, Wagner H (2010) vegan:
community ecology package. R package version 1.17-4
http://CRAN.R-project.org/package=vegan. Accessed Oct 2010
Paetkau D, Slade R, Burden M, Estoup A (2004) Genetic assignment
methods for the direct, real-time estimation of migration rate: a
simulation-based exploration of accuracy and power. Mol Ecol
13:55–65
Palstra FP, Ruzzante DE (2008) Genetic estimates of contemporary
effective population size: what can they tell us about the
importance of genetic stochasticity for wild population persis-
tence? Mol Ecol 17:3428–3447
Patterson BD, Ceballos G, Sechrest W, Tognelli MF, Brooks T, Luna
L, Ortega P, Salazar I, Young BE (2007) Digital distribution
maps of the mammals of the western hemisphere, version 3.0.
NatureServe, Arlington, Virginia, USA. Data provided by
NatureServe in collaboration with Bruce Patterson, Wes Sech-
rest, Marcelo Tognelli, Gerardo Ceballos, The Nature Conser-
vancy—migratory bird program, conservation international—
CABS, World Wildlife Fund—US, and Environment Canada—
WILDSPACE
Piry S, Luikart G, Cornuet JM (1999) BOTTLENECK: a computerprogram for detecting recent reductions in the effective popu-
lation size using allele frequency data. J Hered 90:502–503
Piry S, Alapetite A, Cornuet JM, Paetkau D, Baudouin L, Estoup A
(2004) GENECLASS2: a software for genetic assignment and
first-generation migrant detection. J Hered 95:536–539
Pompanon F, Bonin A, Bellemain E, Taberlet P (2005) Genotyping
errors: causes, consequences and solutions. Nat Rev Genet
6:847–859
Pritchard JK, Stephens M, Donnelly P (2000) Inference of population
structure using multilocus genotype data. Genetics 155:945–959
R Development Core Team (2006) R: a language and environment for
statistical computing. Vienna, Austria. Available from: http://
www.R-project.org
Rannala B, Mountain JL (1997) Detecting immigration by using
multilocus genotypes. Proc Natl Acad Sci USA 94:9197–9201
Raymond M, Rousset F (1995) GENEPOP (version 1.2): population
genetics software for exact tests and ecumenicism. J Hered
86:248–249
Reed DH (2004) Extinction risk in fragmented habitats. Anim
Conserv 7:181–191
Reed DH, Frankham R (2003) Correlation between fitness and genetic
diversity. Conserv Biol 17:230–237
Rico C, Rico I, Webb N, Smith S, Bell D, Hewitt G (1994) Four
polymorphic microsatellite loci for the European wild rabbit,
Oryctolagus cuniculus. Anim Genet 25:367
Schwartz MK, McKelvey KS (2009) Why sampling scheme matters:
the effect of sampling scheme on landscape genetic results.
Conserv Genet 10:441–452
Segelbacher G, Hoglund J, Storch I (2003) From connectivity to
isolation: genetic consequences of population fragmentation in
capercaillie across Europe. Mol Ecol 12:1773–1780
Conserv Genet
123

Segelbacher G, Cushman SA, Epperson BK, Fortin M, Francois O,
Hardy OJ, Holdregger R, Taberlet P, Waits LP, Manel S (2010)
Applications of landscape genetics in conservation biology:
concepts and challenges. Conserv Genet 11:375–385
Shikano T, Taniguchi N (2002) Relationships between genetic
variation measured by microsatellite DNA markers and a
fitness-related trait in the guppy (Poecilia reticulata). Aquacul-
ture 209:77–90
Slate J, Kruuk LEB, Marshall TC, Pemberton JM, Clutton-Brock TH
(2000) Inbreeding depression influences lifetime breeding suc-
cess in a wild population of red deer (Cervus elaphus). Proc R
Soc Lond Ser B Biol Sci 267:1657–1662
Smith BJ (2005) Bayesian output analysis program (BOA) Version 1.1.5.
http://www.public-health.uiowa.edu/boa/. Accessed 15 April 2010
Soule ME (1980) Thresholds for survival: maintaining fitness and
evolutionary potential. In: Soule ME, Wilcox BA (eds) Conser-
vation biology: an evolutionary-ecological perspective. Sinauer
Associates, Sunderland, pp 151–169
Surridge AK, Bell DJ, Rico C, Hewitt GM (1997) Polymorphic
microsatellite loci in the European rabbit (Oryctolagus cunicu-lus) are also amplified in other lagomorph species. Anim Genet
28:302–305
Taberlet P, Griffin S, Goossens B, Questiau S, Manceau V,
Escaravage N, Waits LP, Bouvet J (1996) Reliable genotyping
of samples with very low DNA quantities using PCR. Nucleic
Acids Res 24:3189–3194
Tallmon DA, Koyuk A, Luikart G, Beaumont MA (2008) ONeSAMP:
a program to estimate effective population size using approxi-
mate Bayesian computation. Mol Ecol Resour 8:299–301
Tash JP, Litvaitis JA (2007) Characteristics of occupied habitats and
identification of sites for restoration and translocation of New
England cottontail populations. Biol Conserv 137:584–598
USFWS (2006) Endangered and threatened wildlife and plants;
review of native species that are candidates or proposed for
listing as endangered or threatened; annual notice of findings on
resubmitted petitions; annual description of progress on listing
actions. United States Fish and Wildlife Service. Federal
Register 71:53755–53835
USFWS (2009) New England cottontail (Sylvilagus transitionalis)
spotlight species action plan. United States Fish and Wildlife
Service, New England Field Office, Concord, New Hampshire.
http://ecos.fws.gov/docs/action_plans/doc3081.pdf. Accessed 15
Feb 2010
van Oosterhout C, Hutchinson WF, Wills DPM, Shipley P (2004)
MICRO-CHECKER: software for identifying and correcting
genotyping errors in microsatellite data. Mol Ecol Notes
4:535–538
Verhoeven KJF, Simonsen KL, McIntyre LM (2005) Implementing
false discovery rate control: increasing your power. Oikos
108:643–647
Waits LP, Luikart G, Taberlet P (2001) Estimating the probability of
identity among genotypes in natural populations: cautions and
guidelines. Mol Ecol 10:249–256
Walker FM, Sunnucks P, Taylor AC (2008) Evidence for habitat
fragmentation altering within-population processes in wombats.
Mol Ecol 17:1674–1684
Waples RS (2006) A bias correction for estimates of effective
population size based on linkage disequilibrium at unlinked gene
loci. Conserv Genet 7:167–184
White TA, Searle JB (2007) Genetic diversity and population size:
island populations of the common shrew, Sorex araneus. Mol
Ecol 16:2005–2016
Willi Y, VanBuskirk J, Hoffman AA (2006) Limits to the adaptive
potential of small populations. Annu Rev Ecol Evol Syst 37:
433–458
Williamson-Natesan EG (2005) Comparison of methods for detecting
bottlenecks from microsatellite loci. Conserv Genet 6:551–562
Wright LI, Tregenza T, Hosken DJ (2008) Inbreeding, inbreeding
depression and extinction. Conserv Genet 9:833–843
Wu Y, Xia L, Zhang Q, Yang Q (2010) Habitat fragmentation affects
genetic diversity and differentiation of the Yarkand hare.
Conserv Genet 11:183–194
Zartman CE, McDaniel SF, Jonathan Shaw A (2006) Experimental
habitat fragmentation increases linkage disequilibrium but does
not affect genetic diversity or population structure in the
Amazonian liverwort Radula flaccida. Mol Ecol 15:2305–2315
Conserv Genet
123