Embed Size (px)
Citation preview
Population Population GeographyGeography
AP Human Geography: Unit 2AP Human Geography: Unit 2
Population TermsPopulation Terms
• Total Fertility Rate: Average # of children born to Total Fertility Rate: Average # of children born to a womana woman
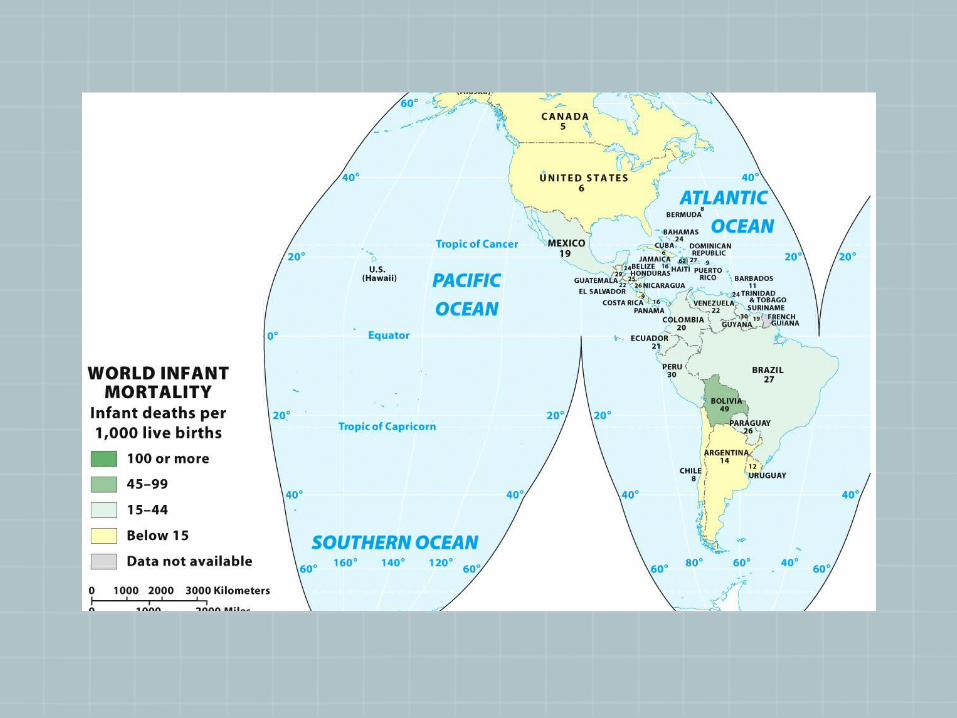
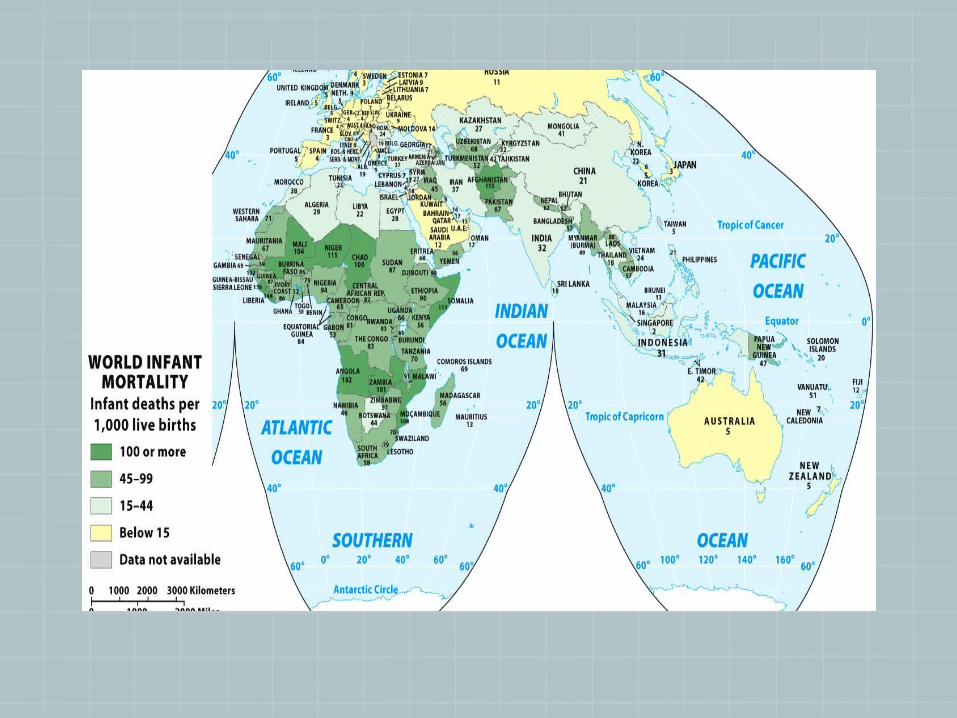
• Infant Mortality Rate: # of infants that die before Infant Mortality Rate: # of infants that die before age oneage one
• Life Expectancy: Average length of someone’s lifeLife Expectancy: Average length of someone’s life
• Crude Birth Rate: number of live births per 1000 Crude Birth Rate: number of live births per 1000 peoplepeople
• Crude Death Rate: Number of deaths per 1000 Crude Death Rate: Number of deaths per 1000 peoplepeople
Natural Increase Natural Increase RateRateDifference between the Crude Birth Rate Difference between the Crude Birth Rate
and the Crude Death Rate. A negative and the Crude Death Rate. A negative increase means the number of babies is increase means the number of babies is not high enough to make up for deaths not high enough to make up for deaths therefore the population is decliningtherefore the population is declining
•This number does not account for This number does not account for migrationmigration
•Most developing regions are seeing Most developing regions are seeing death rates out number birth rates = a death rates out number birth rates = a declining population. If numbers are still declining population. If numbers are still high it is most likely due to immigrationhigh it is most likely due to immigration
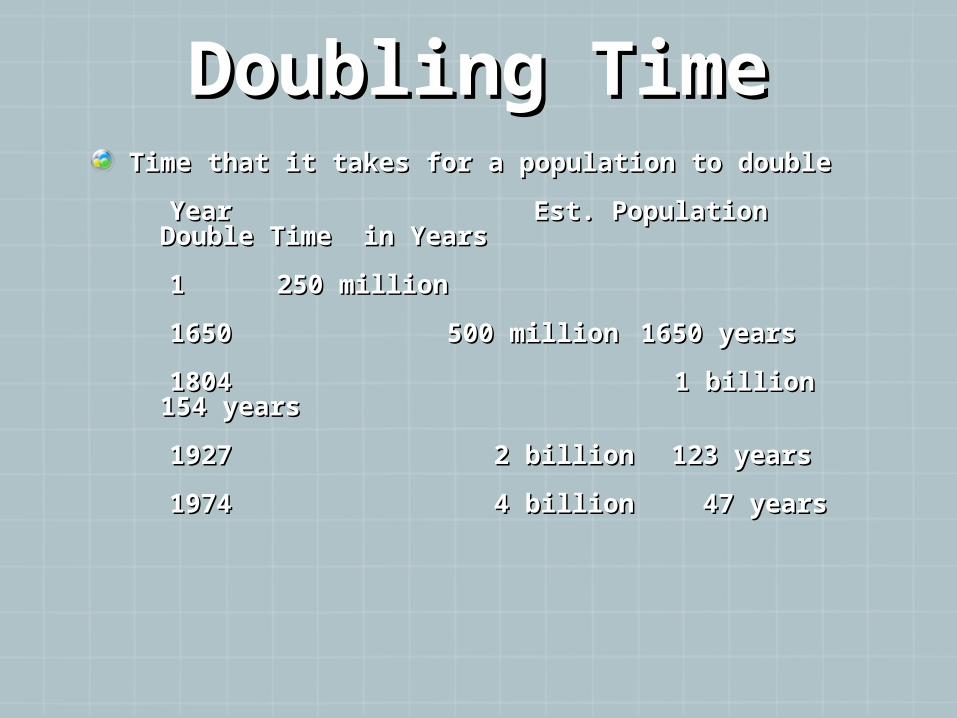
Doubling TimeDoubling TimeTime that it takes for a population to doubleTime that it takes for a population to double
YearYear Est. Population Double Time Est. Population Double Time in Yearsin Years
11 250 million 250 million
16501650 500 million 500 million 1650 years1650 years
18041804 1 billion 1 billion 154 years 154 years
1927 1927 2 billion 2 billion 123 123 yearsyears
19741974 4 billion 4 billion 47 years 47 years
What determines What determines a Population’s a Population’s
Natural Increase Natural Increase Rate?Rate?
Economic DevelopmentEconomic Development
A country’s economic development plays a A country’s economic development plays a huge factor on the quality of health care, huge factor on the quality of health care, employment opportunities and nutrition.employment opportunities and nutrition.
Usually an increase in economic Usually an increase in economic development results in a decline in development results in a decline in fertility and growth ratesfertility and growth rates
EducationEducation: Affects every aspect from : Affects every aspect from fertility rates to prenatal care and the use fertility rates to prenatal care and the use of contraceptivesof contraceptives
Gender empowermentGender empowerment: the status and : the status and opportunities available for women. Women opportunities available for women. Women who have more economic / political access, who have more economic / political access, power, and education have lower fertility power, and education have lower fertility ratesrates
HealthcareHealthcare: Contradictory towards Natural : Contradictory towards Natural Rate of Increase because improved Rate of Increase because improved healthcare in less developing countries has healthcare in less developing countries has a lower IMR and an increase in life a lower IMR and an increase in life expectancy thus = population growth….Butexpectancy thus = population growth….But
Improved healthcare services also provide Improved healthcare services also provide contraceptives and family planning limiting contraceptives and family planning limiting births toobirths too
Cultural TraditionsCultural Traditions: In many parts of the : In many parts of the world culture encourages increased world culture encourages increased fertility rates by limiting women in fertility rates by limiting women in employment out of the home through employment out of the home through elevating motherhood and discouraging elevating motherhood and discouraging contraceptives. Ex: the need to have contraceptives. Ex: the need to have many sonsmany sons
Public PoliciesPublic Policies: important implications for : important implications for population growth. Ex: China with their population growth. Ex: China with their “One Couple, One Child” policy of 1979 “One Couple, One Child” policy of 1979 which provides economic incentives which provides economic incentives favoring families who have few children favoring families who have few children and penalties for those having too manyand penalties for those having too many

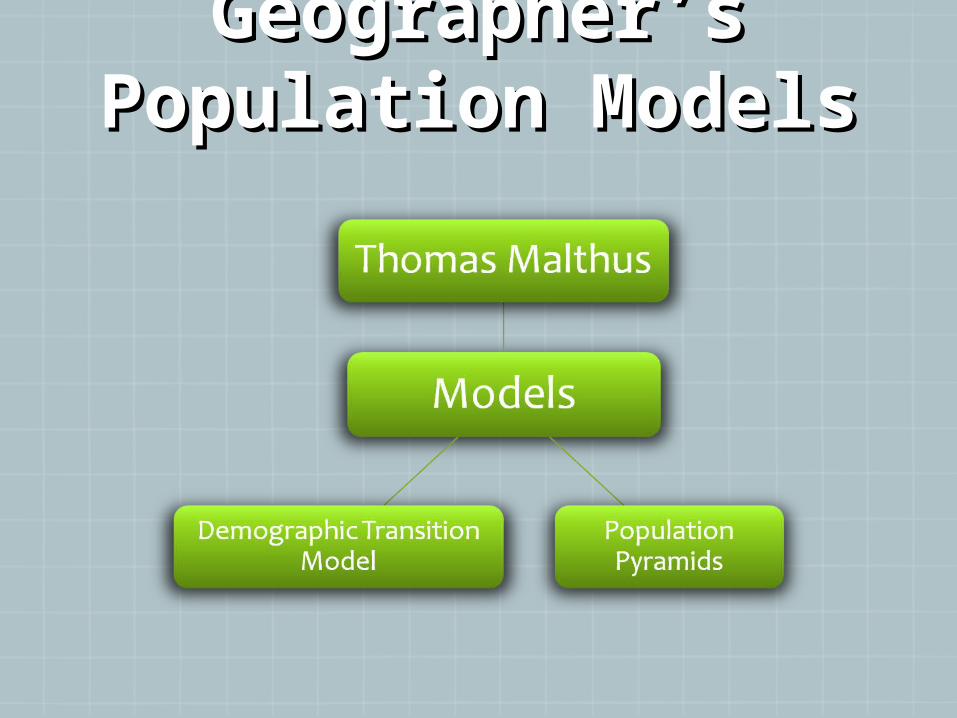
Geographer’s Geographer’s Population Population
ModelsModels

Thomas MalthusThomas Malthus1798: Wrote the Essay on the Principals of 1798: Wrote the Essay on the Principals of PopulationPopulation
Basic idea wasBasic idea was
1. People need food to survive1. People need food to survive
2. People have a natural desire to 2. People have a natural desire to reproducereproduce
Food production increases arithmetically: grows Food production increases arithmetically: grows by addition of more acreage into cultivationby addition of more acreage into cultivation
Population increases geometrical: grows by the Population increases geometrical: grows by the multiplication of human beings. Today known multiplication of human beings. Today known as exponential growthas exponential growth
Problems with Malthus Problems with Malthus TheoryTheory
He knew there would be development in He knew there would be development in agricultural technologies but he did not take agricultural technologies but he did not take into account how dramatic their affects would into account how dramatic their affects would bebe
He assumed humans had no control over their He assumed humans had no control over their reproductive behavior. He did not foresee reproductive behavior. He did not foresee population numbers slowing down due topopulation numbers slowing down due to
1. effective contraceptives1. effective contraceptives
2. changing roles of women in society2. changing roles of women in society
3. individual people’s reproductive decisions3. individual people’s reproductive decisions
He did not recognize that famine was He did not recognize that famine was not related to a lack of food, but to not related to a lack of food, but to unequal distribution of foodunequal distribution of food
Ex: Famine exists in various areas of Ex: Famine exists in various areas of Africa in the 20Africa in the 20thth century despite an century despite an abundance of food in other parts of the abundance of food in other parts of the worldworld
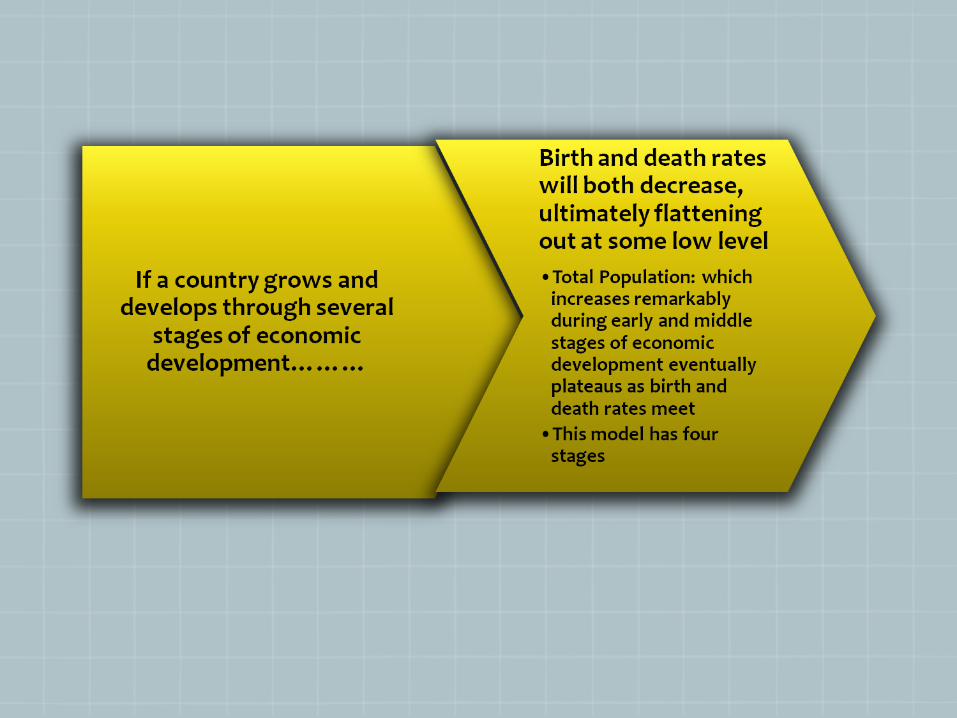
Demographic Demographic Transition ModelTransition ModelThis model explains changes in the natural This model explains changes in the natural increase rate as a function of economic increase rate as a function of economic developmentdevelopment
It is another interpretation of population It is another interpretation of population growthgrowth
According to this model……..According to this model……..
Countries at low levels of economic Countries at low levels of economic development reflect high birth and death development reflect high birth and death rates but birth rates will significantly rates but birth rates will significantly outpace deathsoutpace deaths
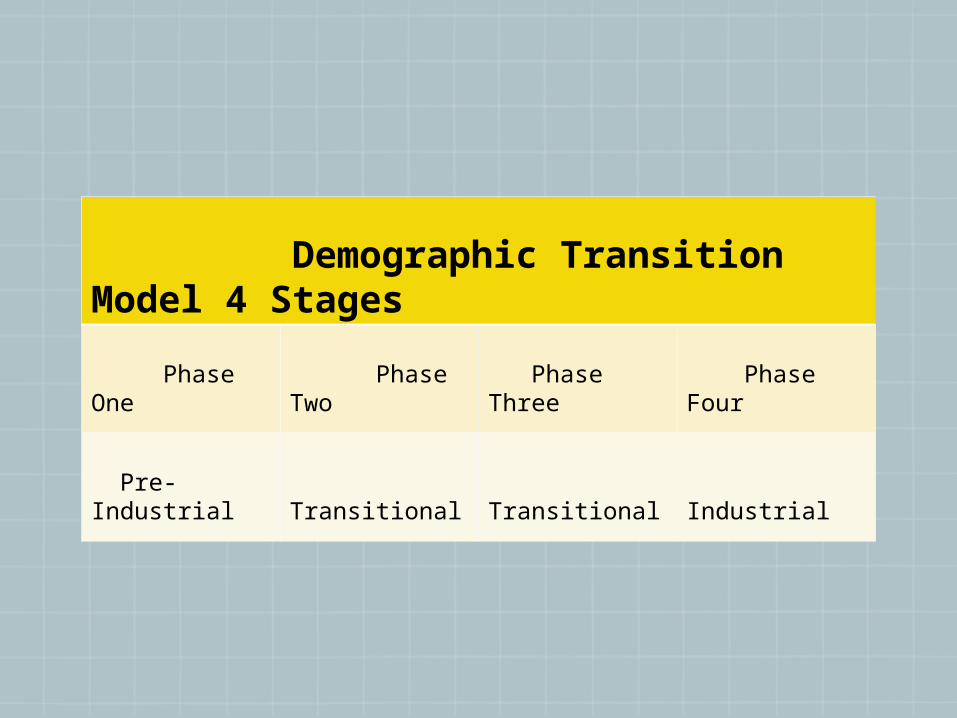
Demographic Transition Model 4 Stages
Phase One Phase Two Phase Three Phase Four
Pre-Industrial Transitional
Transitional Industrial
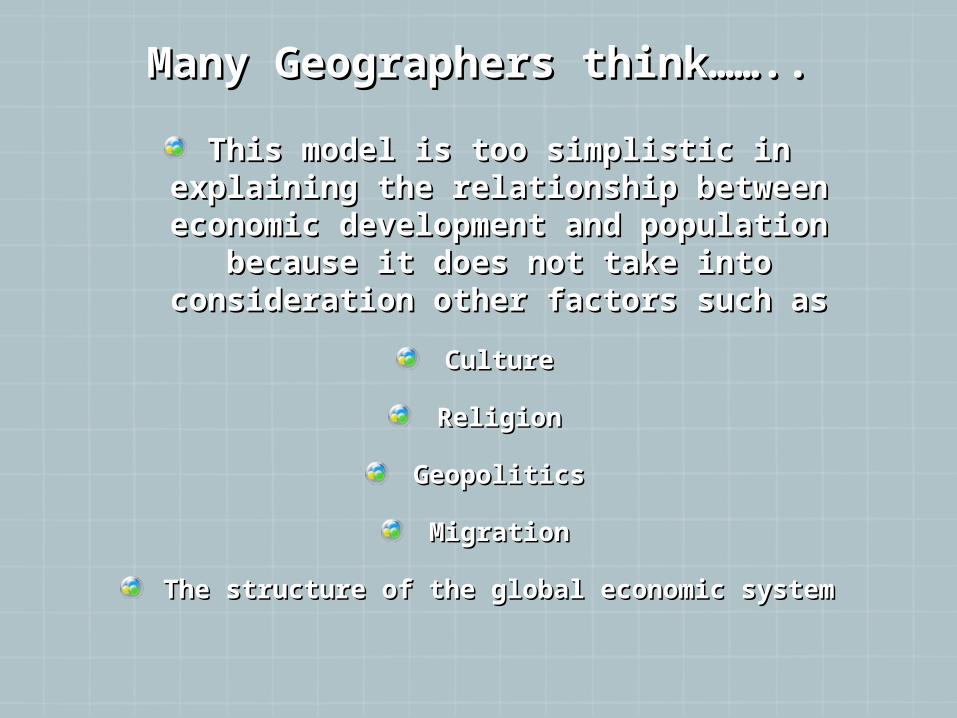
Many Geographers think……..Many Geographers think……..
This model is too simplistic in This model is too simplistic in explaining the relationship between explaining the relationship between
economic development and population economic development and population because it does not take into because it does not take into
consideration other factors such asconsideration other factors such as
CultureCulture
ReligionReligion
GeopoliticsGeopolitics
MigrationMigration
The structure of the global economic systemThe structure of the global economic system
Population Pyramids examine a country’s Population Pyramids examine a country’s age-sex distrubutionage-sex distrubution
Shows how a country’s populace is Shows how a country’s populace is distributed between males and females at distributed between males and females at various agesvarious ages
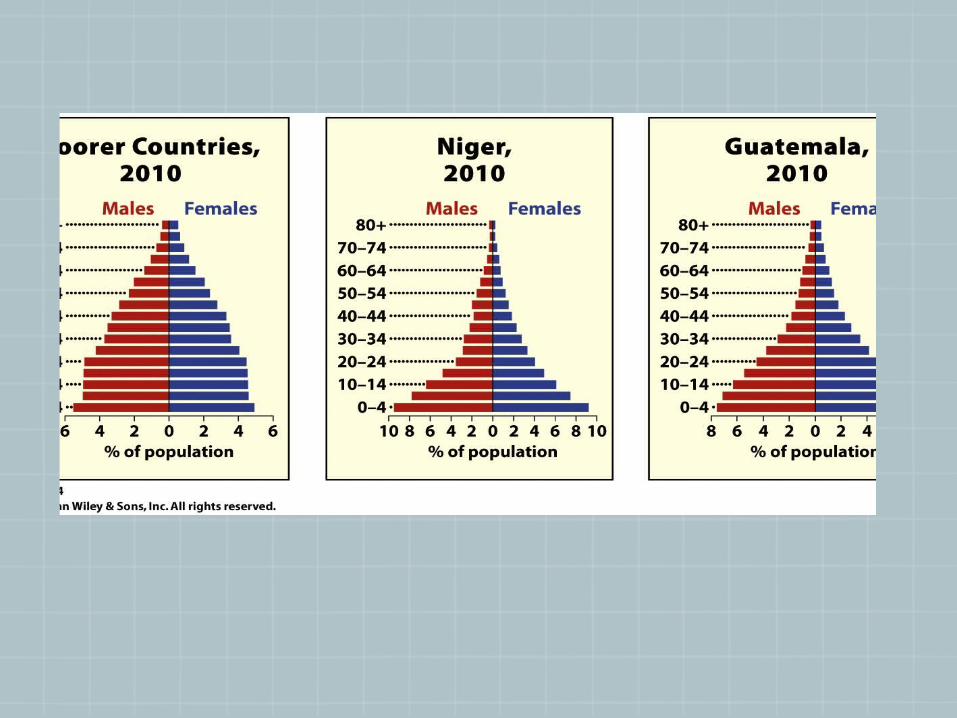
A Population pyramid with a pyramid shape of A Population pyramid with a pyramid shape of a wide base is of a country with high a wide base is of a country with high proportion of young people and is growing proportion of young people and is growing rapidlyrapidly
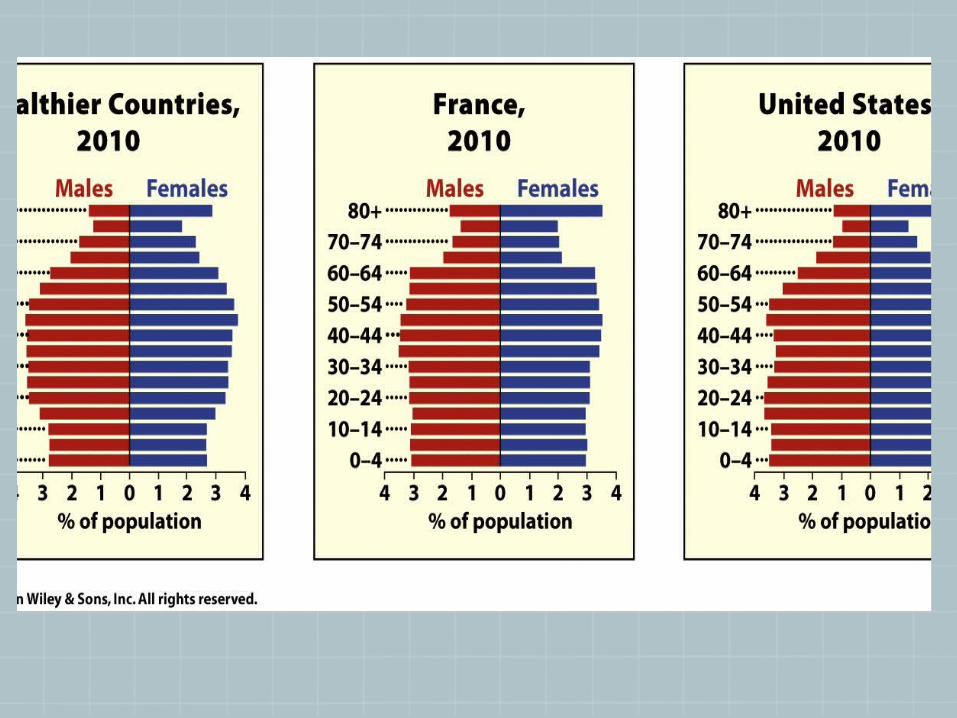
A population pyramid with a more rectangular A population pyramid with a more rectangular shape reflects a population with relative shape reflects a population with relative even numbers of young, middle aged and even numbers of young, middle aged and older people. Typically highly developed older people. Typically highly developed countries with lower growth ratescountries with lower growth rates
Population CohortPopulation Cohort
A group of people that all have A group of people that all have something in common and are usually something in common and are usually grouped together for statistical purposesgrouped together for statistical purposes
1. Baby Boomer 1. Baby Boomer GenerationGeneration1949-19641949-1964
Post WWII: Period of relative peace and Post WWII: Period of relative peace and economic prosperity in the United States. economic prosperity in the United States. Plenty of jobs and Government Aid Programs Plenty of jobs and Government Aid Programs such as the GI Billsuch as the GI Bill
People had education, homes, and secure People had education, homes, and secure jobs. They also had a conservative social jobs. They also had a conservative social environment of the day which encouraged environment of the day which encouraged increase rates of marriage and fertilityincrease rates of marriage and fertility
This period produced the largest, best This period produced the largest, best educated, and most financially secure educated, and most financially secure generation in all American HXgeneration in all American HX
#2 Generation X#2 Generation X1965-19801965-1980
This was the generation without the This was the generation without the overwhelming numbers and unifying overwhelming numbers and unifying identity like the baby boomersidentity like the baby boomers
There were influences from the Vietnam There were influences from the Vietnam War, government distrust and moral issues War, government distrust and moral issues surrounding the Watergate Affair, women surrounding the Watergate Affair, women from the Baby Boom era who were reaching from the Baby Boom era who were reaching child bearing ages in the mid-70’s were child bearing ages in the mid-70’s were choosing education and pursuing more choosing education and pursuing more demanding careers while waiting longer to demanding careers while waiting longer to marry and then were having fewer children.marry and then were having fewer children.
Thus Generation X saw their Thus Generation X saw their generation’s natural increase rate generation’s natural increase rate decline rapidly to the point where some decline rapidly to the point where some geographers referred to this generation geographers referred to this generation as the “Baby Bust”as the “Baby Bust”
This generation also will bare the future This generation also will bare the future strain created by the baby boom era as strain created by the baby boom era as they reach retirement age and put they reach retirement age and put pressure on healthcare, social security, pressure on healthcare, social security, and other services. This will increase and other services. This will increase the US dependency ratio.(Those too the US dependency ratio.(Those too young or old who can no longer work young or old who can no longer work and are therefore dependent on those and are therefore dependent on those that do)that do)