Embed Size (px)
Citation preview
World Geography 3200/3202 Page 1 of 24 Population Geography Chapter 19
Unit 6 Notes Population Geography Word Geo 3202
This review document contains:
1. The notes 2. the active learning lessons we completed in class during this unit.
3. Page references for reading about each topic
Page 2 6.1 Population Density & Global Patterns "Population Density" on pages 300-301 of your text book.
Page 3-4 6.1 Population Density active learning lesson completed in class
Page 5 6.2 Population Growth Trends "Population Growth" on pages 305-307 of your text book.
Page 6-7 6.2 Populations Growth Rate active learning lesson completed in class
Page 8-9 6.2 Controlling Population Growth Read:"Overpopulation: Reality or Exaggeration" on pages 308-
309 of your text book. "Factors affecting birth rates" on pages 313-316.
Page 10 6.3 Natural Change "Natural Changes in Populations" on pages 310-311 of your text book.
Page 11-12 6.3 Natural Change active learning lesson
Page 13-15 6.3 Population Pyramids "Depicting Population Structures" on pages 331-335 of your text book.
Page 16-17 6.3 Population Pyramid active learning lesson done in class
Page 18 6.4 Actual Population Change The introduction to chapter 19 "Migration and its impact On Population" on
pages 322-323 of your text book.
Page 19 6.5 Push & Pull Factors "Reasons for Migration" on pages 323-325 of your text book. "Political and economic conditions in
Afghanistan" on pages 325-326 of your text book.
Page 20-22 6.5 Canada’s Immigration policy active learning lesson completed in class
Pgae 23 6.6 Census Information active learning lesson completed in class
World Geography 3200/3202 Page 2 of 24 Population Geography Chapter 19
6.1 Population Density & Global Patterns "Population Density" on pages 300-301 of your text book.
Population Density Terminology
Population density is a measure of how compact or concentrated a population is. It takes are of land into account as well as population. For example Canada as a whole has a much larger population than St. John's alone. However Canada is spread out over a much larger area than is St. John's. Therefore, St. John's would have a higher population density than Canada.
Population Density = population per unit area (unit area is usually measured in Km2 or miles2)
o Sparsely populated = small number of people per unit area ( less than 100 people / Km2)
o Densely Populated = high number of people per unit area (higher than 100 people / Km2 )
It is important to note that these two classifications and the numeric cut off of 100 people / Km2 are somewhat arbitrary. Some books use a middle category moderately populated @ 10-100 people / Km2
Global Patterns of Population Density
North America:
o Sparsely populated in north, o Densely populated along North eastern U.S. and south western U.S.
South America:
o Sparsely populated in Center, o Densely populated along Western Coast But most dense south Eastern Brazil
Europe:
o Sparsely populated in Extreme North, o Densely populated throughout remainder
Asia: o Sparsely populated in North & center,
o Densely populated in South East
Africa: o Sparsely populated in Sahara, o Densely in North & Sub Sahara
Factors affecting Population Density and Distribution
Climate: o Warmer comfortable climates attract people. Notice that most people live in a moderate
climate region.
Economics: o Population distribution has changed over time. No longer are dense populations around
primary resources. Urbanization and the move to the industrial and now the information ages have changed population distribution.
Transportation: o Coastal regions attracted business and people because of ocean transportation. It was true for
initial settlement and is still true today. Most major cities are located on the coast.
Can you think of some others?
World Geography 3200/3202 Page 3 of 24 Population Geography Chapter 19
6.1 Active learning lesson: The Purpose of this active learning lesson is two fold. Firstly it
will provide you with the required knowledge about population density and secondly it will give you
some real data for your background knowledge. Ch. 18 P. 300 - 304
1. Write definitions for each of the following terms. Lesson definitions would suffice but
definitions written in your own words would be most beneficial to you.
Population Density:
Densely Populated:
Sparsely Populated:
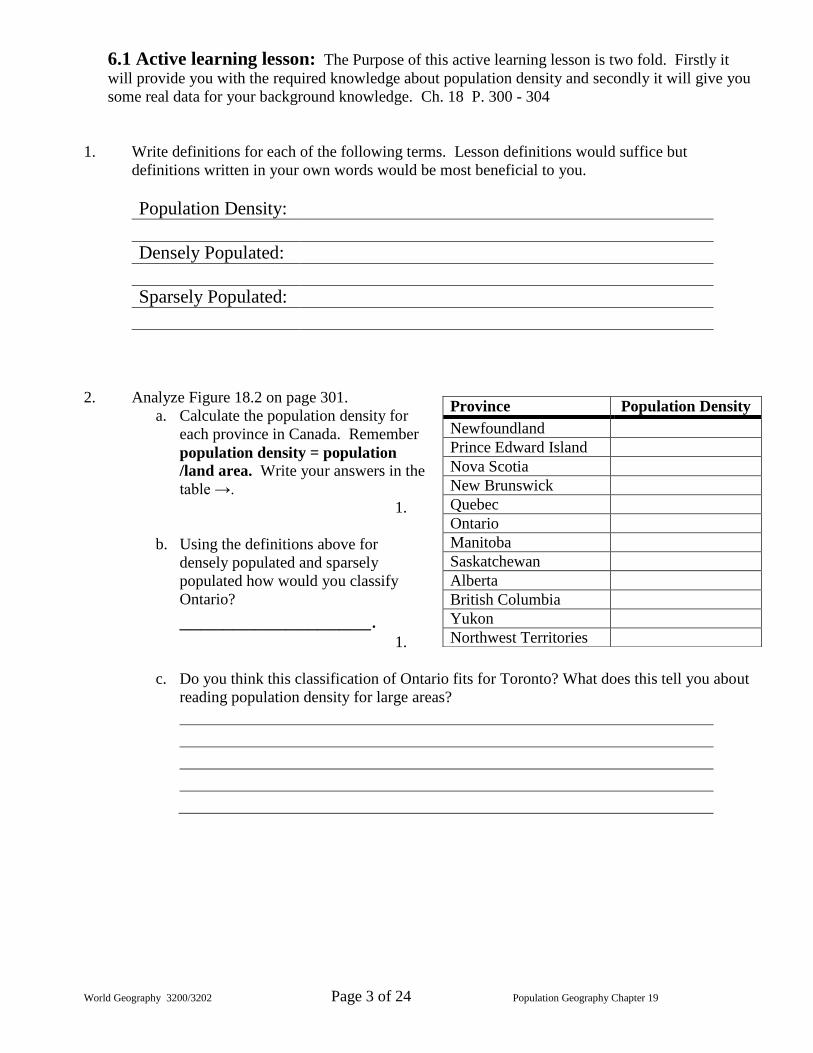
2. Analyze Figure 18.2 on page 301.
a. Calculate the population density for
each province in Canada. Remember
population density = population
/land area. Write your answers in the
table →.
1.
b. Using the definitions above for
densely populated and sparsely
populated how would you classify
Ontario?
__________________. 1.
c. Do you think this classification of Ontario fits for Toronto? What does this tell you about
reading population density for large areas?
Province Population Density
Newfoundland
Prince Edward Island
Nova Scotia
New Brunswick
Quebec
Ontario
Manitoba
Saskatchewan
Alberta
British Columbia
Yukon
Northwest Territories
World Geography 3200/3202 Page 4 of 24 Population Geography Chapter 19
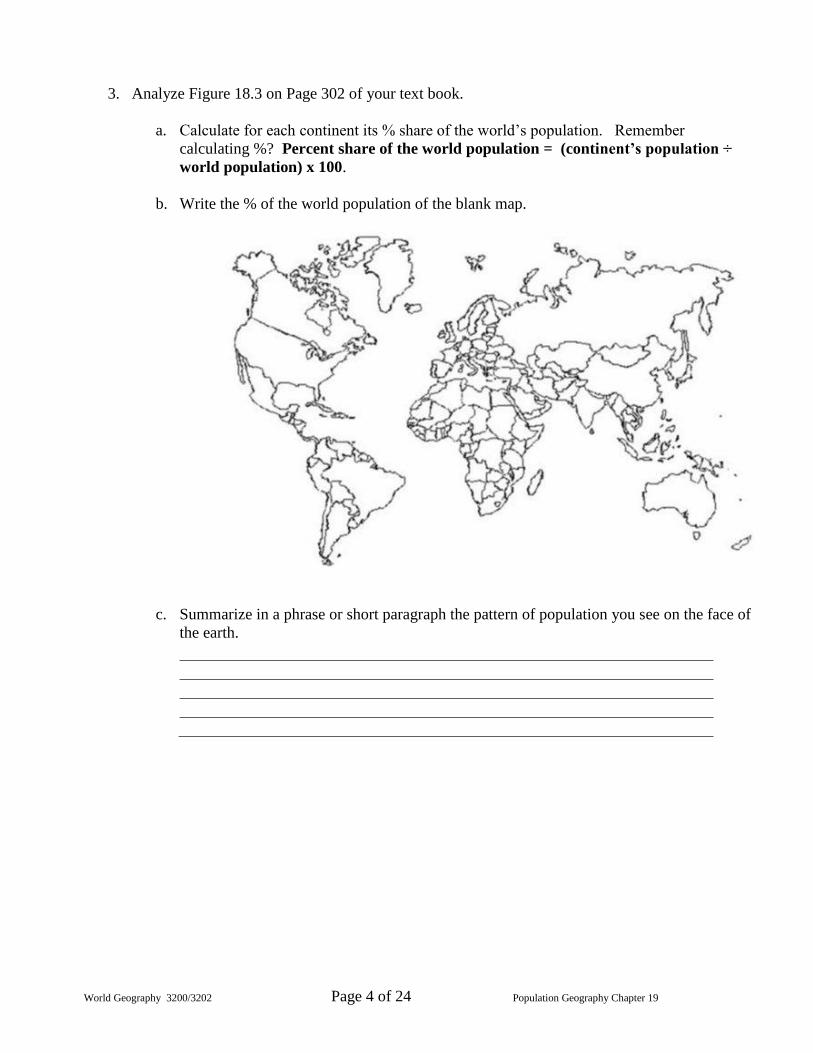
3. Analyze Figure 18.3 on Page 302 of your text book.
a. Calculate for each continent its % share of the world’s population. Remember
calculating %? Percent share of the world population = (continent’s population ÷
world population) x 100.
b. Write the % of the world population of the blank map.
c. Summarize in a phrase or short paragraph the pattern of population you see on the face of
the earth.
World Geography 3200/3202 Page 5 of 24 Population Geography Chapter 19
6.2 Population Growth Trends "Population Growth" on pages 305-307 of your text book.
Absolute Population growth refers the total amount of increase (or decrease) regardless of time.
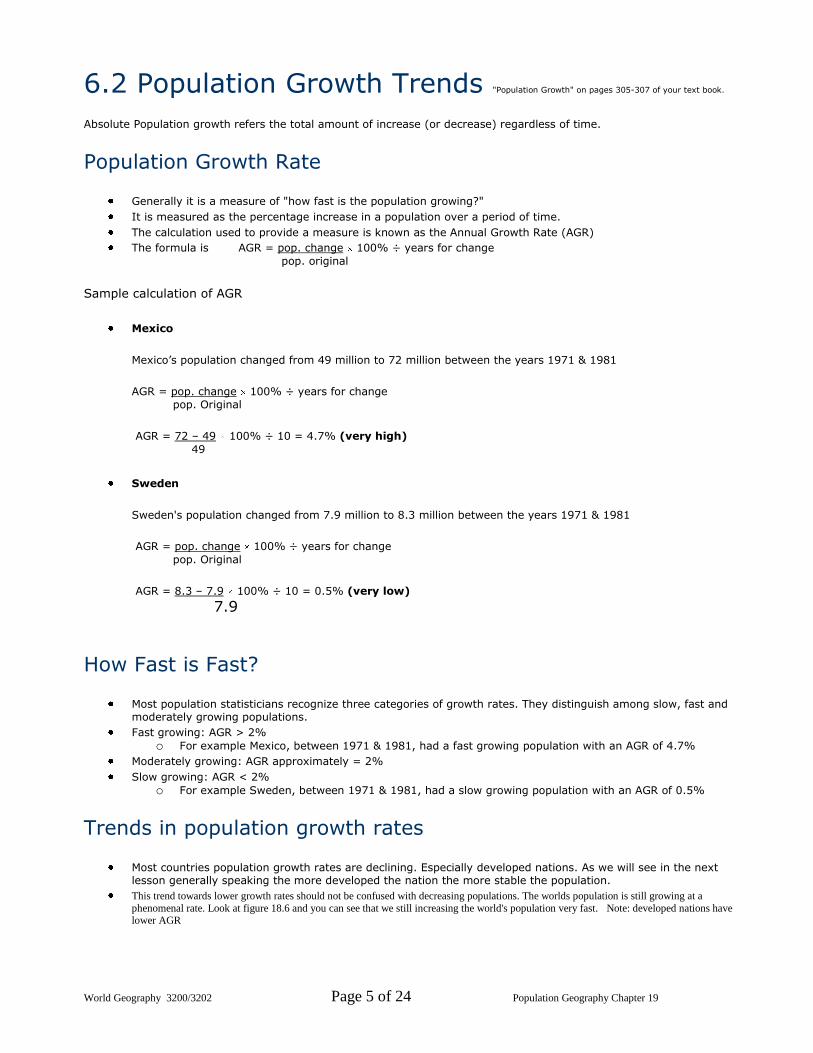
Population Growth Rate
Generally it is a measure of "how fast is the population growing?"
It is measured as the percentage increase in a population over a period of time.
The calculation used to provide a measure is known as the Annual Growth Rate (AGR)
The formula is AGR = pop. change 100% ÷ years for change
pop. original
Sample calculation of AGR
Mexico
Mexico’s population changed from 49 million to 72 million between the years 1971 & 1981
AGR = pop. change 100% ÷ years for change
pop. Original
AGR = 72 – 49 100% ÷ 10 = 4.7% (very high)
49
Sweden
Sweden's population changed from 7.9 million to 8.3 million between the years 1971 & 1981
AGR = pop. change 100% ÷ years for change
pop. Original
AGR = 8.3 – 7.9 100% ÷ 10 = 0.5% (very low) 7.9
How Fast is Fast?
Most population statisticians recognize three categories of growth rates. They distinguish among slow, fast and moderately growing populations.
Fast growing: AGR > 2%
o For example Mexico, between 1971 & 1981, had a fast growing population with an AGR of 4.7%
Moderately growing: AGR approximately = 2%
Slow growing: AGR < 2%
o For example Sweden, between 1971 & 1981, had a slow growing population with an AGR of 0.5%
Trends in population growth rates
Most countries population growth rates are declining. Especially developed nations. As we will see in the next lesson generally speaking the more developed the nation the more stable the population.
This trend towards lower growth rates should not be confused with decreasing populations. The worlds population is still growing at a
phenomenal rate. Look at figure 18.6 and you can see that we still increasing the world's population very fast. Note: developed nations have lower AGR
World Geography 3200/3202 Page 6 of 24 Population Geography Chapter 19
6.2 Active Learning Lesson: The Purpose of this active learning lesson is two fold. Firstly it will provide you with
review of the material covered in the lesson and secondly it will give you some real data for your background knowledge.
1. Write definitions for each of the following terms. Lesson definitions would suffice but
definitions written in your own words would be most beneficial to you.
Population Growth Rate:
Annual Growth rate:
Fast Growing Population:
Moderately Growing Population:
Slow Growing Population:
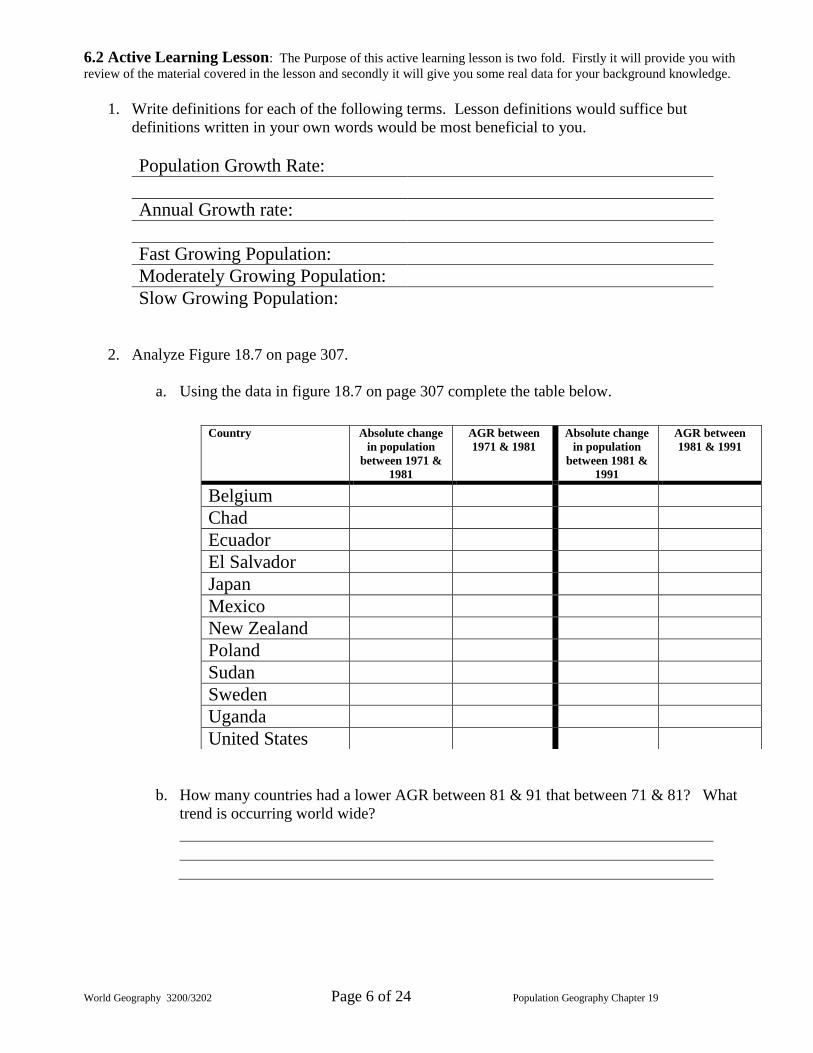
2. Analyze Figure 18.7 on page 307.
a. Using the data in figure 18.7 on page 307 complete the table below.
b. How many countries had a lower AGR between 81 & 91 that between 71 & 81? What
trend is occurring world wide?
Country Absolute change
in population
between 1971 &
1981
AGR between
1971 & 1981
Absolute change
in population
between 1981 &
1991
AGR between
1981 & 1991
Belgium
Chad
Ecuador
El Salvador
Japan
Mexico
New Zealand
Poland
Sudan
Sweden
Uganda
United States
World Geography 3200/3202 Page 7 of 24 Population Geography Chapter 19
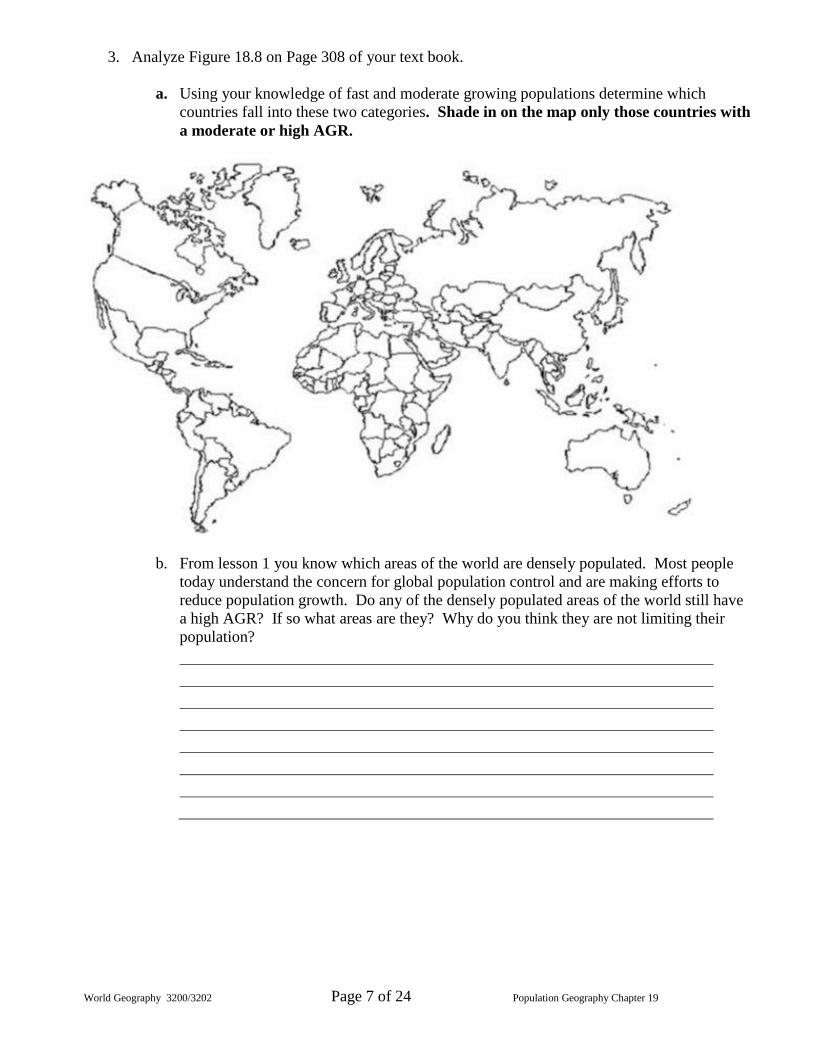
3. Analyze Figure 18.8 on Page 308 of your text book.
a. Using your knowledge of fast and moderate growing populations determine which
countries fall into these two categories. Shade in on the map only those countries with
a moderate or high AGR.
b. From lesson 1 you know which areas of the world are densely populated. Most people
today understand the concern for global population control and are making efforts to
reduce population growth. Do any of the densely populated areas of the world still have
a high AGR? If so what areas are they? Why do you think they are not limiting their
population?
World Geography 3200/3202 Page 8 of 24 Population Geography Chapter 19
6.3 Controlling Population Growth
Read: "Overpopulation: Reality or Exaggeration" on pages 308-309 of your text book. "Factors affecting birth rates" on pages 313-316.
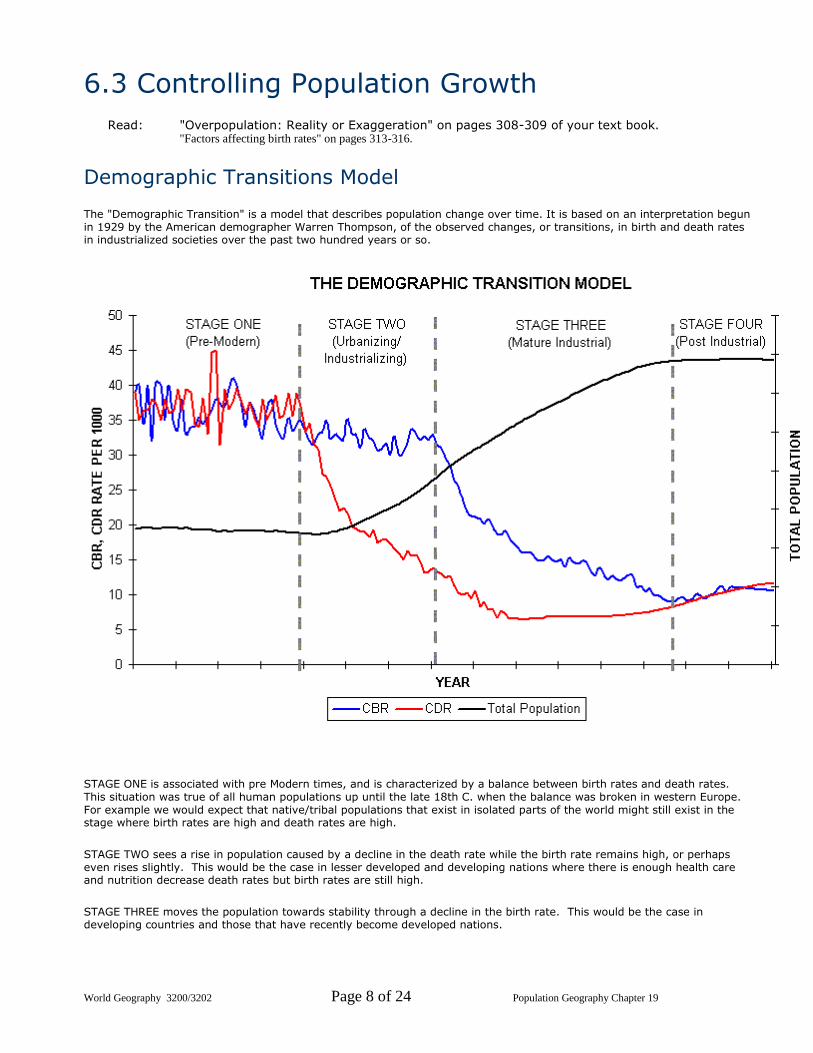
Demographic Transitions Model
The "Demographic Transition" is a model that describes population change over time. It is based on an interpretation begun in 1929 by the American demographer Warren Thompson, of the observed changes, or transitions, in birth and death rates in industrialized societies over the past two hundred years or so.
STAGE ONE is associated with pre Modern times, and is characterized by a balance between birth rates and death rates. This situation was true of all human populations up until the late 18th C. when the balance was broken in western Europe. For example we would expect that native/tribal populations that exist in isolated parts of the world might still exist in the stage where birth rates are high and death rates are high.
STAGE TWO sees a rise in population caused by a decline in the death rate while the birth rate remains high, or perhaps even rises slightly. This would be the case in lesser developed and developing nations where there is enough health care and nutrition decrease death rates but birth rates are still high.
STAGE THREE moves the population towards stability through a decline in the birth rate. This would be the case in developing countries and those that have recently become developed nations.
World Geography 3200/3202 Page 9 of 24 Population Geography Chapter 19
STAGE FOUR is characterized by stability. In this stage the population age structure has become older. For example Canada, Sweden and other developed nations would be in this stage of the model.
Visit this site http://www.uwmc.uwc.edu/geography/Demotrans/demtran.htm to find out more about the demographic transitions model.
Economic Conditions That Affect a Country's AGR.
Better economic conditions affect a number of things that have allowed developed nations to stabilize their populations. Some of the amenities that developed nations enjoy that promote population control include:
1. Education rate of the masses:
o educated people are more aware of birth control and statistics show that increased education is correlated with decreased number of children.
2. Education of females:
o it is assumed that the education of women has resulted in them taking on a greater variety of societal
roles in developed nations. Again statistics show that more educated women tend to have fewer children. 3. Employment for females:
o instances of females working outside the home are more common in developed nations. This goes hand in hand with increased education. Statistics show that in developed nations women are having children later in life and are having fewer children as they put family on hold to develop a career.
4. Ability to access birth control:
o while a trip to the corner store for birth control is a simple task in a developed nation, in lesser developed nations the cost is prohibitive. Feeding the family takes precedent over birth control. Furthermore the availability of a corner store is a problem for some let alone the availability of birth control.
5. Service sector jobs & the move from agriculture to urbanization:
o people do not need large families to help on the farm if they work in the city where the jobs are
predominantly in manufacturing and in the service sector. 6. Health care:
o prenatal and family planning services are expensive and are predominantly found in more developed nations. We may not recognize the services we have available to us because we are so accustomed to them. However our government collects millions of dollars in taxes that contribute to public health nurses, hospitals, family planning clinics, and family living courses in grade school.
7. Others?
World Geography 3200/3202 Page 10 of 24 Population Geography Chapter 19
Population Control
In developed nations family planning, pension plans, easy access to birth control, education and a changing standard of living have all led to a controlled, stable population. However, in lesser developed nations, education, family planning, birth control and pensions are all very difficult to obtain.
What plan would you support to help developing nations control their population?
1. Legislation by government could make it illegal to have more than a certain number of babies. Is
that humane? How do we ensure the correct number. What is done with children over the
limit?
2. Some people have proposed that war and famine used to be our natural means of birth control.
However if we want to have a manageable plan to control the earth's population surely we cannot
let people in famine go unaided or reduce peacekeeping missions. Clearly this is not an option.
3. Increasing education of the masses is correlated with decreased births. Could we help to provide
education in developing nations? Is that humane?
4. Pension plans & RRSP's allow us to be secure into our old age and we do not have to worry
about having children to take care of us. Is this something we could promote in under-developed
nations?
5. In some regions of the world the disparity between the education received by females and males
is tremendous. We know that education of women is correlated with decreased births. Is the
education of women something we could promote?
6. There is little doubt that birth control is the biggest factor limiting populations in developed
nations. Could we provide less expensive birth control for developing nations?
7. Highly developed economies are associated with decreased birth rates. Should we concentrate
on supporting improvements to their economies as an ultimate route to controlling birth rates?
World Geography 3200/3202 Page 11 of 24 Population Geography Chapter 19
6.3 Natural Change "Natural Changes in Populations" on pages 310-311 of your text book.
There are only two factors that can increase a population, births and immigration. Natural change in a population considers only births as a means of increasing the population.
Likewise there are only two factors that can decrease a population, deaths and emigration. Natural change in a population considers only the deaths as a means of decreasing the population.
Natural change in a population is defined as the difference in births and deaths.
Natural Change = difference in births & deaths o Natural Increase occurs when there are more births than deaths o Natural Decrease occurs when there are more deaths than births
Rate of Natural Change
Population growth rate considers all aspects of population change. However Rate of natural increase (RNI) takes into account only birth rate and death rate.
Birth Rate (BR) is measured as the number of births (in one year) per 1000 people.
The formula is BR = births 1000
population
Death Rate (DR) is measured as the number of deaths (in one year) per 1000 people.
The formula is DR = deaths 1000
population
Rate of Natural Increase (RNI) is a measure of how fats the population is increasing due only to the births and deaths.
The formula is RNI = BR – DR
Population Growth Rate & Standard of Living
Generally speaking stable populations are characteristic of a high standard of living due to:
low birth rate caused by good family planning, access to birth control, financial
planning, education, etc. Low death rate caused by good medical care, nutrition, education etc.
Generally speaking an expanding population is characteristic of a lower standard of living:
high birth rate due to poor access to birth control, lack of education etc.; high death rate due to poor medical care & nutrition
World Geography 3200/3202 Page 12 of 24 Population Geography Chapter 19
6.3 Active Learning Lesson: The Purpose of this active learning lesson is two fold. Firstly it will provide
you with guidance in reading through the section "Natural Changes in Populations" on pages 310-
311 of your text book and secondly it will give you some real data for your background knowledge.
1. ___________________ is the difference between births and deaths in a population.
2. ___________________ is an increase in population due more births than deaths.
3. ___________________ is a decrease in population due to more deaths than births.
4. ___________________ is the number of births per 1000 people in the population.
5. ___________________ is the number of deaths per 1000 deaths in the population.
6. ___________________ is the difference in the birth rate and the death rate for a population.
7. Countries with a high standard of living generally have a ___________________ RNI.
8. Countries with a High RNI generally have a ___________________ standard of living.
9. ___________________ birth rates are usually associated with low education rates,
agricultural economies and less dev eloped economies.
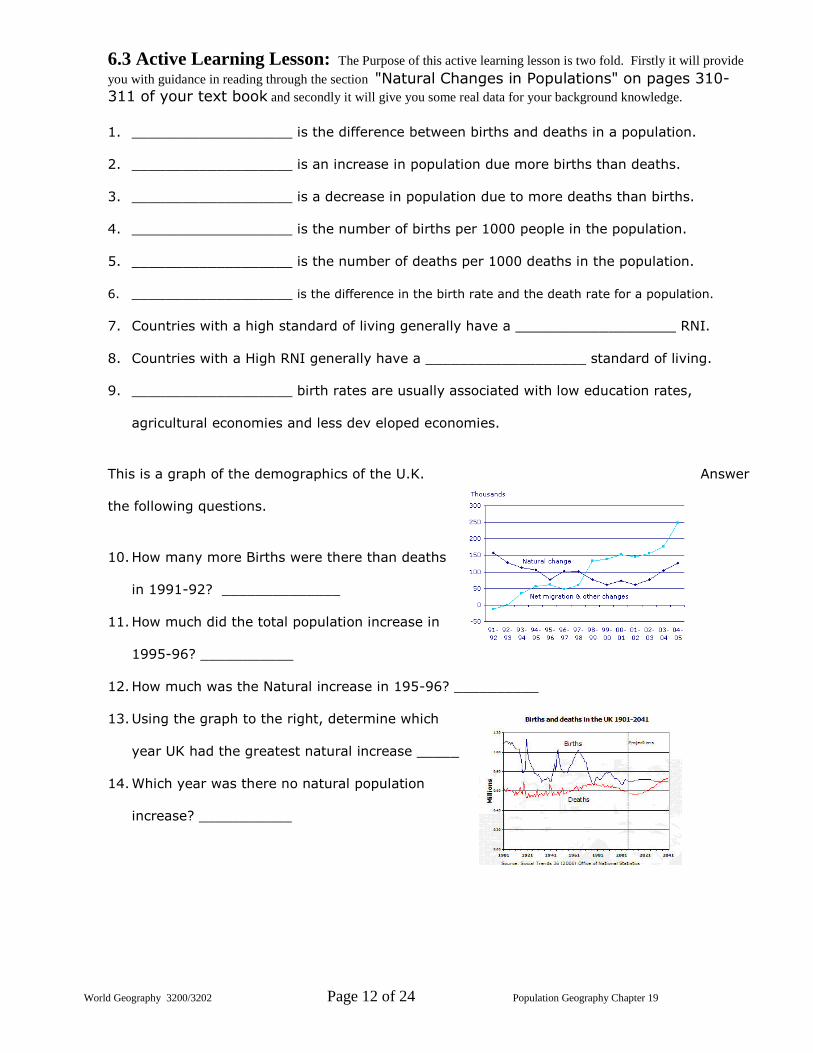
This is a graph of the demographics of the U.K. Answer
the following questions.
10. How many more Births were there than deaths
in 1991-92? ______________
11. How much did the total population increase in
1995-96? ___________
12. How much was the Natural increase in 195-96? __________
13. Using the graph to the right, determine which
year UK had the greatest natural increase _____
14. Which year was there no natural population
increase? ___________
World Geography 3200/3202 Page 13 of 24 Population Geography Chapter 19
Wednesday, September 28, 2005
Demographic statistics
July 1, 2005 (preliminary)
Canada had the second highest rate of population growth among the G8 countries between 1994 and 2004. During that period, the Canadian population grew at a rate approaching 1%, while the rate for the United States was 1.1%.
Canadian growth considerably exceeded that of all other remaining countries in the G8.
While United Kingdom and France respectively recorded rates of 0.34% and 0.40%, Japan, Germany and Italy all had rates between 0.1% and 0.2%. The Russian Federation
was the only G8 country to see its population decline over the period.
Natural increase among the highest in the G8
Between 1994 and 2004, Canada's rate of natural increase of 0.39% was exceeded only
by that of the United States (+0.58%) among the G8. The United States was the only country in the group whose fertility rate was at the replacement level of 2.1 children per woman.
With a fertility rate of 1.5 children per woman, which is ranked fourth among the G8 countries, and a life expectancy similar to other countries in the group, Canada continues to have a relatively high rate of natural increase. Among the other countries in
the group, only France has a rate of natural increase (+0.35%) similar to Canada's, while three countries (Germany, Italy and the Russian Federation) currently have more deaths
than births. This phenomenon should not occur in Canada until around 2025 if the trends of recent years continue.
Why do you think the RNI is low for developed nations of the G8?
____________________________________________
____________________________________________________________________________________________________
World Geography 3200/3202 Page 14 of 24 Population Geography Chapter 19
6.3 Population Pyramids "Depicting Population Structures" on pages 331-335 of your text book.
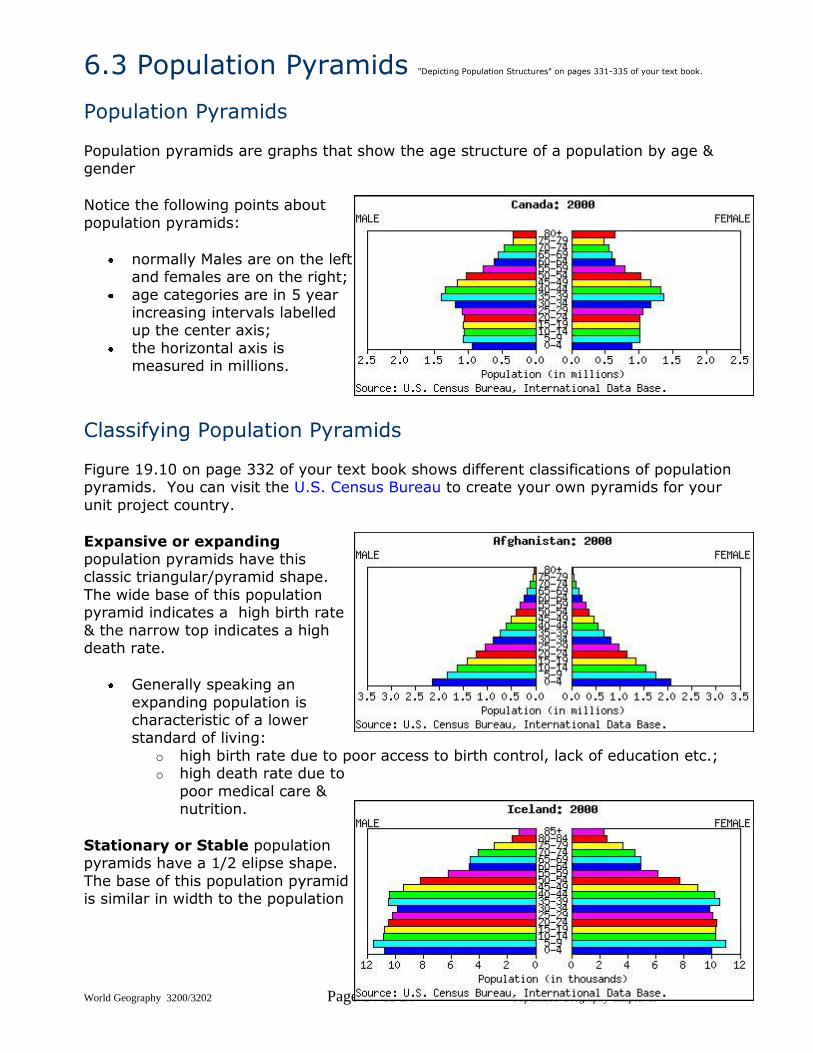
Population Pyramids
Population pyramids are graphs that show the age structure of a population by age & gender
Notice the following points about
population pyramids:
normally Males are on the left and females are on the right;
age categories are in 5 year increasing intervals labelled up the center axis;
the horizontal axis is measured in millions.
Classifying Population Pyramids
Figure 19.10 on page 332 of your text book shows different classifications of population pyramids. You can visit the U.S. Census Bureau to create your own pyramids for your
unit project country.
Expansive or expanding population pyramids have this classic triangular/pyramid shape.
The wide base of this population pyramid indicates a high birth rate
& the narrow top indicates a high death rate.
Generally speaking an
expanding population is characteristic of a lower standard of living:
o high birth rate due to poor access to birth control, lack of education etc.; o high death rate due to
poor medical care & nutrition.
Stationary or Stable population pyramids have a 1/2 elipse shape.
The base of this population pyramid is similar in width to the population
World Geography 3200/3202 Page 15 of 24 Population Geography Chapter 19
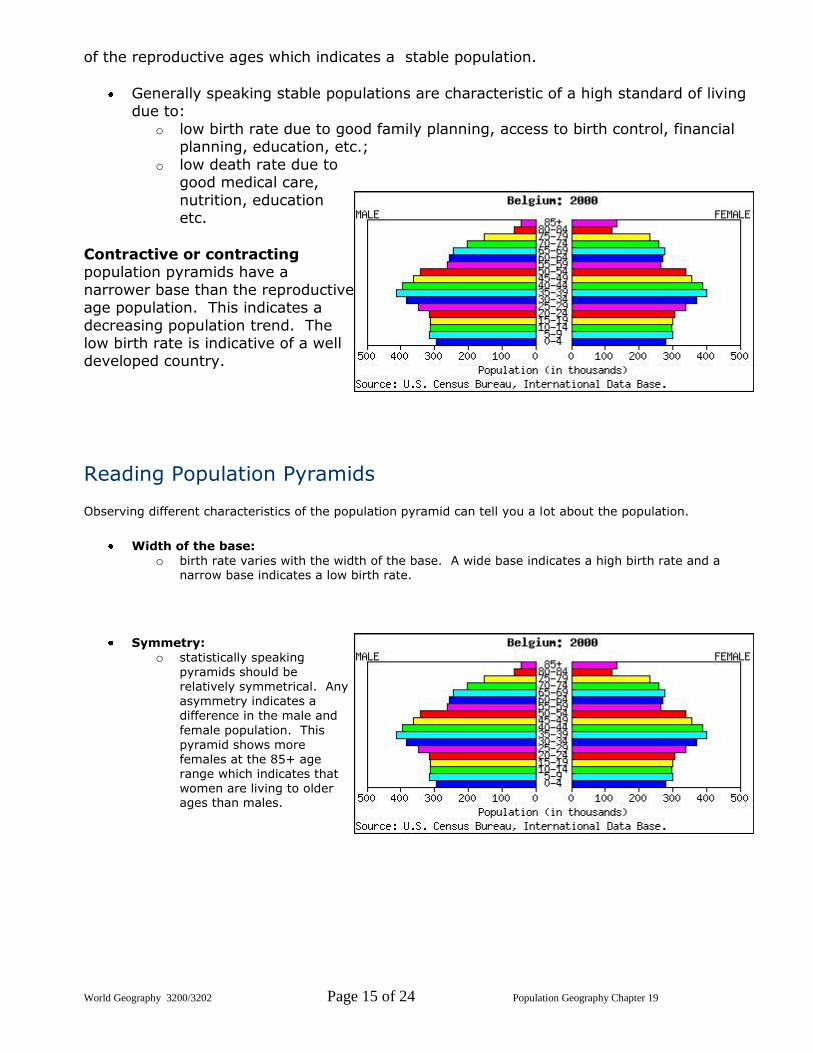
of the reproductive ages which indicates a stable population.
Generally speaking stable populations are characteristic of a high standard of living due to:
o low birth rate due to good family planning, access to birth control, financial planning, education, etc.;
o low death rate due to good medical care,
nutrition, education etc.
Contractive or contracting population pyramids have a
narrower base than the reproductive age population. This indicates a
decreasing population trend. The low birth rate is indicative of a well developed country.
Reading Population Pyramids
Observing different characteristics of the population pyramid can tell you a lot about the population.
Width of the base:
o birth rate varies with the width of the base. A wide base indicates a high birth rate and a narrow base indicates a low birth rate.
Symmetry:
o statistically speaking pyramids should be relatively symmetrical. Any asymmetry indicates a difference in the male and
female population. This pyramid shows more females at the 85+ age range which indicates that women are living to older ages than males.
World Geography 3200/3202 Page 16 of 24 Population Geography Chapter 19
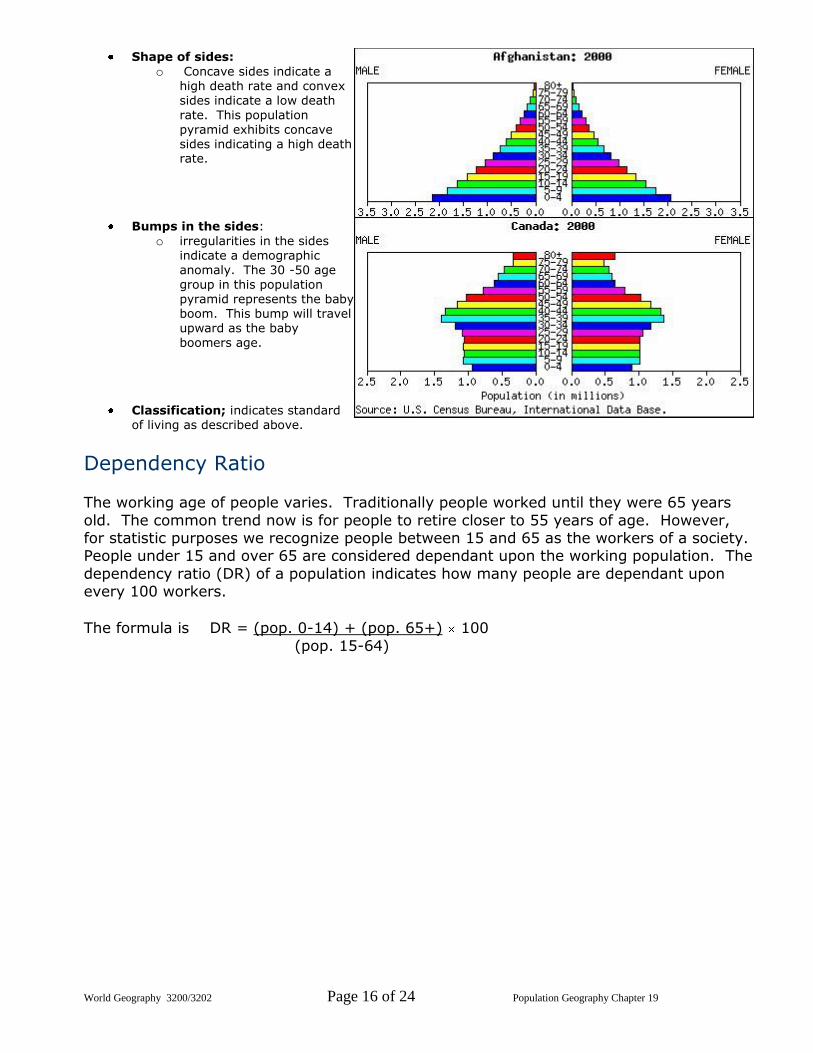
Shape of sides:
o Concave sides indicate a high death rate and convex sides indicate a low death
rate. This population pyramid exhibits concave sides indicating a high death rate.
Bumps in the sides:
o irregularities in the sides indicate a demographic anomaly. The 30 -50 age group in this population pyramid represents the baby boom. This bump will travel upward as the baby
boomers age.
Classification; indicates standard of living as described above.
Dependency Ratio
The working age of people varies. Traditionally people worked until they were 65 years
old. The common trend now is for people to retire closer to 55 years of age. However, for statistic purposes we recognize people between 15 and 65 as the workers of a society. People under 15 and over 65 are considered dependant upon the working population. The
dependency ratio (DR) of a population indicates how many people are dependant upon every 100 workers.
The formula is DR = (pop. 0-14) + (pop. 65+) 100
(pop. 15-64)
World Geography 3200/3202 Page 17 of 24 Population Geography Chapter 19
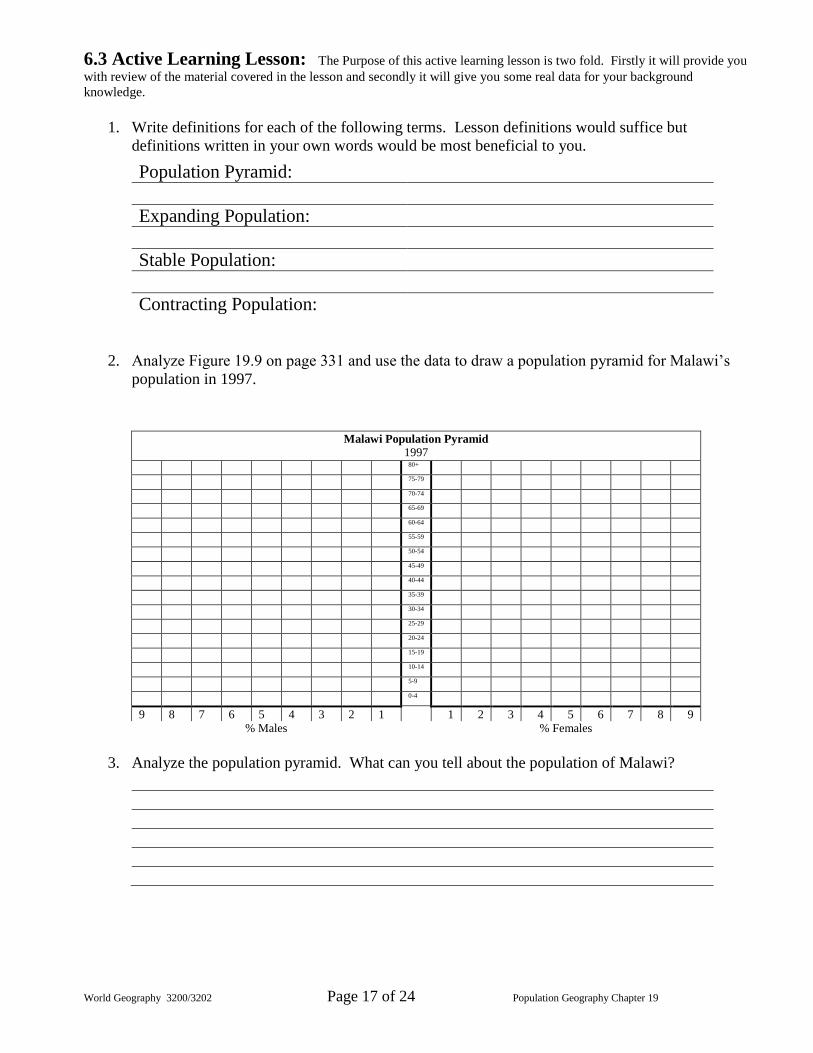
6.3 Active Learning Lesson: The Purpose of this active learning lesson is two fold. Firstly it will provide you
with review of the material covered in the lesson and secondly it will give you some real data for your background
knowledge.
1. Write definitions for each of the following terms. Lesson definitions would suffice but
definitions written in your own words would be most beneficial to you.
Population Pyramid:
Expanding Population:
Stable Population:
Contracting Population:
2. Analyze Figure 19.9 on page 331 and use the data to draw a population pyramid for Malawi’s
population in 1997.
Malawi Population Pyramid
1997
80+
75-79
70-74
65-69
60-64
55-59
50-54
45-49
40-44
35-39
30-34
25-29
20-24
15-19
10-14
5-9
0-4
9 8 7 6 5 4 3 2 1 1 2 3 4 5 6 7 8 9
% Males % Females
3. Analyze the population pyramid. What can you tell about the population of Malawi?
World Geography 3200/3202 Page 18 of 24 Population Geography Chapter 19
4. Analyze the population pyramid you graphed.
a. Calculate the % of the population below 15 years of age. __________
b. Calculate the % of the population over 65 years of age. __________
c. Calculate the dependency ratio for Malawi in 1997. __________
5. Analyze figure 19.12 on page 335 of your text book and complete all of question #18 from page
334.
World Geography 3200/3202 Page 19 of 24 Population Geography Chapter 19
6.4 Actual Population Change The introduction to chapter 19 "Migration and its impact On
Population" on pages 322-323 of your text book. Migration; The term refers to the movement of people from one region to another. This is a rather familiar concept for Newfoundlanders and Labradoreans who see people migrate to Alberta yearly.
Immigration refers to the migration of people into the country, province or region. This is less familiar to Newfoundlanders and Labradoreans.
Emigration refers to the migration of people out of the country, province or region. This is the type of migration
we are familiar with.
Net Migration refers to the difference between immigration and emigration. It would certainly seem the
Newfoundland and Labrador as a whole has a negative net migration while Alberta, and Toronto likely have a positive net migration. As we will see in section 2 this is an indication of how desirable living condition are in a place.
Internal Migration refers to the migration of people within a country province or region. Newfoundland and Labrador experiences a fair degree of internal migration as people move from smaller outports to St. John's.
Actual Change
Actual change recognizes all the factors that can change a population. While natural change only deals with births and deaths, actual change deals with births, deaths, immigration and emigration.
The formula is AC = (B + I) – (D + E)
Where:
AC (Actual Change) = (B (Births) + I (Immigration)) – (D (Deaths) + E (Emigration))
Interesting Aspects of Actual Change
A population can have a natural increase but an actual decrease! HOW?
o If the net migration is negative and greater in magnitude than the natural increase there will be an actual decrease in the population.
o If the relative size of the symbols in the formula can represent the concept:
AC = (B + I) – (D + E)
A population can have a natural decrease but an actual increase! How?
o If the net migration is positive and larger in magnitude that the natural decrease there will be an actual
increase in the population.
o If the relative size of the symbols in the formula can represent the concept:
AC = (B + I) – (D + E)
Newfoundland and Labrador Has a stable population. Why?
o Newfoundland and Labrador is a real statistical anomaly. While in the 60's and 70's we had among the highest birth rates in Canada we now have among the lowest birth rates in Canada. However, while we still might have a slight natural increase we are still experiencing a high emigration rate which counterbalances any natural increase.
How can Newfoundland and Labrador have a actual decrease in population while there is an actual increase in St. John’s?
o Recognizing the fact that St. John's makes up only a portion of the province's population helps explain this. St.
John's is likely experiencing immigration from outside the province and within the province. However the immigration from outside the province is not as great as the emigration from all parts of the island.
World Geography 3200/3202 Page 20 of 24 Population Geography Chapter 19
6.5 Push & Pull Factors "Reasons for Migration" on pages 323-325 of your text book. "Political and
economic conditions in Afghanistan" on pages 325-326 of your text book.
Why do People Migrate?
People move for a wide variety of reason and if we had to establish every reason it would be an insurmountable task. However, we can classify all reasons for moving into one of
two categories. People either want to get away from their place of origin or they want to go to a particular place. Instead of using the term get away factors we use "push factors" and instead of using the term go to factors we use "pull factors".
Besides push forces and pull forces are those forces that keep people in their home
country. Besides pull factors or positive factors that would pull an outsider to the country there are factors such as, culture, lack of money to move, emigration/immigration laws,
family connections and the feeling of home. These factors are referred to as intervening obstacles because they are obstacles to migration.
Push forces refer to disadvantageous factors in the home country that make
people want to leave. Pull Forces: advantageous factors in the drawing country that attract people. Intervening Obstacles : those forces that prevent or inhibit people from moving
such as lack of money, family connections and immigration laws.
Newfoundland Push Factors
Some people might report that they are pushed out of Newfoundland and Labrador for
the following reasons:
1. lack of high-skilled jobs in the IT sector; 2. lack of high-paying jobs;
3. lack of amenities attainable in larger centers.
Some people might report that they were drawn or pulled to or back to Newfoundland and Labrador for the following reasons:
1. friendly people and violence-free atmosphere;
2. lack of hustle and bustle; peaceful life style.
Some people might report that they would leave Newfoundland and Labrador except for obstacles such as:
1. they love the salt water;
2. parents are aging and need help & company; 3. they can not afford the trip away let alone the cost of setting up and trying to find a
job.
World Geography 3200/3202 Page 21 of 24 Population Geography Chapter 19
6.5 Active learning Lesson: The Purpose of this active learning lesson is to guide you through the reading in the
book and help you become informed about Canada’s immigration policy as well as help you form your own opinions on
immigration.
Directions: Read “Immigration Policy In Canada” on pages 327-330 of your text book and complete the questions below.
1. Canada has had some discriminatory immigration policies in the past. Briefly outline one.
2. What affect did these discriminatory policies have on the type of people who were immigrating
to Canada?
3. Analyze figure 19.7 and figure 19.8 both are on page 330 of your text book. Briefly describe
how the source countries for immigration to Canada have changed from the mid 1900’s to the
late 1900’s.
World Geography 3200/3202 Page 22 of 24 Population Geography Chapter 19
4. Canada’s Immigration policy classifies all immigrants into one of three categories or classes,
FAMILY CLASS, INDEPENDENT CLASS, and REFUGEES. Complete the table below which
summarizes the description of each class and how people are assessed to determine if they are
permitted to enter Canada.
Canada’s Immigrant Classes, 1994
Class Description Assessment
Family
Independent
a)________________
b)________________
c)________________
d)________________
e)________________
f)________________
Refugees
World Geography 3200/3202 Page 23 of 24 Population Geography Chapter 19
5. The reading looks at the advantages and disadvantages of allowing immigrants to the country.
Economics and cultural diversity were both named as an advantage and as a disadvantage.
Briefly outline each view in the space provided below.
a. Immigration hurts the economy of Canada
b. Immigrants help the economy of Canada
c. Immigrants result in cultural diversity that can hurt Canada
d. Immigrants result in cultural diversity that can help Canada
6. What is your view on immigration?
World Geography 3200/3202 Page 24 of 24 Population Geography Chapter 19
6.6 Active Learning Lesson: The Purpose of this active learning lesson is to guide you through the reading in
the book and help you become informed about Canada’s census data.
Directions: Read “Population Studies” on pages 336-337 of your text book and complete the questions below.
1. Define Census.
2. Besides each country’s government taking census world organizations like the World Bank and
the population reference bureau also take census data on all countries. WHY?
3. Briefly outline four ways that governments find census data useful.
4. How do you think this census data might be useful to Businesses?