Embed Size (px)
Citation preview
Population Growth andRegulation
Chapter 26
Ecology
• Study of interrelationships between livingthings and their nonliving environment.
• Ecosystems include everything, bioticand abiotic, within a given area.– Biotic things are living things.– Abiotic things are nonliving: soil, water,
weather, etc.• The interacting populations of organisms
within an ecosystem form a community.
Population Size• Populations are all the organisms of a
particular species that live within anecosystem.
• The size of a population can fluctuate in responseto environmental changes.
• The size is regulated by births, deaths, andmigration in or out.– Immigration: migration in to the ecosystem or
population– Emigration: migration out of the population
Changes in Population Size =
(Births - Deaths) + (Immigrants - Emigrants)
• A stable population has the same numberof individuals joining and leaving.
• In most populations, immigrants andemigrants are negligible.
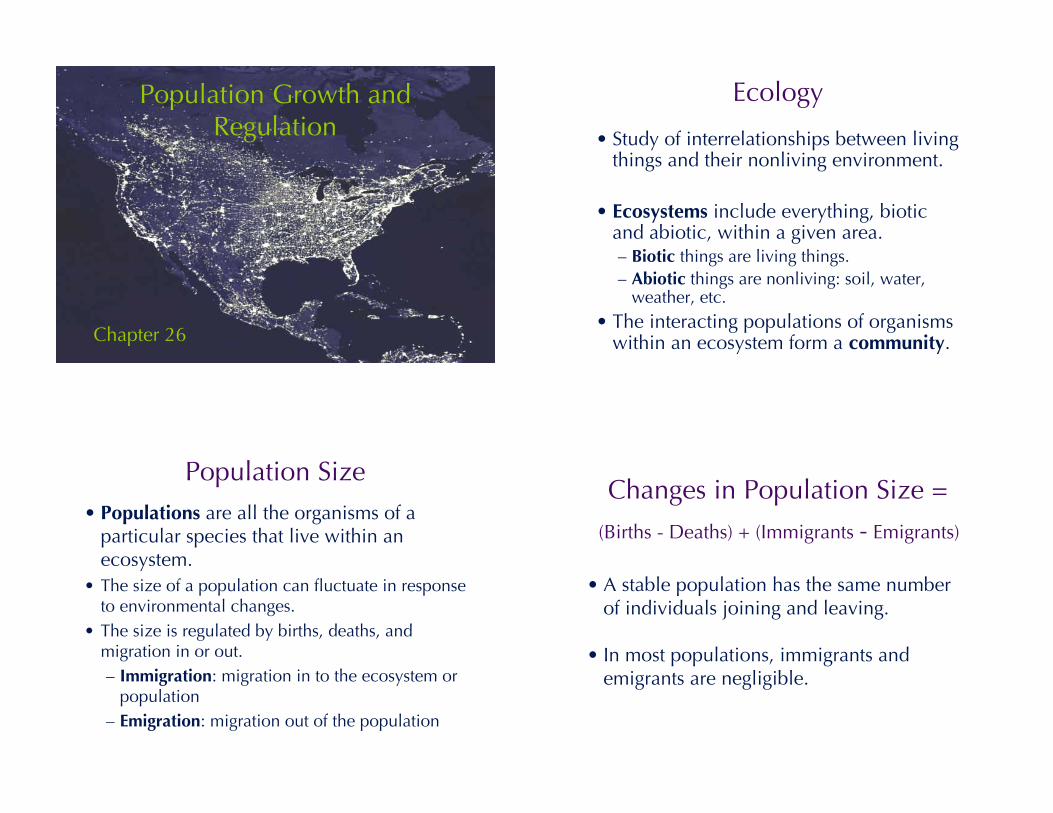
Changes in Population Size• The birth and death rates are limited by
two opposing forces within an ecosystem:• Biotic potential is the maximum rate at which a
population could increase.– In ideal conditions, the biotic potential allows the
maximum birth rate and minimum death rate.
• Environmental resistance limits thepopulation’s ultimate size by increasing deathsand decreasing births.– Competition, predation, parasitism, and natural
events are tools of environmental resistance.
Population Growth
• The growth rate of a population is afunction of the birth rate and death rate.– Birth rate is the number of births per
individual during a specific length of time.– Death rate is the number of deaths per
individual during a specific length of time.
Growth Rate = Birth Rate - Death Rate
R = B - D
Population Growth
Growth Rate = Birth Rate - Death Rate
R = B - D
If B is greater than D
the population size increases.
If D is greater than B
the population will decline.
Exponential Population Growth
• Under optimal conditions, with noenvironmental resistance, populations willexhibit exponential growth.– In a given time period, each member of the
population will produce an offspring.– The population size doubles at fixed intervals,
the doubling time.For example: 2 cells produce 4, 4 become 8,
8 become 16, 16 become 32, 32 become 64, etc.
– Most bacteria exhibit exponential growth inlaboratory settings.
Exponential Growth
Time (min) # Cells0 1030 2060 4090 80120 160150 320180 640210 1280240 2560270 5120300 10240
Growth of E. coli
0
2000
4000
6000
8000
10000
12000
0 100 200 300 400
Time (min)
Num
ber
of Cel
ls
The typical "J curve" showing exponential growth.
Exponential Growth
Time (min) # Cells0 1030 2060 4090 80120 160150 320180 640210 1280240 2560270 5120300 10240
Growth of E. coli
1
10
100
1000
10000
100000
0 100 200 300 400
Time (min)
Num
ber
of Cel
ls
When plotted with an logarithmic y-axis,exponential growth plots as a straight line.
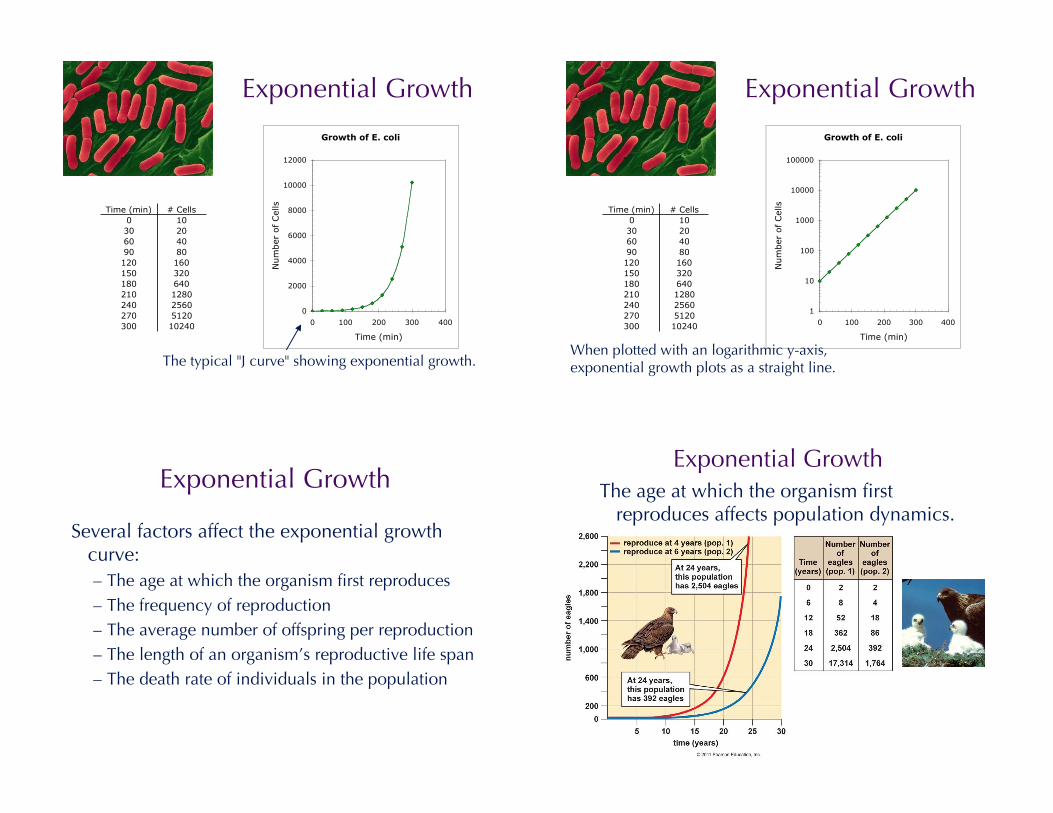
Exponential Growth
Several factors affect the exponential growthcurve:– The age at which the organism first reproduces– The frequency of reproduction– The average number of offspring per reproduction– The length of an organism’s reproductive life span– The death rate of individuals in the population
Exponential GrowthThe age at which the organism first
reproduces affects population dynamics.
Exponential GrowthThe death rate of individuals in the population
affects population size.
Exponential Growth
• In nature, exponential growth onlyoccurs under special circumstances andonly for a limited time.
• Boom-and-Bust cycles occur, wherepopulations undergo rapid growth whennutrients are available and rapid die-offwhen they’re used up.
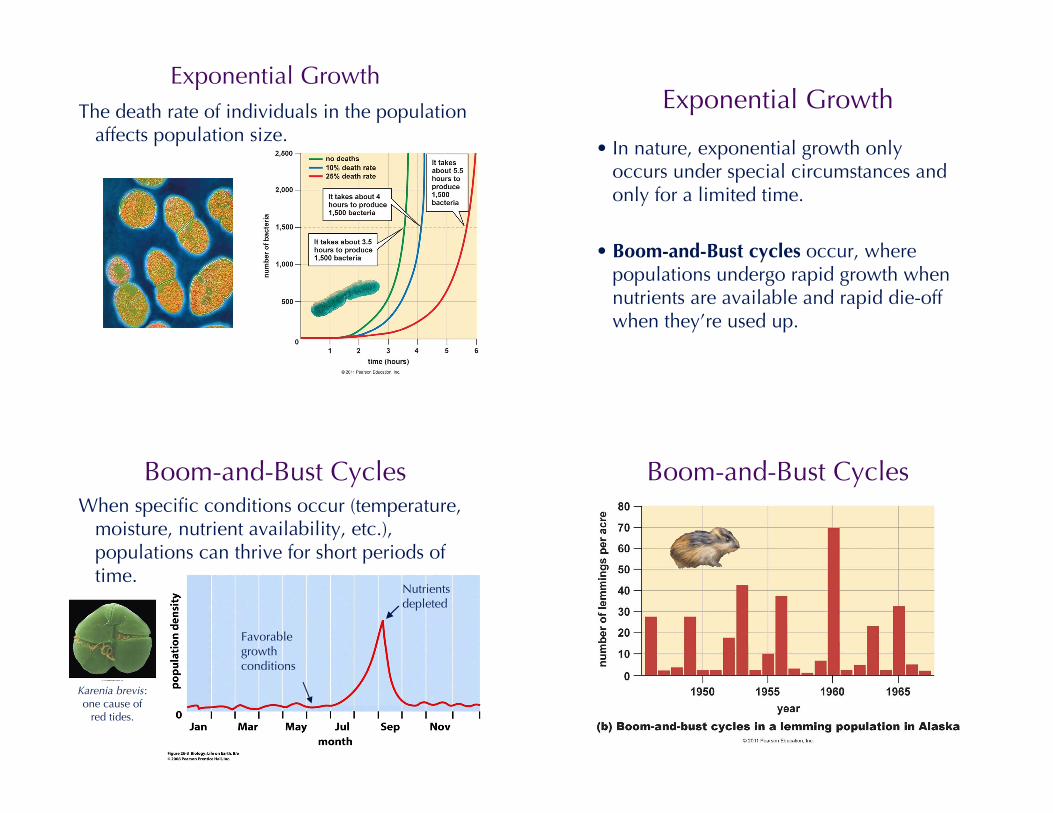
Boom-and-Bust CyclesWhen specific conditions occur (temperature,
moisture, nutrient availability, etc.),populations can thrive for short periods oftime.
Favorablegrowthconditions
Nutrientsdepleted
Karenia brevis:one cause of
red tides.
Boom-and-Bust Cycles
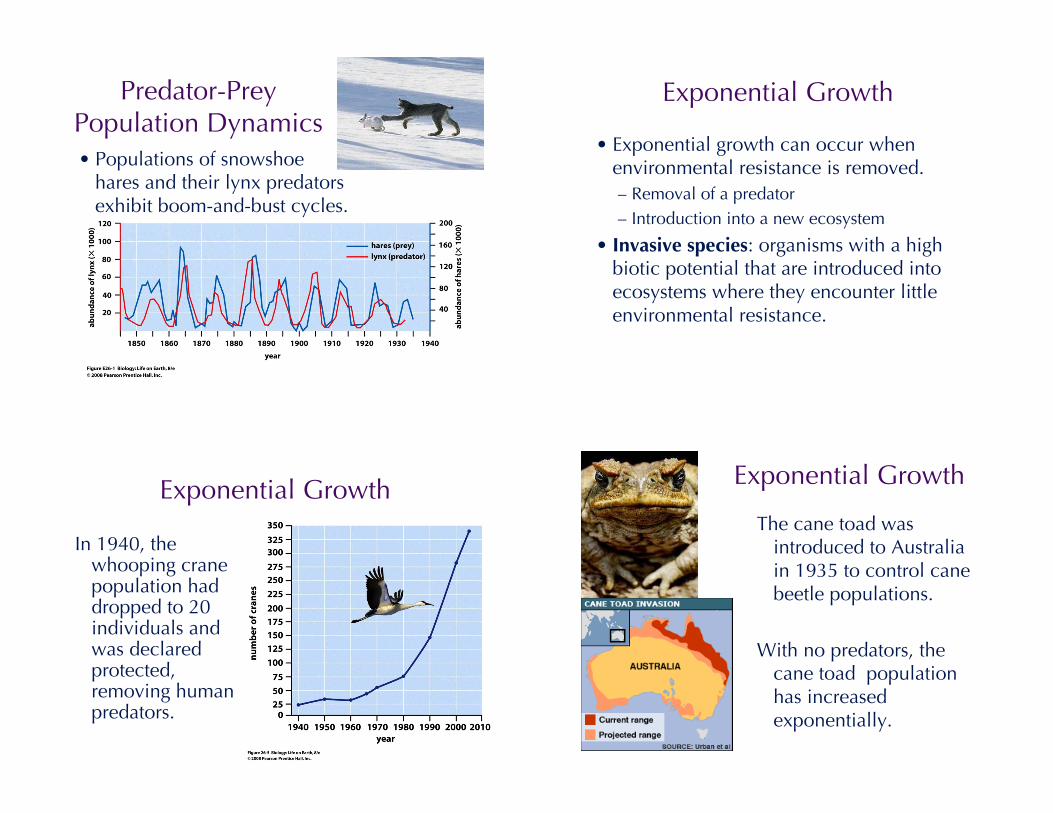
Predator-PreyPopulation Dynamics• Populations of snowshoe
hares and their lynx predatorsexhibit boom-and-bust cycles.
Exponential Growth
• Exponential growth can occur whenenvironmental resistance is removed.– Removal of a predator– Introduction into a new ecosystem
• Invasive species: organisms with a highbiotic potential that are introduced intoecosystems where they encounter littleenvironmental resistance.
Exponential Growth
In 1940, thewhooping cranepopulation haddropped to 20individuals andwas declaredprotected,removing humanpredators.
Exponential Growth
The cane toad wasintroduced to Australiain 1935 to control canebeetle populations.
With no predators, thecane toad populationhas increasedexponentially.
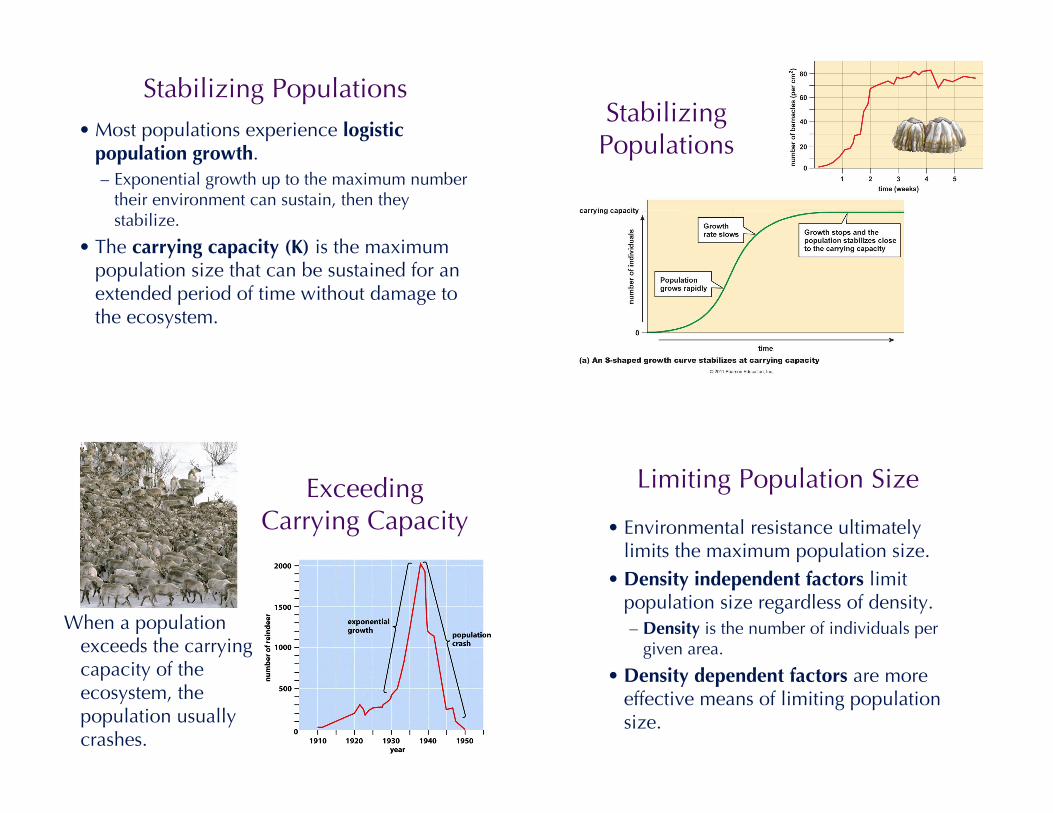
Stabilizing Populations• Most populations experience logistic
population growth.– Exponential growth up to the maximum number
their environment can sustain, then theystabilize.
• The carrying capacity (K) is the maximumpopulation size that can be sustained for anextended period of time without damage tothe ecosystem.
StabilizingPopulations
ExceedingCarrying Capacity
When a populationexceeds the carryingcapacity of theecosystem, thepopulation usuallycrashes.
Limiting Population Size
• Environmental resistance ultimatelylimits the maximum population size.
• Density independent factors limitpopulation size regardless of density.– Density is the number of individuals per
given area.
• Density dependent factors are moreeffective means of limiting populationsize.
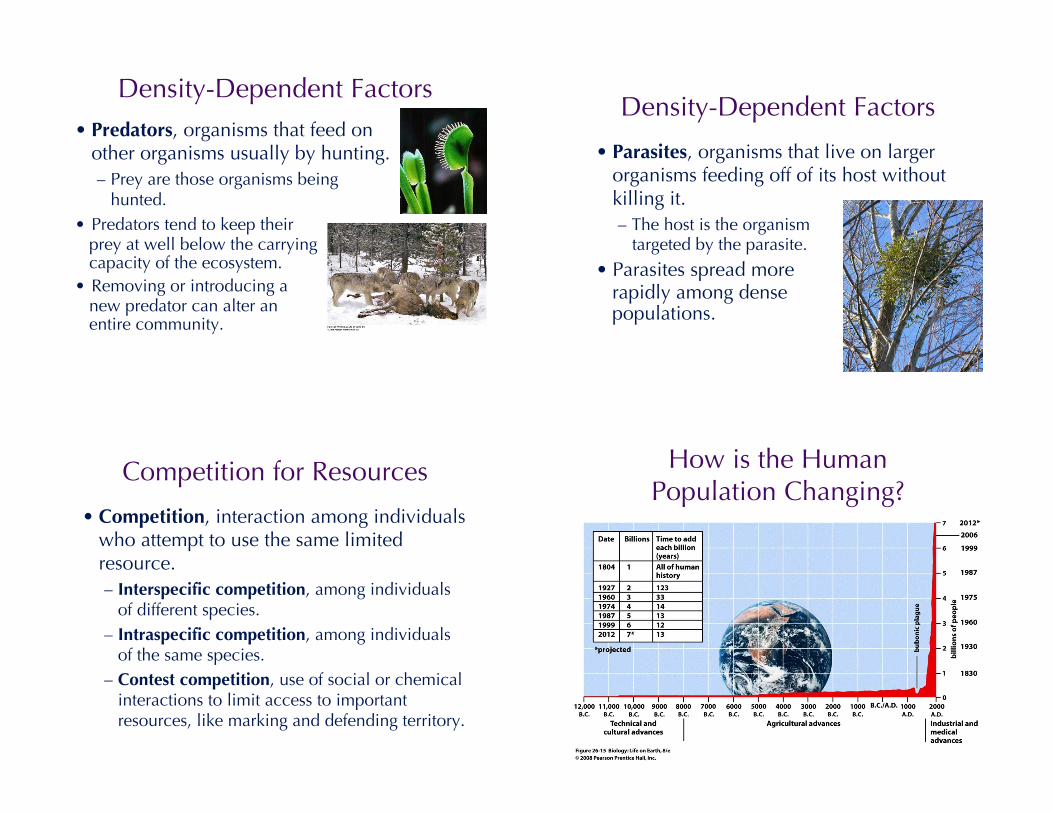
Density-Dependent Factors• Predators, organisms that feed on
other organisms usually by hunting.– Prey are those organisms being
hunted.• Predators tend to keep their prey at well below the carrying capacity of the ecosystem.• Removing or introducing a new predator can alter an entire community.
Density-Dependent Factors
• Parasites, organisms that live on largerorganisms feeding off of its host withoutkilling it.– The host is the organism targeted by the parasite.
• Parasites spread more rapidly among dense populations.
Competition for Resources
• Competition, interaction among individualswho attempt to use the same limitedresource.– Interspecific competition, among individuals
of different species.– Intraspecific competition, among individuals
of the same species.– Contest competition, use of social or chemical
interactions to limit access to importantresources, like marking and defending territory.
How is the HumanPopulation Changing?
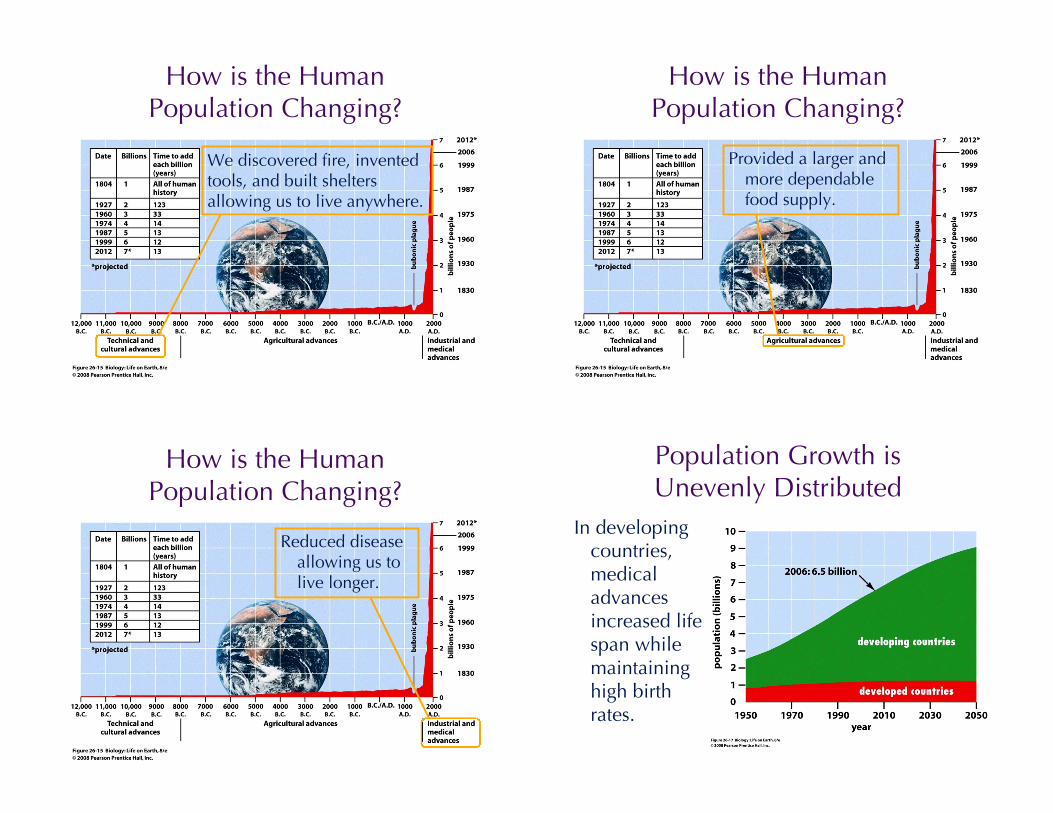
How is the HumanPopulation Changing?
We discovered fire, inventedtools, and built sheltersallowing us to live anywhere.
How is the HumanPopulation Changing?
Provided a larger andmore dependablefood supply.
How is the HumanPopulation Changing?
Reduced diseaseallowing us tolive longer.
Population Growth isUnevenly Distributed
In developingcountries,medicaladvancesincreased lifespan whilemaintaininghigh birthrates.
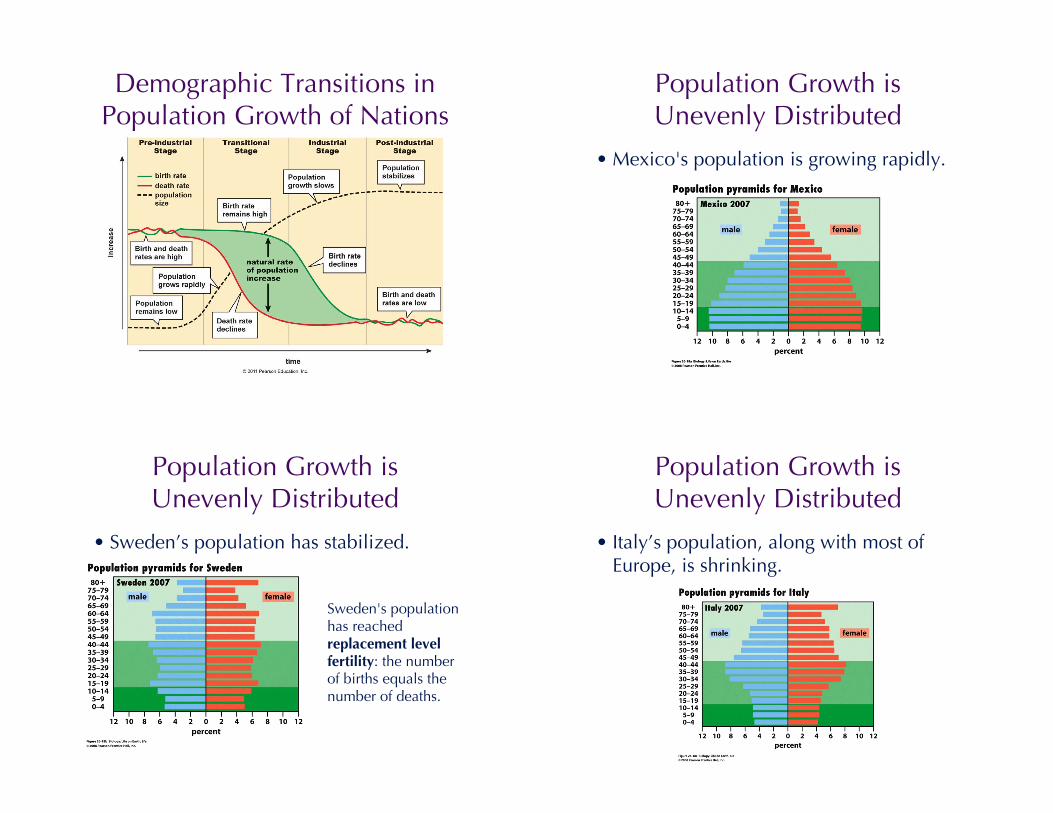
Demographic Transitions inPopulation Growth of Nations
Population Growth isUnevenly Distributed
• Mexico's population is growing rapidly.
Population Growth isUnevenly Distributed
• Sweden’s population has stabilized.
Sweden's populationhas reachedreplacement levelfertility: the numberof births equals thenumber of deaths.
Population Growth isUnevenly Distributed
• Italy’s population, along with most ofEurope, is shrinking.
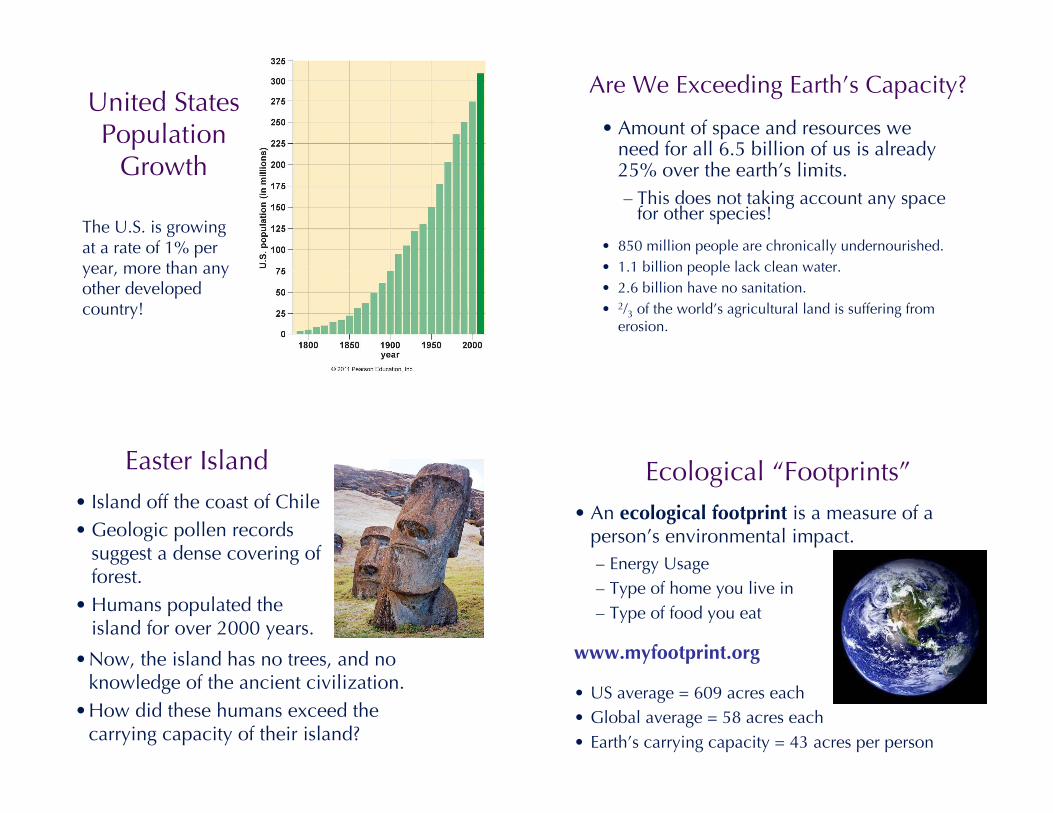
United StatesPopulation
Growth
The U.S. is growingat a rate of 1% peryear, more than anyother developedcountry!
Are We Exceeding Earth’s Capacity?
• Amount of space and resources weneed for all 6.5 billion of us is already25% over the earth’s limits.– This does not taking account any space
for other species!
• 850 million people are chronically undernourished.• 1.1 billion people lack clean water.• 2.6 billion have no sanitation.• 2/3 of the world’s agricultural land is suffering from
erosion.
Easter Island• Island off the coast of Chile• Geologic pollen records
suggest a dense covering offorest.
• Humans populated theisland for over 2000 years.
•Now, the island has no trees, and noknowledge of the ancient civilization.
•How did these humans exceed thecarrying capacity of their island?
Ecological “Footprints”• An ecological footprint is a measure of a
person’s environmental impact.– Energy Usage– Type of home you live in– Type of food you eat
www.myfootprint.org
• US average = 609 acres each• Global average = 58 acres each• Earth’s carrying capacity = 43 acres per person
Homework
• Thinking Through the Concepts, Review Question #9.
• Applying the Concepts #5
• Calculate your ecological footprint atwww.myfootprint.org. Name one thing(from the questions they ask) that youcould realistically do to decrease yourecological footprint.