Embed Size (px)
Citation preview

Population Health: Challenges for Science and Society
David Mechanic, Ph.D.
Institute for Health, Health Care Policy and Aging Research
Rutgers, the State University of New Jersey
1st Matilda White Riley Annual Lecturein the Behavioral and Social Sciences
National Institutes of HealthBethesda, MDMay 22, 2006

Exhibit 1Presentation Outline
• The importance of social selection – role of selection in shaping health outcomes
• Early influences on later disease
• Broad social factors affecting population health and social disparities
• Intervention strategies
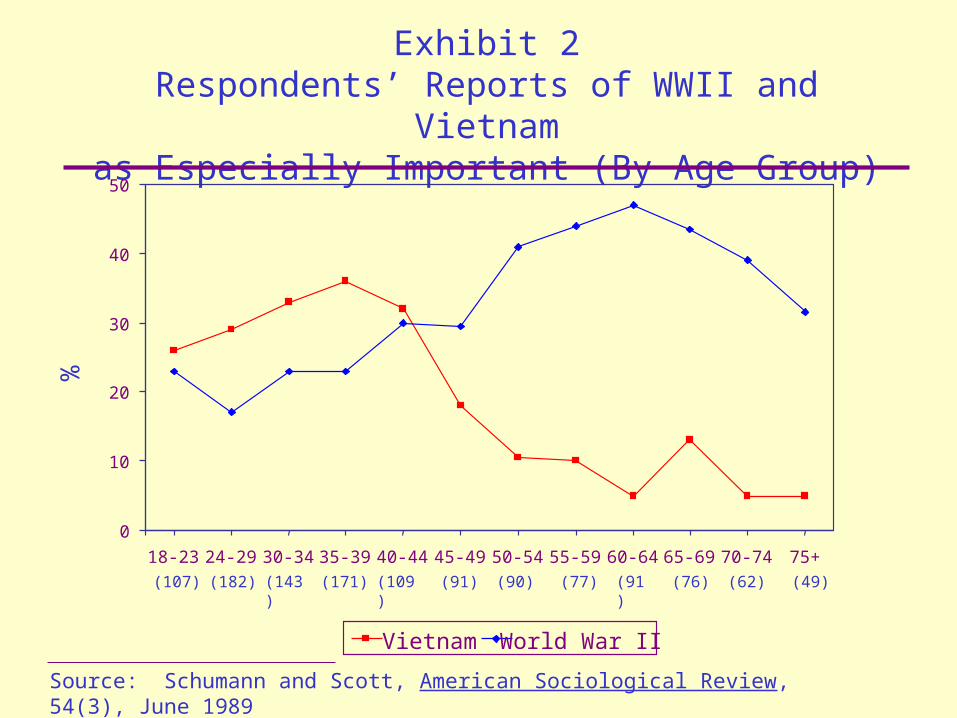
Exhibit 2Respondents’ Reports of WWII and Vietnam
as Especially Important (By Age Group)
0
10
20
30
40
50
18-23 24-29 30-34 35-39 40-44 45-49 50-54 55-59 60-64 65-69 70-74 75+
Vietnam World War II
(107) (182) (143) (171) (109) (91) (90) (77) (91) (76) (62) (49)
Source: Schumann and Scott, American Sociological Review, 54(3), June 1989
%
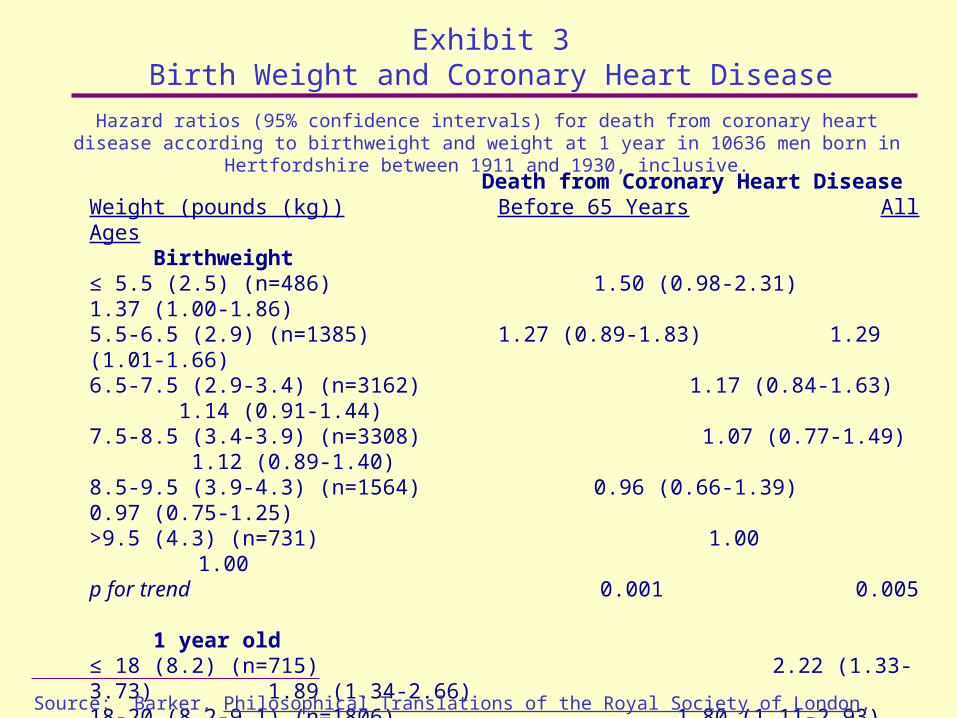
Exhibit 3Birth Weight and Coronary Heart Disease
Death from Coronary Heart DiseaseWeight (pounds (kg)) Before 65 Years All Ages Birthweight≤ 5.5 (2.5) (n=486) 1.50 (0.98-2.31) 1.37 (1.00-1.86)5.5-6.5 (2.9) (n=1385) 1.27 (0.89-1.83) 1.29 (1.01-1.66)6.5-7.5 (2.9-3.4) (n=3162) 1.17 (0.84-1.63) 1.14 (0.91-1.44)7.5-8.5 (3.4-3.9) (n=3308) 1.07 (0.77-1.49) 1.12 (0.89-1.40)8.5-9.5 (3.9-4.3) (n=1564) 0.96 (0.66-1.39) 0.97 (0.75-1.25)>9.5 (4.3) (n=731) 1.00 1.00p for trend 0.001 0.005
1 year old≤ 18 (8.2) (n=715) 2.22 (1.33-3.73) 1.89 (1.34-2.66)18-20 (8.2-9.1) (n=1806) 1.80 (1.11-2.93) 1.58 (1.15-2.16)20-22 (9.1-10.0) (n=3404) 1.96 (1.23-3.12) 1.66 (1.23-2.25)22-24 (10.0-10.9) (n=2824) 1.52 (0.95-2.45) 1.36 (1.00-1.85)24-26 (10.9-11.8) (n=1391) 1.36 (0.82-2.26) 1.29 (0.93-1.78)>26 (11.8) (n=496) 1.00 1.00p for trend <0.001 <0.001
Source: Barker, Philosophical Translations of the Royal Society of London, 359(1449), September 29, 2004
Hazard ratios (95% confidence intervals) for death from coronary heart disease according to birthweight and weight at 1 year in 10636 men born in Hertfordshire between 1911 and 1930, inclusive.
Exhibit 4Growth Patterns and Coronary Heart Disease
Mean Z scores for height, weight, and body-mass index in the first 11 years after birth among boys who had coronary heart disease as adults. The mean values for all boys are set at zero, with deviations from the mean expressed as a standard deviation (z scores).
Adapted from Barker, et al., New England Journal of Medicine, 353(17): 1802-1809, 2005
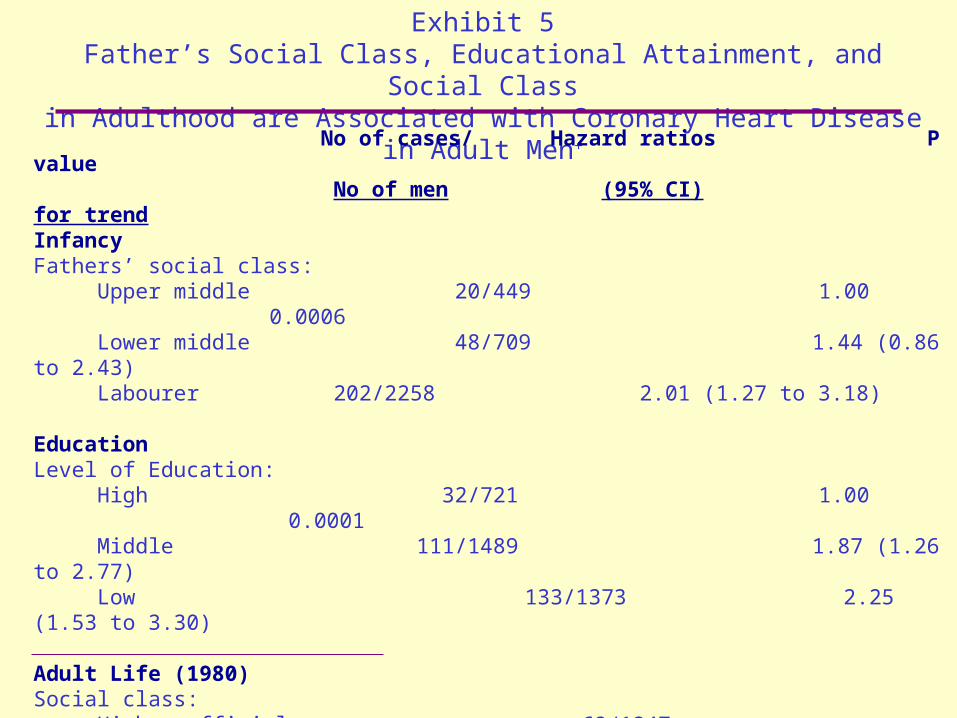
Exhibit 5Father’s Social Class, Educational Attainment, and Social Class
in Adulthood are Associated with Coronary Heart Disease in Adult Men+
No of cases/ Hazard ratios P value No of men (95% CI) for trend
InfancyFathers’ social class: Upper middle 20/449 1.00 0.0006 Lower middle 48/709 1.44 (0.86 to 2.43) Labourer 202/2258 2.01 (1.27 to 3.18)
EducationLevel of Education: High 32/721 1.00 0.0001 Middle 111/1489 1.87 (1.26 to 2.77) Low 133/1373 2.25 (1.53 to 3.30)
Adult Life (1980)Social class: Higher official 62/1247 1.00 <0.0001 Lower official 69/888 1.62 (1.15 to 2.28) Self employed 22/240 1.83 (1.12 to 2.97) Labourer 132/1301 2.15 (1.59 to 2.91)
+ Adapted from Barker et al., British Medical Journal, 323, no. 7324, December 1, 2001, page 1274

Exhibit 6The Link-Phelan Hypothesis of
Social Class as a Fundamental Cause
• Risk factors change over time but the social class/mortality association remains robust
• Social class is primarily associated with mortality from preventable disease
• Social class more important than cognitive capacity in explaining mortality/morbidity
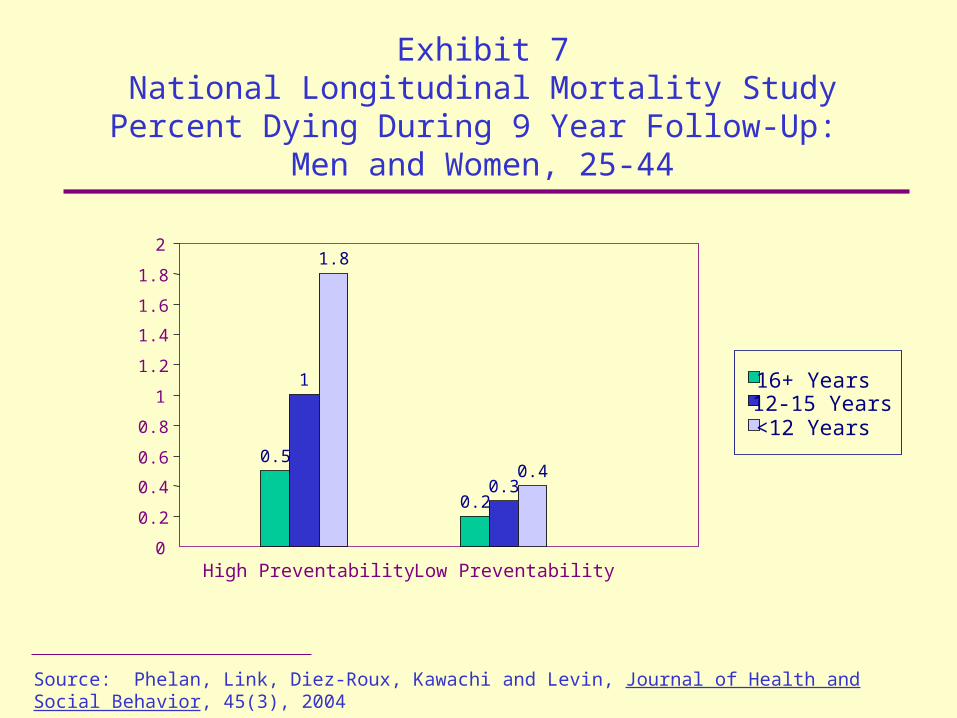
Exhibit 7National Longitudinal Mortality Study
Percent Dying During 9 Year Follow-Up: Men and Women, 25-44
0.5
0.2
1
0.3
1.8
0.4
0
0.2
0.4
0.6
0.8
1
1.2
1.4
1.6
1.8
2
High Preventability Low Preventability
16+ Years12-15 Years<12 Years
Source: Phelan, Link, Diez-Roux, Kawachi and Levin, Journal of Health and Social Behavior, 45(3), 2004
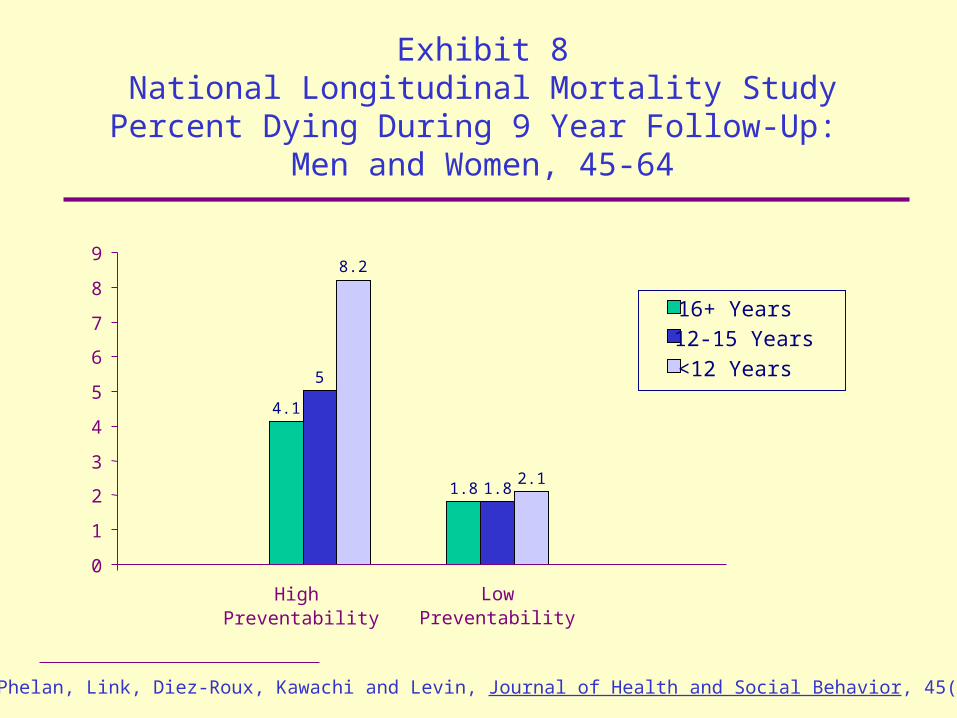
Exhibit 8National Longitudinal Mortality Study
Percent Dying During 9 Year Follow-Up: Men and Women, 45-64
4.1
1.8
5
1.8
8.2
2.1
0
1
2
3
4
5
6
7
8
9
HighPreventability
LowPreventability
16+ Years
12-15 Years
<12 Years
Source: Phelan, Link, Diez-Roux, Kawachi and Levin, Journal of Health and Social Behavior, 45(3), 2004

Exhibit 9
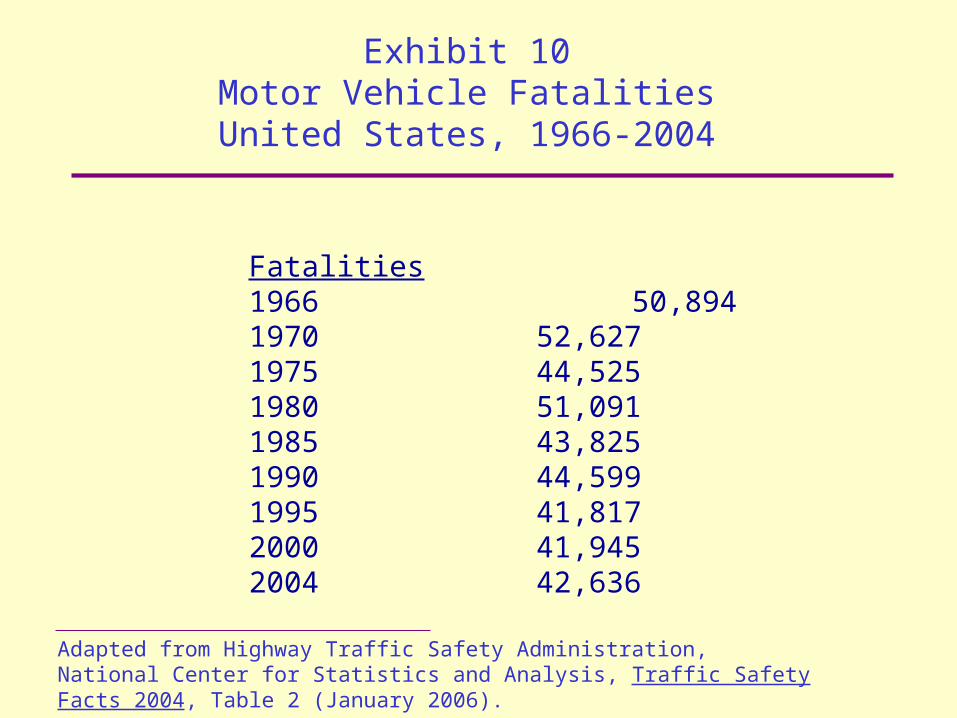
Exhibit 10Motor Vehicle Fatalities
United States, 1966-2004
Fatalities1966 50,8941970 52,6271975 44,5251980 51,0911985 43,8251990 44,5991995 41,8172000 41,9452004 42,636
Adapted from Highway Traffic Safety Administration, National Center for Statistics and Analysis, Traffic Safety Facts 2004, Table 2 (January 2006).
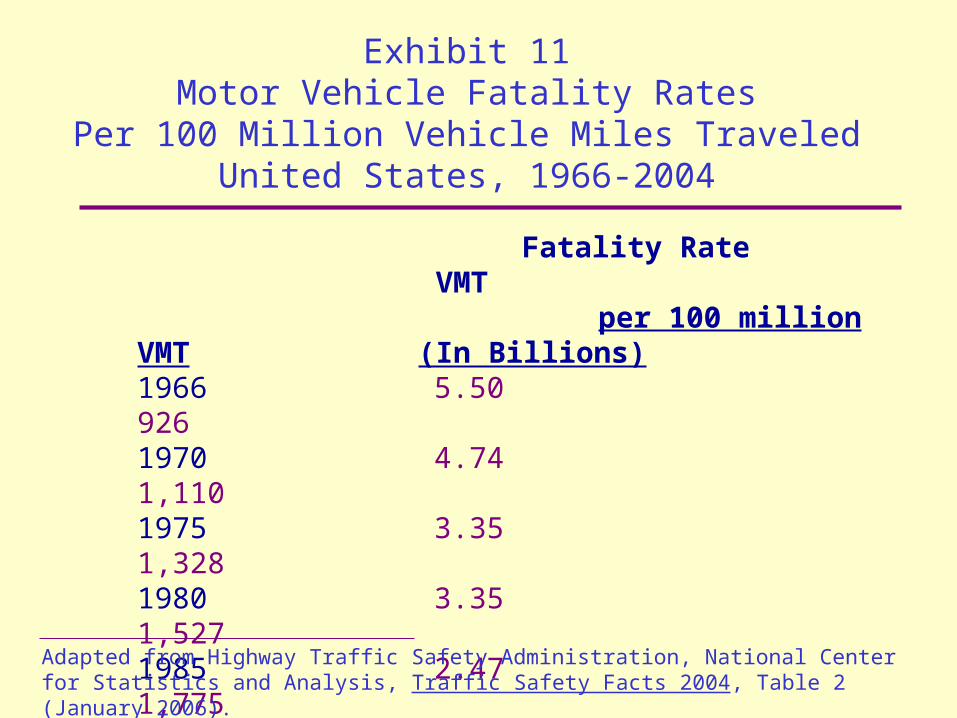
Exhibit 11Motor Vehicle Fatality Rates
Per 100 Million Vehicle Miles TraveledUnited States, 1966-2004
Fatality Rate VMT per 100 million VMT (In Billions)
1966 5.50 9261970 4.74 1,1101975 3.35 1,3281980 3.35 1,5271985 2.47 1,7751990 2.08 2,1441995 1.73 2,4232000 1.53 2,7472004 1.44 2,963
Adapted from Highway Traffic Safety Administration, National Center for Statistics and Analysis, Traffic Safety Facts 2004, Table 2 (January 2006).
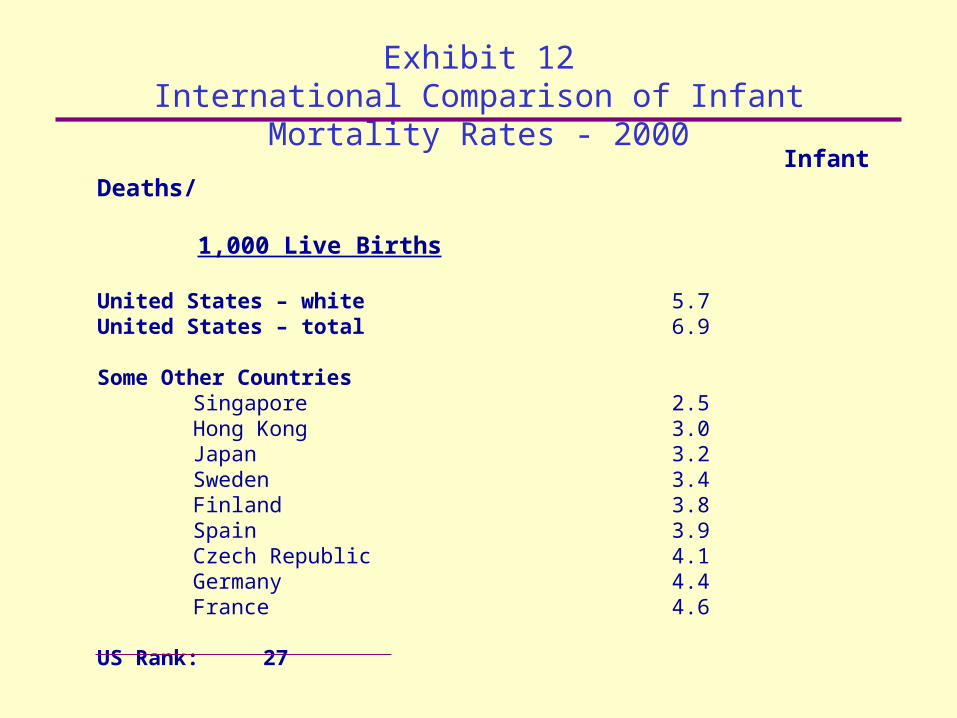
Exhibit 12International Comparison of Infant Mortality Rates - 2000
Infant Deaths/ 1,000 Live Births
United States – white 5.7United States – total 6.9
Some Other CountriesSingapore 2.5Hong Kong 3.0Japan 3.2Sweden 3.4Finland 3.8Spain 3.9Czech Republic 4.1Germany 4.4France 4.6
US Rank: 27
Adapted from Health, United States, 2004, Tables 19 and 25
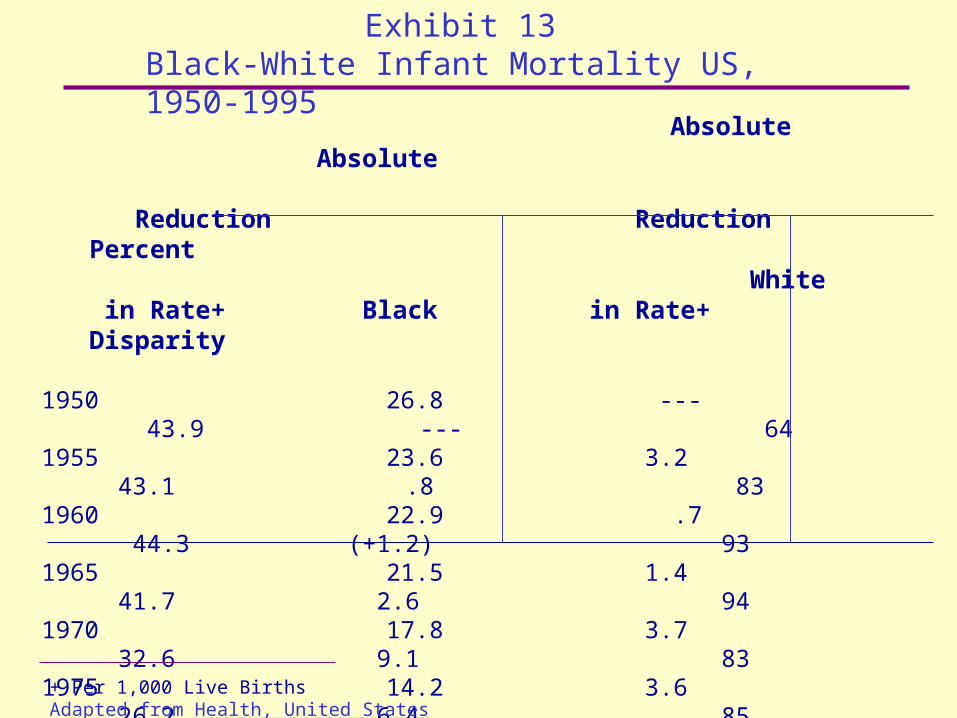
Exhibit 13Black-White Infant Mortality US, 1950-1995
Absolute Absolute Reduction Reduction Percent
White in Rate+ Black in Rate+ Disparity
1950 26.8 --- 43.9 --- 641955 23.6 3.2 43.1 .8 831960 22.9 .7 44.3 (+1.2) 931965 21.5 1.4 41.7 2.6 94 1970 17.8 3.7 32.6 9.1 831975 14.2 3.6 26.2 6.4 85 1983 9.3 4.9 19.2 7.0 1061985 8.9 .4 18.6 .61990 7.3 1.6 16.9 1.7 132 1995 6.3 1.0 14.6 2.3 132
Total Absolute 20.5 29.3Reduction inRate, 1950-1995+ Per 1,000 Live Births Adapted from Health, United States
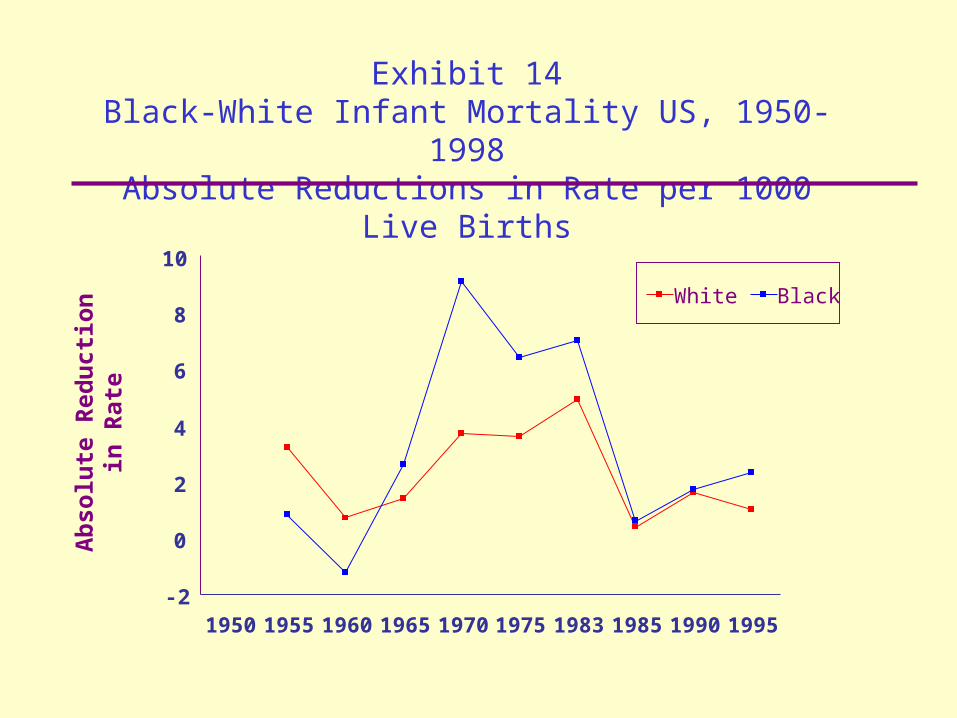
Exhibit 14Black-White Infant Mortality US, 1950-1998
Absolute Reductions in Rate per 1000 Live Births
Ab
solu
te R
edu
ctio
nin
Rat
e
-2
0
2
4
6
8
10
1950 1955 1960 1965 1970 1975 1983 1985 1990 1995
White Black
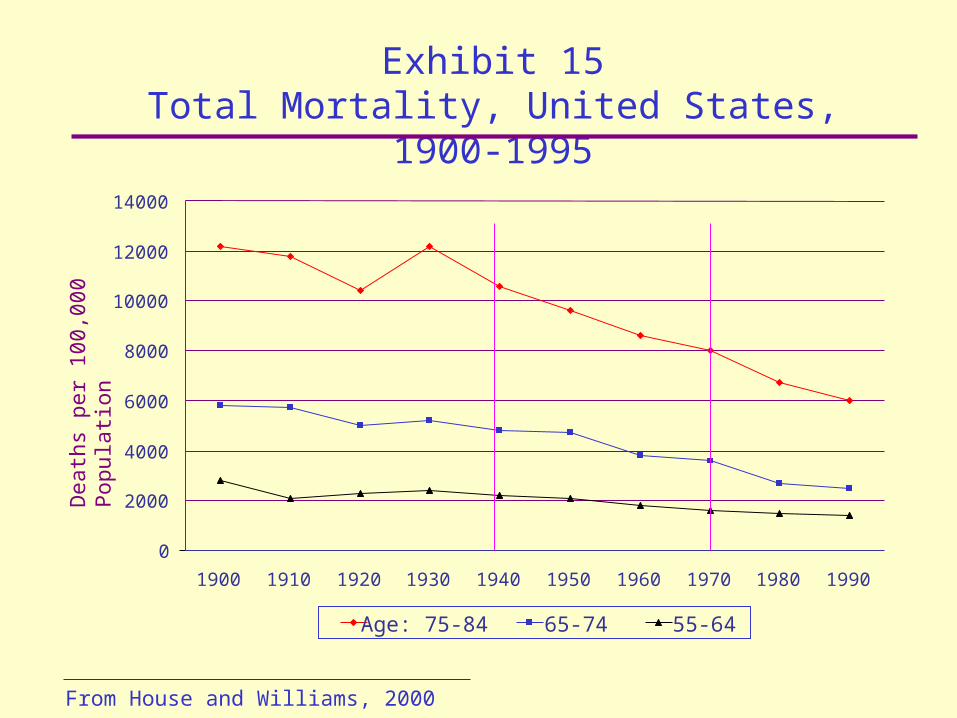
Exhibit 15Total Mortality, United States, 1900-1995
From House and Williams, 2000
0
2000
4000
6000
8000
10000
12000
14000
1900 1910 1920 1930 1940 1950 1960 1970 1980 1990
Age: 75-84 65-74 55-64
Dea
ths
per
100,
000
Pop
ulat
ion