Embed Size (px)
Citation preview

Population projections for Hungary and Slovakia at national, regional and local levels
Branislav Bleha, Branislav Šprocha, Boris Vaňo INFOSTAT, Bratislava
Erzsébet Földházi
Hungarian Demographic Research Institute
2014

Population projections in Hungary and Slovakia were developed in the framework of SEEMIG – Managing Migration and its Effects in SEE – Transnational Actions towards Evidence-based Strategies. SEEMIG is a strategic project funded by the European Union’s South-East Europe Programme. Project code: SEEMIG - SEE/C/0006/4.1/X Lead Partner: Hungarian Central Statistical Office Population projections in Hungary and Slovakia were prepared within the SEEMIG activity Developing scenarios of demographic, migratory and labour market processes by INFOSTAT Bratislava and the Hungarian Demographic Research Institute. The information published here reflects the authors’ views and the Managing Authority is not liable for any use that may be made of the information concerned.
© Branislav Bleha, Erzsébet Földházi, Branislav Šprocha, Boris Vaňo All rights reserved. Information for reproducing excerpts from this report can be found at www.seemig.eu. Inquiries can also be directed to: INFOSTAT, Leškova 16, Bratislava or by contacting [email protected]. Suggested citation: Bleha, Branislav – Földházi, Erzsébet – Šprocha, Branislav – Vaňo, Boris (2014): Population projections for Hungary and Slovakia at national, regional and local levels. Population projections developed within the project ‘SEEMIG Managing Migration and Its Effects – Transnational Actions Towards Evidence Based Strategies’.http://www.seemig.eu/downloads/outputs/SEEMIGPopulationProjectionsHUSK.pdf
Content
1. Introduction and brief methodological comments 4
2. Population forecast at national level – basic scenarios 6
2.1 Population forecast of the Slovak Republic at national level 6
2.2 Population forecast of Hungary at national level 14
3. Zero migration scenario 23
3.1 Zero migration scenario in case the Slovak Republic 23
3.2 Zero migration scenario in case of Hungary 24
4. Real migration scenario 26
4.1 Real migration scenario in case of the Slovak Republic 26
4.2 Real migration scenario in case of Hungary 28
5. Replacement migration scenario 41
5.1 Replacement migration scenario in case of the Slovak Republic 41
5.2 Replacement migration scenario in case of Hungary 42
6. Sub-national (NUTS-III) forecasts 43
6. 1 Sub-national forecast of the Slovak republic 43
6. 2 Sub-national forecast of Hungary 51
7. Local forecasts 63
7.1 Local forecast of the city of Turčianske Teplice 63
7.2 Local forecast of the city of Pécs 65
8. Comparison of Hungary and the Slovak republic with concluding remarks 69

1. Introduction and brief methodological comments
Six scenarios of the future national population development have been prepared for both Hungary
and Slovakia. The most frequently used three-variant demographical forecast represents the basic
output. It has been prepared with using of most commonly applied Cohort-Component method in
the deterministic (variant) way. The three major components of the future demographical change are
modelled, namely the processes of fertility, mortality and migration. The respective estimated rates
of probabilities of these processes are being applied to demographical cohorts. A few alternative
methods are used for modelling population development – for instance probabilistic, micro-
simulation or accounting methods - yet, the Cohort-Component method appears to be to most
acceptable in case of the UN, EUROSTAT and official national forecasts.
Forecasts differ from projection scenarios (simulations) introduced below (Keilman 1990, Smith et al.
2001, Bleha 2006). Unlike projections are population forecasts are unconditional. They represent the
forecasters´ view on the future most likely population change. Forecasts are unconditional expressing
the future „true“ according to their authors, whereas projections put some primary external
preconditions thus showing what would happen if some assumptions are given. Sometimes they play
the role of so called “warning” scenarios. They were frequently used during the times when Paul
Ehrlich published the “Population Bomb” in 1968. At that time, the population explosion was
perceived as one of the most probable future scenarios since the running demographic revolution in
developed countries made the population increase very strong. Thus, several warning future
scenarios were drafted, showing to the public what will happen if the fertility remains at extremely
high levels. As the subsequent development shows, the fertility and mortality like “blades of
demographical scissors” were re-approaching again, resulting in decelerating rates of population
increase.
Since the 1970s population implosion became an actual topic in Europe and other developed
countries. Instead of the previously anticipated rapid population increase, de-population and
population ageing have taken over the central stage of demography. Following these trends, three
alternative population scenarios were prepared in WP 5. All three simulations differ in the migration
assumptions, whereas the fertility and mortality assumptions are borrowed from the medium
scenario.
Zero-migration scenario shows what will be the population development if no migration gains occur.
In other words, it puts the view on demographic future influenced by the fertility and mortality
exclusively. The difference between forecasts with incorporated and zero migration projection

actually represents the clear impact of migration on the population change which appears to be
positive in case of most European countries.
The “real migration” scenario takes migration not registered in the vital statistics into consideration.
Estimation and incorporation of undocumented migration flows are the main objectives of this
scenario. Since the official data on migration are very likely underestimated - especially in case of
out-migration - there is a great need for such scenarios. The real migration variant was drafted with
the medium variant of fertility and mortality.
Finally, the “replacement migration” scenario has been calculated (see UN 2000, Coleman 2003, Lutz
and Scherbov 2003 for more information). The results of such a scenario provide answers to the
following question: What degree of net migration is needed to avert depopulation? In other words,
the simulation demonstrates what level of net migration is inevitable to avoid the natural decrease.
It represents “the compensation” level of net-migration. The real-migration variant was drafted with
the medium variant of fertility and mortality.
At the sub-national level, a medium (most likely) scenario was used. This scenario was drafted on the
NUTS-III, regional level in cooperation with local partners, the cities of Turčianske Teplice and Pécs.
level scenarios horizon
National level
Low 2060
Medium 2060
High 2060
Real-migration 2060
Zero-migration 2060
Replacement migration 2060
Regional level (NUTS-III)
Medium 2035
Local level (Turčianske Teplice, Pécs) Medium 2025
Table 1. Overview of the forecasting scenarios in the WP5

2. Population forecast at national level – basic scenarios
Population forecast at national level has been calculated for both countries in three basic scenarios –
medium, high and low. These three scenarios represent the possible, real development of number
and age structure of population as a consequence of possible, real development of fertility, mortality
and migration. The medium scenario represents the most likely development from today’s
perspective. The high scenario presents the less likely but still realistic development in terms of
higher fertility and net migration, and lower mortality, as opposed to the low scenario, which
presents the less likely but still realistic development in terms of lower fertility and net migration,
and higher mortality.
2.1 Population forecast of the Slovak Republic at national level
Population development in Slovakia has changed dramatically since 1989. Substantial changes during
the post-communist era have been described and analysed in many studies (Philipov and Dorbritz,
2003, Potančoková et al. 2008, and many others). As most significant were identified shifts in the
process of fertility and family behaviour. While the drop in fertility has caused a very strong fertility-
dominated ageing, increase of life expectancy has affected the ageing at the top of age pyramid. The
affiliated processes such as divorces, marriages and family formations also changed substantially.
Assumptions:
A detailed cohort and transversal analysis of recent trends in fertility was completed in order to
obtain sufficient information and a sufficient base for modelling future assumptions. Three major
variants of fertility are introduced below, where the medium scenario represents the most likely
future of fertility. The low scenario represents the very low frontier. On the other hand the total
fertility rate will not exceed the level that was specified in the high scenario. The increase of the total
fertility rates is supposed in all three scenarios (Figure 1). Replacement level of 2 children per woman
is too optimistic and unlikely, even if the most optimistic assumptions of high scenario are taken into
consideration. The recuperation of postponed births will end in a relatively short time, which is
unlikely to take several years at the most. Therefore, potential for a stronger grow is limited.
The timing of fertility changed in the last 20 years and the changes will continue in coming decades.
Fertility of older women aged 30 year and over will continue to have a growing tendency, whereas
the intensity of fertility of younger women will be going down. The fertility of women aged 35 and
over is supposed to increase by more than 50% (Figure 2).

Figure 1. The total fertility rate until 2060 (the Slovak republic)
Figure 2. The timing of fertility until 2060 in medium scenario (the Slovak republic)
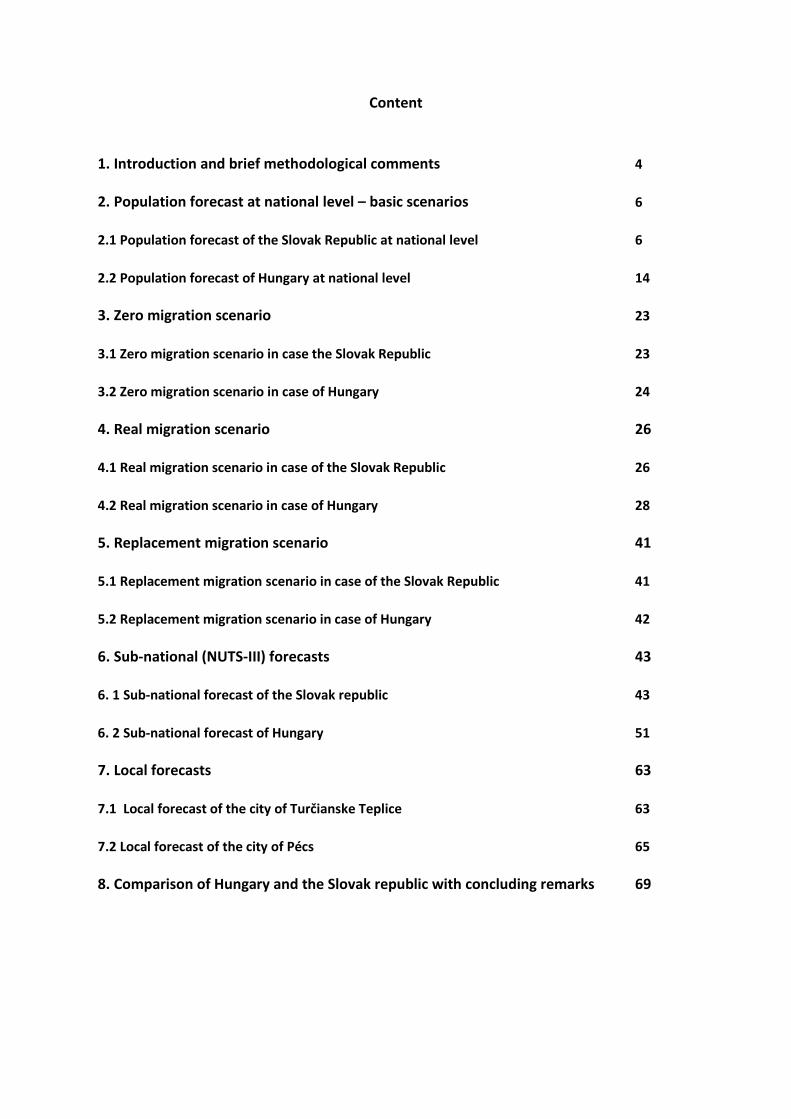
Trends in male and female mortality of the population have been positive after 1989. The increase of
life expectancy is supposed to continue in future in all three scenarios. The most intensive increase
will take place in those age groups, in which the difference in comparison to the Western European
populations is the most significant. In these age groups, the “potential” for increase is significant, and
therefore the rate of contribution to the increase of life expectancy is the highest. The difference
between male and female mortality was extremely high during the communist period. This gap has
been shrinking in the last two decades. Nevertheless, in spite of a slightly more positive
development, male mortality remains relatively high. It is expected that male life expectancy will
increase approximately by 14% , and female life expectancy by 9% until 2060 (Figure 3). In spite of
this anticipated development, the difference between male and female life expectancy at birth will
1,001,101,201,301,401,501,601,701,801,902,00
20
11
20
14
20
17
20
20
20
23
20
26
20
29
20
32
20
35
20
38
20
41
20
44
20
47
20
50
20
53
20
56
20
59
Low Medium High
0,00
0,02
0,04
0,06
0,08
0,10
0,12
0,14
15 20 25 30 35 40 45
Child
ren p
er
one w
om
an in
repro
ductive a
ge
Age
2011
2020
2040
2060
be still about 4 years. The most significant contribution to the increase in male life expectancy will
take place in the 60 – 75 age category (5 years approximately). This represents about half of the
overall increase. With respect to female mortality, in age categories of 60-79 and 80+ is anticipated
life expectancy to increase by 3 years (80% of increase will be induced by the oldest population aged
60 years over).
Figure 3. Life expectancy at birth until 2060 (the Slovak republic)
The process of migration is perceived as very volatile in the demographic literature. The uncertainty
and inaccuracy of forecasts, especially on local and regional level, is very often caused by inaccurate
migratory assumptions. Demographers pay a strong attention to the evaluation of population
forecasts (Keyfitz 1981, Keilman a Kučera 1991, Keilman 1997, Bleha 2007). Migration represents a
very comprehensive system and the matrix of factors is very complicated. In the second half of the
20th Century, the fertility had major impact on the inaccuracy of the population forecasts. Its level
changed over time, waves caused by post-World War baby booms were later replaced by the Second
demographic transition. Moreover, some pro-natal measures influenced fertility trends in several
communistic countries. Recently, fertility fluctuates in a very narrow, as well as very low interval.
Thus, the relative importance of migration concerning the inaccuracy has been growing.
72
74
76
78
80
82
84
86
88
90
20
12
20
16
20
20
20
24
20
28
20
32
20
36
20
40
20
44
20
48
20
52
20
56
20
60
Lif
e e
xp
acta
nc
y a
t b
irth
MA
LE
S
Low
Medium
High
72
74
76
78
80
82
84
86
88
90
20
12
20
16
20
20
20
24
20
28
20
32
20
36
20
40
20
44
20
48
20
52
20
56
20
60L
ife e
xp
ecta
nc
y a
t b
irth
FE
MA
LE
S
Low
Medium
High
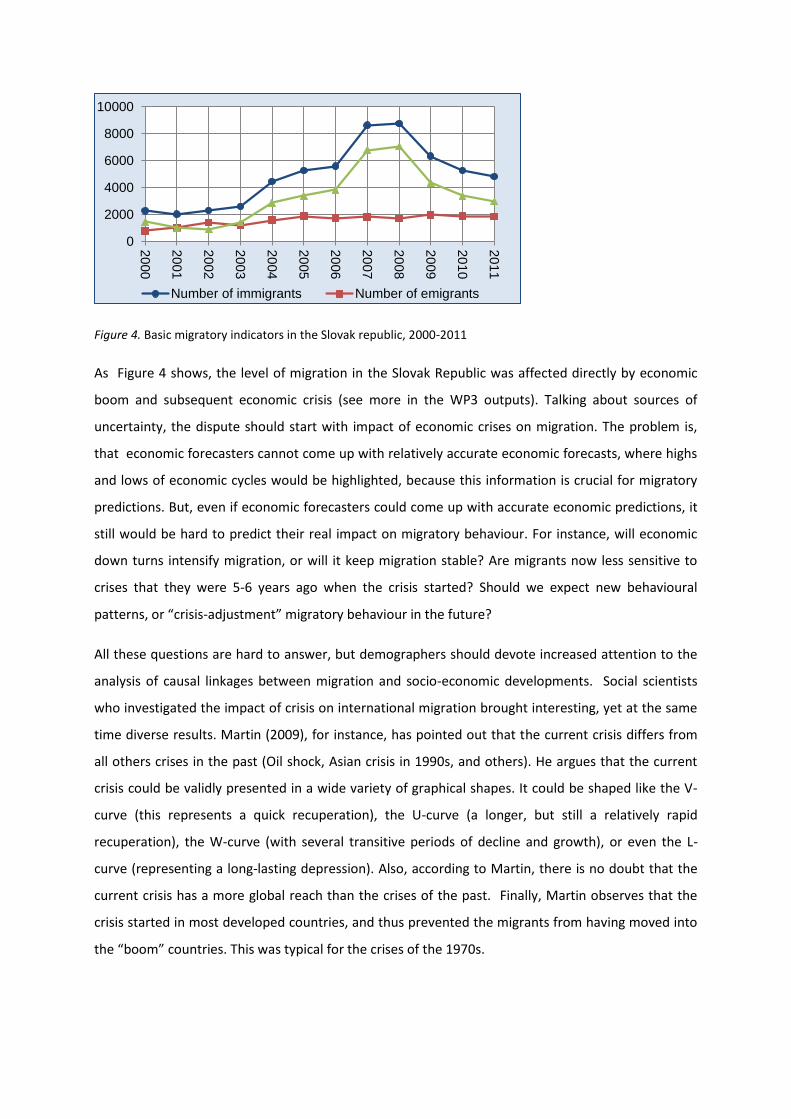
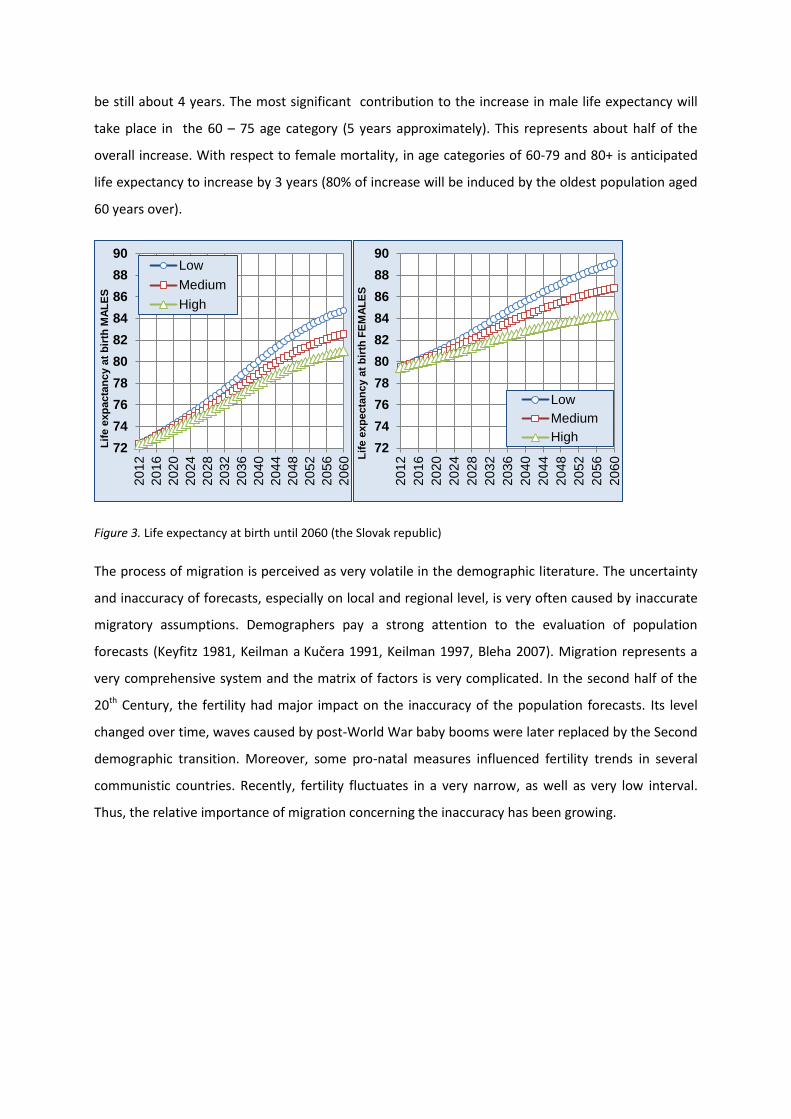
Figure 4. Basic migratory indicators in the Slovak republic, 2000-2011
As Figure 4 shows, the level of migration in the Slovak Republic was affected directly by economic
boom and subsequent economic crisis (see more in the WP3 outputs). Talking about sources of
uncertainty, the dispute should start with impact of economic crises on migration. The problem is,
that economic forecasters cannot come up with relatively accurate economic forecasts, where highs
and lows of economic cycles would be highlighted, because this information is crucial for migratory
predictions. But, even if economic forecasters could come up with accurate economic predictions, it
still would be hard to predict their real impact on migratory behaviour. For instance, will economic
down turns intensify migration, or will it keep migration stable? Are migrants now less sensitive to
crises that they were 5-6 years ago when the crisis started? Should we expect new behavioural
patterns, or “crisis-adjustment” migratory behaviour in the future?
All these questions are hard to answer, but demographers should devote increased attention to the
analysis of causal linkages between migration and socio-economic developments. Social scientists
who investigated the impact of crisis on international migration brought interesting, yet at the same
time diverse results. Martin (2009), for instance, has pointed out that the current crisis differs from
all others crises in the past (Oil shock, Asian crisis in 1990s, and others). He argues that the current
crisis could be validly presented in a wide variety of graphical shapes. It could be shaped like the V-
curve (this represents a quick recuperation), the U-curve (a longer, but still a relatively rapid
recuperation), the W-curve (with several transitive periods of decline and growth), or even the L-
curve (representing a long-lasting depression). Also, according to Martin, there is no doubt that the
current crisis has a more global reach than the crises of the past. Finally, Martin observes that the
crisis started in most developed countries, and thus prevented the migrants from having moved into
the “boom” countries. This was typical for the crises of the 1970s.
0
2000
4000
6000
8000
10000
20
00
20
01
20
02
20
03
20
04
20
05
20
06
20
07
20
08
20
09
20
10
20
11
Number of immigrants Number of emigrants

Castles and Vezzoli (2009) in their work try to answer whether the crisis interrupted the migratory
trends only temporarily, or it caused and has led to the development of a relatively new structural
change. Like some other studies, they are also emphasising tendencies leading to the increase in
migrants´ vulnerability and growing return migration. They suppose that if migrants have some basic
background, linkages, then they try to stay even in worsening situation on labour market. Yet, they
dispute function of migrants being like “safety valve” in time of the crisis.
Papademetriou et al. (2010) country studies to show that between 2008 and 2009 migration flows
from the new member states to Ireland dropped by 60%. The drop in migration flow to Spain at the
same time was more than 65%. Some destination countries became emigration countries basically
overnight. The best examples are Ireland and Greece. Finally Kohler et al. (2010) explains differences
in reactions of EU and non-EU member state migrants. Return migration from the Great Britain and
Ireland is more extensive to the EU countries than to the non-EU countries. They argue that it
depends on situation in homelands, namely the opportunities of finding a job there, and the quality
of social services.
Besides the impact of economic crises, some other sources of uncertainty have been identified. They
are strongly bound to globalisation, geopolitical issues, as well as the position of the macro-regions in
the globalised World. The question of migration policies must be tightly under demographers´
supervision too. Some useful comments from other SEEMIG partners were received. We tried to
include into the future assumptions. The examples are as follows. According to Hungarian colleagues
(Dobos Erika) economic crises have an obvious effect on migration. However, one cannot expect that
the decline, or the end of the crisis will completely eliminate migration. First, the topic should be
treated in accordance with the specifics of each country or region. The migration history, practice
and social, historical, cultural factors are not the same in the new member states. Using the results of
literature review, expert opinions of SEEMIG partners, the WP3 results and results of foresight
exercises, we formulated three scenarios as follows (Figure 5).

Figure 5. Net migration scenarios for the Slovak republic
All three variants represent growing net migration. Some recuperation of attractiveness is
anticipated. In general, the Slovak Republic will be not only a transitive, but also a destination
country in the long-run. There is no doubt, that Slovakia will be a destination country in forecasting
horizon. The range between the high and low scenario will depend on a set of factors such are
migratory measures (asylum policy and openness), end of crisis, or economic development.
Consequently, the medium scenario shows a slight increase exceeding the pre-crisis values to
approximately 10 000 migrants until 2025. In high scenario, the number could reach 14 000, whereas
in the low scenario the net migration should not exceed the surplus of about 6 000 per year. The
period after 2030 shows the future in a more or less schematic manner since long-term forecasts are
uncertain.
Main results:
The population size of the Slovak republic is more likely to decrease than grow. As demonstrated in
Figure 6, in the medium scenario slight population surplus will be replaced by non-negligible process
of de-population. Slovak population size will shrink by 200 thousand inhabitants approximately in the
whole forecasting period. The population loss of about 600 thousand inhabutants is expected in the
low scenario with more pesimistic assupmtions. The population surplus is expected just in case of the
high scenario. In such case, the population size should reach roughly 5,7 million.
0
2 000
4 000
6 000
8 000
10 000
12 000
14 000
16 000
20
12
20
16
20
20
20
24
20
28
20
32
20
36
20
40
20
44
20
48
20
52
20
56
20
60
Num
ber
of
pers
ons
medium
low
high

Figure 6. Number of inhabitants in the Slovak republic, 2013-2060
A negative natural increase is sole factor of population losses in the Slovak republic (Figure 7). In all
three scenarios after 2020 (in low scenario 2018 already), the annual number of deaths exceeds the
number of births. The reason of this is easy to explain. The total fertility rate will be going up, but the
number of potential mothers will not. The waves of the very low fertility of recent decades will
induce the secondary decrease. Moreover, the deaths will increase as the number of seniors will
extend rapidly. This is a direct consequence of “transitive” age pyramid, in which the big
“communistic cohorts” are together with younger and less plentiful post-communistic ones.
Figure 7. Natural increase in the Slovak republic, 2013-2060
The total annual increase is shaped by the values of both natural increase and net migration. The
values of total increase are less pessimistic thanks to the positive net migration being assumed
(Figure 8). The difference between curves in Figures 7 and 8 is the clear evidence of migration´ s
impact on the overall population change.
4 600 000
4 700 000
4 800 000
4 900 000
5 000 000
5 100 000
5 200 000
5 300 000
5 400 000
5 500 000
5 600 000
5 700 000
5 800 000
5 900 000
6 000 000
20
13
20
15
20
17
20
19
20
21
20
23
20
25
20
27
20
29
20
31
20
33
20
35
20
37
20
39
20
41
20
43
20
45
20
47
20
49
20
51
20
53
20
55
20
57
20
59
Popula
tion s
ize
low
medium
high
-40 000
-35 000
-30 000
-25 000
-20 000
-15 000
-10 000
-5 000
0
5 000
10 000
20
12
20
14
20
16
20
18
20
20
20
22
20
24
20
26
20
28
20
30
20
32
20
34
20
36
20
38
20
40
20
42
20
44
20
46
20
48
20
50
20
52
20
54
20
56
20
58
20
60
Pers
ons
Low
Medium
High

Figure 8. Annual population increase in the Slovak republic, 2013-2060
A very quick population ageing, one of the quickest within Europe, will remain a dominant display of
population development in the Slovak Republic (Figure 9). As we depicted above, this is a direct
consequence of “transitive” age pyramid, in which the big “communist cohorts” are together with
younger and less plentiful post-communist ones. Current value of mean age belongs to the lowest in
Europe, whereas the value of 2060 will be at the top of European ranking. The variance of values
according to all three scenarios will remain very low for the entire forecasting period. This fact is in a
clear contrast with population size development. The age-structural momentum is given, “pre-
programmed”, and formed by shifting of generations already born. Thus, the uncertainty in this case
is very low. Neither a very optimistic increase of fertility, nor a very high net migration will be
sufficient in order to avert population ageing.
Figure 9. Mean age of population in the Slovak republic, 2013-2060
The impact of the age structural momentum is demonstrated by Figure 10. The only growing
category is the category of persons aged over 65. More than million seniors will accrue until 2060 in
-35 000
-30 000
-25 000
-20 000
-15 000
-10 000
-5 000
0
5 000
10 000
15 000
20
12
20
14
20
16
20
18
20
20
20
22
20
24
20
26
20
28
20
30
20
32
20
34
20
36
20
38
20
40
20
42
20
44
20
46
20
48
20
50
20
52
20
54
20
56
20
58
20
60
Pers
ons
Low
Medium
High
39
40
41
42
43
44
45
46
47
48
49
50
20
13
20
15
20
17
20
19
20
21
20
23
20
25
20
27
20
29
20
31
20
33
20
35
20
37
20
39
20
41
20
43
20
45
20
47
20
49
20
51
20
53
20
55
20
57
20
59
Mean a
ge
low
medium
high
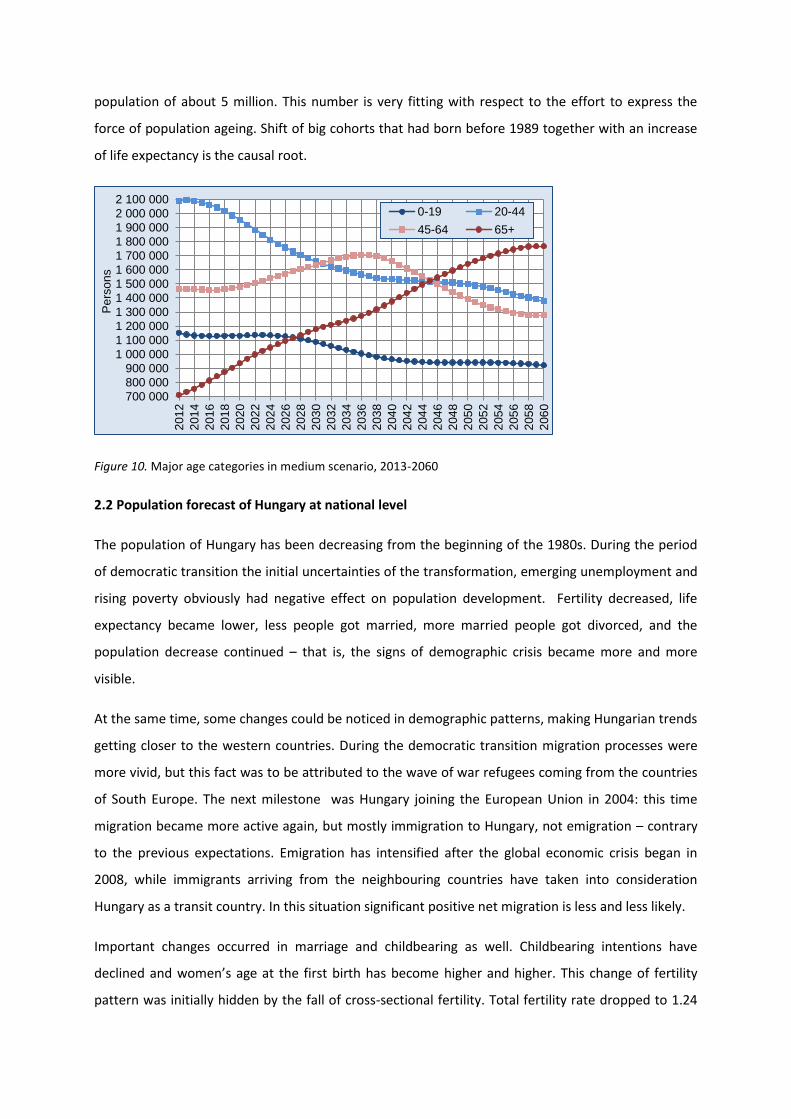
population of about 5 million. This number is very fitting with respect to the effort to express the
force of population ageing. Shift of big cohorts that had born before 1989 together with an increase
of life expectancy is the causal root.
Figure 10. Major age categories in medium scenario, 2013-2060
2.2 Population forecast of Hungary at national level
The population of Hungary has been decreasing from the beginning of the 1980s. During the period
of democratic transition the initial uncertainties of the transformation, emerging unemployment and
rising poverty obviously had negative effect on population development. Fertility decreased, life
expectancy became lower, less people got married, more married people got divorced, and the
population decrease continued – that is, the signs of demographic crisis became more and more
visible.
At the same time, some changes could be noticed in demographic patterns, making Hungarian trends
getting closer to the western countries. During the democratic transition migration processes were
more vivid, but this fact was to be attributed to the wave of war refugees coming from the countries
of South Europe. The next milestone was Hungary joining the European Union in 2004: this time
migration became more active again, but mostly immigration to Hungary, not emigration – contrary
to the previous expectations. Emigration has intensified after the global economic crisis began in
2008, while immigrants arriving from the neighbouring countries have taken into consideration
Hungary as a transit country. In this situation significant positive net migration is less and less likely.
Important changes occurred in marriage and childbearing as well. Childbearing intentions have
declined and women’s age at the first birth has become higher and higher. This change of fertility
pattern was initially hidden by the fall of cross-sectional fertility. Total fertility rate dropped to 1.24
700 000
800 000
900 000
1 000 000
1 100 000
1 200 000
1 300 000
1 400 000
1 500 000
1 600 000
1 700 000
1 800 000
1 900 000
2 000 000
2 100 000
201
2
201
4
201
6
201
8
202
0
202
2
202
4
202
6
202
8
203
0
203
2
203
4
203
6
203
8
204
0
204
2
204
4
204
6
204
8
205
0
205
2
205
4
205
6
205
8
206
0
Pe
rso
ns
0-19 20-44
45-64 65+

by 2011, reaching the lowest value in the history of the country – however, this rate showed some
rise in 2012 again.
The impact of the democratic transition could most clearly be seen in mortality: life expectancy
decreased, mortality ratios rose, mostly among middle-aged men. However, life expectancy began to
increase slowly but continuously from the beginning of the 2000s, and this trend was not broken
even by the effects of the economic crisis.
Assumptions:
The recent very low fertility in Hungary and the measures worked out to improve this situation are
well-known. If these measures are sustained for long period of time consistently, it is almost certain
that there will be some rise in fertility as a result. For the medium hypothesis only this effect is taken
into account, so calculating with a very small increase, it is supposed that total fertility level reaches
level 1.45 in the next decade (Figure 11). In this case fertility level in Hungary will be the same as it is
in Austria today.
For high and low fertility assumptions other factors are also involved, not only family policy
measures.
If changing trends are due to a change in family formation or childbearing patterns, we can suppose
that children who would/should have been born at a younger age of their mothers were eventually
not born and therefore they are now ‘missing’ from the present population. When the change of
these patterns will be completed, after the 2020s, these children will probably be born – that is
fertility level will gradually be closer and closer to the level experienced earlier, before the changing
pattern. This is the high assumption, when the projected total fertility rate is 1.75 in the perspective
of the next two decades.
In the light of recent changes in fertility it is likely that the period when women would like to give
births to all their intended children will be shorter. At the same time this means that even if births
intentions will be higher, the number of births will be lower than in case of high fertility assumptions.
The medium fertility hypothesis is level of 1.6 as for total fertility rate. In this case fertility reaches
the recent European average but with a delay of one decade.
All three fertility assumptions concern some rise in fertility in the future – but the chance of
realisation depends upon the effects of family policy measures and also the permanence of these
effects. With cautious optimism we can say that calculable family policy measures and relatively high
family allowances might influence fertility level in favourable direction (see the French case, Makay

2009). Considering the fact that young people have relatively high childbearing intentions (about two
for a family), it is also promising for the future of fertility (Spéder-Kapitány 2007).
Figure 11. The total fertility rate until 2060, Hungary
The timing of fertility is shown in Figure 12. A distinct shift to the older age-profiles is presupposed in
future.
Figure 12. The timing of fertility until 2060 in the medium scenario, Hungary
Concerning mortality, in case of women the high assumption is the continuation of recent trends, the
life expectancy of men is getting to closer to women’s life expectancy – that is, the recent difference
1,00
1,10
1,20
1,30
1,40
1,50
1,60
1,70
1,80
1,90
2,00
20
11
20
14
20
17
20
20
20
23
20
26
20
29
20
32
20
35
20
38
20
41
20
44
20
47
20
50
20
53
20
56
20
59
Low Medium High

of eight years will decrease to five years (this is the difference between the life expectancy of the two
sexes in Austria now).
The assumptions of the medium variant for both sexes include somewhat lower life expectancy at
birth than the high variant, and the difference between men and women decreases to recent
European average, that is six years. In the low assumption life expectancy is low, and the
approximation of life expectancies of men and women is minimal.
The life expectancy at birth was 70.9 years for men and 78.2 years for women in 2011. According to
the hypothesis of the low variant this value will grow up to 72.0 years for men and 79.3 years for
women by 2020; these values are 72.6 and 79.8 years in the medium variant; and 73.2 and 80.2 years
in the high variant, respectively. As a result of further gradual increase, life expectancy will be about
73.2 years for men and 80.5 years for women by 2030 in the low variant, 74.5 years for men and 81.4
years for women in the medium variant; and, finally, 75.7 years for men and 82.3 years for women in
the high variant of population projection. The value of life expectancy will be about 76.8 years for
men and 83.8 years for women in the low variant, 80.1 years for men and 86.1 years for women in
the medium variant; 83.3 years for men and 88.3 years in the high variant in 2060 (Figure 13).
Figure 13. Life expectancy at birth until 2060 (Hungary)
There are many uncertainties and inconsistencies in migration data in latest years – this is why net
international migration is equal to zero in migration assumptions for the next decade1. After the first
decade of the projection period, the migration processes are different in the different scenarios. In
1 Zero net migration does not mean that there is no migration at all, but it means that the number – and age
structure - of immigrants and emigrants are about the same, so there is neither population loss nor population gain coming from migration processes.
70
72
74
76
78
80
82
84
86
88
90
20
12
20
16
20
20
20
24
20
28
20
32
20
36
20
40
20
44
20
48
20
52
20
56
Lif
e e
xp
ecta
ncy a
t b
irth
MA
LE
S
Low
Medium
High
70
72
74
76
78
80
82
84
86
88
90
20
12
20
16
20
20
20
24
20
28
20
32
20
36
20
40
20
44
20
48
20
52
20
56
20
60
Lif
e e
xp
ecta
ncy a
t b
irth
F
EM
AL
ES
Low
Medium
High

the low variant net migration is zero during the whole projection period. Main recent indicators
depict Figure 14.
Figure 14. Basic migratory indicators in Hungary, 2000-2011
According to the medium hypothesis, positive net migration occurs in the beginning of the 2020s,
then after a slow increase it reaches about 10 thousand persons per year in the beginning of the
2030s, but after that it remains stable. Contrary to the medium variant, in the high variant the
increase of positive net migration continues during the next decade while it reaches about 15
thousand persons per year, and then it remains on this level until the end of projected period, 2060.
Migration hypotheses are founded on the assumptions that the directions and tendencies of
migration processes will change in the next few decades. For a long time net migration was positive
and relatively high, but it will decrease, it can even become negative for some periods, but taking all
migration processes into account, the result of these processes will be about zero for a while.
Behind this assumption lies the fact that the source of immigration to Hungary will be narrower –
immigrants mostly come from the neighbouring countries, especially from Romania. The other
aspect is that immigrants arriving to Hungary do not stay in the country for good, but they go further
to the western countries. Moreover, the attractive impact of labour market of European Union
countries prevails to a greater extent than earlier as a consequence of economic crisis, so the
emigration of Hungarians becomes more intense.
In long term, the outcome of these processes is a lack of labour force in Hungary, which gives good
opportunity for immigrants from other countries, including developing countries as well. Thus more
0
5 000
10 000
15 000
20 000
25 000
30 000
35 000
40 000
20
00
20
01
20
02
20
03
20
04
20
05
20
06
20
07
20
08
20
09
20
10
20
11
Number of immigrants Number of emigrants Net migration

and more immigrants arrive in the country, and net migration will be positive again in a long term
perspective (Figure 15).
Figure 15. Net migration scenarios for Hungary
Main results:
The population projection shows rather wide boundaries for the population number in 2060. The
most likely population size is 7.92 million persons according to the medium variant. The highest value
of population size is 8.59 million persons in the high variant – the difference between the highest and
the lowest population size is about 1.67 million persons (Figure 16).
It means that the decrease of population size is a basic tendency between 2013 and 2060, because
even when the most optimist scenario, the high variant – relatively high fertility and intensive
immigration - will be realized, the population size is much smaller than 9 million. In order to increase
the population size, higher than 1.75 total fertility rate would be necessary – which is the high
fertility assumption –, but the chance of realizing higher fertility is very low because of the extremely
unfavourable fertility processes which were experienced in past years. The pessimistic variant gives
a population size of about 7 million which would mean very serious population loss.
The population loss in Hungary was continuous and approximately steady after the democratic
transition: the number of inhabitants dropped by 175 thousand persons between 1990 and 2001 and
by 290 thousand persons between 2001 and 2013 – that is, the whole population loss was about 465
thousand persons in this period. According to the population projection, the loss of further 2 million
persons could come about during the next half a century, even if fertility and mortality show
0
2 000
4 000
6 000
8 000
10 000
12 000
14 000
16 00020
13
20
17
20
21
20
25
20
29
20
33
20
37
20
41
20
45
20
49
20
53
20
57
Nu
mb
er
of
pers
on
s
Low
Medium
High

moderate improvement. The high scenario of population projection calculates about 1.32 million
population loss during the projected period, while the low scenario results in a loss of 3 million.
Figure 16. Number of inhabitants in Hungary, 2013-2060
The natural increase remain negative in all scenarios of population projection during the whole
projected period, that is the number of deaths exceeds the number of births in each year (Figure 17).
In the first decade of the projected period – until 2022 – changes occur according to the assumptions
of the projection: natural loss is smaller and smaller while the fertility increases in medium and high
variant; the slight increase of fertility in not enough to stop the increase of natural loss in the low
variant. The number of population fluctuates in the rest of the projected period and the same is true
for natural increase. Natural loss will be higher, except in the high variant of population projection.
Figure 17. Natural increase in Hungary, 2013-2060
6 500 000
7 000 000
7 500 000
8 000 000
8 500 000
9 000 000
9 500 000
10 000 000
20
13
20
15
20
17
20
19
20
21
20
23
20
25
20
27
20
29
20
31
20
33
20
35
20
37
20
39
20
41
20
43
20
45
20
47
20
49
20
51
20
53
20
55
20
57
20
59
Po
pu
lati
on
siz
e
Low
Medium
High
-75 000
-70 000
-65 000
-60 000
-55 000
-50 000
-45 000
-40 000
-35 000
-30 000
20
13
20
15
20
17
20
19
20
21
20
23
20
25
20
27
20
29
20
31
20
33
20
35
20
37
20
39
20
41
20
43
20
45
20
47
20
49
20
51
20
53
20
55
20
57
20
59
Nu
mb
er
of
pers
on
s
Low
Medium
High

The annual population increase includes natural increase and international migration as well (Figure
18). It can be seen that taking into account migration has an important effect on the change of
population size (except in the low variant where migration was not calculated). The population loss
decreases or remains stable during the whole projected period according to the medium and high
scenarios.
Figure 18. Annual population increase in Hungary, 2013-2060
It seems that population ageing is an irreversible process in the next half a century in Hungary. This
process has two important factors: on the one hand, low fertility, on the other hand, increasing life
expectancy at birth. The average age of Hungarian population was 41.4 years in 2013, and it will rise
in all variants of the population projection. The trends assumed in the medium and the high variant
are very similar: two years increase can be seen by 2020, further two years by 2040, and finally, the
average age reaches 47 years by 2060. The average age rises more rapidly and reaches higher value
in the low variant: it will be 47.7 years in 2060 – the cause of this lower fertility and the lack of
younger immigrants (Figure 19).
The age structure of the population shows the clear characteristics of the population ageing. For a
long time the size of all age groups decreases, except the 65+ age group, the oldest ones. The
number of persons younger than 20 years will drop from 200 thousand persons in 2012 to 140
thousand persons in 2060. Moderate increase can be experienced in the age group of 20-44 years
from the mid-2020s – it is a consequence of rising births which occurred earlier and net migration
which becomes positive by this time -, but it also begins to decrease continuously from the 2030s.
The size of the group of persons aged 45-64 years drops from 3.5 million to below 2 million during
-75 000
-70 000
-65 000
-60 000
-55 000
-50 000
-45 000
-40 000
-35 000
-30 000
-25 000
-20 000
-15 000
20
13
20
15
20
17
20
19
20
21
20
23
20
25
20
27
20
29
20
31
20
33
20
35
20
37
20
39
20
41
20
43
20
45
20
47
20
49
20
51
20
53
20
55
20
57
20
59
Nu
mb
er
of
pers
on
s
Low
Medium
High

the projection period – this is the largest age group, and the population loss is the largest in this
group. Rising and stagnating periods follow each other in the group of the oldest persons, but nearly
a loss of 700 thousand persons can be projected on the whole by 2060 (Figure 20).
Figure 19. Mean age of population in Hungary, 2013-2060
Figure 20. Major age categories in medium scenario, Hungary, 2013-2060
3. Zero migration scenario
The Zero-migration scenario shows what will be the population development if no migration gains
occur. In other words, it puts the view on demographic future influenced exclusively by fertility and
39
40
41
42
43
44
45
46
47
48
49
50
20
13
20
15
20
17
20
19
20
21
20
23
20
25
20
27
20
29
20
31
20
33
20
35
20
37
20
39
20
41
20
43
20
45
20
47
20
49
20
51
20
53
20
55
20
57
20
59
Mean
ag
e
low
medium
high
1 400 000
1 600 000
1 800 000
2 000 000
2 200 000
2 400 000
2 600 000
2 800 000
3 000 000
3 200 000
3 400 000
3 600 000
201
2
201
4
201
6
201
8
202
0
202
2
202
4
202
6
202
8
203
0
203
2
203
4
203
6
203
8
204
0
204
2
204
4
204
6
204
8
205
0
205
2
205
4
205
6
205
8
206
0
Pe
rso
ns
0-19 20-44
45-64 65+
mortality rates. The difference between forecast with incorporated migration and zero-migration
projection actually represents the clear impact of migration on the population change being positive
in case of the European countries. This scenario is not “realistic”. It could be true just in case the
emigration and immigration are balanced. In any case, the age structure of immigrants and
emigrants is likely to differ. Therefore, age structure could change irrespective of changes taking
place in the population size.
3.1 Zero migration scenario in case the Slovak Republic
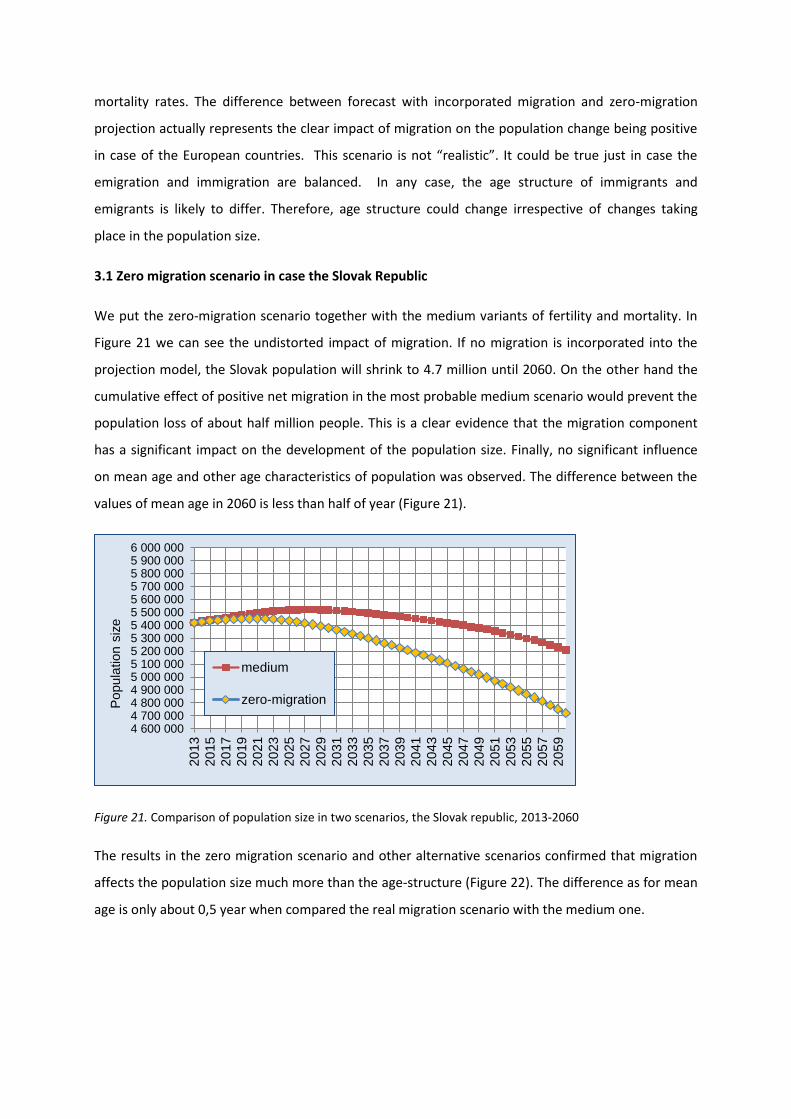
We put the zero-migration scenario together with the medium variants of fertility and mortality. In
Figure 21 we can see the undistorted impact of migration. If no migration is incorporated into the
projection model, the Slovak population will shrink to 4.7 million until 2060. On the other hand the
cumulative effect of positive net migration in the most probable medium scenario would prevent the
population loss of about half million people. This is a clear evidence that the migration component
has a significant impact on the development of the population size. Finally, no significant influence
on mean age and other age characteristics of population was observed. The difference between the
values of mean age in 2060 is less than half of year (Figure 21).
Figure 21. Comparison of population size in two scenarios, the Slovak republic, 2013-2060
The results in the zero migration scenario and other alternative scenarios confirmed that migration
affects the population size much more than the age-structure (Figure 22). The difference as for mean
age is only about 0,5 year when compared the real migration scenario with the medium one.
4 600 0004 700 0004 800 0004 900 0005 000 0005 100 0005 200 0005 300 0005 400 0005 500 0005 600 0005 700 0005 800 0005 900 0006 000 000
20
13
20
15
20
17
20
19
20
21
20
23
20
25
20
27
20
29
20
31
20
33
20
35
20
37
20
39
20
41
20
43
20
45
20
47
20
49
20
51
20
53
20
55
20
57
20
59
Popula
tion s
ize
medium
zero-migration

30
35
40
45
50
55
2013
2015
2017
2019
2021
2023
2025
2027
2029
2031
2033
2035
2037
2039
2041
2043
2045
2047
2049
2051
2053
2055
2057
2059
Mean
ag
e
Zero migration
Medium scenario
Figure 22. Comparison of mean age of population in two scenarios, the Slovak Republic, 2013-2060
3.2 Zero migration scenario in case of Hungary
The zero migration scenario was developed from the medium scenario of the population projection,
that is fertility and mortality assumptions are the same for these two scenarios, the only difference
lies in migration assumptions. The results of the two scenarios can be seen in Figure 23.
In the medium scenario a small amount of positive net migration was taken into account, this is why
zero migration scenario gives more population loss than the medium one. In the medium scenario
the population of Hungary will be about 7.9 million in 2060, while in the zero migration scenario the
population is about 7.6 million – the difference is about 300 thousand people, which is the
cumulative effect of the lack of (positive net) migration. It clearly shows how migration is able to
reduce population loss – which is coming mostly from the low fertility –, and the importance of
migration especially when the population is decreasing.

Figure 23. Comparison of population size in two scenarios, Hungary, 2013-2060
In characteristics other than the size of population, there were no significant difference between
medium and zero migration scenarios (Figure 24).
Figure 24.Comparison of mean age of population in two scenarios, Hungary, 2013-2060
41
42
43
44
45
46
47
48
20
13
20
15
20
17
20
19
20
21
20
23
20
25
20
27
20
29
20
31
20
33
20
35
20
37
20
39
20
41
20
43
20
45
20
47
20
49
20
51
20
53
20
55
20
57
20
59
Mean
ag
e
Zero migration
Medium scenario

4. Real migration scenario
The estimation and incorporation of the undocumented migration flows are the main objectives of
this scenario. Since the official data on migration are very likely under-estimated in case of out-
migration especially, there is a strong need for such scenarios.
A similar methodology for estimation of unregistered migration was used in both countries. It is an
attempt to estimate the real processes of international migration and to assess its possible
development in the future. The „real migration” scenario is a variant of population projection used to
estimate the real migration processes by taking into account the assessments concerning the
direction and volume distortions of statistical data. This scenario is calculated on the basis of fertility
and mortality assumptions of the medium variant of the latest population projection, but applying
modified migration assumptions.
The migration assumptions consist of assumptions on net migration volume, sex and age
composition of migrants for the duration of the projection period (2012 to 2060). International
migration is composed of immigration and emigration of foreign citizens to Slovakia respectively
Hungary, and emigration of Slovak respectively Hungarian citizens to abroad and their re-migration
to Slovakia respectively Hungary.
The more realistic estimation of migration than in vital statistics is described in detail in case of
Hungary (see chapter 5.2)
4.1 Real migration scenario in case of the Slovak Republic
The real-migration variant was constructed using the medium variant of fertility and mortality. We
assume that the relatively wide gap between official and unregistered net migration will diminish in
the long-term (Figure 25). We also anticipate that new measures will be applied in migration
statistics in coming years. They are likely to improve the accuracy of statistics, thus the gap might be
gradually narrowed. Some segments of migration flows are very likely to remain undocumented, but
their share will become less significant. Current values of net migration appear to be overestimated.
Some authors mention thousands of unregistered emigrants at the time when they are leaving the
country. Divinský (2005, 2007) estimated that annual permanent emigration stock could rise to 15-20
thousand people. Perhaps, this value is too pessimistic today, but the slightly negative net migration
when we include the out-migrants estimations is very likely to be a valid assumption. In the log-run,
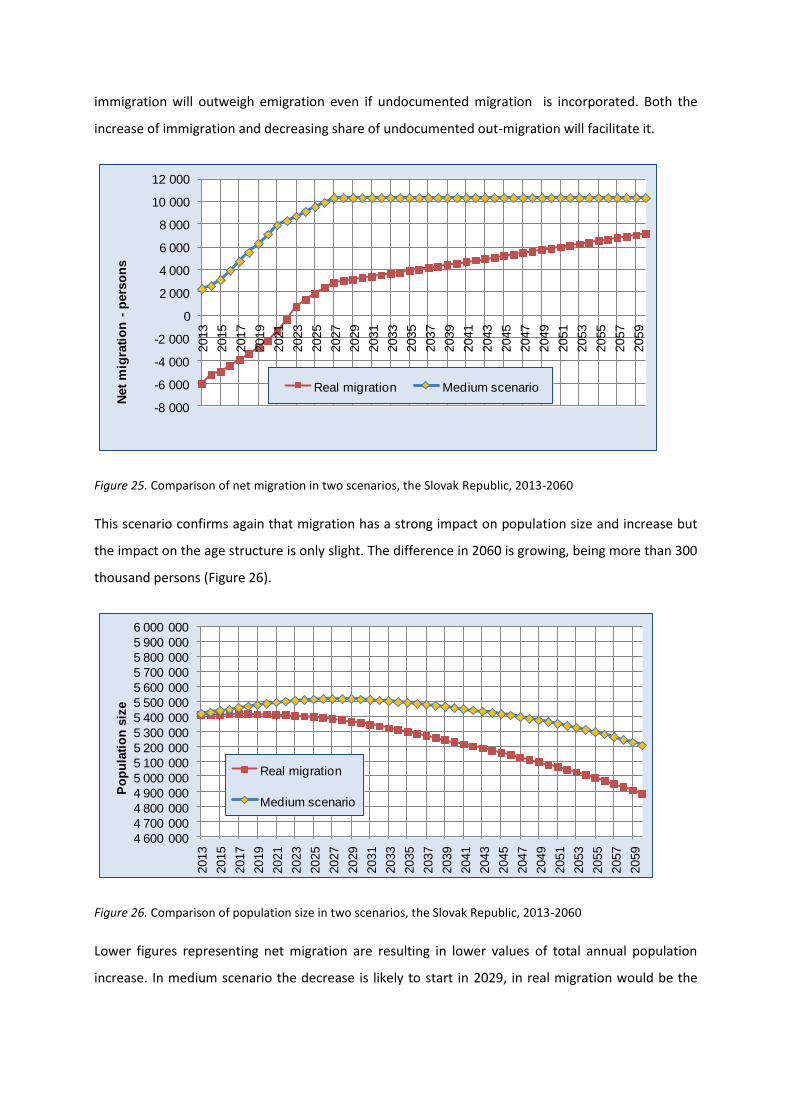
immigration will outweigh emigration even if undocumented migration is incorporated. Both the
increase of immigration and decreasing share of undocumented out-migration will facilitate it.
-8 000
-6 000
-4 000
-2 000
0
2 000
4 000
6 000
8 000
10 000
12 000
2013
2015
2017
2019
2021
2023
2025
2027
2029
2031
2033
2035
2037
2039
2041
2043
2045
2047
2049
2051
2053
2055
2057
2059
Net
mig
rati
on
-p
ers
on
s
Real migration Medium scenario
Figure 25. Comparison of net migration in two scenarios, the Slovak Republic, 2013-2060
This scenario confirms again that migration has a strong impact on population size and increase but
the impact on the age structure is only slight. The difference in 2060 is growing, being more than 300
thousand persons (Figure 26).
4 600 000
4 700 000
4 800 000
4 900 000
5 000 000
5 100 000
5 200 000
5 300 000
5 400 000
5 500 000
5 600 000
5 700 000
5 800 000
5 900 000
6 000 000
2013
2015
2017
2019
2021
2023
2025
2027
2029
2031
2033
2035
2037
2039
2041
2043
2045
2047
2049
2051
2053
2055
2057
2059
Po
pu
lati
on
siz
e
Real migration
Medium scenario
Figure 26. Comparison of population size in two scenarios, the Slovak Republic, 2013-2060
Lower figures representing net migration are resulting in lower values of total annual population
increase. In medium scenario the decrease is likely to start in 2029, in real migration would be the

depopulation starting point 10 years sooner. After 2020 the difference will be lowering, the biggest
difference is expected in the first years of the forecasting period (Figure 27).
-25 000
-20 000
-15 000
-10 000
-5 000
0
5 000
10 000
15 000
2013
2015
2017
2019
2021
2023
2025
2027
2029
2031
2033
2035
2037
2039
2041
2043
2045
2047
2049
2051
2053
2055
2057
2059
Nu
mb
er
of
pers
on
s
Real migration Medium scenario
Figure 27. Comparison of annual population increase in two scenarios, the Slovak Republic, 2013-2060
The difference in mean age of population is predicted as very low in future (Figure 28).
30
35
40
45
50
55
2013
2015
2017
2019
2021
2023
2025
2027
2029
2031
2033
2035
2037
2039
2041
2043
2045
2047
2049
2051
2053
2055
2057
2059
Mean
ag
e
Real migration
Medium scenario
Figure 28. Comparison of mean age in two scenarios, the Slovak republic, 2013-2060
4.2 Real migration scenario in case of Hungary
The HCSO statistics on foreign-citizen immigrants and emigrants show that the average number of
immigrants is more than 23 thousand per year, while the average number of emigrants is about 4

thousand per year (Table 2). This means that the population of the country increased by nearly 230
thousand persons during the 2001-2012 period due to the immigration of foreign citizens.
Year Immigrants Emigrants Net migration
2001 20308 1944 18364
2002 17972 2388 15584
2003 19365 2553 16812
2004 22164 3466 18698
2005 25582 3320 22262
2006 23569 3956 19613
2007 22607 4133 18474
2008 35547 4241 31306
2009 25582 5600 19982
2010 23884 6047 17837
2011 22514 2687 19827
2012 20340 9916 10424
Table 2. Number of immigrant and emigrant foreign citizens and their net migration, 2001-2012
Source: Demographic Yearbook 2001-2012
The net migration of foreign citizens has changed around 15 to 20 thousand in the last more than ten
years – between 2001 and 2012 (Figure 29). Its highest value was observed in 2008 when net
migration was higher than 31 thousand – but it is not a real growth but the results of an
administrative change2. During the period started in 2001 net migration reached its smallest value in
2012 when it was less than 10 and a half thousand. Between the two latest censuses the average net
migration of foreign citizens was around 20 thousand per year. During the period following the
economic crisis net migration has decreased, its average value was about 17 thousand per year
between 2009 and 2012.
2 The effect of Immigration Act, came into force on 1 July 2007 (The Immigration Act consists of two parts: Act
on the Entry and Residence of Persons with the Right of Free Movement and Residence (Act I of 2007) and Act on the Entry and Residence of Third-country Nationals (Act II of 2007). In this case the first part of the Act is relevant.)

Figure 29. Net migration of foreign citizens in Hungary, 2001-2012
Source: Demographic Yearbook 2001-2012
The data shown here is likely to give a too high value of net migration, because foreign citizens
emigrating from Hungary do not register their exit from the country very often. A more precise,
closer to the reality picture can be given using the data of censuses.
Foreign citizens Persons
2001 census 93 241
2011 census 143 310
Difference 50 069
Natural increase 2001-2011 7 637
Net international migration (without nationalization) 42 432
Immigrants, total 259 094
Nationalized persons, total 87 682
Assessment of emigrants (difference between the two latest censuses –
registered immigration)
128 980
Real net international migration 130 114
Average net migration of foreign citizens per year 11 829
Table 3. The number of foreign citizens living in Hungary: 2001, 2011 censuses
Source: Demographic Yearbook 2001-2012, 2001 Census, 2011 Census
18 3
64
15 5
84
16 8
12
18 6
98
22 2
62
19 6
13
18 4
74
31 3
06
19 9
82
17 8
37
19 8
27
10 4
24
0
5 000
10 000
15 000
20 000
25 000
30 000
35 000
2001 2002 2003 2004 2005 2006 2007 2008 2009 2010 2011 2012

Between the latest two censuses the number of foreign citizens living in Hungary was increased by 50
069 persons. Their natural increase (the balance of births and deaths) was more than 7 600 persons,
so net migration was 42 400 persons. However, this number does not contain the number of persons
acquiring Hungarian citizenship in the meantime, that is, the number of nationalization.
The net migration of foreign citizens – taking into account the nationalization too – are 130 114
persons, that is the average is near to 12 thousand per year. At the same time it means that 128 980
persons left the country during the period 2001-2012, while 259 094 foreign citizens arrived to
Hungary in the same period (Table 3)
The valid net migration of foreign citizens is likely to be closer to average 12 thousand per year than
to average 20 thousand per year estimated earlier. Assuming that the vital statistics on migration
shows the migration trends well enough, and taking into account smaller amount of net migration -
average 8 thousand less per year (Figure 30).
Figure 30. Net migration of foreign citizens estimated from vital statistics and censuses, 2001-2012 Source: Demographic Yearbook 2001-2012, 2011 Census
Migration of Hungarian citizens has to be considered too, again emigration and immigration
separately.
Emigration can be estimated on the one hand, on the basis of vital statistics of the sending country,
and, on the other hand, on the basis of mirror statistics of the destination countries. However, vital
statistics on emigration can grasp only a part of the emigration – this fact can be seen from mirror
statistics and surveys on migration potential as well.
10 3
64
7 5
84
8 8
12
10 6
98
14 2
62
11 6
13
10 4
74
23 3
06
11 9
82
9 8
37
11 8
27
10 4
24
0
5 000
10 000
15 000
20 000
25 000
2001 2002 2003 2004 2005 2006 2007 2008 2009 2010 2011 2012
According to the Hungarian vital statistics on migration, the emigration of Hungarian citizens was
fairly low between 2001-2005 and its tendency was slightly increasing (Table 2). Emigration became
higher since 2005, the number of emigrants was near to 13 thousand in 2012. The real extent of
emigration of Hungarian citizens is probably higher, but data from vital statistics can give a guideline
to sketch the tendencies in emigration.
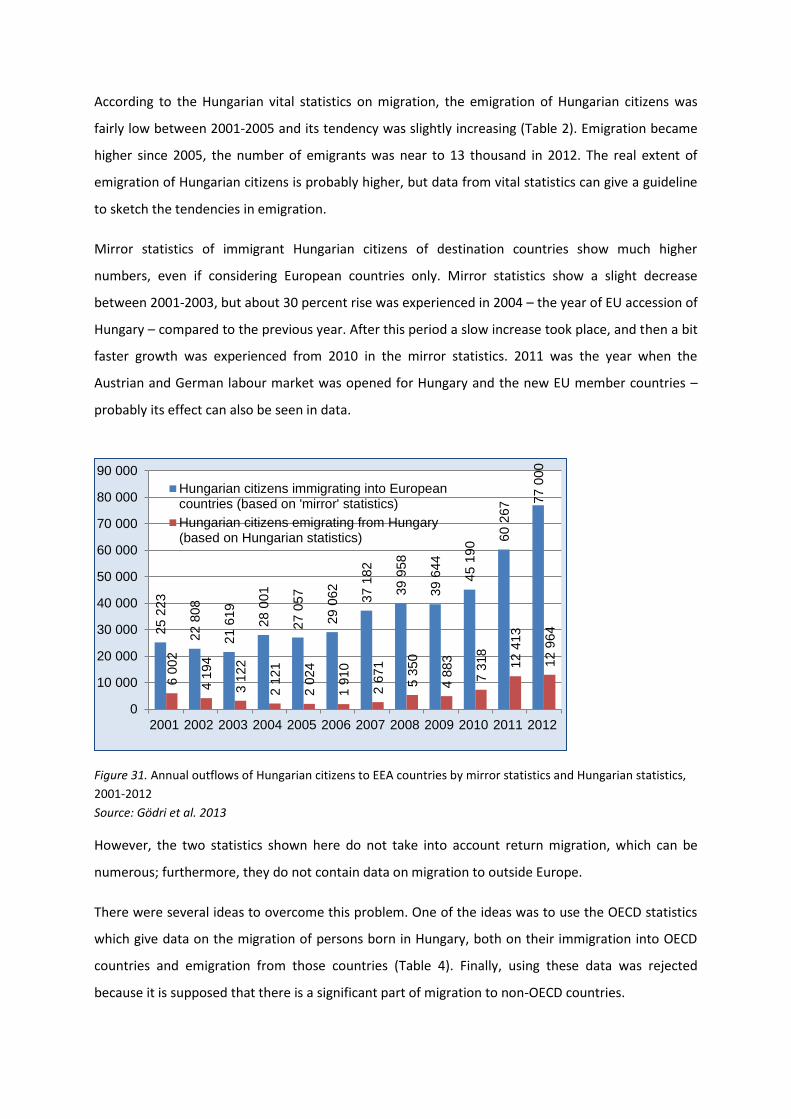
Mirror statistics of immigrant Hungarian citizens of destination countries show much higher
numbers, even if considering European countries only. Mirror statistics show a slight decrease
between 2001-2003, but about 30 percent rise was experienced in 2004 – the year of EU accession of
Hungary – compared to the previous year. After this period a slow increase took place, and then a bit
faster growth was experienced from 2010 in the mirror statistics. 2011 was the year when the
Austrian and German labour market was opened for Hungary and the new EU member countries –
probably its effect can also be seen in data.
Figure 31. Annual outflows of Hungarian citizens to EEA countries by mirror statistics and Hungarian statistics,
2001-2012
Source: Gödri et al. 2013
However, the two statistics shown here do not take into account return migration, which can be
numerous; furthermore, they do not contain data on migration to outside Europe.
There were several ideas to overcome this problem. One of the ideas was to use the OECD statistics
which give data on the migration of persons born in Hungary, both on their immigration into OECD
countries and emigration from those countries (Table 4). Finally, using these data was rejected
because it is supposed that there is a significant part of migration to non-OECD countries.
25 2
23
22 8
08
21 6
19
28 0
01
27 0
57
29 0
62
37 1
82
39 9
58
39 6
44
45 1
90
60 2
67
77 0
00
6 0
02
4 1
94
3 1
22
2 1
21
2 0
24
1 9
10
2 6
71
5 3
50
4 8
83
7 3
18
12 4
13
12 9
64
0
10 000
20 000
30 000
40 000
50 000
60 000
70 000
80 000
90 000
2001 2002 2003 2004 2005 2006 2007 2008 2009 2010 2011 2012
Hungarian citizens immigrating into Europeancountries (based on 'mirror' statistics)
Hungarian citizens emigrating from Hungary(based on Hungarian statistics)

Inflow of
Hungarian-
born persons
to OECD
countries
Outflow of
Hungarian-
born persons
from OECD
countries
Difference
between
inflow and
outflow,
OECD
countries
Hungarian
citizens
emigrating
from
Hungary,
Hungarian
statistics
Hungarian
citizens
immigrating to
EEA countries
according to
the mirror
statistics
2001 27590 20536 7054 6002 25223
2002 23289 18302 4987 4194 22808
2003 20618 17958 2660 3122 21619
2004 25525 19661 5864 2121 28001
2005 27557 18854 8703 2024 27057
2006 29370 18664 10706 1910 29062
2007 35880 21181 14699 2671 37182
2008 41314 26862 14452 5350 39958
2009 41968 29010 12958 4883 39644
2010 46931 28104 18827 7318 45190
2011 67413 35262 32151 12413 60267
Table 4. Inflow and outflow of persons born in Hungary to and from OECD countries and annual outflows of
Hungarian citizens3 to EEA countries by mirror statistics and Hungarian statistics, 2001-2011
Source: OECD, Gödri et al. 2013
Another possibility is not to investigate migration flow but migration stock. If these data are known
for two different years, the extension of migration during that time can be concluded. This is what
we do now.
Considering UN data, the number of Hungarian-born persons living abroad has changed in the
following way between 1990 and 2013:
3 Both data of Hungarian citizens and of Hungarian-born persons are used in this paper; obviously, these two
groups are different. The citizenship raises a new question: there are more and more people born abroad and becoming Hungarian citizens abroad – a new form or channel of migration emerges when they immigrate to Hungary. Their number was 2 thousand persons in 2011, and 9 thousand persons in 2012. At this moment it could not be estimated how this process will be continued. In this paper this for of migration is not studied.
1990 2000 2010 2013
407 611 443 911 491 926 528 184
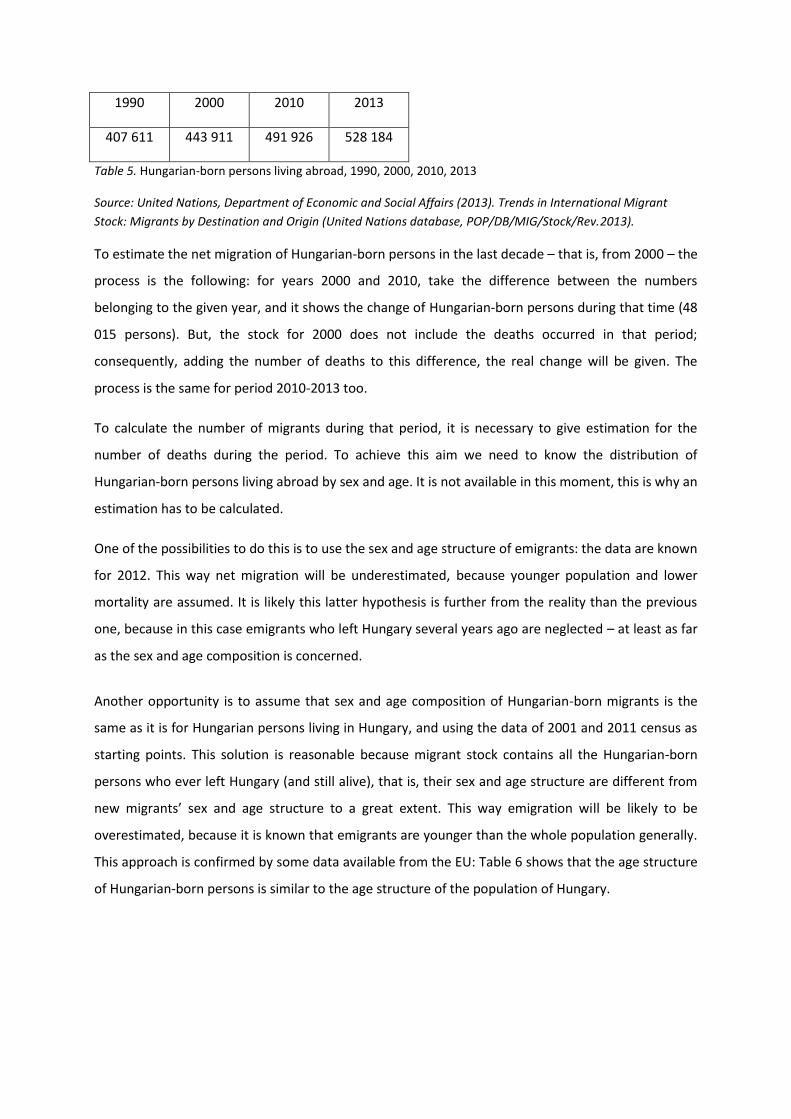
Table 5. Hungarian-born persons living abroad, 1990, 2000, 2010, 2013
Source: United Nations, Department of Economic and Social Affairs (2013). Trends in International Migrant
Stock: Migrants by Destination and Origin (United Nations database, POP/DB/MIG/Stock/Rev.2013).
To estimate the net migration of Hungarian-born persons in the last decade – that is, from 2000 – the
process is the following: for years 2000 and 2010, take the difference between the numbers
belonging to the given year, and it shows the change of Hungarian-born persons during that time (48
015 persons). But, the stock for 2000 does not include the deaths occurred in that period;
consequently, adding the number of deaths to this difference, the real change will be given. The
process is the same for period 2010-2013 too.
To calculate the number of migrants during that period, it is necessary to give estimation for the
number of deaths during the period. To achieve this aim we need to know the distribution of
Hungarian-born persons living abroad by sex and age. It is not available in this moment, this is why an
estimation has to be calculated.
One of the possibilities to do this is to use the sex and age structure of emigrants: the data are known
for 2012. This way net migration will be underestimated, because younger population and lower
mortality are assumed. It is likely this latter hypothesis is further from the reality than the previous
one, because in this case emigrants who left Hungary several years ago are neglected – at least as far
as the sex and age composition is concerned.
Another opportunity is to assume that sex and age composition of Hungarian-born migrants is the
same as it is for Hungarian persons living in Hungary, and using the data of 2001 and 2011 census as
starting points. This solution is reasonable because migrant stock contains all the Hungarian-born
persons who ever left Hungary (and still alive), that is, their sex and age structure are different from
new migrants’ sex and age structure to a great extent. This way emigration will be likely to be
overestimated, because it is known that emigrants are younger than the whole population generally.
This approach is confirmed by some data available from the EU: Table 6 shows that the age structure
of Hungarian-born persons is similar to the age structure of the population of Hungary.

Hungarian citizens in the
EU (1998-2013 average)
Hungarian-born people in
the EU (1999-2013 average)
The population of
Hungary, 2013
Less than 15 years 8% 6% 14%
From 15 to 64 years 88% 69% 68%
65 years or over 4% 24% 17%
Total 100% 100% 100%
Table 6. Age structure of Hungarian citizens and Hungarian-born persons in the EU and the population of
Hungary
In the latter case, 58 208 deaths occur between 2000 and 20104, while the difference of the two
stocks are 48 thousand persons – it means that their summary are 106 thousand persons, an average
of 10.6 thousand persons per year.
Between 2010 and 2013 the difference of the two stocks were 36 258 persons and 23 868 deaths
occurred in that period. It means that the change is about 60 thousand persons, this is an average of
20 thousand persons per year – which is two times higher than the average in the previous ten years.
Figure 32. Net migration of Hungarian-born persons between 2001 and 2012
(an estimation on the basis of Hungarian vital statistics and UN stock data)
Source: Demographic Yearbook 2001-2012, UN
The significant growth of net migration of Hungarian-born persons is likely to be in connection with
the opening of the Austrian and German labour market in 2011. Generally, Hungarians working in
4 This calculation of the number of deaths is based on the assumption that Hugarian persons living abroad have
the same probabilities of death at every single age than people living in Hungary. This is a „naive” assumption, because there are selection effects on migrants (the healthier people are the higher their chance is to be migrants), and also the living standard of the given country has an effect on mortality.
-12 6
02
-10 7
94
-9 7
22
-8 7
21
-8 6
24
-8 5
10
-9 2
71
-11 9
50
-11 4
83
-13 9
18
-19 7
13
-20 2
64
-25 000
-20 000
-15 000
-10 000
-5 000
0

Austria rather commute, but it can be imagined that several persons considered living in Austria after
opening the labour market. The effect of German labour market opening is probably more serious:
Germany is one of the most popular destination countries for Hungarian emigrants, and they more
likely to settle down there because of the long distance.
The whole net migration – consisting of non-Hungarian citizens and Hungarian-born persons as well –
can be calculated from the previous two net migrations (Figure 33).
Figure 33. Net migration in Hungary between 2001-2012
(estimation using vital statistics, censuses and UN migration statistics)
Two questions emerge from previous processes: whether we are near to the real migration processes
or not; and, what kinds of future tendencies are expected, on the basis of information summarized
here.
Sex and age structure of migrants:
To produce a population projection using data on migrants, some numeric assumptions have to be
formulated concerning not only the number of migrants, but the sex and age structure as well.
International experience shows that the proportion of men is higher among migrants, and
considering the age structure, most of them are from the 18-40 age group. However, more precise
and Hungarian data are needed for population projection.
Sex composition:
-2 2
38
-3 2
10
-910
1 9
77 5
638
3 1
03
1 2
03
11 3
56
499
-4 0
81
-7 8
86
-9 8
40
-15 000
-10 000
-5 000
0
5 000
10 000
15 000
2001 2002 2003 2004 2005 2006 2007 2008 2009 2010 2011 2012
According to HCSO data the rate of men was 53 percent and that of women was 47 percent among
Hungarian citizens emigrating from Hungary and immigrating into Hungary in 2012.
Data on immigrating and emigrating foreign citizens for 2009-2012 show that the rate of men is on
average 55 percent per year, and the rate of women is on average 45 percent per year.
On the base of these proportions, the sex ratio assumption is 55 percent in favour of men among
migrants.
Age composition:
To determine the age structure of migrants, both foreign citizens immigration to and emigration
from Hungary, and Hungarian-born persons emigration from Hungary and re-emigration to the
country will be analysed. The starting point are data for 2012 which are available for two sexes and
for every single age. Taking into consideration all relevant factors – direction of migration processes,
citizenship or birth country of migrants, sex and age composition of migrants – makes the estimation
extremely complicated. At the same time, this method does not necessarily mean higher precision in
population projection, because when the assumptions concern a smaller part of the whole process or
smaller groups are affected by those processes, the assumptions are less accurate. Additionally, the
precision of available data is also restricted, that is data used for formalizing assumptions are
approximate data. A possible solution is to take into account the sex and age composition of non-
Hungarian immigrants in the case of positive net migration, and Hungarian-born emigrants in the
case of negative net migration. This is reasonable because migration loss mostly comes from
Hungarians emigrating from Hungary, while migration surplus mostly comes from foreign citizens
immigrating to Hungary.
Assumption for migration: the „real” migration and changing migration model scenario:
Assumptions for migration consist of two parts: migration of foreign citizens and Hungarian
citizens/Hungarian-born persons, and the net migration is taken into account for both cases (Figure
34).

Figure 34. Net migration of foreign citizens and Hungarian-born persons/Hungarian citizens together and
separately, „real migration” assumption, 2012-2060
Fertility and mortality assumptions of „real migration” scenario correspond with those of medium
variant: the total fertility rate reaches 1.6 in 2060, and parallel with continuous rise in life expectancy
at birth, the life expectancy at birth is about 86.1 year for women and 80.1 for men in 2060.
Migration assumptions are the following:
The 10 thousand net migration of foreign citizens will remain at this level until the next ten
years, and then a slow rise will occur and it reaches the average of about 20 thousand
persons per year in the middle of the 2040s, and then it remains on this level. The rise in
immigration of foreign citizens to Hungary will probably occur because a lack of labour force
emerges as a consequence of emigration of Hungarians. It is assumed that the structure of
immigrants will be changed: less and less immigrants come from the neighbouring countries
or even from Europe, and more and more people come from the countries of the third world.
Primarily, the labour force demand of Austria and Germany is in the background of current
negative net migration of Hungarian citizens – the assumption is that this effect will prevail
until a couple of years. But, after this period a very high, an average of 30 thousand persons
per year negative net migration is supposed for the next decade – partly as a consequence of
the effect of migration networks, partly the high mobility of younger generations,
furthermore, as an attractive effect of countries offering more favourable circumstances in
the labour market than Hungary. The „migration as a chance” is a real possibility for most of
the young people, to go abroad either in order to find a job or to study. After this period it is
-40 000
-30 000
-20 000
-10 000
0
10 000
20 000
30 000
20
12
20
14
20
16
20
18
20
20
20
22
20
24
20
26
20
28
20
30
20
32
20
34
20
36
20
38
20
40
20
42
20
44
20
46
20
48
20
50
20
52
20
54
20
56
20
58
20
60
Foreign citizen Hungarian Net migration

a plausible conception that Hungarians emigrated in their young age begin to re-migrate to
Hungary in their older ages, subsequently the population loss due to migration will decrease.
In the middle of the 2030s the net migration of Hungarian citizens/Hungarian-born persons
still show negative net migration, and an average of 5 thousand persons per year negative
net migration is supposed until the end of the projected period.
Considering the net migration of foreign and Hungarian citizens/Hungarian-born persons
together a „migration valley” can be detected for a decade. The net migration changes to
positive by middle of the 2030s – accordingly to the assumed improving situation -, but its
volume is an average of 5 thousand persons per year. This volume is about a half/third of
positive net migration observed during 1990-2010.
Figure 35. Net migration of foreign citizens and Hungarian-born persons/Hungarian citizens together and
separately, „changing migration model” assumption, 2012-2060
The name of the previous migration assumption could be „partially changing migration model”,
because net migration is negative in a restricted time period only. In case of the fully changing
migration model the assumptions are that the net migration of foreign citizens will not rise, the
„migration valley” is more permanent than it was in the previous scenario, and there is some
recovery, but it is not enough to make the full net migration positive. This model shows that Hungary
definitely becomes a sending country, that is, a full change of migration model will emerge (Figure
35).
-35 000
-30 000
-25 000
-20 000
-15 000
-10 000
-5 000
0
5 000
10 000
15 000
20
12
20
14
20
16
20
18
20
20
20
22
20
24
20
26
20
28
20
30
20
32
20
34
20
36
20
38
20
40
20
42
20
44
20
46
20
48
20
50
20
52
20
54
20
56
20
58
20
60
Foreign citizen Hungarian Net migration
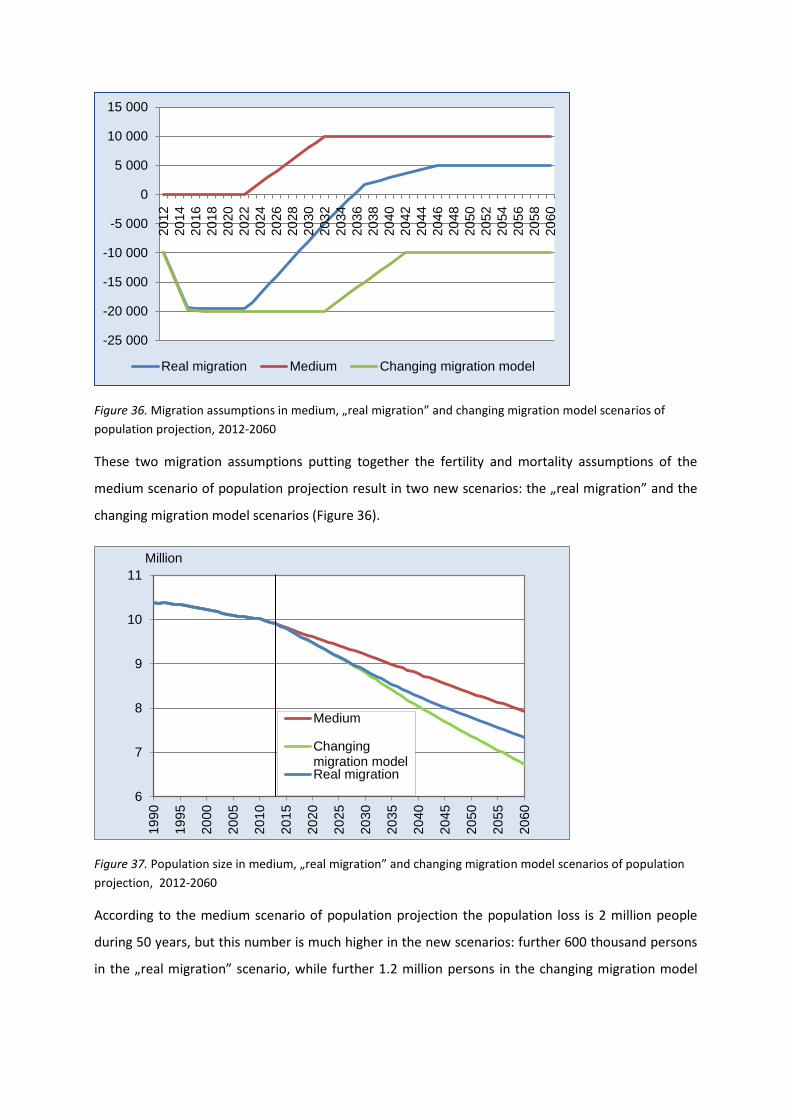
Figure 36. Migration assumptions in medium, „real migration” and changing migration model scenarios of
population projection, 2012-2060
These two migration assumptions putting together the fertility and mortality assumptions of the
medium scenario of population projection result in two new scenarios: the „real migration” and the
changing migration model scenarios (Figure 36).
Figure 37. Population size in medium, „real migration” and changing migration model scenarios of population
projection, 2012-2060
According to the medium scenario of population projection the population loss is 2 million people
during 50 years, but this number is much higher in the new scenarios: further 600 thousand persons
in the „real migration” scenario, while further 1.2 million persons in the changing migration model
-25 000
-20 000
-15 000
-10 000
-5 000
0
5 000
10 000
15 000
20
12
20
14
20
16
20
18
20
20
20
22
20
24
20
26
20
28
20
30
20
32
20
34
20
36
20
38
20
40
20
42
20
44
20
46
20
48
20
50
20
52
20
54
20
56
20
58
20
60
Real migration Medium Changing migration model
6
7
8
9
10
11
19
90
19
95
20
00
20
05
20
10
20
15
20
20
20
25
20
30
20
35
20
40
20
45
20
50
20
55
20
60
Million
Medium
Changingmigration modelReal migration

scenario – in this latter case the population of Hungary would be no more than 7.3 million people in
2060 (Figure 37).
5. Replacement migration scenario
The replacement migration scenario shows how many people would be needed to compensate for
the population loss emerging from the natural decrease of population. In other words the
replacement migration scenario answer the question what net migration is enough in order to avert
depopulation.
5.1 Replacement migration scenario in case of the Slovak Republic
This projection scenario incorporates replacement-migration into the medium variants of fertility and
mortality. As shown in Figure 38, until 2020 the natural increase is predicted. Therefore, no migration
is needed to avert de-population. After 2021, a growing net migration is needed in order to fixate the
population number at current level.
Figure 38. The replacement net migration (stable population), the Slovak Republic, 2013-2060
Neither one of the scenarios is able to compensate for the natural increase of population. The
compensating level is much higher than the values in very probable scenarios (medium, real-
migration), reaching more than 20 000 in 2045, and more than 30 000 in 2060.
0
5 000
10 000
15 000
20 000
25 000
30 000
35 000
20
13
20
15
20
17
20
19
20
21
20
23
20
25
20
27
20
29
20
31
20
33
20
35
20
37
20
39
20
41
20
43
20
45
20
47
20
49
20
51
20
53
20
55
20
57
20
59
Pers
ons

-10 000
-5 000
0
5 000
10 000
15 000
20 000
25 000
30 000
35 000
2013
2015
2017
2019
2021
2023
2025
2027
2029
2031
2033
2035
2037
2039
2041
2043
2045
2047
2049
2051
2053
2055
2057
2059
Net
mig
rati
on
Replacement migration
Real migration
Medium scenario
Figure 39. The comparison of several variants of migration, the Slovak Republic, 2013-2060
5.2 Replacement migration scenario in case of Hungary
The medium variant of population projection is the starting point for the calculation; fertility and
mortality assumptions of the replacement migration variant are the same as they were in medium
variant.
The necessary population to compensate for the natural decrease of the population is about 44
thousands in 2013; then decreasing continuously it reaches its lowest point in 2021, about 40
thousands. The cause of this decreasing trend is the fertility assumption concerning this period,
which projects increasing total fertility rate. After that period there is no further rise in fertility level,
this is why the natural population loss – and, consequently, the replacement migration level – is
growing rapidly: its highest value is about 55 thousand persons (Figure 40).
Figure 40. Replacement net migration (stable population), Hungary, 2013-2060
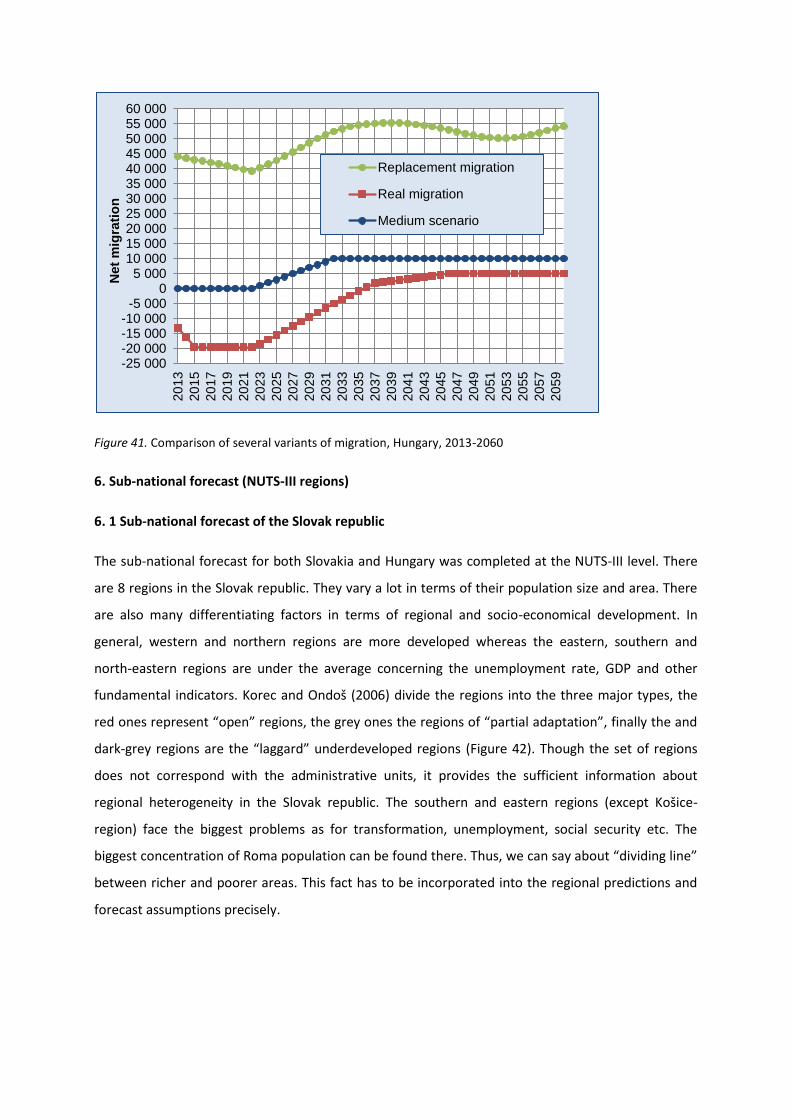
Figure 41. Comparison of several variants of migration, Hungary, 2013-2060
6. Sub-national forecast (NUTS-III regions)
6. 1 Sub-national forecast of the Slovak republic
The sub-national forecast for both Slovakia and Hungary was completed at the NUTS-III level. There
are 8 regions in the Slovak republic. They vary a lot in terms of their population size and area. There
are also many differentiating factors in terms of regional and socio-economical development. In
general, western and northern regions are more developed whereas the eastern, southern and
north-eastern regions are under the average concerning the unemployment rate, GDP and other
fundamental indicators. Korec and Ondoš (2006) divide the regions into the three major types, the
red ones represent “open” regions, the grey ones the regions of “partial adaptation”, finally the and
dark-grey regions are the “laggard” underdeveloped regions (Figure 42). Though the set of regions
does not correspond with the administrative units, it provides the sufficient information about
regional heterogeneity in the Slovak republic. The southern and eastern regions (except Košice-
region) face the biggest problems as for transformation, unemployment, social security etc. The
biggest concentration of Roma population can be found there. Thus, we can say about “dividing line”
between richer and poorer areas. This fact has to be incorporated into the regional predictions and
forecast assumptions precisely.
-25 000-20 000-15 000-10 000
-5 0000
5 00010 00015 00020 00025 00030 00035 00040 00045 00050 00055 00060 000
20
13
20
15
20
17
20
19
20
21
20
23
20
25
20
27
20
29
20
31
20
33
20
35
20
37
20
39
20
41
20
43
20
45
20
47
20
49
20
51
20
53
20
55
20
57
20
59
Net
mig
rati
on
Replacement migration
Real migration
Medium scenario

Figure 42. Level of regional development in the Slovak republic (Korec, Ondoš 2006).
Figure 43 depicts the 8 NUTS-III regions including the capitals of them.
Figure 43. The NUTS-III regions in the Slovak republic. Bratislava - BL, Trnava – TA, Trenčín – TC, Nitra – NI,
Banská Bystrica – BC, Prečov – PV, Košice – KI, Žilina – ZI (official abbreviations used in the text)
The hybrid model (Willekens 1983) was used in the forecasting process. Its principle lies in
combination of bottom-up and top-down approaches. The regional assumptions were initially
prepared. Then the calibration with respect to the national assumptions was executed. The national
values of parameters and results represented the control benchmark. Since the national population
development is more stable and less volatile, this approach is very useful and sufficient. Moreover,
some cohort analyses at national level are at disposal, making the analysis more comprehensive.

Likewise in case of the national forecast, the cohort-component method was used in case of regional
forecast. The forecasting period is from 2013 to 2035.
Prediction of fertility was based on the detailed time-series analysis oriented at changes in level and
timing of fertility, postponement and recuperation of birth. The cohort and transversal analysis were
applied in order to obtain the comprehensive view on the process of fertility in regions. In general,
some stabilization of the process should come within coming two decades. In case of regional
populations, the starting time and intensity of the postponement and subsequent recuperation were
taken into the consideration. Some regional specifics were also taking into account. Some alternative
indicators such as tempo-adjusted fertility rate serve as useful tool in prediction of the parameters.
Ageing of the fertility profiles will be a general characteristic of future fertility developments across
the regions. Slight convergence within regions is predicted. The highest fertility is expected in the
eastern regions. The fertility is hardly to exceed the level of 1.7, whereas in regions of Bratislava and
Nitra will slightly increase up to the level of 1.4. Stabilisation of the process is predicted in all regions
(Figure 44).
Figure 44: Total fertility rate in NUTS-III populations, Statistical Office of the Slovak republic, own calculations
Mortality is highly differentiated across regions. The general assumption is based on the increase of
life expectancy of both males and females. Single and multidimensional decomposition confirms a
big potential for further lowering of mortality. This is true especially for middle and higher ages due
to the high level of cardiovascular diseases. Therefore, the higher contribution to the growing life
expectancy will be induced by the ages over 50. As the most problematic seems a significant male
over-mortality, though some slight decrease in difference has been observed recently. Some
convergence within the set of regions is predicted, however the regional heterogeneity will continue.
0,91,01,11,21,31,41,51,61,71,81,92,02,12,22,32,4
1993
1995
1997
1999
2001
2003
2005
2007
2009
2011
2013
2015
2017
2019
2021
2023
2025
2027
2029
2031
2033
2035
Ch
ild
en
per
wo
ma
n
BL
TA
TC
NI
ZI
BC
PV
KI
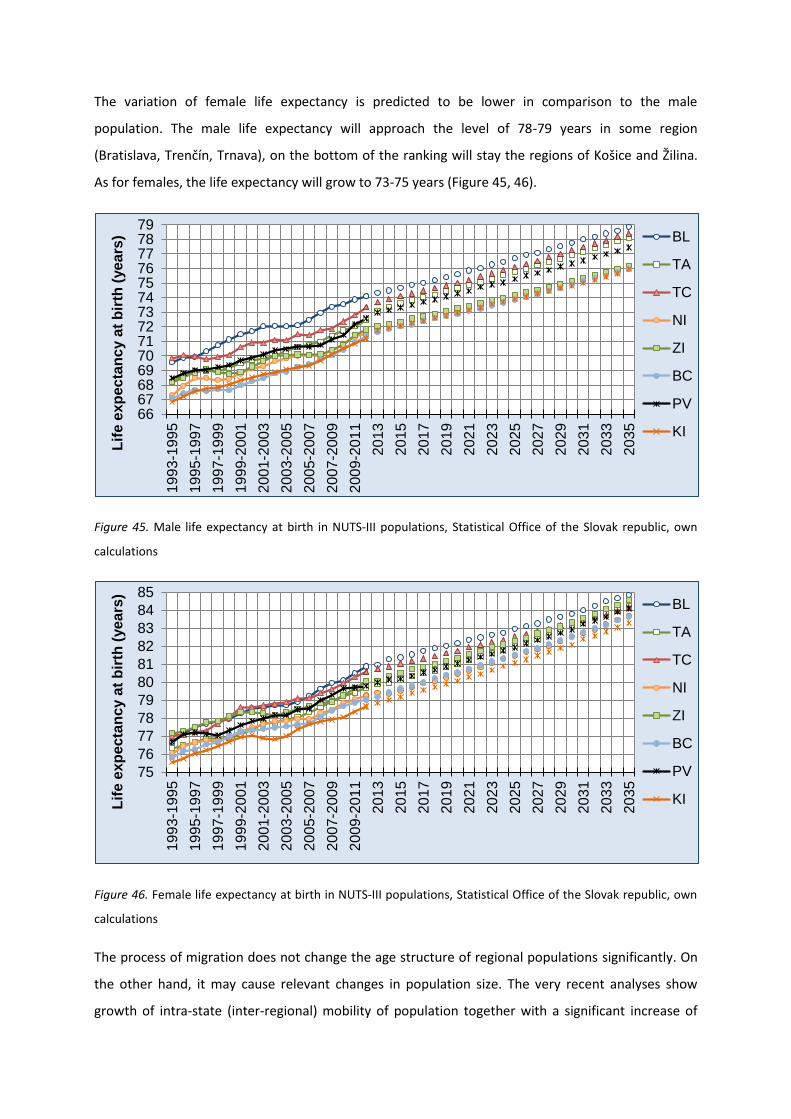
The variation of female life expectancy is predicted to be lower in comparison to the male
population. The male life expectancy will approach the level of 78-79 years in some region
(Bratislava, Trenčín, Trnava), on the bottom of the ranking will stay the regions of Košice and Žilina.
As for females, the life expectancy will grow to 73-75 years (Figure 45, 46).
Figure 45. Male life expectancy at birth in NUTS-III populations, Statistical Office of the Slovak republic, own
calculations
Figure 46. Female life expectancy at birth in NUTS-III populations, Statistical Office of the Slovak republic, own
calculations
The process of migration does not change the age structure of regional populations significantly. On
the other hand, it may cause relevant changes in population size. The very recent analyses show
growth of intra-state (inter-regional) mobility of population together with a significant increase of
6667686970717273747576777879
199
3-1
99
5
199
5-1
99
7
199
7-1
99
9
199
9-2
00
1
200
1-2
00
3
200
3-2
00
5
200
5-2
00
7
200
7-2
00
9
200
9-2
01
1
2013
2015
2017
2019
2021
2023
2025
2027
2029
2031
2033
2035
Lif
e e
xp
ec
tan
cy a
t b
irth
(ye
ars
) BL
TA
TC
NI
ZI
BC
PV
KI
75
76
77
78
79
80
81
82
83
84
85
199
3-1
99
5
199
5-1
99
7
199
7-1
99
9
199
9-2
00
1
200
1-2
00
3
200
3-2
00
5
200
5-2
00
7
200
7-2
00
9
200
9-2
01
1
2013
2015
2017
2019
2021
2023
2025
2027
2029
2031
2033
2035
Lif
e e
xp
ec
tan
cy a
t b
irth
(ye
ars
)
BL
TA
TC
NI
ZI
BC
PV
KI

Eastern – Western migration flows. In general, the Eastern and Central part of Slovakia represent the
source areas of out-migration to the destination regions in the Western part of the Slovak Republic,
namely Bratislava and its wider surrounding area. Among major reasons of that, the unceasing
regional inequality is very likely the most important one. The differences in wages, unemployment
rates, social security are massive in the Slovak Republic. For instance, the value of average salary
varied from 717 to 1110 EUR in 2013. The unemployment rate in Bratislava-region was registered at
level of 6 per cent, whereas in Prešov-region and Banská Bystrica-region exceeded 19 per cent in
January 2014 (Statistical Office of the SR). Push factors are well developed in the Eastern part of the
country. On the other hand, the economy of Bratislava-region dealt with the economic crisis quite
satisfyingly. It seems that the economic crisis have preserved, or even reinforced the regional
inequalities and disparities thus inducing the process of heightening mobility. The labour migration is
the fundamental engine of inter-regional migration with no doubt. The importance of international
migration has slightly lowered in the crisis period. Anyways the primary targets of in-migration
represent the Bratislava region and major urban centres in the Western Slovakia, Košice-city and
some others.
The most mobile population is that aged 25-40 years in all regions. We predict stable development of
migrants´ age-structure, though the absolute mobility of the older population segment will rise
bounded with the population ageing. A net migration in regions has been relatively volatile in recent
decades, nevertheless the essential features has remained stable. The dispersion of predicted values
is very likely to grow in coming decades, and variation at the end of forecasting period will be bigger
in comparison to the current state (Figure 47).
Figure 47. Net migration in NUTS-III populations, Statistical Office of the Slovak republic, own calculations
-1500-1000-500
0500
10001500200025003000350040004500500055006000
2001
2003
2005
2007
2009
2011
2013
2015
2017
2019
2021
2023
2025
2027
2029
2031
2033
2035
Nu
mb
er
of
pers
on
s
BL
TA
TC
NI
ZI
BC
PV
KI

No distinct change in population size is predicted in NUTS-III regions except Bratislava-region because
of positive net-migration in the region. Its population size should grow by approximately 20 per cent.
The biggest decrease in population size is expected in the region of Banská Bystrica. This is influenced
by natural decrease and migration loss as well. The most stable development should face the Žilina-
region. The most populated regions are Prešov and Košice region. The values will wary from 570
thousand to 850 thousand inhabitants. In general, no radical changes are expected. The changes are
more relevant with respect to the natural increase. Much more distinctive changes are expected with
respect to the population ageing. This development corresponds with the national development,
meaning that all regions will face natural decrease in horizon of 2035 with the exception of Prešov-
region. Though the natural increase is expected as very lowering in time, still balanced numbers of
births and deaths are very likely in the horizon of this forecast.
As for population size and natural increase (Figure 48 and 49), the most gaining region is Bratislava
thanks to the positive net-migration during the entire forecasting period. Downward trends will be
typical for all eight regions, in some of them double-effect of both negative natural increase and
negative net-migration will cause the more distinct de-population. Migration is more influencing
factor of the overall population change with respect to the differences across the regions.
Figure 48. Predicted population size of the NUTS-III populations, own calculations
550570590610630650670690710730750770790810830850
2013
2014
2015
2016
2017
2018
2019
2020
2021
2022
2023
2024
2025
2026
2027
2028
2029
2030
2031
2032
2033
2034
2035
Nu
mb
er
of
pers
on
s
(in
th
ou
sa
nd
s)
BL
TA
TC
NI
ZI
BC
PV
KI

Figure 49. Predicted natural increase (annual number of births minus number of deaths) of the NUTS-III
Looking at changes in the age structure (Figure 50, 51 and 52), population ageing is
confirmed as the universal demographic process in Slovakia. All regional populations will be
ageing with similar intensity. On the other hand, the variation among regions remains.
Migration will affect age-structural changes only partially. Such changes will be most visible
in regions prone to a more intensive migration. For instance, ageing in the Bratislava-region
will be mitigated by the migration inflow. In general, the low fertility, increase of the life
expectancy going hand in hand with the time-structural shifts (big cohorts of baby-boom
waves) will represent the principal factors of the population ageing. Prešov and Košice-
region will stay in position of the youngest regional populations with the ageing index below
120 persons aged 65 and more to 100 persons aged 0-14. Trenčín and Nitra-regions will be
at the opposite end of the ranking. The ageing index will grow up to 170. The mean age will
exceed 47 years, whereas in case of Prešov-region the value of 43 years is predicted.
-4000-3500-3000-2500-2000-1500-1000-500
0500
1000150020002500300035004000
2013
2014
2015
2016
2017
2018
2019
2020
2021
2022
2023
2024
2025
2026
2027
2028
2029
2030
2031
2032
2033
2034
2035
Nu
mb
er
of
pers
on
s
BL
TA
TC
NI
ZI
BC
PV
KI

Figure 50. Predicted total increase of population (natural incerase + net migration) of the NUTS-III populations,
own calculations
Figure 51. Predicted ageing index (Pop. 65+/Pop. 0-14)in the NUTS-III populations, own calculations
-3000-2500-2000-1500-1000-500
0500
1000150020002500300035004000450050005500600065007000
2013
2014
2015
2016
2017
2018
2019
2020
2021
2022
2023
2024
2025
2026
2027
2028
2029
2030
2031
2032
2033
2034
2035
Nu
mb
er
of
pers
on
s
BL
TA
TC
NI
ZI
BC
PV
KI
50
60
70
80
90
100
110
120
130
140
150
160
170
180
2013
2014
2015
2016
2017
2018
2019
2020
2021
2022
2023
2024
2025
2026
2027
2028
2029
2030
2031
2032
2033
2034
2035
Ag
ein
g i
nd
ex
BL
TA
TC
NI
ZI
BC
PV
KI

Figure 52. Predicted mean age in the NUTS-III populations, own calculations
6. 2 Sub-national forecast of Hungary
The regional population forecast on NUTS-III level was calculated for 19 counties and the capital city
of Hungary, that is, for 20 territorial units. The differences between the counties are significantly
high, both according to economic factors and socio-demographic characteristics. The highest
difference can be found between the capital, Pest county and the other counties: the capital and Pest
county are in economically better but demographically worse situation than the other counties.
Counties situated in the north-western part of Hungary are more developed economically than the
average, while counties situated in the north-eastern part of the country are less developed.
According to 2012 data, GDP per capita is two times higher in Budapest than the national average,
1.2 times higher in Győr-Moson-Sopron county and is equal to the national average in Komárom-
Esztergom county. This value is lowest in Nógrád county where it is less than half of the national
average, but it is significantly lower than the national average in Jász-Nagykun-Szolnok, Somogy,
Borsod-Abaúj-Zemplén, Békés and Szabolcs-Szatmár-Bereg counties as well (Figure 53).
37
38
39
40
41
42
43
44
45
46
47
48
2013
2014
2015
2016
2017
2018
2019
2020
2021
2022
2023
2024
2025
2026
2027
2028
2029
2030
2031
2032
2033
2034
2035
Me
an
ag
e
BL
TA
TC
NI
ZI
BC
PV
KI

Figure 53. GDP per capita (EUR) in NUTS-III regions 2012, Hungary
Unemployment rate is partly similar to GDP per capita. According to 2012 data again, this rate is
lowest in Győr-Moson-Sopron, Vas and Komárom-Esztergom counties, but it is somewhat lower than
the national average in Budapest and Pest, Bács-Kiskun and Tolna counties. Unemployment rate is
highest in Szabolcs-Szatmár-Bereg, Borsod-Abaúj-Zemplén and Nógrád counties, but it exceeds the
national average in Hajdú-Bihar, Heves és Baranya counties too (Figure 54).
There are considerable territorial differences in the rate of graduated persons, too: while one third of
people living in the capital have university or college degree, this rate is only one tenth in Nógrád
county.
Concerning economic activity, the differences are also significant: economic activity rate is 50
percent in Budapest, 48 percent in Komárom-Esztergom county, but this rate is only 41 percent in
Borsod-Abaúj-Zemplén and Szabolcs-Szatmár counties, which are in the worst situation in this
respect.
According to the latest census5, Budapest and Pest county was the most, while Somogy county was
the least densely populated part of the country.
5 2011. évi népszámlálás. 3. Országos adatok. KSH Budapest, 2013.

Figure 54. Unemployment rate (%) in NUTS-III regions 2012, Hungary
The population of Pest county reached one million at the time of the previous census, and the
number of its population further increased by 12 per cent between 2001 and 2011. The population of
Győr-Moson-Sopron county has also increased, although the extent of this increase was much
smaller. Except these two counties, the population of all the counties decreased between the last
two censuses. The volume of population loss was highest in Békés county, but population loss was
higher than the average in Nógrád, Tolna, Borsod-Abaúj-Zemplén and Jász-Nagykun-Szolnok counties
as well.
Fertility is lowest in Budapest, among the counties Csongrád shows the lowest fertility. Fertility is
higher than the national average in Szabolcs-Szatmár-Bereg, Borsod-Abaúj-Zemplén and Jász-
Nagykun-Szolnok counties.
The number of deaths exceeds the number of births in each county in the last decade, but the
volume of natural increase was different across the counties: Békés, Somogy and Zala counties
showed the lowest value, and it was the highest in Szabolcs-Szatmár-Bereg and Pest counties.
The result of migration processes increased population size in almost half of the counties. Significant
positive net migration was experienced in Pest county in the last decade, somewhat lower in Győr-
Moson-Sopron county, but population was not decreased by migration either in Csongrád, Fejér,
Hajdú-Bihar, Heves, Komárom-Esztergom, Somogy, Vas and Zala counties. More substantial
5,3 - 7,8 7,9 - 10,3 10,4 - 12,0 12,1 - 14,7 14,8 - 17,5
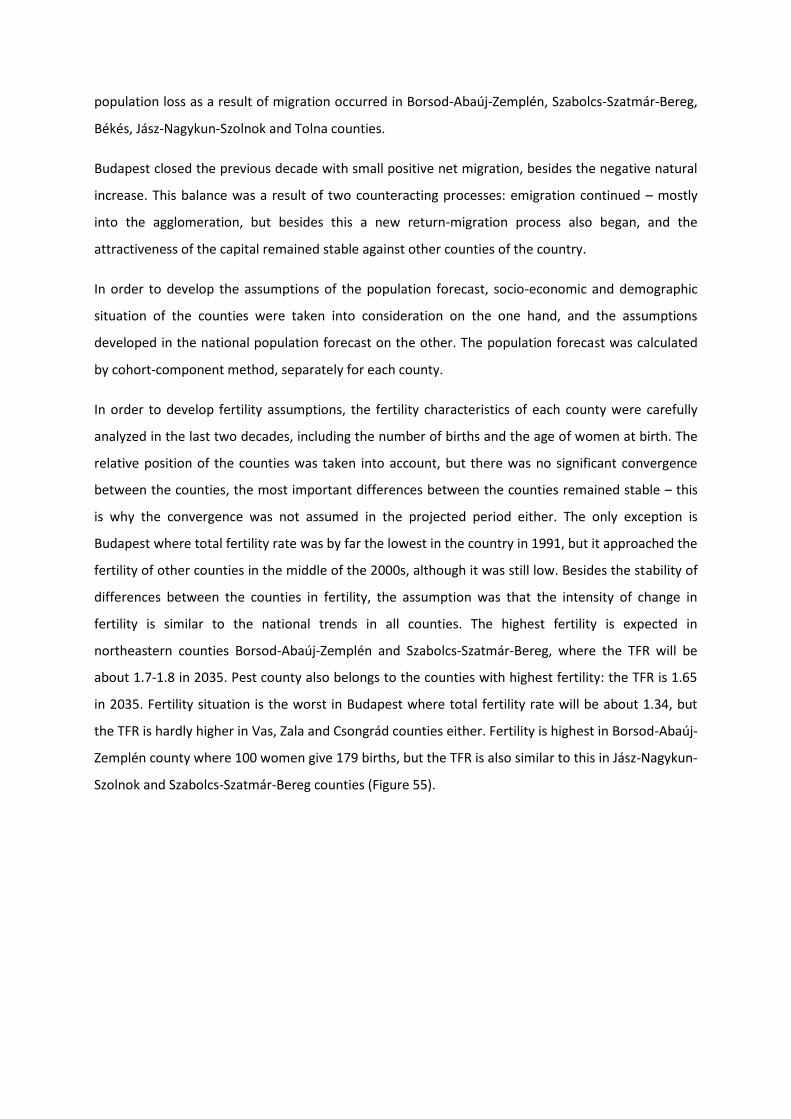
population loss as a result of migration occurred in Borsod-Abaúj-Zemplén, Szabolcs-Szatmár-Bereg,
Békés, Jász-Nagykun-Szolnok and Tolna counties.
Budapest closed the previous decade with small positive net migration, besides the negative natural
increase. This balance was a result of two counteracting processes: emigration continued – mostly
into the agglomeration, but besides this a new return-migration process also began, and the
attractiveness of the capital remained stable against other counties of the country.
In order to develop the assumptions of the population forecast, socio-economic and demographic
situation of the counties were taken into consideration on the one hand, and the assumptions
developed in the national population forecast on the other. The population forecast was calculated
by cohort-component method, separately for each county.
In order to develop fertility assumptions, the fertility characteristics of each county were carefully
analyzed in the last two decades, including the number of births and the age of women at birth. The
relative position of the counties was taken into account, but there was no significant convergence
between the counties, the most important differences between the counties remained stable – this
is why the convergence was not assumed in the projected period either. The only exception is
Budapest where total fertility rate was by far the lowest in the country in 1991, but it approached the
fertility of other counties in the middle of the 2000s, although it was still low. Besides the stability of
differences between the counties in fertility, the assumption was that the intensity of change in
fertility is similar to the national trends in all counties. The highest fertility is expected in
northeastern counties Borsod-Abaúj-Zemplén and Szabolcs-Szatmár-Bereg, where the TFR will be
about 1.7-1.8 in 2035. Pest county also belongs to the counties with highest fertility: the TFR is 1.65
in 2035. Fertility situation is the worst in Budapest where total fertility rate will be about 1.34, but
the TFR is hardly higher in Vas, Zala and Csongrád counties either. Fertility is highest in Borsod-Abaúj-
Zemplén county where 100 women give 179 births, but the TFR is also similar to this in Jász-Nagykun-
Szolnok and Szabolcs-Szatmár-Bereg counties (Figure 55).

Figure 55. Total fertilty rate in NUTS-III populations, Hungarian Central Statistical Office, own calculations
Mortality indicators also show important differences across the counties, but life expectancy
increases in all the counties unambiguously. According to the mortality assumption of the population
forecast, the rise of life expectancy will continue both for men and women. The mortality of the
counties did not get closer to each other in the last two decades, so convergence is not assumed in
the projection period either. Life expectancy changes in accordance with national mortality
assumptions.
In case of men the life expectancy assumption was 77-78 years in Budapest in 2035 which is an
extremely high value compared to the other counties in Hungary. The expected life expectancy is
more than 76 years higher than the national average in Zala, Győr-Moson-Sopron, Pest and Hajdú
counties. The projected life expectancy is one year lower than the national average and this way it
does not reach 75 years in Somogy, Nógrád, Komárom-Esztergom and Jász-Nagykun-Szolnok
counties. The life expectancy of men is the lowest in Borsod-Abaúj-Zemplén county, it is 73.3 years in
2035 which is 4 years less than the life expectany of men in Budapest.
Women living in Hajdú-Bihar county and Budapest can count on a life expectancy of more than 83
years in 2035, but this value is not much less for women living Veszprém, Tolna and Zala counties.
Women’s life expectancy does not reach 82 years in Nógrád, Komárom-Esztergom, Békés and Jász-
1,0
1,1
1,2
1,3
1,4
1,5
1,6
1,7
1,8
1,9
2,0
2,1
2,2
1990
1992
1994
1996
1998
2000
2002
2004
2006
2008
2010
2012
2014
2016
2018
2020
2022
2024
2026
2028
2030
2032
2034
Ch
ild
ren
per
wo
ma
n
Budapest
Bács
Baranya
Békés
Borsod
Csongrád
Fejér
Győr
Hajdú
Heves
Szolnok
Komárom
Nógrád
Pest
Somogy
Szabolcs
Tolna
Vas
Veszprém
Zala

Nagykun-Szolnok counties according to the mortality assumptions in 2035. The situation is the worst
in Borsod-Abaúj-Zemplén county where women generally live for 81.1 years, which is far from the life
expectancy expected in other counties (Figure 56 and 57).
Figure 56. Male life expectancy at birth in NUTS-III populations, Hungarian Central Statistical Office, own
calculations
Internal migration in Hungary is not too significant compared to population size, and mostly
Budapest and Pest county is affected by migratory processes. The direction of international migration
is again mostly Budapest, and larger cities of the country situated near the country border.
60
61
62
63
64
65
66
67
68
69
70
71
72
73
74
75
76
77
78
1990
1992
1994
1996
1998
2000
2002
2004
2006
2008
2010
2012
2014
2016
2018
2020
2022
2024
2026
2028
2030
2032
2034
Lif
e e
xp
ec
tan
cy a
t b
irth
(ye
ars
)
Budapest
Bács
Baranya
Békés
Borsod
Csongrád
Fejér
Győr
Hajdú
Heves
Szolnok
Komárom
Nógrád
Pest
Somogy
Szabolcs
Tolna
Vas
Veszprém
Zala

Figure 57. Female life expectancy at birth in NUTS-III populations, Hungarian Central Statistical Office, own
calculations
Assumptions for migration were developed on the basis of earlier tendencies of internal and
international migration, as well as the economic characteristics of each county, in accordance with
the national migration assumptions. The motivation of migration is to find a more favourable labour
market position and migration because of education. This means that the migrant chooses
economically better situated counties and cities functioning as education centers as destinations
(Figure 58).
Budapest had the highest positive net migration in the last decade and the forecast assumption is a
continuation of this tendency in the future, until 2035. Pest county can also be characterized by
positive net migration, although it is much less in numbers than it was in case of Budapest. According
to the migration assumption of the forecast, the population of Győr-Moson-Sopron and Zala counties
will grow as a result of migration processes. The same is true for Hajdú-Bihar and Somogy counties to
less extent. The population loss because of migration is highest in Borsod-Abaúj-Zemplén county, but
it is also significant in Heves, Nógrád and Szabolcs-Szatmár counties, and it is also important in
Veszprém and Komárom-Esztergom counties.
72
73
74
75
76
77
78
79
80
81
82
83
84
1990
1992
1994
1996
1998
2000
2002
2004
2006
2008
2010
2012
2014
2016
2018
2020
2022
2024
2026
2028
2030
2032
2034
Lif
e e
xp
ec
tan
cy a
t b
irth
(ye
ars
) Budapest
Bács
Baranya
Békés
Borsod
Csongrád
Fejér
Győr
Hajdú
Heves
Szolnok
Komárom
Nógrád
Pest
Somogy
Szabolcs
Tolna
Vas
Veszprém
Zala

Figure 58. Net migration in NUTS-III populations, Hungarian Central Statistical Office, own calculations
The results of the national population forecast show significant population loss during the next two
decades. In accordance with these results, decrease is expected in the size of population in most
counties, especially those where the effect of negative natural increase and negative net migration
can be experienced at the same time, for example in Borsod-Abaúj-Zemplén or Nógrád counties.
The population of Budapest is likely to grow significantly because of positive net migration during
the next two decades, while the population of Pest county shows a very moderate population loss in
the projected period. As for other counties, there will be some population growth in Győr-Moson-
Sopron country, mostly as a consequence of favourable economic position and positive net
migration.
The density of population is highest in Budapest: about 17-18 percent of the inhabitants of Hungary
live here, which means nearly 1.7 – 1.8 million persons. The most densely populated county is Pest,
the number of its inhabitants is about 1.2 million persons and it will be about the same at the end of
the projected period. The population number in the other counties shows great variety: between 680
and 200 thousand persons at the beginning of the projection period and between 580 and 130
thousand persons in 2035 (Figure 59).
-25000
-20000
-15000
-10000
-5000
0
5000
10000
15000
20000
25000
2001
2003
2005
2007
2009
2011
2013
2015
2017
2019
2021
2023
2025
2027
2029
2031
2033
2035
Nu
mb
er
of
pers
on
s
Budapest
Bács
Baranya
Békés
Borsod
Csongrád
Fejér
Győr
Hajdú
Heves
Komárom
Nógrád
Pest
Somogy
Szabolcs
Szolnok
Tolna
Vas
Veszprém
Zala

Figure 59. Predicted population size of the NUTS-III populations, Hungary, own calculations
The natural increase is negative in each county, that is, the number of deaths exceeds the number of
births in a given year. The negative balance will grow further in most counties until the end of the
projection period, to the greatest extent in Pest county, where the growth is twofold. There are some
exceptions to this: Békés, Borsod-Abaúj-Zemplén, Heves, Nógrád and Jász-Nagykun-Szolnok counties,
but the moderation of the negative balance of natural increase is not really significant even in these
counties.
In case of Budapest the population loss of 5.5 thousand persons coming from natural increase will be
about 11 thousand persons by 2035, which is about two times higher than it was at the beginning of
the projection period.
The predicted volume of the total increase of population is highest in Budapest, and this is the only
case when the total increase of population is permanently positive during the projection period
because of the significant positive net migration: the city can count on 4-7 thousand persons total
population increase per each year until 2035. As for the counties, the only county is Győr-Moson-
Sopron where the total increase will be near zero. In all other counties the total increase will be
negative during the whole projection period. Population loss emerging from total increase is highest
in Borsod-Abaúj-Zemplén and Heves counties.
0100200300400500600700800900
100011001200130014001500160017001800
2013
2014
2015
2016
2017
2018
2019
2020
2021
2022
2023
2024
2025
2026
2027
2028
2029
2030
2031
2032
2033
2034
2035
Nu
mb
er
of
pers
on
s (
in t
ho
usa
nd
s)
Budapest
Bács
Baranya
Békés
Borsod
Csongrád
Fejér
Győr
Hajdú
Heves
Komárom
Nógrád
Pest
Somogy
Szabolcs
Szolnok
Tolna
Vas
Veszprém
Zala

Figure 60. Predicted natural increase (annual number of births minus number of deaths) of the NUTS-III
populations, Hungary,own calculations
Figure 61. Predicted total increase of population (natural incerase + net migration) of the NUTS-III populations,
Hungary,own calculations
-12000-11500-11000-10500-10000
-9500-9000-8500-8000-7500-7000-6500-6000-5500-5000-4500-4000-3500-3000-2500-2000-1500-1000
-5000
2013
2014
2015
2016
2017
2018
2019
2020
2021
2022
2023
2024
2025
2026
2027
2028
2029
2030
2031
2032
2033
2034
2035
Nu
mb
er
of
pers
on
s
Budapest
Bács
Baranya
Békés
Borsod
Csongrád
Fejér
Győr
Hajdú
Heves
Komárom
Nógrád
Pest
Somogy
Szabolcs
Szolnok
Tolna
Vas
Veszprém
Zala
-8000
-7000
-6000
-5000
-4000
-3000
-2000
-1000
0
1000
2000
3000
4000
5000
6000
7000
8000
2013
2014
2015
2016
2017
2018
2019
2020
2021
2022
2023
2024
2025
2026
2027
2028
2029
2030
2031
2032
2033
2034
2035
Nu
mb
er
of
pers
on
s
Budapest
Bács
Baranya
Békés
Borsod
Csongrád
Fejér
Győr
Hajdú
Heves
Komárom
Nógrád
Pest
Somogy
Szabolcs
Szolnok
Tolna
Vas
Veszprém
Zala

The change in the age structure of the population reveals dynamic ageing in all the counties, similarly
to the national population forecast.
The starting value of the ageing index is between 80 and 150 in 2013 and it goes up to between 140
and 220 – that is, not only a remarkable rise occurs, but the differences across the counties become
higher as well. In two “youngest” counties, Borsod-Abaúj-Zemplén and Szabolcs-Szatmár-Bereg the
ageing index goes up to 140 persons aged 65+ for 100 person aged 0-14 by 2035, while in the two
“oldest” counties, Zala and Vas this value is about 215.
The ageing index will rise with almost the same intensity in all the counties, although some variety
can be found. For example, the originally low ageing index will increase more slowly in Borsod-Abaúj-
Zemplén than in the other counties, the main cause of which is the relatively high fertility in this
county. Budapest is also an exception from the general tendency, but the slower increase of ageing
index here is due to the higher volume of positive net migration because of the younger age
structure of migrants. The ageing index is 150 in 2013 in Budapest and it rises to 190 by 2035.
The average increase of mean age is 4 years between 2013 and 2035, but the increase of that is a bit
different in various counties. The mean age is lowest in Szabolcs-Szatmár-Bereg and Pest counties,
because of the causes mentioned previously; it is highest in Zala and Vas counties – in these latter
cases the cumulative effect of negative net migration and low fertility prevails. The mean age rises to
the smallest extent in Borsod-Abaúj-Zemplén, Jász-Nagykun-Szolnok and Somogy counties, as well as
in Budapest: the increase is about 3 years during the projection period. The highest increase will be
found in Nógrád, Vas and Veszprém counties: the mean age goes up by 5 years until 2035 (Figure 62
and 63).

Figure 62. Predicted ageing index (Pop. 65+/Pop. 0-14) in the NUTS-III populations, own calculations
Figure 63. Predicted mean age in the NUTS-III populations, own calculations
80
90
100
110
120
130
140
150
160
170
180
190
200
210
220
2013
2014
2015
2016
2017
2018
2019
2020
2021
2022
2023
2024
2025
2026
2027
2028
2029
2030
2031
2032
2033
2034
2035
Ag
ein
g i
nd
ex
Budapest
Bács
Baranya
Békés
Borsod
Csongrád
Fejér
Győr
Hajdú
Heves
Komárom
Nógrád
Pest
Somogy
Szabolcs
39
40
41
42
43
44
45
46
47
48
2013
2014
2015
2016
2017
2018
2019
2020
2021
2022
2023
2024
2025
2026
2027
2028
2029
2030
2031
2032
2033
2034
2035
Me
an
ag
e
Budapest
Bács
Baranya
Békés
Borsod
Csongrád
Fejér
Győr
Hajdú
Heves
Komárom
Nógrád
Pest
Somogy
Szabolcs
Szolnok
Tolna
Vas
Veszprém
Zala

7. Local forecasts
7.1 Local forecast of the city of Turčianske Teplice
Turčianske Teplice is the small town in the Northern part of the Slovak republic. With the population
number of 6570 inhabitants (2013) is at the 98th place in the ranking of Slovak 138 cities and towns.
There are also some villages without statue of city with bigger population number. Anyway,
Turčianske Teplice obtained the statue of the centre of homonymous district in 1996. The town lies
in the southern part of Žilina NUTS-III region. One of the most important eastern-northern
communications crosses the town, however, some of other bigger cities in Žilina region have better
geographical position on the most important connection from Bratislava to Košice, and from the
Czech republic to the East. Turčianske Teplice is part of the region with over-average GDP, under-
average unemployment and general better social situation but does not belong to the absolute top
of the region from this point of view. The district Turčianske Teplice belongs to the lesser regions
with respect to the population size and area. The district is part of the wider functional urban region
of Martin city, town of Turčianske Teplice represents the lesser complementary node within. The
distance to Bratislava is about 210 km, depending on the selected route. Distance to the city of Žilina
(centre of the NUTS-III region) is about 55 km.
Figure 64. The geographical location of Turčianske Teplice within Slovakia
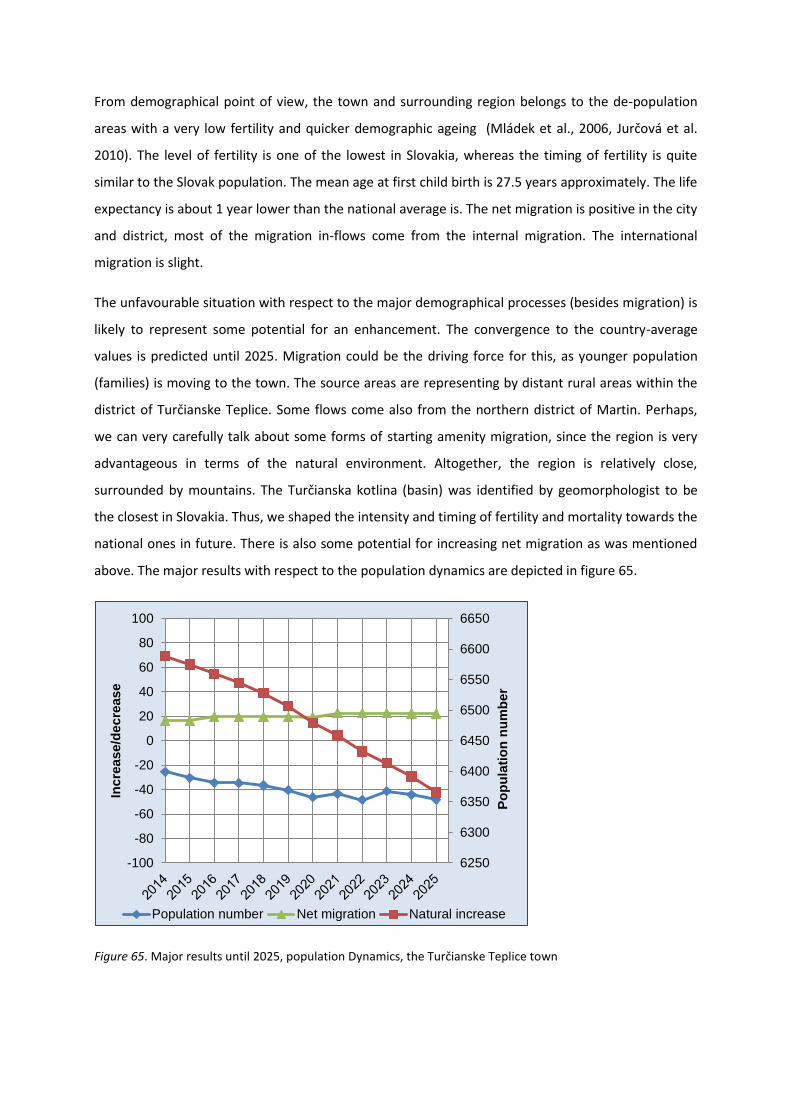
From demographical point of view, the town and surrounding region belongs to the de-population
areas with a very low fertility and quicker demographic ageing (Mládek et al., 2006, Jurčová et al.
2010). The level of fertility is one of the lowest in Slovakia, whereas the timing of fertility is quite
similar to the Slovak population. The mean age at first child birth is 27.5 years approximately. The life
expectancy is about 1 year lower than the national average is. The net migration is positive in the city
and district, most of the migration in-flows come from the internal migration. The international
migration is slight.
The unfavourable situation with respect to the major demographical processes (besides migration) is
likely to represent some potential for an enhancement. The convergence to the country-average
values is predicted until 2025. Migration could be the driving force for this, as younger population
(families) is moving to the town. The source areas are representing by distant rural areas within the
district of Turčianske Teplice. Some flows come also from the northern district of Martin. Perhaps,
we can very carefully talk about some forms of starting amenity migration, since the region is very
advantageous in terms of the natural environment. Altogether, the region is relatively close,
surrounded by mountains. The Turčianska kotlina (basin) was identified by geomorphologist to be
the closest in Slovakia. Thus, we shaped the intensity and timing of fertility and mortality towards the
national ones in future. There is also some potential for increasing net migration as was mentioned
above. The major results with respect to the population dynamics are depicted in figure 65.
Figure 65. Major results until 2025, population Dynamics, the Turčianske Teplice town
6250
6300
6350
6400
6450
6500
6550
6600
6650
-100
-80
-60
-40
-20
0
20
40
60
80
100
Po
pu
lati
on
nu
mb
er
Incre
ase/d
ecre
ase
Population number Net migration Natural increase

The natural increase will change in natural decrease due to the ageing population. The number of
births will lowering, whereas the number of deaths will growing in time. The population number will
face the downward trend. The positive net migration will slow down the trend partly. The decrease in
population size is about 200 persons in total by 2025.
Figure 66. Major results until 2025, age structure, the Turčianske Teplice town
The population ageing (Figure 66) is very evident in the population of the town . The town belongs to
the oldest cities in Slovakia concerning mean age, and the value will increase by 3 years until 2025.
The ageing index will grow up to 184 persons aged 65+ over 100 persons aged 0-14, thus being
significantly over the national average.
7.2 Local forecast of the city of Pécs
Pécs is situated in the south-western part of Hungary, about 200 km from the capital city. The
number of its inhabitants is nearly 150 thousand persons, this making Pécs the fifth biggest city in the
country, chief town of the county and a regional center as well. Most of the regional functions of
Pécs extend to three counties of the Southern Transdanubia region (Baranya, Somogy and Tolna
counties), but in case of some special functions, the southern part of Zala county and southwestern
part of Bács-Kiskun county also belong to the agglomeration of Pécs. Out of its regional funtions,
education, health system and culture are especially strong in the city.
41,50
42,00
42,50
43,00
43,50
44,00
44,50
45,00
45,50
46,00
5060708090
100110120130140150160170180190200210220230
Mean
ag
e
Ag
ein
g i
nd
ex:
65/0
-14 *
100
Ageing index Mean age

Figure 67. Baranya county (Pécs, small areas)
No other city in its 100-150 kilometer surrounding can compete with the cultural values, architecture
and natural surrounding of Pécs. However, some cities situated relatively far from Pécs and some of
the middle towns of the regional ring of cities around Pécs has become economically stronger in a
relative or absolute way since the democratic change. The development trend of Pécs was broken by
the loss of its economical potential after the democratic change. The city was not able to renew and
create a new, competitive economic structure. Neither the process of infrastructure development in
the country nor the changes taking place in international traffic corridors in the last two decades had
positive effects on city development.
Pécs was out of greenfield investment in the second half of the 1990s because of lack of important
factors for settling new industrial plants, especially the lack of appropriate infrastructure for
transport. A significant improvement has occurred in developing industrial infrastructure only, which
would make the settling of industrial firms possible in great volume.
The University of Pécs is a determining actor of economy in Pécs. The spendings of the university and
its students total up to 15-20 percent of the GDP of Pécs. The deteriorating financial situation of the
university as a tendency and a significant drop in the number of university students have serious
effect on the economy of Pécs as well. It is also an important tendency that the city is less and less
Pécsi
Siklósi Sellyei
Mohácsi
Szigetvári
Bólyi
Komlói Hegyháti
Szentlőrinci
Pécsváradi

able to keep graduated students in the city, because Budapest and other cities with central role have
strong attractive effect for labour force.
When data for Baranya county are applied to the society of Pécs it can be seen that the monthly
average salary of employees is equal to no more than 84 percent of that in the country. This average
salary is hardly equal to the 1.9 minimal wage and 1.5 subsistence level. The situation is even more
serious because the difference between incomes has become higher, and more and more people live
in poverty or even deep poverty. Unemployment is also high in the city.
Pécs and its surrounding areas were characterized by suburbanisation process in the last few
decades. The population of Pécs decreased in line with the increasing number of inhabitants in
settlements around Pécs, because of moving out of Pécs.
As a consequence of suburbanisation the development of the agglomeration ring was more
favourable compared to development of Pécs city. Mostly the settlements in the southern part of the
agglomeration were the destination area of migration, and it is also true nowadays. The population
gain of the whole agglomeration was about 9 thousand persons.
The decreasing population of the city shows the signs of dynamic ageing. The balance between
natural increase and migration was negative in the last decades. The emigration of young people,
especially with professional degree is significant in number.
Concerning other demographic characteristics, total fertility rate in Pécs was 1.13 in 2012 which is
much lower than the average total fertility rate in the country. Life expectancy is lower than the
national average, both for men and women; the difference is bigger for men than for women.
Working out the assumptions of the population forecast for Pécs, the socio-economic and
demographic characteristics and data compared to the national figures were taken into account. As
for fertility, the assumption was that it develops in line with the national trends and it will be about
1.41 in 2025. The assumptions for life expectancy show increasing trends, similarly to the national
forecast. As a result of this increase, life expectancy will be about 74.9 years for men and 81.1 years
for women in 2025. Migration can be most closely linked to economic processes of the settlement.
On the basis of the city development plan the migration assumption is that net migration remains at
the present level until the beginning of the planned improvement of economy, and after that period
the population loss coming from migration decreases, while it will be around zero in 2025.

The results of population forecast show continuously decreasing population: the population of Pécs
is 148 thousand persons in 2013, and 127 thousand persons in 2025, at the end of the projected
period – that is, the population loss is 20 thousand persons during one decade (Figure 68).
Figure 68. Major results until 2025, population dynamics, the Pécs city
The highest value of natural increase is -750 persons per year, the lowest value of it is -850 persons
per year, that is the natural increase remains negative during the whole projected period, in spite of
rising fertility. The number of births decreases from 1200 to 1000 births per year, the number of
deaths drop from 1900 to 1800 per year. Negative net migration further strengthens the tendencies
of population loss and ageing.
Figure 69. Major results until 2025, age structure, the Pécs city
-860
-840
-820
-800
-780
-760
-740
-720
-700
-680
-20 000
0
20 000
40 000
60 000
80 000
100 000
120 000
140 000
160 000
Natu
ral
incre
ase
Po
pu
lati
on
nu
mb
er/
net
mig
rati
on
Population number Net migration
41,00
41,50
42,00
42,50
43,00
43,50
44,00
44,50
45,00
5060708090
100110120130140150160170180190200210220230
Mean
ag
e
Ag
ein
g i
nd
ex:
65/0
-14 *
100
Ageing index Mean age

Ageing index and mean age also show the ageing process of the population (Figure 69). The ageing
index, that is the proportion of the elderly (65+ years old) compared to children (0-14 years old) rises
from 144 percent to 200 percent during the period between 2013 and 2025. This means that the
number of persons 65 years old or older living in Pécs in 2025 is two times higher than the number of
persons younger than 15 years living there. The ageing index of Pécs is much higher than the national
average.
In accordance with previous findings, mean age is also relatively high in Pécs: the mean age is 42.1
years in 2013 and it increases to 44.5 years in 2025; the rise is about 2.5 years. The mean age in Pécs
is one year higher than the national average.
8. Comparison of Hungary and the Slovak republic with concluding remarks
There are many similarities as compared the assumptions and results of the forecasts at national
level. Both forecasts predict the slight increase of the total fertility in medium scenario. The
Hungarian forecast is slightly less optimistic in medium scenario as well as in high and low ones.
However, the difference is not remarkable when compared to the Slovak Republic. In any case,
neither one of the compared populations is expected to reach replacement level of fertility.
Therefore fertility will contribute to the depopulation as the first of three major factors identified in
this paper.
The second major factor shall be derived from the expected results of increasing life expectancy. This
causes and will continue to influence the process of ageing at the top of the age pyramid in future.
Both forecasting assumptions are optimistic in case of mortality, and the increasing trend seems to
be irreversible. Difference between females, when comparing the two countries at a regional level,
are slight and less significant. Differences are substantial when we get into the comparison of male
populations. The current situation in Hungary in case of males is worse than in case of male mortality
in Slovakia.
Finally, the third factor, referred to as rapid ageing, is caused in both populations by the age-
structural momentum. As for migration, the Hungarian assumption seems to be less optimistic. The
low scenario tells about zero-net migration whereas the medium and high ones are at those levels as
in the Slovak Republic (being a lesser population). The migration affects the future population
numbers in a distinct way. Except the low scenario for Slovakia, all scenarios presuppose population
loss with an ascending tendency towards the time-horizon of the forecasts. The population decline is
stronger in case of Hungary. The natural decline will be too strong to be replaced by the anticipated
migration surplus. In addition, both populations will face a rapid population ageing. In case of the

Slovak Republic, in 2060 the mean age will approach the level of 50 years, making its population one
of the oldest ones in Europe. There is a strong effect of the age-structural momentum. This means
that the big cohorts born in 1970s will be replaced by the small cohorts of the post-communist
transformation period.
Several aspects of migration are important for the investigation of population changes. This is the
reason why a number of alternative migration-related scenarios have been prepared. The zero-
migration scenario for instance shows what population trajectory (population size) would take place
if migration surplus is absent. In addition, since Slovakia has a more optimistically designed medium
scenario, the difference between medium and zero-migration scenarios is higher in the case of
Slovakia than in the Hungarian case.
The replacement migration demonstrates another aspect of migratory influence on population
change. It is expected in both countries that eventually several thousands of migrants will be needed
to avoid a negative population change. The upward trend of the “replaced” immigrants is more
dramatic in case of Slovakia, since the population decrease will gain velocity towards the time
horizon in medium scenario.
The real migration scenario is perhaps the most relevant output of this analysis. Even though it lacks
forecasting features, it generates valuable information for the construction of assumptions. The
analysis shows beyond doubt that there is undocumented migration in vital statistics of Hungary and
Slovakia, as well as in most European countries. This is well known in European institutions and
research bodies. In the presented analysis we made a shift from “just claiming inaccuracy due to
undocumented migration” to “finding the most accurate figures under the circumstances”. An
estimation, elaborated with a high degree of precision shows, that the “real” migration is significantly
lower in both countries. We expected this result in spite of the fact that estimation of concrete
figures using the precise methodology was executed in both countries for the first time.
Nevertheless, there is a need for further methodological developments in this field.
Regional forecasts produced also interesting results. Although the proposed time-horizon is closer
due to a higher degree of uncertainty in the sub-national forecasting process, the information is very
important for the local and regional strategies. The results demonstrate that the regional
heterogeneity of demographical processes (including migration) is substantial in both countries.
Migration plays the important role in shaping current and future population change, especially the
increase/decrease of population. Besides the quantitative aspect, there is a need for discussion of
the qualitative aspects and these can be subsequently incorporated it into the forecasting
assumptions.

Forecasting case studies for the cities of Pecs and Turčianske Teplice demonstrate the way to make
forecasts at local levels at a minimal standard. The results show that the natural decrease and
population ageing is a characteristic feature of the population development also at local level. Like at
national level, decrease could be reduced by immigration, yet, the population ageing remains
irreversible. Finally, demo-geographical approaches might prove useful for making analyses and
predictions on future population changes in cities and towns. Many stochastic “micro-level” factors
can affect the population trajectories, therefore comprehensive multidisciplinary approach might be
needed, especially in case of migratory predictions.

Bibliography
Bahna, M., 2008. Preditions of Migration from the new member states after their accession into the
European Union: Successes and Failures. International Migration Review, 42, pp. 844-860
Bleha, B., 2006. Terminologické špecifiká a vybrané teoretické otázky regionálneho populačného
prognózovania. Geografický časopis, 58, 1, pp. 61 -71. (Terminological particularities and some
theoretical problems of regional population forecasting).
Bleha, B., 2007. Niečo k presnosti populačných prognóz SR a ČR. Towards accuracy of population
forecasts in the Czech and Slovak republic. Demografie, Supplement, 49, pp. 152-166.
Castles, S., Vezzoli, S. 2009. The global economic crisis and migration: temporary interruption or
structural change? Paradigmes, 2, pp. 68-75
Coleman, D. A., 2003. Demographic, Economic and Social Consequences of UK Migration. Pp. 9–40 in
H. Disney (ed.). Work in Progress: Migration, Integration and the European Labour Market London:
Institute for the Study of Civil Society
Divinský, B., 2005. Zahraničná migrácia v Slovenskej republike. Stavy, trendy, spoločenské súvislosti.
Friedrich Ebert Stiftung, Bratislava.
Divinský, B. 2007. Labor market – migration nexus in Slovakia: time to act in a comprehensive way.
IOM, Bratislava.
Gödri Irén – Soltész Béla – Bodacz-Nagy Boróka (2013): Dynamic Historical Analysis of Longer Term
Migratory, Labour Market and Human Capital Processes in Hungary. A country report developed
within the project ‘SEEMIG Managing Migration and Its Effects – Transnational Actions Towards
Evidence Based Strategies’.
Jurčová, D., et al., 2010. Populačný vývoj v okresoch Slovenskej republiky. Bratislava, Infostat.
Keilman, N., 1990. Uncertainty in National Population Forecasting. Working Paper, NIDI. The Hague.
Keilman, N., 1997. Ex – post errors in official population forecasts in industrialized countries. Journal
of Official Statistics, 13, pp. 245 –277.
Keyfitz, N. 1981. The limits of population forecasting. Population and Development Review, 7, pp.
579 – 593.

Koehler, J.,et al., 2010. Migration and the economic crisis in the European Union: Implications for
policy. IOM. Luxembourg.
Korec, P., Ondoš, S. (2006). Less developed regions in Slovakia: Identification and Characteristics.
Acta Geographica, 46, pp. 55-74.
Lutz, W., Scherbov, S., 2003. Can Immigration Compensate for Europe’s Low Fertility? Vienna: Vienna
Institute of demography, 2003. 16 p.
Makay, Zsuzsanna, 2009, A franciaországi családpolitika és a magas termékenység összefüggése.
(Connection Between family policy and high fertility in France.) Demográfia, 2009/4, p. 313-348.
Martin, P.,2009. Recession and migration: A new era for labour migration? International Migration
Review, 43, pp. 671- 691.
Mládek, J., et al., 2006. Population Atlas of Slovakia. Comenius University, Bratislava.
Papademetriou, G. D., et al., 2010. Migration and Immigrants two years after the financial collapse:
Where do we stand? Washington: Migration Policy Institute.
Spéder, Zs., Kapitány B., 2007, Gyermekek: Vágyak és tények. Dinamikus termékenységi elemzések.
(Children: Fretility intentions and facts. Dynamic fertility analyses.) Műhelytanulmányok 6. KSH
Népességtudományi Kutatóintézet
Statistics New Zealand, (2008): How Accurate are Population Projections? An evaluation of Statistics
New Zealand population projections, 1991–2006. Wellington: Statistics New Zealand
Philipov, D., Dorbritz, J. (2003). Demographic consequences of economic transition in countries of
central and eastern Europe. Strasbourg: Council of Europe Publishing.
Potančoková, M., Vaňo, B., Pilinská, V., Jurčová, D., 2009. Slovakia: Fertility between tradition and
modernity. Demographic Research. Vol. 19., DOI: 10.4054/DemRes.2008.19.25
Smith, S., Tayman, J., Swanson, D., 2001. State and Local Population Projections: Methodology and
Analysis. Kluwer Academic publishers.
UN Population Division, 2000. Replacement Migration: Is it a Solution to Declining and Ageing
Populations? 2000. New York.