Embed Size (px)
Citation preview

Seediscussions,stats,andauthorprofilesforthispublicationat:http://www.researchgate.net/publication/273068189
PopulationstructureanddispersalofthecoralexcavatingspongeClionadelitrix
ARTICLEinMOLECULARECOLOGY·MARCH2015
ImpactFactor:5.84·DOI:10.1111/mec.13134
DOWNLOADS
27
VIEWS
38
4AUTHORS,INCLUDING:
AndiaChaves-Fonnegra
NovaSoutheasternUniversity
10PUBLICATIONS51CITATIONS
SEEPROFILE
JesseSecord
NovaSoutheasternUniversity
1PUBLICATION0CITATIONS
SEEPROFILE
JoseVLopez
NovaSoutheasternUniversity
42PUBLICATIONS1,303CITATIONS
SEEPROFILE
Availablefrom:AndiaChaves-Fonnegra
Retrievedon:23July2015

Population structure and dispersal of the coral-excavating sponge Cliona delitrix
ANDIA CHAVES-FONNEGRA,* KEVIN A. FELDHEIM,† JESSE SECORD* and JOSE V. LOPEZ*
*Nova Southeastern University, Oceanographic Center, 8000 North Ocean Drive, Dania Beach, FL 33004, USA, †PritzkerLaboratory for Molecular Systematics and Evolution, Field Museum of Natural History, 1400 S Lake Shore Drive, Chicago, IL
60605, USA
Abstract
Some excavating sponges of the genus Cliona compete with live reef corals, often kill-
ing and bioeroding entire colonies. Important aspects affecting distribution of these
species, such as dispersal capability and population structure, remain largely
unknown. Thus, the aim of this study was to determine levels of genetic connectivity
and dispersal of Cliona delitrix across the Greater Caribbean (Caribbean Sea, Bahamas
and Florida), to understand current patterns and possible future trends in their distri-
bution and effects on coral reefs. Using ten species-specific microsatellite markers, we
found high levels of genetic differentiation between six genetically distinct popula-
tions: one in the Atlantic (Florida-Bahamas), one specific to Florida and four in the
South Caribbean Sea. In Florida, two independent breeding populations are likely
separated by depth. Gene flow and ecological dispersal occur among other popula-
tions in the Florida reef tract, and between some Florida locations and the Bahamas.
Similarly, gene flow occurs between populations in the South Caribbean Sea, but
appears restricted between the Caribbean Sea and the Atlantic (Florida-Bahamas).
Dispersal of C. delitrix was farther than expected for a marine sponge and favoured
in areas where currents are strong enough to transport sponge eggs or larvae over
longer distances. Our results support the influence of ocean current patterns on
genetic connectivity, and constitute a baseline to monitor future C. delitrix trends
under climate change.
Keywords: Caribbean Sea, connectivity, coral death, marine sponge, population genetics
Received 7 October 2014; revision received 13 February 2015; accepted 20 February 2015
Introduction
Sponges are the dominant habitat-forming animals in
Caribbean coral reefs (Pawlik 2011). Their diversity is
higher than all coral groups combined, and their bio-
mass (weight, volume) can exceed corals and algae
(R€utzler 1978; D�ıaz & R€utzler 2001). The increase in
sponges over corals in Caribbean reefs is attributed to
factors such as pollution, overfishing and coral mortal-
ity (Ward-Paige et al. 2005; Chaves-Fonnegra 2014; Loh
& Pawlik 2014). Some sponge species have become
abundant in areas where sewage pollution occurs (Rose
& Risk 1985; Holmes 1997; Ward-Paige et al. 2005).
Simultaneously, overfishing has removed sponge preda-
tors, which can increase the competition for space
between faster-growing palatable sponges and reef-
building corals (Loh & Pawlik 2014). Higher coral mor-
tality has also opened more habitat for sponge larvae to
attach to dead coral skeletons (Chaves-Fonnegra 2014).
Many sponges have successful survival strategies to
compete for space and modify coral reefs through bioe-
rosion (R€utzler 1975; D�ıaz & R€utzler 2001; Chaves-Fon-
negra & Zea 2007), calcification or cementation (Wulff
& Buss 1979; Wulff 1984). Coral-excavating sponges can
bioerode entire coral colonies through chemical and
physical mechanisms (Pomponi 1979; Zundelevich et al.
2007), and they can increase their boring rates at lower
pH (Wisshak et al. 2012; Stubler et al. 2014) and grow
faster in warmer temperatures (Cort�es et al. 1984;Correspondence: Andia Chaves-Fonnegra, Fax: 954 262 4098;
E-mail: [email protected]
© 2015 John Wiley & Sons Ltd
Molecular Ecology (2015) 24, 1447–1466 doi: 10.1111/mec.13134

R€utzler 2002), abilities that may favour them during cli-
mate change scenarios (Carballo et al. 2013). These
sponges have become more abundant during the past
few decades in the Caribbean Sea and Florida (L�opez-
Victoria & Zea 2004; Ward-Paige et al. 2005; Chaves-
Fonnegra et al. 2007). Specifically, Cliona delitrix is one
of the most destructive species, with its ability to kill
coral tissue (Chaves-Fonnegra & Zea 2007) and excavate
10–12 cm inside coral skeletons, spreading laterally at
mean rates of ~1.5 cm/year (Chaves-Fonnegra & Zea
2011). This species, currently, is one of the most con-
spicuous in the Florida Keys as well as in other areas in
the Caribbean Sea (Rose & Risk 1985; Ward-Paige et al.
2005; Chaves-Fonnegra et al. 2007).
Understanding population dynamics of marine
sponges will be vital to potentially predict future
changes at a reef level, especially for excavating
sponges, which can have a strong impact on reef-build-
ing corals. Important aspects affecting excavating
sponges’ distribution, such as dispersal capability and
population genetics structure, remain largely unknown.
The only population genetics study on excavating
sponges estimates that the dispersal distance of C. deli-
trix reaches beyond 10–100 m and appeared to be sex-
ual through larvae, rather than asexually through
fragmentation or clonality (Zilberberg et al. 2006). Sex-
ual reproduction for this species has recently been char-
acterized (Chaves-Fonnegra 2014).
A prevailing view is that Poriferan species exhibit
low dispersal; most larvae remain in the water column
for a short period of time, minutes to few days, and
usually <2 weeks (Bergquist & Sinclair 1968, 1973; Ilan
& Loya 1990; Meroz & Ilan 1995; Mariani et al. 2000;
Maldonado 2006). The larvae of Cliona sponges are
defined as clavablastula, as they develop from a hollow
embryo that later fills with maternal cells (Maldonado
& Bergquist 2002; Maldonado 2006), also with low dis-
persal (Mariani et al. 2000, 2006). Observations of Cliona
viridis indicate that its larvae are small (300 lm length
9 100 lm width) and weak swimmers that can stay in
the water column for less than 10 days (Mariani et al.
2000, 2006). In the laboratory, and inside beakers, larvae
from C. celata can swim continuously on the surface for
only 20–30 h with no apparent reaction to daylight or
darkness; then, they start to move to the substrate for
approximately the same time they spend at surface,
until attaching (Warburton 1966).
Early population genetics studies in the phylum Po-
rifera used allozymes to determine phylogenetic- and
population-level differences in allele frequencies and
contributed to the discovery of cryptic species (Sol�e-
Cava & Thorpe 1986; Sara et al. 1988). Mitochondrial
DNA (mtDNA), specifically the commonly used Fol-
mer’s region 50 end of the COI gene (Folmer et al. 1994),
shows relatively low genetic variation within sponge
species (W€orheide et al. 2005), with exceptions (Duran
& R€utzler 2006; Debiasse et al. 2010). Other partitions of
the mtDNA are also useful for phylogeographic analy-
ses (Erpenbeck et al. 2006; Lopez-Legentil & Pawlik
2009; Rua et al. 2011).
Nuclear DNA microsatellite loci are more informative
and variable markers for population genetics of many
organisms, including marine sponges (W€orheide et al.
2005). Microsatellite loci have been identified in five
demosponge species, Halichondria panacea (Knowlton
et al. 2003), Crambe crambe (Duran et al. 2004), Scopalina
lophyropoda (Blanquer et al. 2005), Xestospongia muta
(Richards 2010) and Spongia officinalis (Dailianis et al.
2011), and one calcareous sponge, Paraleucilla magna
(Guardiola et al. 2012). These studies have been useful
for comparisons within the Mediterranean Sea (Dailian-
is et al. 2011; Guardiola et al. 2012), between Mediterra-
nean and Atlantic populations (Duran et al. 2004), and
also at a much finer scale, between populations sepa-
rated by only 10–50 m (Guardiola et al. 2012) and 25–100 m (Blanquer et al. 2009) and between individuals
separated 0–7 m from each other (Calder�on et al. 2007).
With evidence that excavating sponges continue to
increase in abundance on Caribbean coral reefs (Cort�es
et al. 1984; Rose & Risk 1985; R€utzler 2002; Ward-Paige
et al. 2005; Chaves-Fonnegra et al. 2007), our goal in this
study was to examine genetic connectivity and dis-
persal of Cliona delitrix across the Greater Caribbean
using microsatellite DNA markers.
Methods
Sample collection and DNA extraction
A total of 540 samples were collected from coral reefs
in 12 locations within the Great Caribbean (see Table 1,
Fig. 1). Maximum depth of all locations was obtained
in situ (Table 1), and shorter distance to the coast of the
seven sampling locations in Florida (USA) was mea-
sured in Google Earth (http://www.google.com/intl/
en_uk/earth/) using sites coordinates (see Appendix
S1, Supporting information). All samples were placed
in 15-mL falcon tubes and preserved in 95% ethanol at
�20 °C; three changes in 95% ethanol after 1 h, 24 h
and 3 days were made to eliminate some secondary
metabolites before DNA extractions, following PORTOL
recommendations (https://www.portol.org/node/24).
Genomic DNA was extracted from 50 mg of Cliona deli-
trix tissue (mostly from oscula to avoid calcium carbon-
ate) using the DNeasy Tissue Kit (Qiagen Inc.). During
the incubation step with proteinase K, samples were
agitated for 12 h at 60 °C at 150 rpm in a Sheldon VWR
1575 Incubator. One modification to the kit was made:
© 2015 John Wiley & Sons Ltd
1448 A. CHAVES- FONNEGRA ET AL.
after incubation in proteinase K, instead of vortexing
the sample (tissue + calcium carbonate + spicules), we
only took the supernatant from each sample, avoiding
mixing with any residue at the bottom of tubes. This
eliminated spicules and calcium carbonate that could
clog the filter columns in subsequent steps.
De novo development of Cliona delitrix-specificmicrosatellite markers
Genomic DNA (gDNA) from one individual (originally
from Carry Bow Cay, Belize) was used to isolate micro-
satellites markers using the protocol of Glenn & Schable
(2005). The gDNA was digested using RsaI and XmnI
restriction enzymes, and following digestion, the Super-
SNX24 linkers were ligated onto the ends of gDNA
fragments. These linkers are sites for primers in subse-
quent polymerase chain reactions (PCRs). To obtain
fragments of gDNA enriched with microsatellite
sequences, we hybridized twelve biotinylated probes to
the cut gDNA in three separate reactions: one (ACAT8,
AAGT8, AAAT8, AGAT8, AACT8), two (TG12, AG12)
and three (ACTC6, ACAG6, AAAC6, AAAG8 and
ACCT6). The gDNA–biotinylated probe complex was
added to magnetic beads coated with streptavidin (Invi-
trogen). This complex was washed with two hybridiza-
tion buffers, twice with 12 X saline–sodium citrate
(SSC) + 0.2% sodium dodecyl sulphate (SDS), and four
times with 6 X SSC + 0.1% SDS incubating at 53 °C for
1 min each for the final two washes. The probe–DNA
complex was denaturated at 95 °C, and the resultant
enriched fragments were precipitated with 3 M sodium
acetate and 95% ethanol.
To increase the amount of enriched fragments, a
‘recovery’ PCR was performed in a 25 lL reaction con-
taining 1X PCR buffer (10 mM Tris-HCl, 50 mM KCl, pH
8.3), 1.5 mM MgCl2, 2.5 lL of 10X bovine serum albu-
min (BSA), 0.16 mM of each dNTP, 10X BSA, 0.52 mM of
the SuperSNX24 forward primer, 1 U Taq DNA poly-
merase and approximately 25 ng enriched gDNA frag-
ments. Thermal cycling was performed in a Bio-Rad
DYAD, as follows: 95 °C for 2 min; followed by 25
cycles of 95 °C for 20 s, 60 °C for 20 s and 72 °C for
90 s; and a final elongation step of 72 °C for 30 min.
PCR products were inserted into vectors using the
TOPO-TA Cloning�kit (Invitrogen), and vectors were
incorporated into Escherichia coli competent cells and
incubated overnight at 37 °C on ampicillin LB Agar
plates. Bacterial colonies containing a recombinant vec-
tor (i.e. white colonies) were isolated, and their gDNA
inserts were amplified in a 25 lL PCR containing 1 X
PCR buffer (10 mM Tris-HCl, 50 mM KCl, pH 8.3),
1.5 mM MgCl2, 0.12 mM of each dNTP, 10 X BSA,
0.25 mM of the M13 primers and 1 U Taq DNA poly-
merase. Thermal cycling conditions were 95 °C for
7 min, followed by 35 cycles of 95 °C for 20 s, 50 °C for
20 s and 72 °C for 90 s. Resulting PCR products were
cleaned with ExoSAP-IT (Affymetrix, Inc., Santa Clara,
Florida, USA
Atlantic Ocean
80°0´00
BH 42
DB 25
DT 27
FTL 46
MIA 19
CUZ 8COL 63
BT 41
LK 39
KL 40
MK 25
Aves Ridge 70 cm s–1
60 cm s–1
70 cm s–1
40 cm · s–1
Florida straits
Tortugas Gyre
Caribbean Sea
Gulf of Mexico
BEZ 60
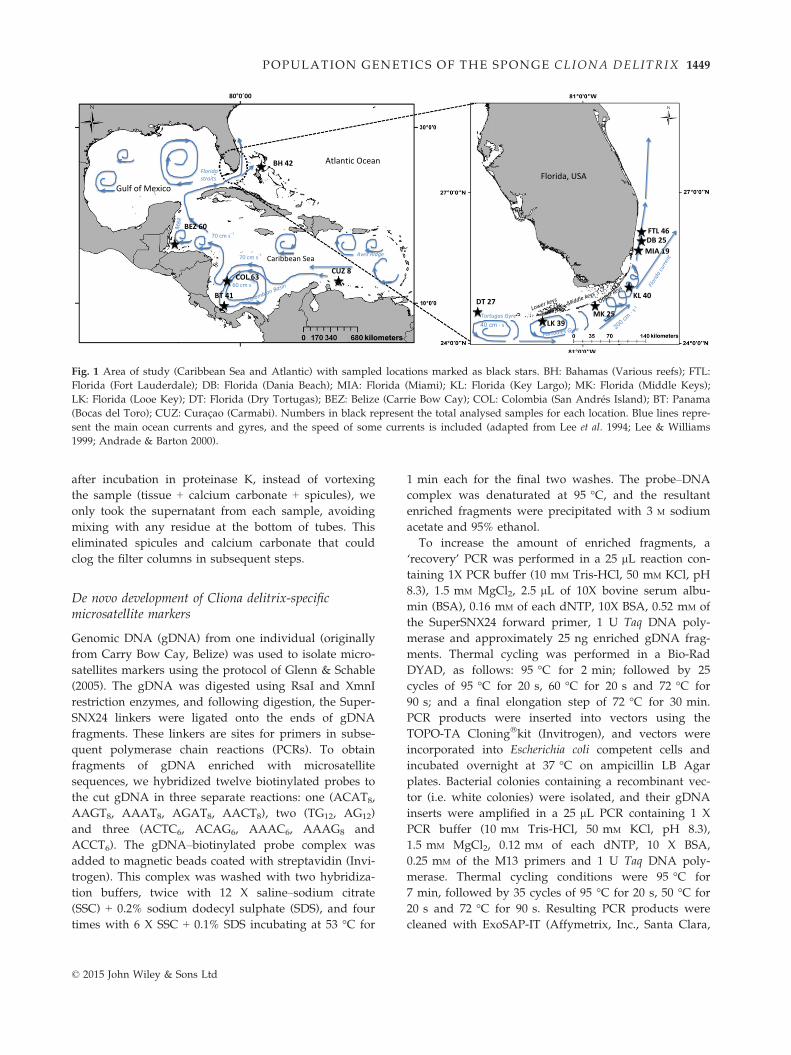
Fig. 1 Area of study (Caribbean Sea and Atlantic) with sampled locations marked as black stars. BH: Bahamas (Various reefs); FTL:
Florida (Fort Lauderdale); DB: Florida (Dania Beach); MIA: Florida (Miami); KL: Florida (Key Largo); MK: Florida (Middle Keys);
LK: Florida (Looe Key); DT: Florida (Dry Tortugas); BEZ: Belize (Carrie Bow Cay); COL: Colombia (San Andr�es Island); BT: Panama
(Bocas del Toro); CUZ: Curac�ao (Carmabi). Numbers in black represent the total analysed samples for each location. Blue lines repre-
sent the main ocean currents and gyres, and the speed of some currents is included (adapted from Lee et al. 1994; Lee & Williams
1999; Andrade & Barton 2000).
© 2015 John Wiley & Sons Ltd
POPULATION GENETICS OF THE SPONGE CLIONA DELITRIX 1449
Table
1Number
(n)ofClionadelitrix
samplescollected,am
plified
andan
alysedfrom
theGreater
Caribbean(includingCaribbeanSea,Bah
amas
andFlorida).Morph–external
morphologyofthesp
onges
when
comparingindividualsofsimilar
size;Collect–totalnumber
ofsamplescollectedin
each
specificgeo
graphic
area;Amp–totalnumber
ofsam-
plesam
plified
atleastwithseven
ofthe10
microsatellites;Analys–totalnumber
ofsamplesan
alysedafterelim
inatingclones
Geo
graphic
region
Location
Specificarea
Morph
Lab
el
Dep
th
(m)
Distance
tocoast
(km)
Collect
Amp
Analys
Atlan
ticOcean
Bah
amas
Variousareas(Bim
ini,Cat
Cay
s,
New
Providen
ce,LittleSan
Salvad
or,
San
Salvad
or,Inag
uas)
B,C
BH
4–18
82.2–605.8
4643
42
Atlan
ticOcean
Florida
Fort
Lau
derdale(shallow
reef)
AFTL
80.5
5448
46
Atlan
ticOcean
Florida
Dan
iaBeach
(shallow
reef)
ADB
91.4
3130
25
Atlan
ticOcean
Florida
Miami(shallow
reef)
AMIA
61.5
1919
19
Atlan
ticOcean
Florida
Key
Largo(N
orthofNorthDry
Rocks–Conch
Wall)
AKL
10–20
7.2
5047
40
Atlan
ticOcean
Florida
Middle
Key
s(M
arathonThor
patch
–LongKey
footmoundreef)
AMK
83.4
3130
25
Atlan
ticOcean
Florida
LooeKey
(East,outsidesanctuary)
ALK
118.2
5341
39
Atlan
ticOcean
Florida
Dry
Tortugas
(Texas
Rock
–8Fathom
–TheMaze)
ADT
14–22
121
3433
27
SouthwestCaribbean
Belize
CarrieBow
Cay
(Patch
andfore
reefs)
BBEZ
8–25
—77
7260
SouthwestCaribbean
Colombia
San
AndresIsland(W
ildlife)
BCOL
1–9
—70
7063
SouthwestCaribbean
Pan
ama
Bocasdel
Toro
(Punta
Caracol,Adrian
as)
BBT
6–10
—65
5441
Southeast
Caribbean
Curac �ao
Reefin
frontCarmab
iResearchStation
B,C
CUZ
5–15
—10
88
Total
540
495
435
A:en
crustinggrowth
form
,osculestendto
betaller
than
wider
andreddish;B:en
crustinggrowth
form
,osculestendto
bewider
than
taller
andyellowishwithinternal
divi-
sions;
C:pap
illatedgrowth
form
,sm
allerosculestendto
beyellow.
© 2015 John Wiley & Sons Ltd
1450 A. CHAVES- FONNEGRA ET AL.

CA, USA) and sequenced using the BigDye� TERMINATOR
v3.1 Cycle Sequencing Kit (Applied Biosystems).
Sequencing reactions were precipitated with ethanol
and 125 mM EDTA, and run on an ABI 3730 DNA Ana-
lyzer (Applied Biosystems).
Primers pairs were developed for 32 core microsatel-
lites repeats using PRIMER 3 v.4.0. on the Web (Kore-
ssaar & Remm 2007; Untergrasser et al. 2012). Ten of
these loci amplified reliably and showed evidence of
polymorphism. These loci were used to genotype 495
individuals of the coral-excavating sponge Cliona deli-
trix, and their cross-amplification utility was examined
with eight individuals of C. laticavicola. Amplification
of microsatellites was performed in total PCR volumes
of 25 lL. Two of the ten loci amplified better with
Promega Hot Start enzyme, and the other eight with
Qiagen Hot Start enzyme (Table S1, Supporting infor-
mation). The PCR with Promega enzyme contained
5 lL of 5X PCR buffer, 3 lL of 25 mM MgCl2, 1.2 lLof 10 mM dNTPs mix, 1 lL of 10 lM fluorescently
labelled universal M13 primer (50-TGTAAAACGACGGCCAGT-30) (Schuelke 2000), 0.5 lLof 10 lM species-specific forward primer with a 50 M13
tail (Schuelke 2000), 1 lL of the 10 lM reverse species-
specific primer, 8.05 lL of dH2O, 5 lL of DNA tem-
plate (0.1–2 ng/lL which was diluted from stock
gDNA; 1:100 or 1:1000) and 0.125 lL of 5U Hot Start
Taq DNA Polymerase (Promega). The Qiagen PCR
contained 2.5 lL of 10X PCR buffer, 1.5 lL of 25 mM
MgCl2, 1.2 lL of 10 mM dNTPs mix, 1 lL of 10 lM flu-
orescently labelled universal M13 primer (50-TGTAAAACGACGGCCAGT-30) (Schuelke 2000), 0.5 lLof 10 lM species-specific forward primer attached with
a 50 M13 tail (Schuelke 2000), 1 lL of the 10 lMreverse species-specific primer, 12.175 lL of dH2O,
5 lL of DNA template (0.1–2 ng/lL which was
diluted from stock gDNA) and 0.125 lL of 2.5U Hot
Start Taq DNA Polymerase (Qiagen). PCR was per-
formed in a gradient thermal cycler (Bio-RadC1000) as
follows, for Promega: 94 °C for 4 min; followed by 30
cycles of 94 °C for 15 s, 15 s at the primer annealing
temperature (Table S1, Supporting information) and
72 °C for 45 s; followed by eight cycles of 94 °C for
15 s, 53 °C for 15 s and 72 °C for 45 s; and a final
elongation step of 72 °C for 10 min. For Qiagen: 95 °Cfor 5 min; followed by 34 cycles of 94 °C for 1 min,
30 s at the primer annealing temperature (Table S1,
Supporting information) and 72 °C for 1 min; and a
final elongation step of 72 °C for 10 min. Products
were visualized on a 3730 DNA Analyzer (Applied
Biosystems). Alleles were sized using the internal stan-
dard GeneScan 500 LIZ (Applied Biosystems), and
electropherograms were analysed using GENEMAPPER
version 3.7 (Applied Biosystems).
Summary statistics
Number of alleles, FIS, FST and levels of observed (HO)
and expected (HE) heterozygosity across microsatellite
loci were obtained with the Microsatellite toolkit (Park
2001) and FSTAT 2.9.3.2 (Goudet 1995). Tests for linkage
equilibrium (LE) and deviations from Hardy–Weinberg
(HWE) for each locus and location were estimated
using unbiased exact tests (Markov chain method) with
10 000 dememorizations, 1000 batches and 10 000 itera-
tions per batch (Guo & Thompson 1992), as imple-
mented in GENEPOP v.4.2 on the Web (Raymond &
Rousset 1995b; Rousset 2008). Significance levels (≤0.05)were adjusted using the sequential Bonferroni correc-
tion for multiple pairwise testing (Rice 1989). The link-
age disequilibrium correlation coefficient (rLD) was
calculated in LinkDos on the Web program (Garnier-
Gere & Dillmann 1992) as an index to decide whether
loci should be included in the Bayesian Analysis in
STRUCTURE (Kaeuffer et al. 2007).
The number of private alleles per population was esti-
mated using GENALEX 6.5 (Peakall & Smouse 2012). The
frequency of null alleles was estimated using the expecta-
tion maximization (EM) algorithm (Dempster et al. 1977)
as implemented in FREENA (Chapuis & Estoup 2007).
Considering that null alleles have the potential to
increase FST values (Chapuis & Estoup 2007), the locus
with highest null allele frequency was systematically
removed from the data set, and then, the standard FST,
corrected FST for null alleles, FIS and mean of null allele
frequencies per locus (10 to 1) were recalculated and
compared.
Population differentiation
Four different statistical tests were performed to test for
population differentiation: pairwise Fisher’s exact (popu-
lation level), multivariate statistical analysis (population
and individual levels), Bayesian algorithm (individual
level) and iterative reallocation method (individual
level). We determined the number of populations based
on concordance between tests. Analyses at the individual
level were performed with all the sampled locations in
the Greater Caribbean, only Atlantic locations (Florida
and Bahamas) and only South Caribbean locations
(Belize, Colombia, Panam�a and Curac�ao). To be conser-
vative with our estimates of differentiation, we ran the
analyses that assume linkage equilibrium as a priori
information (Fisher’s exact test and Bayesian algorithm)
with and without linked loci. Multivariate analysis and
iterative reallocation statistical tests were run with all
loci, as both methods do not assume linkage equilibrium.
Pairwise Fisher’s exact test – population level. To evaluate
population differentiation, Fisher’s exact tests (Raymond
© 2015 John Wiley & Sons Ltd
POPULATION GENETICS OF THE SPONGE CLIONA DELITRIX 1451
& Rousset 1995a) were performed as implemented in
FSTAT version 2.9.3.2 (Goudet 1995). This test uses the
sampling location as a priori and was performed not
assuming HWE within samples, set for 1000 permuta-
tions, and with a = 0.05 as a baseline to make the Bonfer-
roni correction, following the ad hoc procedure proposed
by Waples & Gaggiotti (2006). To test the possible effect
that linked loci could have on population differentiation,
the linked loci were removed and the analyses were
repeated.
Multivariate statistical analysis – population and individual
levels. A principal coordinates analysis (PCoA) was con-
ducted at both population and individual levels using
the GENALEX 6. Software (Peakall & Smouse 2006). PCoA
is a multivariate statistical analysis that uses summa-
rized genetic distances between individual multilocus
genotypes to cluster individuals relative to each other
in a multidimensional space, without the assumptions
of HWE and LE. For the PCoA, two types of genetic
distance matrices were calculated: a pairwise, individ-
ual-by-individual (N 9 N) matrix and a population-
level pairwise FST matrix. Also, a geographic distance
matrix was calculated based on the GPS coordinates
after conversion to decimal degrees. Both genetic and
geographic matrices were used to perform the PCoA.
Bayesian algorithm – individual level. To determine the
most likely number of genetically discrete populations
[Ln Pr (X|K)], we used the Bayesian algorithm as imple-
mented in STRUCTURE v2.31 (Pritchard et al. 2000). Two dif-
ferent admixture models were used, one without a priori
sampling location information (admixture) and one
including the sampling location for each individual
(admixture + locprior) (Hubisz et al. 2009). These two
models were run with 10 and six microsatellites (after
eliminating linked loci), and the parameters included
200 000 burn-in iterations, in ten replicate sets, followed
by 200 000 Markov chain Monte Carlo (MCMC) repeti-
tions. The number of genetically homologous groups (K)
was determined using the ad hoc statistics DK (Evanno
et al. 2005) implemented in STRUCTURE HARVESTER (Earl &
vonHoldt 2012) and visualized using CLUMPP (Jakobsson
& Rosenberg 2007) and DISTRUCT (Rosenberg 2004). STRUC-
TURE was first run with the total data set (435 individuals)
and K = 1–20 to determine strong trends for population
subdivision at the Greater Caribbean level and then,
based on initial results, only with the genotypes corre-
sponding to Florida–Bahamas (263 individuals, K = 1–15) and South Caribbean (172 individuals, K = 1–10).
Iterative reallocation method – individual level. We also
used the iterative reallocation method of Paetkau (Pae-
tkau et al. 1995), which uses multilocus maximum likeli-
hood and the ‘leave-one-out’ procedure implemented in
FLOCK 3.1. (Duchesne & Turgeon 2012). This method is
performed with sampling location information, but does
not make use of HWE or LE as a priori information
(Duchesne & Turgeon 2012). The partition of the sam-
pled specimens was done in a random mode, with 20
iterations and 50 runs for each k (clusters) assessed
(k = 2–10) for allocations at the Greater Caribbean, and
based on initial results, we repeated the analysis includ-
ing only individuals for Bahamas–Florida and only for
South Caribbean Sea. The stopping and estimation rules
were used to determine the number of clusters (K) fol-
lowing Duchesne & Turgeon (2012).
Dispersal patterns
Genetic isolation by geographic distance – population
level. Isolation by geographic distance was evaluated
(using both linked and unlinked loci) between the pair-
wise FST/(1–FST) values and the logarithm of the geo-
graphic distances (latitude/longitude in decimal
degrees) between locations (Rousset 1997). The variation
of FST/(1–FST) with distance was used as it gives the
most easily interpretable information (see Rousset
1997). To test for significant correlation, a Mantel test
with 9999 permutations was used as implemented in
GENALEX 6.5. (Peakall & Smouse 2012). The test was per-
formed at the Greater Caribbean including all locations.
Then, considering results, at this level, we repeated the
test only for Florida and Bahamas and only for the
South Caribbean locations.
Detection of first-generation migrants – individual level. To
evaluate the extent of contemporary (ecological time-
scale) dispersal of Cliona delitrix among geographic loca-
tions, the number of first-generation immigrants into
each location was inferred using the Bayesian assign-
ment method by Rannala & Mountain (1997) imple-
mented in GENECLASS2 (Piry et al. 2004). This method
computes the probability that the multilocus genotype
of each individual will be encountered in a given popu-
lation and is a more appropriate test when population
differentiation is low and loci deviate from Hardy–Weinberg equilibrium (Rannala & Mountain 1997). For
the analysis, the database included only individuals that
amplified with all 10 loci (total: 348 individuals). Given
that this analysis assumes linkage equilibrium, we used
all 10 loci and also repeated the analysis using only 6
loci, after eliminating the linked ones. The statistical cri-
terion computed for likelihood estimation was Lhome, as
it was considered that some source populations for
immigrants were probably not sampled (Piry et al.
2004). For the probability of computation, we combined
the Monte Carlo resampling procedure of Paetkau et al.
© 2015 John Wiley & Sons Ltd
1452 A. CHAVES- FONNEGRA ET AL.

(2004) with the likelihood criteria of Rannala & Moun-
tain (1997) with 10 000 simulated individuals and
a = 0.01 and a = 0.05. Specifically for Cliona delitrix,
detachment of whole individuals rarely occurs (per-
sonal observation). Therefore, we consider that migrants
correspond to the dispersal of eggs or larvae.
Results
De novo development of Cliona delitrix microsatellitemarkers
Of 32 loci we tested, 22 did not amplify or showed an
excess of peaks in electropherograms, making them dif-
ficult to genotype. Ten final primers (Table S1, Support-
ing information) yielded scorable peaks and were used
to genotype 495 individuals. These loci were also useful
for cross-amplification in Cliona laticavicola (Table S2,
Supporting information).
Summary statistics
From a total of 495 individuals of Cliona delitrix geno-
typed, 60 were found to have identical genotypes
(potential clones) and were eliminated from population
genetics estimators. The total number of alleles per
locus ranged from 5 to 78 (Table S5, Supporting infor-
mation), and the average alleles per population varied
from 5.4 (Curac�ao) to 16.3 (Bahamas). Private alleles
were present in all studied locations. South Caribbean
locations and Bahamas had a greater number (11–36)and higher average frequencies (3.0–14.2%) of private
alleles, than any of the Florida locations (1–8 private
alleles with average allele frequencies between 1.4%
and 2.6%), except for Dania Beach which had only two
private alleles with an average frequency of 5.2%.
Four of the 10 loci (Cd14, Cd81, Cd114 and Cd137)
showed linkage disequilibrium (LD) in a global analy-
sis. However, linkage between pairs of loci was not con-
sistent across all populations (see Table S3, Supporting
information). Thus, the population genetics analyses
that assume no LD (Pairwise Fisher’s exact test, Bayes-
ian algorithm) were performed with both 10 and 6 loci,
after eliminating the four linked loci. The rLD was lower
than 0.5 between all loci pairs in which the analysis
was possible at a global level suggesting all the loci
could be used in the Bayesian cluster analysis (see
Table S4, Supporting information) (Kaeuffer et al. 2007).
Inbreeding coefficient (FIS) values per population
were positive and significant (P < 0.00042), except for
Curac�ao. FIS in Belize was positive, but not significant
after Bonferroni correction. This indicates a heterozy-
gote deficit in most locations (Table S5, Supporting
information), suggesting nonrandom mating between
individuals. The exact test for HWE confirmed these
results by showing significant deviations in each loca-
tion, except Curac�ao (Table S5, Supporting information).
The average frequency of null alleles for each locus ran-
ged from 0.033 to 0.122 and for each population ranged
from 0.022 to 0.089 (Table S5, Supporting information).
The FST corrected values were slightly lower than the
standard FST values, and the difference between both
parameters fluctuated between 0.004 and 0.008. FIS val-
ues were higher when null allele frequency was higher
(using all 10 loci) and decreased when loci with higher
null allele frequency were removed. However, the stan-
dard FST and corrected FST values remained relatively
stable until a fifth locus (Cd23) was removed. Then, a
decrease of 0.054 units occurred, and both values con-
tinued decreasing until all loci, except one, were
removed.
Population genetic structure of Cliona delitrix
Pairwise Fisher’s exact test – population level. FST values
showed population structure between geographic loca-
tions. Using 10 loci, Florida locations (Fort Lauderdale,
Dania Beach, Miami, Key Largo, Middle Keys, Looe
Key and Dry Tortugas) were genetically different from
South Caribbean locations (Belize, Colombia and Pa-
nam�a) (P < 0.05; Table 2). However, Curacao was not
different from the Middle Keys location in Florida
(P = 0.2056), and Bahamas was divergent to all Florida
and South Caribbean locations. Inside Florida, genetic
similarity was found among Dry Tortugas, Looe Key
and Key Largo, and between Looe Key and Dania
Beach, Dania Beach and Fort Lauderdale, Fort Lauder-
dale and Miami, and Miami and the Middle Keys
(Table 2). When the four linked loci were removed, sim-
ilar results than with 10 loci were obtained, with only
two exceptions: Fort Lauderdale was genetically differ-
ent from Dania Beach (P = 0.0616), but Dania Beach
was similar to the Middle Keys (P = 0.0545; see
Table 2).
Multivariate statistical analysis – population and individual
levels. The PCoA analysis suggested four genetic groups
in the total microsatellite data set: (i) Atlantic, (ii) Flor-
ida, (iii) South Caribbean and (iv) Curac�ao (Fig. 2). Axis
1 explained 30.9% of the variation found in the distance
matrix, whereas axis 2 and axis 3 explained 27.3% and
16.7%, respectively. Axis 1 separated the South Carib-
bean populations (Belize, Bocas del Toro, Colombia and
Curac�ao) from Atlantic (Bahamas, Key Largo, Looe
Key, Dry Tortugas). Axis 2 separated a second group of
Florida populations (Dania Beach, Fort Lauderdale,
Miami and Middle Keys) together with Curac�ao. Axis 3
separated Curac�ao from the rest of populations
© 2015 John Wiley & Sons Ltd
POPULATION GENETICS OF THE SPONGE CLIONA DELITRIX 1453
analysed (Fig. 2). Florida locations included in the
Atlantic cluster (Key Largo, Looe Key and Dry Tortu-
gas) corresponded to deeper (10–22 m depth) and far-
ther sites (7.2–121 km) from the coastline, whereas
locations in the Florida cluster (Fort Lauderdale, Miami
and Middle Keys) corresponded to shallow sites (6–8 m
depth) closer to the coastline (0.5–3.4 km; see Table 1).
Individual-based PCoA analyses at Greater Caribbean
level also separated the three main groups observed at
a population level: (i) Atlantic, (ii) Florida, and (iii)
South Caribbean. This division was mainly explained
by axis 1 in 11.8% and axis 2 in 9.17%. However, some
Belize individuals were found in between the South
Caribbean and Florida–Bahamas clusters, and all Cur-
ac�ao individuals in between the South Caribbean and
Florida clusters. Some individuals from the Florida clus-
ter (Dania Beach, Fort Lauderdale, Miami and Middle
Keys) were mixed with the Atlantic cluster (Bahamas,
Key Largo, Looe Key, Dry Tortugas). However, only
some individuals from the Atlantic cluster (from Looe
Table 2 FST Values between populations using all 10 loci (top number), or only 6 non-LD loci (bottom number in parenthesis). For
exact test after sequential Bonferroni correction (a 0.000758): (*) significant differences between geographic locations, BH: Bahamas
(Various reefs); FTL: Florida (Fort Lauderdale); DB: Florida (Dania Beach); MIA: Florida (Miami); KL: Florida (Key Largo); MK: Flor-
ida (Middle Keys); LK: Florida (Looe Key); DT: Florida (Dry Tortugas); BEZ: Belize (Carrie Bow Cay); COL: Colombia (San Andr�es
Island); BT: Panama (Bocas del Toro); CUZ: Curac�ao (Carmabi)
BH FTL DB MIA KL MKY LK DT BEZ COL BT
FTL 0.1861*(0.1752)*
DB 0.0805* 0.0549
(0.0824)* (0.0616)*MIA 0.192* 0.0543 0.079*
(0.2004)* (0.0779) (0.1054)*KL 0.0384* 0.1689* 0.0526* 0.1797*
(0.0359)* (0.159)* (0.055)* (0.1951)*MKY 0.2211* 0.0318* 0.0743* 0.0335 0.2046*
(0.1791)* (0.0273) (0.0545) (0.0391) (0.1673)*LK 0.0469* 0.1243* 0.0202 0.139* 0.0117 0.155*
(0.0511)* (0.1093)* (0.0147) (0.1449)* (0.0174) (0.1031)*DT 0.0399* 0.1398* 0.0349* 0.1554* 0.0083 0.1705* 0.0002
(0.0382)* (0.121)* (0.0327)* (0.1604)* (0.0127) (0.1206)* (�0.0026)
BEZ 0.1667* 0.1669* 0.1337* 0.1981* 0.1725* 0.1815* 0.1517* 0.143*(0.0999)* (0.1961)* (0.1416)* (0.2311)* (0.1285)* (0.2146)* (0.1059)* (0.0891)*
COL 0.222* 0.2222* 0.1828* 0.244* 0.2176* 0.2129* 0.2006* 0.1985* 0.1164*(0.1284)* (0.2152)* (0.1552)* (0.2445)* (0.1534)* (0.2095)* (0.1219)* (0.1093)* (0.0999) *
BT 0.2503* 0.2413* 0.2041* 0.2696* 0.2351* 0.2428* 0.2241* 0.2274* 0.179* 0.0987*(0.1204)* (0.2039)* (0.1354)* (0.2301)* (0.1281)* (0.2011)* (0.1114)* (0.1093)* (0.1453)* (0.1052)*
CUZ 0.2604* 0.2051* 0.1712* 0.236* 0.2567* 0.2056 0.2096* 0.2177* 0.1842* 0.2416* 0.2585*(0.2076)* (0.2158)* (0.1587)* (0.2454)* (0.2163)* (0.1986) (0.1559)* (0.1637)* (0.2157)* (0.2214)* (0.1838)*
(A) (B) (C)
Fig. 2 A principal coordinates analyses (PCoA) using genetic distances from a population-level pairwise FST matrix. A (biplot axis 1
vs axis 2); B (biplot axis 1 vs axis 3); C (biplot axis 2 vs axis 3). BH: Bahamas (Various reefs); FTL: Florida (Fort Lauderdale); DB:
Florida (Dania Beach); MIA: Florida (Miami); KL: Florida (Key Largo); MK: Florida (Middle Keys); LK: Florida (Looe Key); DT: Flor-
ida (Dry Tortugas); BEZ: Belize (Carrie Bow Cay); COL: Colombia (San Andr�es Island); BT: Panama (Bocas del Toro); CUZ: Curac�ao(Carmabi).
© 2015 John Wiley & Sons Ltd
1454 A. CHAVES- FONNEGRA ET AL.
Key) were also found in the Florida cluster (Fig. 3A–C).This was also supported when analyses were performed
only including individuals from Florida and Bahamas
(Fig. 3D–F) in which axis 1 explained 18.2% of the vari-
ation found in the distance matrix, and axes 2 and 3
explained 4.3% and 3.5%, respectively. At the South
Caribbean level, axis 1 separated Colombia and Panama
populations from Belize and Curac�ao at 11.3%. Axes 2
and 3 which explained 6.5% and 5.7% of the variation
did not reveal any substructure between the fourth
populations (Belize, Colombia, Curac�ao and Panama)
(see Fig. 3G–I).
Bayesian algorithm – individual level. The Bayesian algo-
rithm in STRUCTURE also recovered three genetic clusters
across the Greater Caribbean level when using ten and
six loci and both models: (i) Atlantic (Bahamas, Dry
Tortugas, Key Largo and Looe Key), (ii) Florida (Fort
Lauderdale, Miami and Middle Keys) and (iii) South
Caribbean (Belize, Panama, Colombia and Curac�ao)(Figs 4 and S1, Supporting information). Dania Beach
shared both individuals belonging to the Atlantic and
Florida clusters (Fig. 4A). When both models (admix-
ture, and admixture + locprior) were run only with six
loci, Curac�ao individuals were included within the
Atlantic cluster, instead of the South Caribbean (Fig. S1,
Supporting information). When the analyses were per-
formed only for Florida and Bahamas locations, both
models, for both ten and six loci, showed the same two
genetic clusters already found at the Greater Caribbean
level: (i) Atlantic (Bahamas, Dry Tortugas, Key Largo
and Looe Key) and (ii) Florida (Fort Lauderdale, Miami
and Middle Keys) and Dania Beach having almost the
same amount of individuals belonging to the Atlantic
and to the Florida clusters (Fig. 4B). Interesting, as in
the PCoA analyses, the Atlantic cluster corresponded to
deeper and farter locations and the Florida cluster cor-
responded to shallow and closer to the coast locations
(A) (B) (C)
(D) (E) (F)
(G) (H) (I)
Fig. 3 Results of the Principal Coordinates Analysis (PcoA) using genetic distances between individuals and a geographic distance
matrix in GENALEX 6.501. The three-axis comparisons are showed per analysis level, and the percentage of variation explained by each
axis is in parentheses. Greater Caribbean Sea level (A,B,C); Florida and Bahamas (D,E,F); South Caribbean Sea (G,H,I). BH: Bahamas
(Various reefs); FTL: Florida (Fort Lauderdale); DB: Florida (Dania Beach); MIA: Florida (Miami); KL: Florida (Key Largo); MK: Flor-
ida (Middle Keys); LK: Florida (Looe Key); DT: Florida (Dry Tortugas); BEZ: Belize (Carrie Bow Cay); COL: Colombia (San Andr�es
Island); BT: Panama (Bocas del Toro); CUZ: Curac�ao (Carmabi).
© 2015 John Wiley & Sons Ltd
POPULATION GENETICS OF THE SPONGE CLIONA DELITRIX 1455
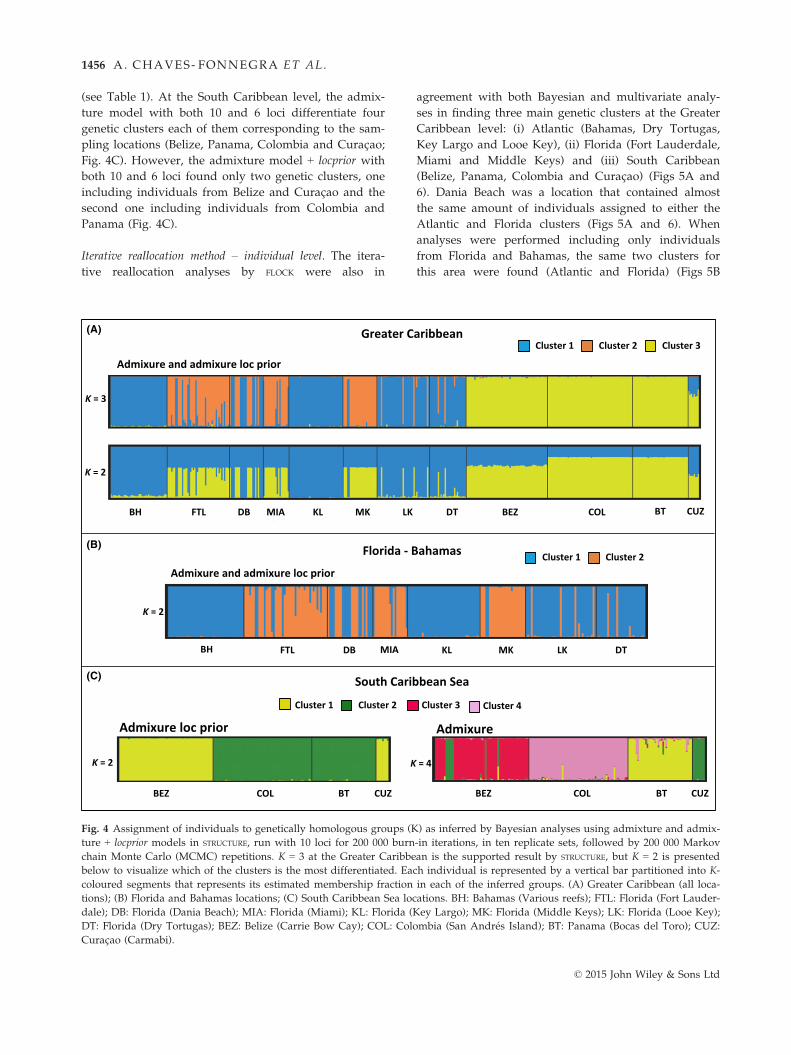
(see Table 1). At the South Caribbean level, the admix-
ture model with both 10 and 6 loci differentiate four
genetic clusters each of them corresponding to the sam-
pling locations (Belize, Panama, Colombia and Curac�ao;Fig. 4C). However, the admixture model + locprior with
both 10 and 6 loci found only two genetic clusters, one
including individuals from Belize and Curac�ao and the
second one including individuals from Colombia and
Panama (Fig. 4C).
Iterative reallocation method – individual level. The itera-
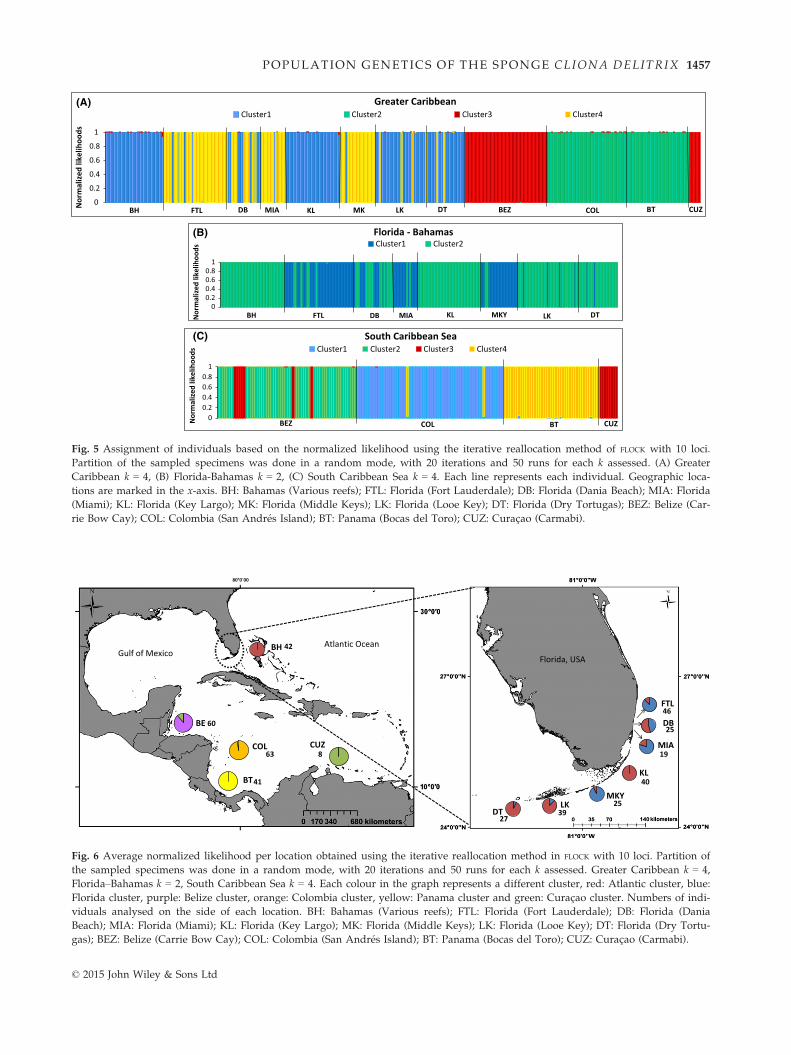
tive reallocation analyses by FLOCK were also in
agreement with both Bayesian and multivariate analy-
ses in finding three main genetic clusters at the Greater
Caribbean level: (i) Atlantic (Bahamas, Dry Tortugas,
Key Largo and Looe Key), (ii) Florida (Fort Lauderdale,
Miami and Middle Keys) and (iii) South Caribbean
(Belize, Panama, Colombia and Curac�ao) (Figs 5A and
6). Dania Beach was a location that contained almost
the same amount of individuals assigned to either the
Atlantic and Florida clusters (Figs 5A and 6). When
analyses were performed including only individuals
from Florida and Bahamas, the same two clusters for
this area were found (Atlantic and Florida) (Figs 5B
Greater CaribbeanCluster 1 Cluster 2 Cluster 3
Florida - Bahamas
South Caribbean Sea
Admixure and admixure loc prior
BEZBH BTCOL CUZDB DTFTL KL LKMIA MK
K = 3
K = 2
Admixure and admixure loc prior
BH DB DTFTL KL LKMIA MK
K = 2
Cluster 1 Cluster 2
BEZ
Admixure loc prior
K = 2
Cluster 1 Cluster 2 Cluster 3 Cluster 4
Admixure
K = 4
COL BT CUZ BEZ COL BT CUZ
(A)
(B)
(C)
Fig. 4 Assignment of individuals to genetically homologous groups (K) as inferred by Bayesian analyses using admixture and admix-
ture + locprior models in STRUCTURE, run with 10 loci for 200 000 burn-in iterations, in ten replicate sets, followed by 200 000 Markov
chain Monte Carlo (MCMC) repetitions. K = 3 at the Greater Caribbean is the supported result by STRUCTURE, but K = 2 is presented
below to visualize which of the clusters is the most differentiated. Each individual is represented by a vertical bar partitioned into K-
coloured segments that represents its estimated membership fraction in each of the inferred groups. (A) Greater Caribbean (all loca-
tions); (B) Florida and Bahamas locations; (C) South Caribbean Sea locations. BH: Bahamas (Various reefs); FTL: Florida (Fort Lauder-
dale); DB: Florida (Dania Beach); MIA: Florida (Miami); KL: Florida (Key Largo); MK: Florida (Middle Keys); LK: Florida (Looe Key);
DT: Florida (Dry Tortugas); BEZ: Belize (Carrie Bow Cay); COL: Colombia (San Andr�es Island); BT: Panama (Bocas del Toro); CUZ:
Curac�ao (Carmabi).
© 2015 John Wiley & Sons Ltd
1456 A. CHAVES- FONNEGRA ET AL.
0
0.2
0.4
0.6
0.8
1
Nor
mal
ized
like
lihoo
ds
Greater Caribbean Cluster1 Cluster2 Cluster3 Cluster4
BEZBH BTCOL CUZDB DTFTL KL LKMIA MK
00.20.40.60.8
1
Nor
mal
ized
like
lihoo
ds
Florida - BahamasCluster1 Cluster2
BH DBFTL KL LKMIA MKY DT
00.20.40.60.8
1
Nor
mal
ized
like
lihoo
ds
South Caribbean SeaCluster1 Cluster2 Cluster3 Cluster4
BEZ BTCOL CUZ
(A)
(B)
(C)
Fig. 5 Assignment of individuals based on the normalized likelihood using the iterative reallocation method of FLOCK with 10 loci.
Partition of the sampled specimens was done in a random mode, with 20 iterations and 50 runs for each k assessed. (A) Greater
Caribbean k = 4, (B) Florida-Bahamas k = 2, (C) South Caribbean Sea k = 4. Each line represents each individual. Geographic loca-
tions are marked in the x-axis. BH: Bahamas (Various reefs); FTL: Florida (Fort Lauderdale); DB: Florida (Dania Beach); MIA: Florida
(Miami); KL: Florida (Key Largo); MK: Florida (Middle Keys); LK: Florida (Looe Key); DT: Florida (Dry Tortugas); BEZ: Belize (Car-
rie Bow Cay); COL: Colombia (San Andr�es Island); BT: Panama (Bocas del Toro); CUZ: Curac�ao (Carmabi).
FTL
DB
MIA
KL
MKY
DTLK
BE
BT
COL CUZ
Florida, USAGulf of Mexico
Atlantic OceanBH
80°0´00
42
25
27
46
40
39
19
25
60
41
63 8
Fig. 6 Average normalized likelihood per location obtained using the iterative reallocation method in FLOCK with 10 loci. Partition of
the sampled specimens was done in a random mode, with 20 iterations and 50 runs for each k assessed. Greater Caribbean k = 4,
Florida–Bahamas k = 2, South Caribbean Sea k = 4. Each colour in the graph represents a different cluster, red: Atlantic cluster, blue:
Florida cluster, purple: Belize cluster, orange: Colombia cluster, yellow: Panama cluster and green: Curac�ao cluster. Numbers of indi-
viduals analysed on the side of each location. BH: Bahamas (Various reefs); FTL: Florida (Fort Lauderdale); DB: Florida (Dania
Beach); MIA: Florida (Miami); KL: Florida (Key Largo); MK: Florida (Middle Keys); LK: Florida (Looe Key); DT: Florida (Dry Tortu-
gas); BEZ: Belize (Carrie Bow Cay); COL: Colombia (San Andr�es Island); BT: Panama (Bocas del Toro); CUZ: Curac�ao (Carmabi).
© 2015 John Wiley & Sons Ltd
POPULATION GENETICS OF THE SPONGE CLIONA DELITRIX 1457
and 6). However, when only the South Caribbean loca-
tions were analysed, four different clusters were found,
with each representing a specific geographical location:
Belize, Colombia, Curac�ao and Panama (Figs 5C and 6).
The plateau records to define the number of k are
included as Table S6 (Supporting information).
Dispersal patterns
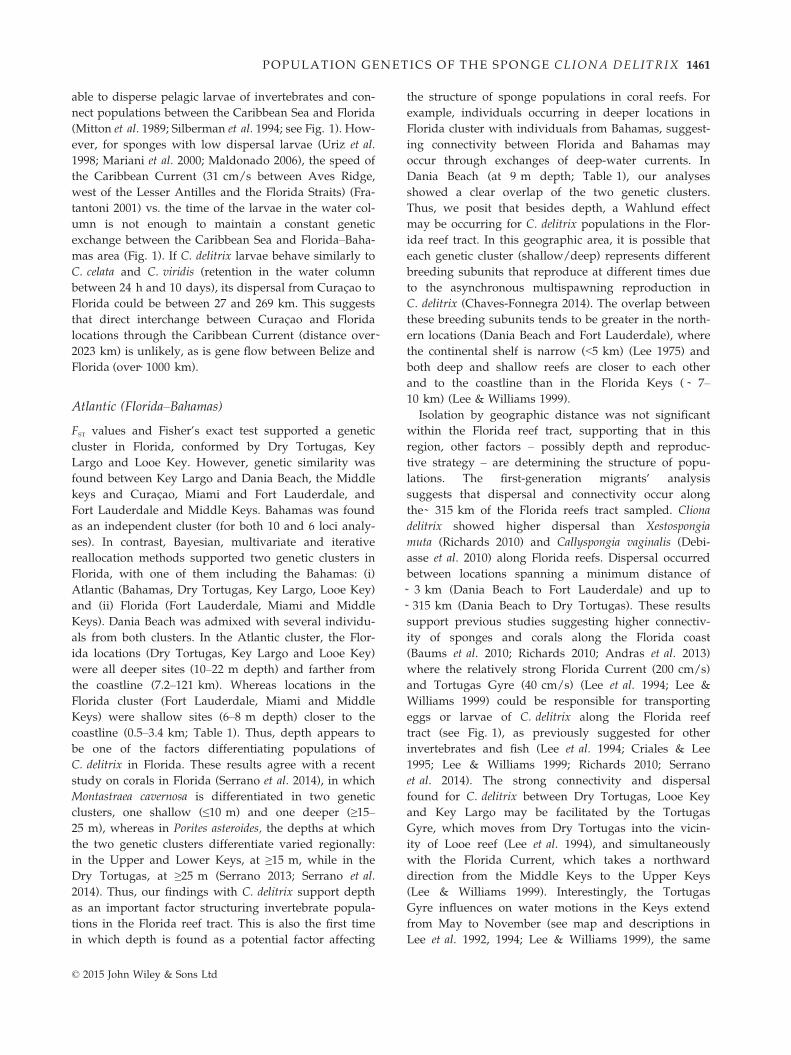
Genetic isolation by geographic distance – population level.
At the Greater Caribbean level, the correlation was
positive (R2 = 0.4121) and significant for genetic isola-
tion due to geographic distance (P ≤ 0.002). The greatest
isolation was found between the Atlantic (Florida–Baha-mas) and South Caribbean locations (Fig. 7A). However,
subsequent tests within the Atlantic (R2 = 0.0091;
P ≤ 0.392) and within South Caribbean locations
(R2 = 0.5785; P ≤ 0.124) did not show significant evi-
dence of isolation by distance (Fig. 7B, C).
Detection of first-generation migrants – individual level.
From the 348 individuals included in the assignment
analysis, 15.2% and 16.4% of the individuals (for 10 and
6 loci, respectively, a = 0.01) were first-generation
migrants to a new location. When a was set at 0.05, a
slight increment was recorded, 17% and 18.1% (10 loci
and 6 loci, respectively).
Both 10 and 6 loci (a = 0.01) detected first migrants in
all Florida locations and in the Bahamas (Table 3). But
only 6 loci analysis found first migrants among Panama
(a = 0.01, 0.05), Belize and Colombia (a = 0.05) (see
Table 3). Dispersal was in the same proportion either
direction for both 10 loci (48% to the south and 52% to
the north) and 6 loci (52% to the south and 48% to the
north) at a = 0.01, (similar percentages for a = 0.05,
Table 3). Dispersal from Florida to the Bahamas
occurred specifically from three locations, Dania Beach,
Key Largo and Dry Tortugas, whereas dispersal from
the Bahamas to Florida only was recorded towards Key
Largo (Table 3). Among the Florida reef tract, most of
the dispersal occurred from four locations, Dania Beach,
Key Largo, Looe Key and Middle Keys, and most of the
‘migrants’ were found among Key Largo, Looe Key and
Dry Tortugas, whereas dispersal from Dania Beach
occurred almost in the same amount towards Fort Lau-
derdale, Dry Tortugas, Key Largo, Looe Key and
Miami. Most of migrants from Middle Keys were found
in Fort Lauderdale and Miami (Table 3).
Dispersal between the South Caribbean Sea locations
and the Atlantic (Florida–Bahamas) occurred (three
migrants) mostly towards the north (Table 3) and from
the Caribbean Sea (Curac�ao, Panama and Belize) to the
Bahamas. Only one individual originated in Florida
(Looe Key) was found as a migrant into the South
Caribbean (Colombia).
Discussion
Summary statistics
We developed 10 new microsatellite markers for the
excavating sponge Cliona delitrix. These markers
showed high levels of polymorphism allowing the
determination of distinct population subdivisions across
the Greater Caribbean sampling area. Although four of
the microsatellite loci were in linkage disequilibrium
(LD), this was not evident across all populations (see
Table S3, Supporting information). Linked loci can
affect population differentiation by artificially inflating
levels of differentiation. For example, if two rare alleles
are inherited more than expected by chance in popula-
tion A, then that population may appear more differen-
tiated due to individuals inheriting rare alleles. To be
conservative with our estimates of differentiation, we
ran analyses that assumed linkage equilibrium as a pri-
ori information with and without the linked loci. LD
has been previously found in microsatellite markers of
marine sponges (Blanquer & Uriz 2010; Richards 2010;
Guardiola et al. 2012), and even with this condition,
they have been useful to differentiate populations at
temporal and spatial scales (Blanquer & Uriz 2010;
Guardiola et al. 2012). Also, loci under LD may not
(A) (B) (C)
Fig. 7 Genetic isolation by distance for Cliona delitrix individuals inferred from multilocus estimates of genetic differentiation FST/(1–FST) and the logarithm of the geographic distance (D) using a Mantel test. Ten 1oci were used for this test. (A) Greater Caribbean; (B)
Florida and Bahamas; and (C) the South Caribbean Sea.
© 2015 John Wiley & Sons Ltd
1458 A. CHAVES- FONNEGRA ET AL.

Table
3Number
offirst-gen
erationmigrants
with10
loci
(toptable)an
d6loci
(bottom
table).First
columna=0.01
andsecondcolumna=0.05.BH:Bah
amas
(Variousreefs);
FTL:Florida(Fort
Lau
derdale);DB:Florida(D
ania
Beach
);MIA
:Florida(M
iami);KL:Florida(K
eyLargo);MK:Florida(M
iddle
Key
s);LK:Florida(LooeKey
);DT:Florida(D
ry
Tortugas);BEZ:Belize(C
arrieBow
Cay
);COL:Colombia
(San
Andr� esIsland);BT:Pan
ama(Bocasdel
Toro);CUZ:Curac �ao(C
armab
i).(—
):no-m
igrants
Populationsoforigin
BH
FTL
DB
MIA
KL
MK
LK
DT
BEZ
COL
BT
CUZ
Total
10loci
Foundin
0.01
0.05
0.01
0.05
0.01
0.05
0.01
0.05
0.01
0.05
0.01
0.05
0.01
0.05
0.01
0.05
0.01
0.05
0.01
0.05
0.01
0.05
0.01
0.05
0.01
0.05
BH
——
——
11
——
33
——
——
——
——
——
——
——
44
FTL
——
——
11
—1
11
44
22
——
——
——
——
——
89
DB
——
22
——
——
55
22
11
——
——
——
——
——
1010
MIA
——
——
22
——
——
33
——
——
——
——
——
——
55
KL
12
——
12
——
——
——
11
33
——
——
——
——
68
MK
——
11
——
22
——
——
——
——
——
——
——
——
33
LK
——
—1
23
——
67
22
——
——
——
——
——
——
1013
DT
——
——
11
——
23
——
33
——
——
——
——
——
67
BEZ
——
——
——
——
——
——
——
——
——
——
——
——
——
COL
——
——
——
——
——
——
——
——
——
——
——
——
——
BT
——
——
——
——
——
——
——
——
——
——
——
——
——
CUZ
——
——
——
——
——
——
——
——
——
——
——
——
——
Total
12
34
810
23
1719
1111
77
33
——
——
——
——
5259
6loci
BH
——
——
——
——
34
——
——
—1
11
——
11
11
68
FTL
——
——
11
——
11
12
33
——
——
——
——
——
67
DB
——
33
——
——
11
——
33
11
——
——
——
——
88
MIA
——
——
22
——
——
33
——
——
——
——
——
——
55
KL
12
——
11
——
——
——
34
33
——
——
——
——
810
MK
——
22
——
22
——
——
——
——
——
——
——
——
44
LK
——
11
33
——
44
22
——
—1
——
——
——
——
1011
DT
——
——
11
——
33
——
33
——
——
——
——
——
77
BEZ
——
——
——
——
——
——
——
——
——
——
11
——
11
COL
——
——
——
——
——
——
—1
——
——
——
——
——
—1
BT
——
——
——
——
——
——
——
——
——
11
——
——
11
CUZ
——
——
——
——
——
——
——
——
——
——
——
——
——
Total
12
66
88
22
1213
67
1214
46
11
11
22
11
5663
Totaldispersalat
a=0.01:48%
tothesouth
and52%
tothenorth;at
a=0.05:53%
tothesouth
and47%
tothenorth(10loci).
Totaldispersalat
a=0.01:52%
tothesouth
and48%
tothenorth;at
a=0.05:49%
tothesouth
and51%
tothenorth(6
loci).
© 2015 John Wiley & Sons Ltd
POPULATION GENETICS OF THE SPONGE CLIONA DELITRIX 1459

necessarily maintain in the LD condition over time
(Guardiola et al. 2012). In addition, linkage at a global
level does not necessarily reflect LD across all popula-
tions as we found for C. delitrix and Blanquer & Uriz
(2010) for the sponge Scopalina lophyropoda.
Mean expected heterozygosities for all loci in Cliona
delitrix (HE = 0.592–0.805) were within the range of
other marine sponges: Crambe crambe (HE = 0.422–0.748)(Duran et al. 2004), Paraleucilla magna (0.609–0.698)(Guardiola et al. 2012), Spongia officinalis (HE = 0.73–0.90) (Dailianis et al. 2011) and Xestospongia muta (0.640–0.719) (Richards 2010). Also, as commonly observed in
sponges, C. delitrix showed departure from HWE, sig-
nificant heterozygote deficiency for all 10 loci and
within all locations. This deficiency was revealed in
high positive FIS values – suggesting nonrandom mat-
ing between individuals – which could have resulted
for technical reasons such as the presence of nonampli-
fying alleles (i.e. null alleles). Null alleles can commonly
occur in invertebrates due to mutations in the flanking
regions of microsatellites (Callen et al. 1993; McGoldrick
et al. 2000; Reece et al. 2004; Brownlow et al. 2008) or to
biological reasons such as inbreeding, selfing and Wahl-
und effects (Freeland 2005; Allendorf & Gordon 2007).
When exploring the effects of null alleles, we found that
the presence of average null alleles for each locus was
lower (6.8% overall) than for the sponge Xestospongia
muta (13.1%) (Richards 2010) or other invertebrates as
the Barnacle Pollicipes elegans (12%) (Plough & Marko
2014). But, the higher FIS values and heterozygosities
deficiencies in C. delitrix could be due to biological rea-
sons. For example, inbreeding cannot be completely
ruled out. If we consider that C. delitrix larvae behave
similarly to other Cliona larvae (crawling with low
dispersal capabilities), then philopatry could be gener-
ated (Warburton 1966; Mariani et al. 2000). This is a typ-
ical condition of sponge larvae that structure
populations (Debiasse et al. 2010; Dailianis et al. 2011;
Guardiola et al. 2012). In addition, C. delitrix popula-
tions have a small percentage of hermaphroditic indi-
viduals (Chaves-Fonnegra 2014) and inbreeding could
be the result of self-fertilization. Larvae in Cliona
sponges can fuse before starting to swim (Warburton
1958) and may form chimeras, but heterozygosity
deficiencies reflect that this may not be the case for
C. delitrix. Sponge chimeric individuals, despite their
philopatric larvae and small patchy populations, exhibit
heterozygote excess and high genetic diversity
(Blanquer & Uriz 2011).
In addition, heterozygote deficiency in Cliona delitrix
can be explained by a temporary Wahlund effect, as a
consequence of different breeding subunits within each
sampled location, as seen in the Dania Beach location
(Florida). This may be possible as C. delitrix has an
asynchronous reproduction with multiple peaks of
gametes released, in which not all individuals in each
location engage in reproduction (Chaves-Fonnegra
2014). Therefore, each location could have several
breeding subunits of individuals reproducing at differ-
ent times over years. This characteristic has been sug-
gested previously for Crambe crambe, a sponge that may
present a reproductive lag between subpopulations,
allowing the formation of different breeding units (Uriz
et al. 1998; Duran et al. 2004).
The South Caribbean locations and Bahamas had a
greater number and higher average frequency of private
alleles than any of the Florida locations. This can indi-
cate a recent expansion of the species to Florida reefs,
which are marginal to the distribution range of C. deli-
trix (see map in van Soest et al. 2013). This has been
suggested for Crambe crambe in the Mediterranean
(Duran et al. 2004). Private alleles can also be estimators
of gene flow (Slatkin 1985). The low frequency of pri-
vate alleles in Florida locations may be the result of
high gene flow between these locations, whereas iso-
lated populations (e.g. South Caribbean Sea) have accu-
mulated private alleles over time.
Greater Caribbean
Fisher’s exact test (FST values) supported Bahamas,
Belize, Colombia and Panama as independent clusters.
In Florida, some locations were genetically similar. Cur-
ac�ao was connected to Florida (Middle Keys location).
Bayesian, multivariate and iterative reallocation meth-
ods supported differentiation between Atlantic locations
(Florida and Bahamas) and the South Caribbean loca-
tions (Belize, Colombia, Curac�ao and Panama), and also
within Florida. Although the Bayesian method required
loci to be in HWE and linkage equilibrium as a priori
information, this analysis was not affected by the pres-
ence of linked loci, as it showed similar results with 6
and 10 loci, and to the multivariate and iterative meth-
ods that do not require HWE or LD as a priori assump-
tions.
Isolation by geographic distance was found between
the Atlantic and South Caribbean locations. However,
first migrant analyses (6 loci) suggest limited dispersal
may be possible between these geographic areas (over
1100 km). Previous genetic studies through mtDNA
sequences and microsatellite allele frequencies showed
that dispersal of Xestospongia muta between Honduras/
Bahamas locations and Florida had occurred for thou-
sands of generations (Lopez-Legentil & Pawlik 2009;
Richards 2010). As for C. delitrix, contemporary dispersal
for X. muta between these geographic locations (over
1000 km apart) is unlikely (Richards 2010). The Carib-
bean and Loop currents are the main surface circulation
© 2015 John Wiley & Sons Ltd
1460 A. CHAVES- FONNEGRA ET AL.
able to disperse pelagic larvae of invertebrates and con-
nect populations between the Caribbean Sea and Florida
(Mitton et al. 1989; Silberman et al. 1994; see Fig. 1). How-
ever, for sponges with low dispersal larvae (Uriz et al.
1998; Mariani et al. 2000; Maldonado 2006), the speed of
the Caribbean Current (31 cm/s between Aves Ridge,
west of the Lesser Antilles and the Florida Straits) (Fra-
tantoni 2001) vs. the time of the larvae in the water col-
umn is not enough to maintain a constant genetic
exchange between the Caribbean Sea and Florida–Baha-mas area (Fig. 1). If C. delitrix larvae behave similarly to
C. celata and C. viridis (retention in the water column
between 24 h and 10 days), its dispersal from Curac�ao to
Florida could be between 27 and 269 km. This suggests
that direct interchange between Curac�ao and Florida
locations through the Caribbean Current (distance over 2023 km) is unlikely, as is gene flow between Belize and
Florida (over 1000 km).
Atlantic (Florida–Bahamas)
FST values and Fisher’s exact test supported a genetic
cluster in Florida, conformed by Dry Tortugas, Key
Largo and Looe Key. However, genetic similarity was
found between Key Largo and Dania Beach, the Middle
keys and Curac�ao, Miami and Fort Lauderdale, and
Fort Lauderdale and Middle Keys. Bahamas was found
as an independent cluster (for both 10 and 6 loci analy-
ses). In contrast, Bayesian, multivariate and iterative
reallocation methods supported two genetic clusters in
Florida, with one of them including the Bahamas: (i)
Atlantic (Bahamas, Dry Tortugas, Key Largo, Looe Key)
and (ii) Florida (Fort Lauderdale, Miami and Middle
Keys). Dania Beach was admixed with several individu-
als from both clusters. In the Atlantic cluster, the Flor-
ida locations (Dry Tortugas, Key Largo and Looe Key)
were all deeper sites (10–22 m depth) and farther from
the coastline (7.2–121 km). Whereas locations in the
Florida cluster (Fort Lauderdale, Miami and Middle
Keys) were shallow sites (6–8 m depth) closer to the
coastline (0.5–3.4 km; Table 1). Thus, depth appears to
be one of the factors differentiating populations of
C. delitrix in Florida. These results agree with a recent
study on corals in Florida (Serrano et al. 2014), in which
Montastraea cavernosa is differentiated in two genetic
clusters, one shallow (≤10 m) and one deeper (≥15–25 m), whereas in Porites asteroides, the depths at which
the two genetic clusters differentiate varied regionally:
in the Upper and Lower Keys, at ≥15 m, while in the
Dry Tortugas, at ≥25 m (Serrano 2013; Serrano et al.
2014). Thus, our findings with C. delitrix support depth
as an important factor structuring invertebrate popula-
tions in the Florida reef tract. This is also the first time
in which depth is found as a potential factor affecting
the structure of sponge populations in coral reefs. For
example, individuals occurring in deeper locations in
Florida cluster with individuals from Bahamas, suggest-
ing connectivity between Florida and Bahamas may
occur through exchanges of deep-water currents. In
Dania Beach (at 9 m depth; Table 1), our analyses
showed a clear overlap of the two genetic clusters.
Thus, we posit that besides depth, a Wahlund effect
may be occurring for C. delitrix populations in the Flor-
ida reef tract. In this geographic area, it is possible that
each genetic cluster (shallow/deep) represents different
breeding subunits that reproduce at different times due
to the asynchronous multispawning reproduction in
C. delitrix (Chaves-Fonnegra 2014). The overlap between
these breeding subunits tends to be greater in the north-
ern locations (Dania Beach and Fort Lauderdale), where
the continental shelf is narrow (<5 km) (Lee 1975) and
both deep and shallow reefs are closer to each other
and to the coastline than in the Florida Keys ( 7–10 km) (Lee & Williams 1999).
Isolation by geographic distance was not significant
within the Florida reef tract, supporting that in this
region, other factors – possibly depth and reproduc-
tive strategy – are determining the structure of popu-
lations. The first-generation migrants’ analysis
suggests that dispersal and connectivity occur along
the 315 km of the Florida reefs tract sampled. Cliona
delitrix showed higher dispersal than Xestospongia
muta (Richards 2010) and Callyspongia vaginalis (Debi-
asse et al. 2010) along Florida reefs. Dispersal occurred
between locations spanning a minimum distance of
3 km (Dania Beach to Fort Lauderdale) and up to
315 km (Dania Beach to Dry Tortugas). These results
support previous studies suggesting higher connectiv-
ity of sponges and corals along the Florida coast
(Baums et al. 2010; Richards 2010; Andras et al. 2013)
where the relatively strong Florida Current (200 cm/s)
and Tortugas Gyre (40 cm/s) (Lee et al. 1994; Lee &
Williams 1999) could be responsible for transporting
eggs or larvae of C. delitrix along the Florida reef
tract (see Fig. 1), as previously suggested for other
invertebrates and fish (Lee et al. 1994; Criales & Lee
1995; Lee & Williams 1999; Richards 2010; Serrano
et al. 2014). The strong connectivity and dispersal
found for C. delitrix between Dry Tortugas, Looe Key
and Key Largo may be facilitated by the Tortugas
Gyre, which moves from Dry Tortugas into the vicin-
ity of Looe reef (Lee et al. 1994), and simultaneously
with the Florida Current, which takes a northward
direction from the Middle Keys to the Upper Keys
(Lee & Williams 1999). Interestingly, the Tortugas
Gyre influences on water motions in the Keys extend
from May to November (see map and descriptions in
Lee et al. 1992, 1994; Lee & Williams 1999), the same
© 2015 John Wiley & Sons Ltd
POPULATION GENETICS OF THE SPONGE CLIONA DELITRIX 1461
period in which the reproductive cycle of C. delitrix
occurs in Florida (Chaves-Fonnegra 2014).
Our study also supports connectivity between the
deeper (and further locations from the coast) in the
Florida reef tract and the Bahamas. One previous study
with the sea fan Gorgonia ventalina also supports con-
nectivity across the Florida Current (over 88 km dis-
tance) (Andras et al. 2013). These results contrast with
previous studies in the area, which found the Florida
Current as a barrier that impedes larvae exchange in
sponges and corals (Vollmer & Palumbi 2007; Lopez-Le-
gentil & Pawlik 2009; Baums et al. 2010; Richards 2010).
However, the northeasterly direction of the Florida Cur-
rent in Key Largo could facilitate the interchange of lar-
vae outside Florida and specifically to the Bahamas
(Lee & Williams 1999). Due to the change and intensifi-
cation of the Florida Current in the Upper Keys (Lee &
Williams 1999), we consider this area (specifically Key
Largo) is exposed to more larval exchange from popula-
tions outside the Florida reef tract area, as previously
suggested for Xestospongia muta (Richards 2010). Con-
nectivity across the Florida Current is feasible, although
it is probably constrained by the complexity of the
ocean currents in the area, and the period of time in
which reproduction and dispersal of the populations
occur. Depth also could be the main factor segregating
populations in this region, as found at a greater scale
(Caribbean Sea) for the candelabrum coral Eunicea flexu-
osa (Prada & Hellberg 2013). Future studies between
Florida and Bahamas could address this hypothesis.
Cliona delitrix dispersal was in equal proportions in
both directions (south/north) of the Florida reef tract.
Connectivity in both directions and between the Upper
Keys (Key Largo) and Northern reef tract locations
(Miami, Dania Beach and Fort Lauderdale) could be
possible through the Florida Current, whereas dispersal
from the north locations to the south could be attrib-
uted to the Coastal Countercurrent, eddies and gyres
that form closer to the coast (Lee 1975; Lee & Mayer
1977; Lee & Williams 1999). Also, it is feasible that the
deeper and farther locations in the Atlantic cluster are
influenced by the Florida Current, which flows sepa-
rated from the coast (Lee & Williams 1999), whereas the
shallow and closer to the coast locations (Florida clus-
ter) are connected by the Coastal Countercurrent that
circulates near to the coast (Lee & Mayer 1977).
South Caribbean Sea
We found two to four genetic clusters in the South Carib-
bean Sea. The PCoA method separated two genetic popu-
lations: (i) Colombia, Panama and Belize as one
population and (ii) Curac�ao. In contrast, the Bayesian
and iterative analyses together supported four South
Caribbean geographic locations as genetic populations:
(i) Belize, (ii) Colombia, (iii) Curac�ao and (iv) Panama.
The FST values and Fisher’s exact test supported the four
genetic clusters, although Curac�ao was linked to the Mid-
dle Keys location in Florida. Therefore, we consider that
South Caribbean locations form independent popula-
tions, but Colombia, Panama and Belize (southwest
Caribbean) showed more connectivity and some admix-
ture between them. These results are consistent with pre-
vious studies of the Sea fan coral Gorgonia ventalina,
which also showed apparent admixture among Panama
and the Mesoamerican Barrier Reef (=localities among
Belize and Mexico coast) (Andras et al. 2013). It is possi-
ble that the Belize–Curac�ao cluster suggested by the loc
prior Bayesian analysis and the Middle Keys–Curac�aocluster suggested by the FST Fisher’s exact tests are an
artefact due to insufficient sampling from Curac�ao(n = 8), as both PCoA and iterative methods designated
this location an independent genetic population.
Although the four sampled locations in the South
Caribbean Sea constitute different genetic populations,
isolation by distance was not significant between them
(along 2100 km). Thus, as in the Atlantic (Florida–Bahamas locations), it is possible that other factor (i.e.
depth) is structuring populations (see Prada & Hellberg
2013). Gene flow in the South Caribbean area is present
and first-generation migrants between Colombia and
Panama, and Panama and Belize were detected in the
analysis with six unlinked loci. Connectivity in this area
is possible as the Caribbean Current velocities along the
coasts of Venezuela and the Netherland Antilles can
reach 70 cm/s (Fratantoni 2001), and an intense recircu-
lation gyre (60 cm/s) drives strong currents in the
southwest corner of the Colombian Basin (80° W, 12°N) (Fratantoni 2001). If we consider the speed of the
gyre and estimate the time of larvae retention between
24 h and 10 days (Warburton 1966; Mariani et al. 2000),
dispersal distances could reach 51–518 km; therefore, it
is likely that larvae of C.delitrix are being interchanged
between Bocas del Toro, Panama and San Andres
Island, Colombia ( 345 km linear distance, and 542 km
semicircle perimeter). Although less feasible, larvae
may be transported by eddies between Panama and
Colombia to the Mesoamerican Barrier Reef.
Dispersal of C. delitrix on coral reefs
Using allozymes, Zilberberg et al. (2006) suggested dis-
persal ranges for Cliona delitrix larger than 10–100 m, and
our results, employing microsatellites, support this
hypothesis. Dispersal of C. delitrix may reach as far as
~350 km (Florida reef track and between Colombia and
Panama), and could be favored especially where strong
currents are able to transport sponge eggs or larvae over
© 2015 John Wiley & Sons Ltd
1462 A. CHAVES- FONNEGRA ET AL.
longer distances. This species is a strong competitor of
corals and can take advantage of recent coral mortality
(Chaves-Fonnegra 2014). Additionally, C. delitrix as other
species of excavating sponges, may survive coral bleach-
ing events and resist more acidic environments (Wisshak
et al. 2012; Carballo et al. 2013; Stubler et al. 2014), becom-
ing an important community component of reef habitats.
Results presented here can be used as a baseline to moni-
tor future coral reef trends under climate change.
Acknowledgements
These results were presented by A. C-F as part of her PhD dis-
sertation in NOVA Southeastern University, Oceanographic
Center, FL, USA. This work was supported by the UNESCO-
L0Or�eal Fellowship for Young Women in Science, the PhD
scholarship programme from Colombian Science and Technol-
ogy Department (COLCIENCIAS), Billfish Tournament Scholar-
ship and the Broward Women Association Scholarship.
Fieldwork was possible in the Bahamas and Florida thanks to
Joe Pawlik, members of the 2011 Chemical Ecology of Marine
Organisms Cruise, Sven Zea, Malcom Hill, Rob Ruzicka,
Charles Messing, John Hocevar and Dave Gilliam; in Belize to
Elizabeth L. McLean, Klaus R€utzler and the Carry Bow Smith-
sonian Marine Station; in Colombia to Sven Zea, Banda Dive
Shop and the Universidad Nacional de Colombia; in Panama
to Bob Thacker, Cristina D�ıaz, Ewelina Rubin, Tse-Lyn Loh,
Jan Vicente and the Smithsonian Station at Bocas del Toro; and
in Curac�ao to Benjamin M€uller and the CARMABI Research
Station. Many thanks to all members of the NSU Oceano-
graphic Center Laboratories: Marine Microbiology and Genet-
ics, Conservation Biology and Genetics, and Coral Reef
Restoration and Monitoring. Special thanks to Pierre Duchesne
for guidance with running and interpreting the results from
FLOCK program, and Andrea Bernard for guidance with
PCoA analyses and Structure program.
Collecting permits for each location: Bahamas (R/V F.G. Wal-
ton Smith, CY 2011 ‘Blanket’ Research Permit from the Govern-
ment of the Bahamas), Florida (Fishing Permit at reef sites
outside any marine protected area), except for Dry Tortugas
(Greenpeace 2010 Expedition, permit DRTO-2010-SCI-0014),
Belize (Belize Fisheries Department GEN/FIS/15/04/2010-53-
Vol.VIII), Colombia (Universidad Nacional de Colombia’s Insti-
tutional collecting permit, formalized and renewed by Resolu-
tion 0255 of March 14, 2014 of ANLA -National Authority for
Environmental Licenses-), Panama (Autoridad de los Recursos
Acu�aticos de Panam�a Resoluci�on DGOMI-PEFC N°30 de 03 de
Septiembre de 2009), and Curac�ao (Annual Research Permit
issued by the Curac�ao Ministry of Health, Environment and
Nature -GMN- to the CARMABI foundation).
References
Allendorf FW, Gordon L (2007) Conservation and the Genetics of
Populations, p. 642. Blackwell Publishing, Malden, Massachu-
setts.
Andrade CA, Barton ED (2000) Eddy development and motion
in the Caribbean Sea. Journal of Geophysical Research: Oceans,
105, 26191–26201.
Andras JP, Rypien KI, Harvell CD (2013) Range-wide popula-
tion genetic structure of the Caribbean sea fan coral, Gorgonia
ventalina. Molecular Ecology, 22, 56–73.Baums IB, Johnson ME, Devlin-Durante MK, Miller MW (2010)
Host population genetic structure and zooxanthellae diver-
sity of two reef-building coral species along the Florida Reef
Tract and wider Caribbean. Coral Reefs, 29, 835–842.Bergquist P, Sinclair ME (1968) The morphology and behaviour
of larvae of some intertidal sponges. New Zealand Journal of
Marine and Freshwater Research, 2, 426–437.Bergquist PR, Sinclair ME (1973) Seasonal variation in settle-
ment and spiculation of sponge larvae. Marine Biology, 20,
35–44.Blanquer A, Uriz MJ (2010) Population genetics at three spatial
scales of a rare sponge living in fragmented habitats. BMC
Evolutionary Biology, 10, 13.
Blanquer A, Uriz JM (2011) “Living together apart”: the hidden
genetic diversity of sponge populations. Molecular Biology
and Evolution, 28, 2435–2438.Blanquer A, Uriz MJ, Pascual M (2005) Polymorphic microsat-
ellite loci isolated from the marine sponge Scopalina lophyro-
poda (Demospongiae: Halichondrida). Molecular Ecology, 5,
466–468.Blanquer A, Uriz JM, Caujap�e-Castells J (2009) Small-scale spa-
tial genetic structure in Scopalina lophyropoda, an encrusting
sponge with philopatric larval dispersal and frequent fission
and fusion events. Marine Ecology Progress Series, 380, 95–102.
Brownlow RJ, Dawson DA, Horsburgh GJ, Bell JJ, Fish JD
(2008) A method for genotype validation and primer assess-
ment in heterozygote-deficient species, as demonstrated in
the prosobranch mollusc Hydrobia ulvae. BMC Genetics, 9, 55.
Calder�on I, Ortega N, Duran S et al. (2007) Finding the relevant
scale: clonality and genetic structure in a marine invertebrate
(Crambe crambe, Porifera). Molecular Ecology, 16, 1799–1810.Callen DF, Thompson AD, Shen Y et al. (1993) Incidence and
origin of ‘null’ alleles in the (AC)n microsatellite markers.
American Journal of Human Genetics, 52, 922–927.Carballo JL, Bautista E, Nava H, Cruz-Barraza JA, Chavez JA
(2013) Boring sponges, an increasing threat for coral reefs
affected by bleaching events. Ecology and Evolution, 3, 872–886.
Chapuis MP, Estoup A (2007) Microsatellite null alleles and
estimation of population differentiation. Molecular Biology
and Evolution, 24, 621–631.Chaves-Fonnegra A (2014) Increase of excavating sponges on
Caribbean coral reefs: reproduction, dispersal and coral deteriora-
tion. Doctoral Dissertation, Nova Southeastern University.
Chaves-Fonnegra A, Zea S (2007) Observations on reef coral
undermining by the Caribbean excavating sponge Cliona deli-
trix (Demospongiae, Hadromerida). In: Porifera Research: Bio-
diversity, Innovation and Sustainability (eds Cust�odio MR,
Lobo-Hajdu G, Hajdu E, Muricy G), pp. 247–254. Museu
Nacional, Rio de Janeiro.
Chaves-Fonnegra A, Zea S (2011) Coral colonization by the
encrusting excavating Caribbean sponge Cliona delitrix. Mar-
ine Ecology, 32, 162–173.Chaves-Fonnegra A, Zea S, G�omez ML (2007) Abundance of
the excavating sponge Cliona delitrix in relation to sewage
discharge at San Andr�es Island, SW Caribbean, Colombia.
Bolet�ın de Investigaciones Marinas y Costeras, 36, 63–78.
© 2015 John Wiley & Sons Ltd
POPULATION GENETICS OF THE SPONGE CLIONA DELITRIX 1463
Cort�es J, Murillo M, Guzm�an HM, Acu~na J (1984) P�erdida de
zooxantelas y muerte de corales y otros organismos arrecif-
ales en el Caribe y Pac�ıfico de Costa Rica. Revista de Biolog�ıa
Tropical, 32, 227–231.Criales MM, Lee TN (1995) Larval distribution and transport of
penaeoid shrimps during the presence of the Tortugas Gyre
in May–June 1991. Fishery Bulletin, 93, 471–482.Dailianis T, Tsigenopoulos CS, Dounas C, Voultsiadou E (2011)
Genetic diversity of the imperilled bath sponge Spongia offici-
nalis Linnaeus, 1759 across the Mediterranean Sea: patterns
of population differentiation and implications for taxonomy
and conservation. Molecular Ecology, 18, 3757–3772.Debiasse M, Richards VP, Shivji MS (2010) Genetic assessment
of connectivity in the common reef sponge, Callyspongia vagi-
nalis (Demospongiae: Haplosclerida) reveals high population
structure along the Florida reef tract. Coral Reefs, 29, 47–55.Dempster AP, Laird NM, Rubin DB (1977) Maximum likeli-
hood from incomplete data via the EM algorithm. Journal of
the Royal Statistical Society Series B (Methodological), 39, 1–38.D�ıaz M, R€utzler K (2001) Sponge: an essential component of
Caribbean coral reefs. Bulletin of Marine Science, 69, 535–546.Duchesne P, Turgeon J (2012) FLOCK provides reliable solutions
to the “number of populations” problem. Journal of Heredity,
103, 734–743.Duran S, R€utzler K (2006) Ecological speciation in a Caribbean
marine sponge. Molecular Phylogenetics and Evolution, 40, 292–297.
Duran S, Pascual M, Estoup A, Turon X (2004) Strong popula-
tion structure in the marine sponge Crambe crambe (Poecilo-
sclerida) as revealed by microsatellite markers. Molecular
Ecology, 13, 511–522.Earl DA, vonHoldt BM (2012) STRUCTURE HARVESTER: a website
and program for visualizing STRUCTURE output and imple-
menting the Evanno method. Conservation Genetics Resources,
4, 359–361.Erpenbeck D, Hooper JNA, W€orheide G (2006) CO1 phyloge-
nies in diploblasts and the ‘Barcoding of Life’ — are we
sequencing a suboptimal partition? Molecular Ecology Notes,
6, 550–553.Evanno G, Regnaut S, Goudet J (2005) Detecting the number of
clusters of individuals using the software STRUCTURE: a simu-
lation study. Molecular Ecology, 14, 2611–2620.Folmer O, Black M, Hoeh W, Lutz R, Vrijenhoek R (1994) DNA
primers for amplification of mitochondrial cytochrome c oxi-
dase subunit I from diverse metazoan invertebrates. Molecu-
lar Marine Biology and Biotechnology, 3, 294–299.Fratantoni DM (2001) North Atlantic surface circulation during
the 1990’s observed with satellite-tracked drifters. Journal of
Geophysical Research, 106, 22067–22093.Freeland JR (2005) Molecular Ecology. John Wiley and Sons Ltd,
England.
Garnier-Gere P, Dillmann C (1992) LinkDos on the Web. Jour-
nal of Heredity, 83, 239.
Glenn TC, Schable NA (2005) Isolating microsatellite DNA loci.
Methods in Enzymology, 395, 202–222.Goudet J (1995) FSTAT (Version 1.2): a computer program to cal-
culate F-statistics. Journal of Heredity, 86, 485–486.Guardiola M, Frotscher J, Uriz MJ (2012) Genetic structure and
differentiation at a short-time scale of the introduced
calcarean sponge Paraleucilla magna to the western Mediterra-
nean. Hydrobiologia, 687, 71–84.
Guo SW, Thompson EA (1992) Performing the exact test of
Hardy–Weinberg proportion for multiple alleles. Biometrics,
48, 361–372.Holmes KE (1997) Eutrophication and its effect on bioeroding
sponge communities. In: Proc 8th Int Coral Reef Symp (eds
Lessios HA, Macintyre IG), pp. 1411–1416.Hubisz MJ, Falush D, Stephens M, Pritchard JK (2009) Infer-
ring weak population structure with the assistance of
sample group information. Molecular Ecology Resources, 9,
1322–1332.Ilan M, Loya Y (1990) Sexual reproduction and settlement of
the coral reef sponge Chalinula sp. form the Red Sea. Marine
Biology, 105, 25–31.Jakobsson M, Rosenberg NA (2007) CLUMPP: a cluster matching
and permutation program for dealing with label switching
and multimodality in analysis of population structure. Bioin-
formatics, 23, 1801–1806.Kaeuffer R, R�eale D, Coltman DW, Pontier D (2007) Detecting
population structure using STRUCTURE software: effect of back-
ground linkage disequilibrium. Heredity, 99, 374–380.Knowlton AL, Pierson BJ, Talbot SL, Highsmith RC (2003) Iso-
lation and characterization of microsatellite loci in the inter-
tidal sponge Halichondria panicea. Molecular Ecology Notes, 3,
560–562.Koressaar T, Remm M (2007) Enhancements and modifications of
primer design program PRIMER3. Bioinformatics, 23, 1289–1291.Lee TN (1975) Florida current spin-off eddies. Deep-Sea
Research, 22, 753–763.Lee TN, Mayer DA (1977) Low-frequency current variability
and spin-off Southeast Florida. Journal of Marine Research, 35,
193–220.Lee TN, Williams E (1999) Mean distribution and seasonal var-
iability of coastal currents and temperature in the Florida
Keys with implications for larval recruitment. Bulletin of Mar-
ine Science, 64, 35–56.Lee TN, Rooth C, Williams E et al. (1992) Influence of Florida
Current, gyres and wind-driven circulation on transport of
larvae and recruitment in the Florida Keys coral reefs. Conti-
nental Shelf Research, 12, 971–1002.Lee TN, Clarke ME, Williams E, Szmant AF, Berger T (1994)
Evolution of the Tortugas Gyre and its influence on recruit-
ment in the Florida Keys. Bulletin of Marine Science, 54, 621–646.
Loh TS, Pawlik J (2014) Chemical defenses and resource trade-
offs structure sponge communities on Caribbean coral reefs.
Proceedings of the National Academy of Sciences, USA, 111,
4151–4156.Lopez-Legentil S, Pawlik JR (2009) Genetic structure of the
Caribbean giant barrel sponge Xestospongia muta using the
I3-M11 partition of COI. Coral Reefs, 28, 157–165.L�opez-Victoria M, Zea S (2004) Storm-mediated coral coloniza-
tion by an excavating Caribbean sponge. Climate Research, 26,
251–256.Maldonado M (2006) The ecology of the sponge larva. Canadian
Journal of Zoology, 84, 175–194.Maldonado M, Bergquist P (2002) Phylum Porifera. In: Atlas of
Marine Invertebrate Larvae (ed. Young C), pp. 21–50. Aca-
demic Press, Barcelona, Espa~na.
Mariani S, Uriz MJ, Turon X (2000) Larval bloom of the ovipa-
rous sponge Cliona viridis: coupling of larval abundance and
adult distribution. Marine Biology, 137, 783–790.
© 2015 John Wiley & Sons Ltd
1464 A. CHAVES- FONNEGRA ET AL.

Mariani S, Uriz MJ, Turon X, Alcoverro T (2006) Dispersal
strategies in sponge larvae: integrating the life history of
larvae and the hydrologic component. Oecologia, 146, 174–184.
McGoldrick DJ, Hedgecock D, English LJ, Baoprasertkul P,
Ward RD (2000) The transmission of microsatellite alleles in
Australian and North American stocks of the Pacific oyster
(Crassostrea gigas): selection and null alleles. Journal of Shell-
fish Research, 19, 779–788.Meroz E, Ilan M (1995) Life history characteristics of a coral
reef sponge. Marine Biology, 124, 443–451.Mitton JB, Berg CJ Jr, Orr KS (1989) Population structure, larval
dispersal, and gene flow in the queen conch, Strombus gigas,
of the Caribbean. Biological Bulletin, 177, 356–362.Paetkau D, Calvert W, Sterling I, Strobeck C (1995) Microsatel-
lite analysis of population-structure in Canadian polar bears.
Molecular Ecology, 4, 347–354.Paetkau D, Slade R, Burden M, Estoup A (2004) Genetic assign-
ment methods for the direct, real-time estimation of migra-
tion rate: a simulation-based exploration of accuracy and
power. Molecular Ecology, 13, 55–65.Park SDE (2001) Trypanotolerance in West African cattle and the
population genetic effects of selection. PhD Dissertation, Univer-
sity of Dublin.
Pawlik JR (2011) The chemical ecology of sponges on Carib-
bean reefs: natural products shape natural systems. BioSci-
ence, 61, 888–898.Peakall R, Smouse PE (2006) GENALEX 6: genetic analysis in
Excel. Population genetic software for teaching and research.
Molecular Ecology Notes, 6, 288–295.Peakall R, Smouse PE (2012) GENALEX 6.5: genetic analysis in
Excel. Population genetic software for teaching and research
– an update. Bioinformatics, 28, 2537–2539.Piry S, Alapetite A, Cornuet JM et al. (2004) GENECLASS2: a soft-
ware for genetic assignment and first-generation migrant
detection. Journal of Heredity, 95, 536–539.Plough LV, Marko PB (2014) Characterization of microsatellite
loci and repeat density in the gooseneck barnacle, Pollicipes
elegans, using next generation sequencing. Journal of Heredity,
105, 136–142.Pomponi SA (1979) Cytochemical studies of acid phosphatase
in etching cells of boring sponges. Journal of the Marine Bio-
logical Association of the United Kingdom, 59, 785–789.Prada C, Hellberg ME (2013) Long prereproductive selection
and divergence by depth in a Caribbean candelabrum coral.
Proceedings of the National Academy of Sciences, USA, 110,
3961–3966.Pritchard JK, Stephens M, Donnellya P (2000) Inference of pop-
ulation structure using multilocus genotype data. Genetics,
155, 945–959.Rannala B, Mountain JL (1997) Detecting immigration by using
multilocus genotypes. Proceedings of the National Academy of
Sciences, USA, 94, 9197–9201.Raymond M, Rousset F (1995a) An exact test for population
differentiation. Evolution, 49, 1280–1283.Raymond M, Rousset F (1995b) GENEPOP (version 1.2): popula-
tion genetics software for exact tests and ecumenicism. Jour-
nal of Heredity, 86, 248–249.Reece KS, Ribeiro WL, Gaffney PM, Carnegie RB, Allen SK
(2004) Microsatellite marker development and analysis in the
eastern oyster (Crassostrea virginica): confirmation of null
alleles and non-mendelian segregation ratios. Journal of
Heredity, 95, 346–352.Rice WR (1989) Analyzing tables of statistical tests. Evolution,
43, 223–225.Richards V (2010) Genetic Connectivity and Microevolution of Reef
Associated Taxa, p. 208. Nova Southeastern University, Dania
Beach, FL.
Rose CS, Risk MJ (1985) Increase in Cliona delitrix infestation of
Montastraea cavernosa heads on an organically polluted por-
tion of the Grand Cayman. P.S.Z.N.I Marine Ecology, 6, 345–363.
Rosenberg NA (2004) DISTRUCT: a program for the graphical dis-
play of population structure. Molecular Ecology Notes, 4, 137–138.
Rousset F (1997) Genetic differentiation and estimation of gene
flow from Fstatistics under isolation by distance. Genetics,
145, 1219–1228.Rousset F (2008) GENEPOP’007: a complete reimplementation of
the GENEPOP software for Windows and Linux. Molecular Ecol-
ogy Resources, 8, 103–106.Rua C, Zilberberg C, Sole-Cava AM (2011) New polymorphic
mitochondrial markers for sponge phylogeography. Journal of
the Marine Biological Association of the United Kingdom, 91,
1015–1022.R€utzler K (1975) The role of burrowing sponges in bioerosion.
Oecologia, 19, 203–216.R€utzler K (1978) Sponges in coral reefs. In: Coral Reefs: Research
Methods. Monographs in Oceanographic Methodology (eds Stod-
dard DR, Johannes RE), pp. 299–313. UNESCO, Paris.
R€utzler K (2002) Impact of crustose clionid sponges on Carib-
bean reef corals. Acta Geologica Hisp�anica, 37, 61–72.Sara M, Mensi P, Manconi R, Bavestrello G, Balleto E (1988)
Genetic variability in the Mediterranean populations of Tet-
hya (Porifera: Demospongiae). In: Reproduction, Genetics and
Distribution of Marine Organisms (eds Ryland JS, Tyler PA),
pp. 293–298. Olsen and Olsen, Fredesnborg, Denmark.
Schuelke M (2000) An economic method for the fluorescent
labeling of PCR fragments. Nature Biotechnology, 18, 233–234.Serrano X (2013) Horizontal vs. vertical connectivity in Caribbean
reef corals: identifying potential sources of recruitment following
disturbance. Doctoral Dissertation, University of Miami.
Serrano X, Baums IB, O’Reilly K et al. (2014) Geographic differ-
ences in vertical connectivity in the Caribbean coral Montast-
raea cavernosa despite high levels of horizontal connectivity
at shallow depths. Molecular Ecology, 23, 4226–4240.Silberman JD, Sarver SK, Walsh PJ (1994) Mitochondrial DNA
variation and population structure in the spiny lobster Panu-
lirus argus. Marine Biology, 120, 601–608.Slatkin M (1985) Rare alleles as indicators of gene flow. Evolu-
tion, 39, 53–65.van Soest R (2013) Cliona delitrix Pang, 1973. World Porifera
database at http://www.marinespecies.org/porifera/porif-
era.php?p=taxdetails&id=170437 on 2014-03-25. In: (2013)
World Porifera database. (eds Van Soes RWM, Boury-Esnaul
N, Hoope JNA, R€utzle K, de Voog NJ, Alvarez de Glasb B,
Hajd E, Piser AB, Mancon R, Schoenber C, Janusse D,
Tabachnic KR, Klauta M, Picto B, Kell M, Vacele J, Dohrman
M, D�ıa M-C, C�ardena P).
Sol�e-Cava AM, Thorpe JP (1986) Genetic differentiation
between morphotypes of the marine sponge Suberites ficus
(Demospongiae: Hadromerida). Marine Biology, 93, 247–253.
© 2015 John Wiley & Sons Ltd
POPULATION GENETICS OF THE SPONGE CLIONA DELITRIX 1465
Stubler AD, Furman BT, Peterson BJ (2014) Effects of pCO2 on
the interaction between an excavating sponge, Cliona varians,
and a hermatypic coral, Porites furcata. Marine Biology, 161,
1851–1859.Untergrasser A, Cutcutache I, Koressaar T et al. (2012) PRIMER3 –
new capabilities and interfaces.Nucleic Acids Research, 40, e115.
Uriz MJ, Maldonado M, Turon X, Mart�ı R (1998) How do
reproductive output, larval behaviour, and recruitment con-
tribute to adult spatial patterns in Mediterranean encrusting
sponges? Marine Ecology Progress Series, 167, 137–148.Vollmer SV, Palumbi SR (2007) Restricted gene flow in the Carib-
bean staghorn coral Acropora cervicornis: implications for the
recovery of endangered reefs. Journal of Heredity, 98, 40–50.Waples RS, Gaggiotti O (2006) What is a population? An
empirical evaluation of some genetic methods for identifying
the number of gene pools and their degree of connectivity.
Molecular Ecology, 15, 1419–1439.Warburton FE (1958) Reproduction of fused larvae in the bor-
ing sponge Cliona celata Grant. Nature, 181, 493–494.Warburton FE (1966) The behavior of sponge larvae. Ecology,
47, 672–674.Ward-Paige CA, Risk MJ, Sherwood OA, Jaap WC (2005) Clio-
nid sponge surveys on the Florida Reef Tract suggest land-
based nutrient inputs. Marine Pollution Bulletin, 51, 570–579.Wisshak M, Sch€onberg CHL, Form A, Freiwald A (2012) Ocean
acidification accelerates reef bioerosion. PLoS ONE, 7, 1–8.W€orheide G, Sol�e-Cava AM, Hooper JNA (2005) Biodiversity,
molecular ecology and phylogeography of marine sponges:
patterns, implications and outlooks. Integrative and Compara-
tive Biology, 45, 377–385.Wulff J (1984) Sponge-mediated coral reef growth and rejuve-
nation. Coral Reefs, 3, 157–163.Wulff J, Buss L (1979) Do sponges help hold coral reefs
together? Nature, 281, 474–475.Zilberberg C, Maldonado M, Sol�e-Cava AM (2006) Assessment
of the relative contribution of asexual propagation in a popu-
lation of the coral-excavating sponge Cliona delitrix from the
Bahamas. Coral Reefs, 25, 297–301.Zundelevich A, Lazar B, Ilan M (2007) Chemical versus mechani-
cal bioerosion of coral reefs by boring sponges – lessons from
Pione cf. vastifica. Journal of Experimental Biology, 210, 91–96.
A.C-F. and J.V.L. Research concept and design; A.C-F.,
K.A.F., J.S. and J.V.L. Collection and/or assembly of
data; A.C-F. and K.A.F. Data analysis and interpreta-
tion; A.C-F. and K.A.F. Statistical analysis; A.C-F. Writ-
ing the article; A.C-F., K.A.F. and J.V.L. Critical revision
of the article and A.C-F., K.A.F., J.S. and J.V.L. Final
approval of the article
Data accessibility
Microsatellite data were deposited into Dryad.
doi:10.5061/dryad.8942f.
Supporting information
Additional supporting information may be found in the online ver-
sion of this article.
Appendix S1 DRYAD file.
Fig. S1 Assignment of Cliona delitrix individual genotypes to
genetically homologous groups (K) as inferred by Bayesian
analyses using admixture and admixture + locprior models in
STRUCTURE, with 6 unlinked loci for 200 000 burn-in iterations,
in ten replicate sets, followed by 200 000 Markov chain Monte
Carlo (MCMC) repetitions.
Table S1 Supporting information. Characteristics of the 10 new
microsatellites loci isolated from Cliona delitrix.
Table S2 Cross amplification success of the 10 loci from Cliona
delitrix on eight individuals (n = 8) of C. laticavicola.
Table S3 Unbiased exact tests P-values obtained to test for
Linkage equilibrium (LE) as implemented in GENEPOP v.4.2 on
the web (Raymond and Rousset 1995; Rousset 2008).
Table S4 Linkage disequilibrium correlation coefficient (rLD)
for all microsatellite loci pairs (using10 loci) calculated by loca-
tion and globally.
Table S5 Summary of genetic variation and null allele frequen-
cies at each locus.
Table S6 Plateau records to define the number of genetic clus-
ters based on iterative reallocation by Paetkau multilocus maxi-
mum likelihood implemented in FLOCK 3.1. (Duchesne &
Turgeon 2012).
© 2015 John Wiley & Sons Ltd
1466 A. CHAVES- FONNEGRA ET AL.