Embed Size (px)
Citation preview
Population &the Land
IntroductionPopulation Growth RatesA Sustainable SocietyModification of Natural SystemsThe Land EthicThe BiosphereEcosystems & BiomesBiodiversity & Species PreservationSummary
Who cannot wonder at this harmony of things, at this symphony of naturewhich seems to will the well-being of the world?
Cicero
Population, when unchecked, increases in a geometrical ratio.Subsistence increases only in an arithmetical ratio. A slight acquaintancewith numbers will show the immensity of the first power in comparisonwith the second.
Thomas Malthus

2
Introduction• Increasing human populations place increasing stresses on
Earth’s finite resources.• It currently takes about 11 years to add a billion people to
Earth.• Current global population is just over 6 billion.
English curate, Thomas Malthus, published a famous essay onpopulation growth in 1798 in which he predicted thatpopulation size would grow faster than agricultural productionresulting in a lack of future food supplies. Although Malthuscorrectly identified the upward trend of population growth, hedid not anticipate concomitant advances in food production andresource extraction that would meet the physical and materialneeds of the burgeoning global population.
However, Malthus's basic observation remains true,population-related trends expand exponentially by a constantrate, for example, 2% per year, whereas agricultural trendstypically increase arithmetically by a constant value, such as2,000 tons per year (Fig. 1). For example, compare the rate ofincrease in irrigated farmland worldwide (three millionhectares per year) with the growth in number of telephone lines(5% per year). The second section of this chapter considershow population growth rates have varied with time and theimplications for global population distributions in the next
century.
Population DistributionA third of the world’s population lives in just two countries,China and India, out of 227 nations, and just over half of theworld's people live in six nations (Fig. 2; China, India, U.S.,Indonesia, Brazil, and Russia).
Figure 1. Arithmeticvs. exponentialincreases. The areaof irrigated farmlandhas increased by anear-constant valueeach year (~3 millionhectares per year, anarithmetic increase),whereas the numberof telephone linesincreased at aconstant rate (~5%per year, anexponential increase)since 1960. Anexponential increasecreates the concave-upward graph shownon the right,sometimes called a J-curve.
3
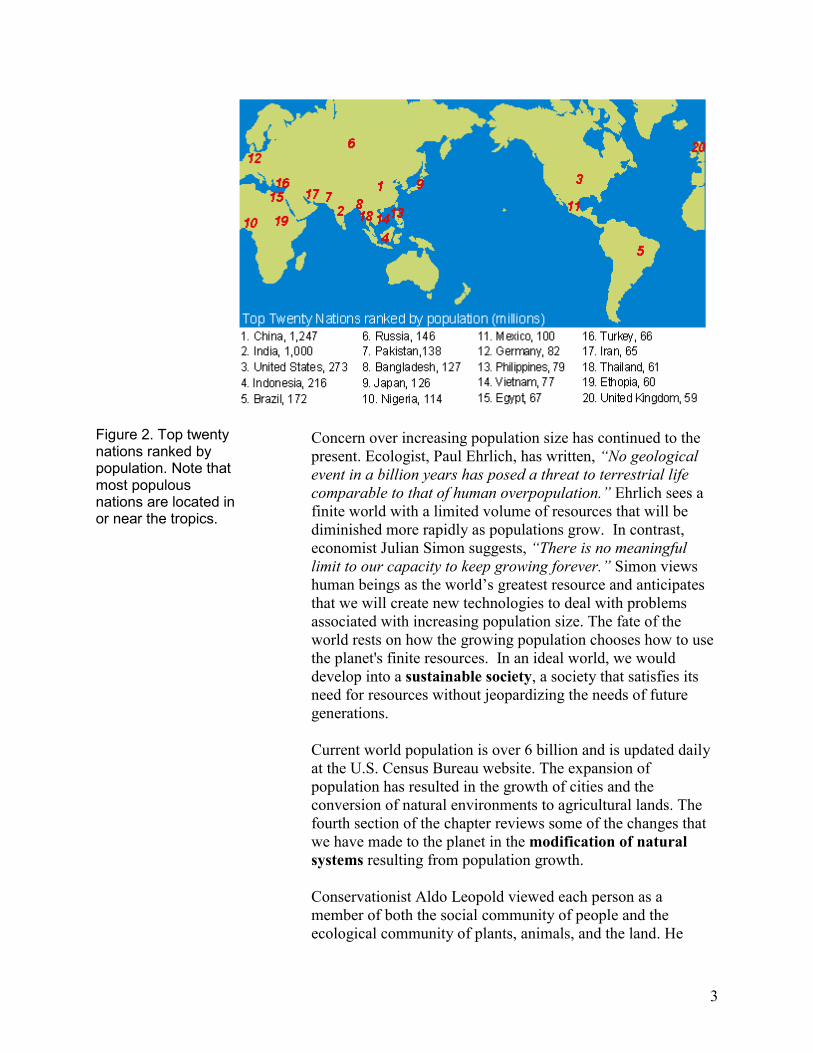
Concern over increasing population size has continued to thepresent. Ecologist, Paul Ehrlich, has written, “No geologicalevent in a billion years has posed a threat to terrestrial lifecomparable to that of human overpopulation.” Ehrlich sees afinite world with a limited volume of resources that will bediminished more rapidly as populations grow. In contrast,economist Julian Simon suggests, “There is no meaningfullimit to our capacity to keep growing forever.” Simon viewshuman beings as the world’s greatest resource and anticipatesthat we will create new technologies to deal with problemsassociated with increasing population size. The fate of theworld rests on how the growing population chooses how to usethe planet's finite resources. In an ideal world, we woulddevelop into a sustainable society, a society that satisfies itsneed for resources without jeopardizing the needs of futuregenerations.
Current world population is over 6 billion and is updated dailyat the U.S. Census Bureau website. The expansion ofpopulation has resulted in the growth of cities and theconversion of natural environments to agricultural lands. Thefourth section of the chapter reviews some of the changes thatwe have made to the planet in the modification of naturalsystems resulting from population growth.
Conservationist Aldo Leopold viewed each person as amember of both the social community of people and theecological community of plants, animals, and the land. He
Figure 2. Top twentynations ranked bypopulation. Note thatmost populousnations are located inor near the tropics.

4
termed this concept the land ethic, and we use his idea as aspringboard to discuss humans impact on the other members ofthe biosphere in the final sections of the chapter. Leopoldsuggested that just as in society where we have certainobligations and privileges, we have similar constraints on ourbehavior as members of an ecological community.
Modern biology was born in the mind of Charles Darwin onthe Galapagos Islands (Fig. 3) in 1835. It was here thatDarwin’s observation “that the different islands to aconsiderable extent are inhabited by a different set of beings”identified the concept of the ecosystem that links organisms tospecific physical environments. The penultimate section of thechapter reviews the characteristics of the biosphere includingthe flow of energy and nutrients between organisms and thephysical environment. The Galapagos ecosystems of Darwin’stime still exist but, like many elements of the biosphere, areincreasingly endangered by human activities. Native specieshave been threatened by invaders such as goats, pigs, dogs, andrats, introduced to the islands following the arrival ofEuropeans in the sixteenth century. Recent programs havesuccessfully removed invasive pests from some islands and thenative vegetation has rebounded as a result.
The presence of increasing numbers of people, all attempting toimprove their standard of living, places greater stress on theenvironment, not only from the perspective of resource use, butalso from pollution of air and water, and from the need todispose of larger volumes of waste. To evaluate the impact ofhuman activity on nature we must first identify the parametersthat influence the distribution of specific associations of plantsand animals at a regional scale. These associations are termedbiomes and are composed of multiple interrelated ecosystems.The final sections of the chapter, ecosystems & biomes andbiodiversity & species preservation review the major biomesof the world, the human activities that impact the natural order,and efforts to preserve species that are threatened by extinction.
Figure 3. View ofGalapagos Islandsfrom space. Imagecourtesy of NASA.

5
Population Growth Rates• Global population is expected to stabilizeto between 10 to
11 billion because of declining population growth rates.• Population growth rates have been in decline since the
early 1960s.• Population growth is dependent upon current population
size and growth rate.• Current population growth rate is approximately 1.3%.
Seventy-eight million people are added to the planet annually,approximately the population of Vietnam (the world's 14thmost populous nation). An additional billion people are addedto the world's population every 12 to 13 years at current growthrates. At that rate, world population would be over 14 billionby the end of the next century. However, the good news is thatpopulation growth rates have declined by approximately athird in the last few decades. The continued decline in growthrates is expected to result in a global population of around 10billion by the year 2100 (Fig. 4).
The Basics of Population GrowthPopulation growth rates are determined by the balance betweenthe number of people added to a nation's population by birthand immigration and the number who are lost through death oremigration.
Population = birth rate - death rate + immigration - emigrationgrowth rate
Population growth in the U.S. is determined by:• Birth rate of 14 per 1,000 people.• Immigration of ~4 per 1,000 people.• Death rate of 9 per 1,000 people.• Emigration is negligible.• The U.S. population growth rate is 14 + 4 – 9 = 9 per 1,000
people, or 0.9%.
Figure 4. Graph ofworld population inthe past andprojected into thefuture. Note: the timescale increases inirregular intervals.
6
Without ongoing immigration, U.S. natural population growthrates would approach 0.5%. Population changes in individualnations may result from an influx or an outflow of refugeesfleeing persecution. Over 22 million people were recognized asrefugees by the United Nations (UN) in 1998. Approximately2.6 million citizens of Afghanistan were displaced by internalconflicts. Many of these people fled to Iran which saw itspopulation increase by 2 million. Pakistan, Germany, and theU.S. all saw their populations increase by over a million peoplethe UN considered refugees.
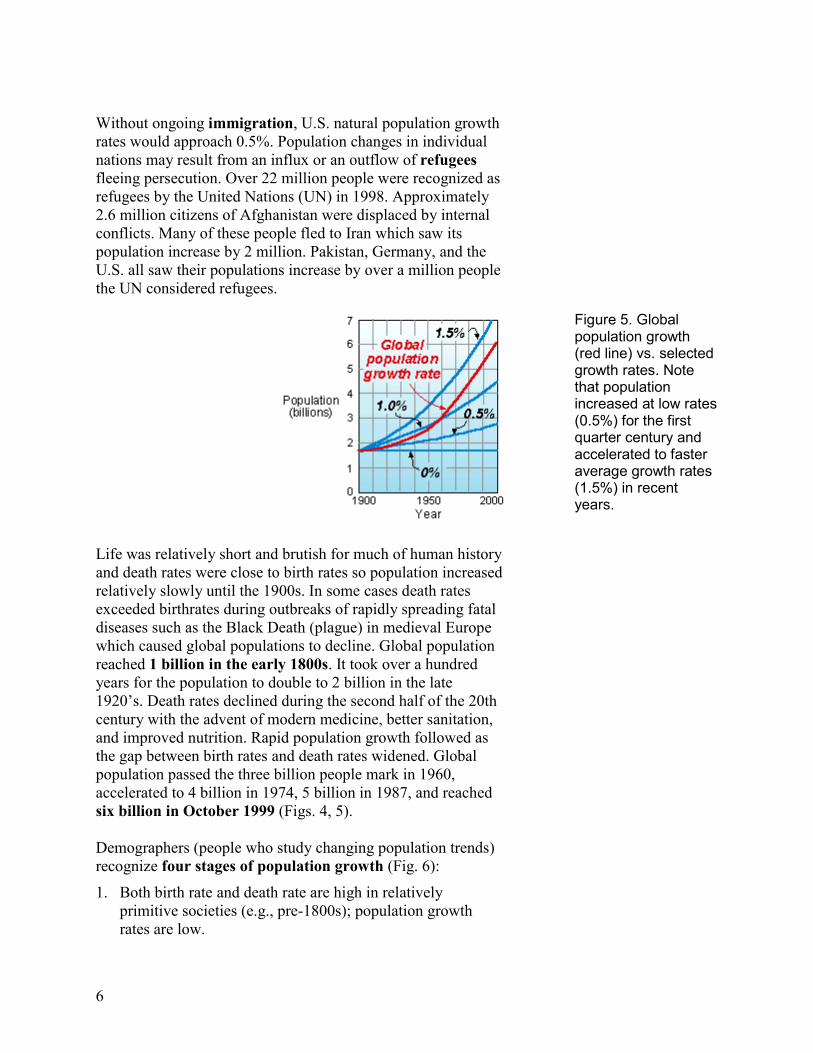
Life was relatively short and brutish for much of human historyand death rates were close to birth rates so population increasedrelatively slowly until the 1900s. In some cases death ratesexceeded birthrates during outbreaks of rapidly spreading fataldiseases such as the Black Death (plague) in medieval Europewhich caused global populations to decline. Global populationreached 1 billion in the early 1800s. It took over a hundredyears for the population to double to 2 billion in the late1920’s. Death rates declined during the second half of the 20thcentury with the advent of modern medicine, better sanitation,and improved nutrition. Rapid population growth followed asthe gap between birth rates and death rates widened. Globalpopulation passed the three billion people mark in 1960,accelerated to 4 billion in 1974, 5 billion in 1987, and reachedsix billion in October 1999 (Figs. 4, 5).
Demographers (people who study changing population trends)recognize four stages of population growth (Fig. 6):
1. Both birth rate and death rate are high in relativelyprimitive societies (e.g., pre-1800s); population growthrates are low.
Figure 5. Globalpopulation growth(red line) vs. selectedgrowth rates. Notethat populationincreased at low rates(0.5%) for the firstquarter century andaccelerated to fasteraverage growth rates(1.5%) in recentyears.
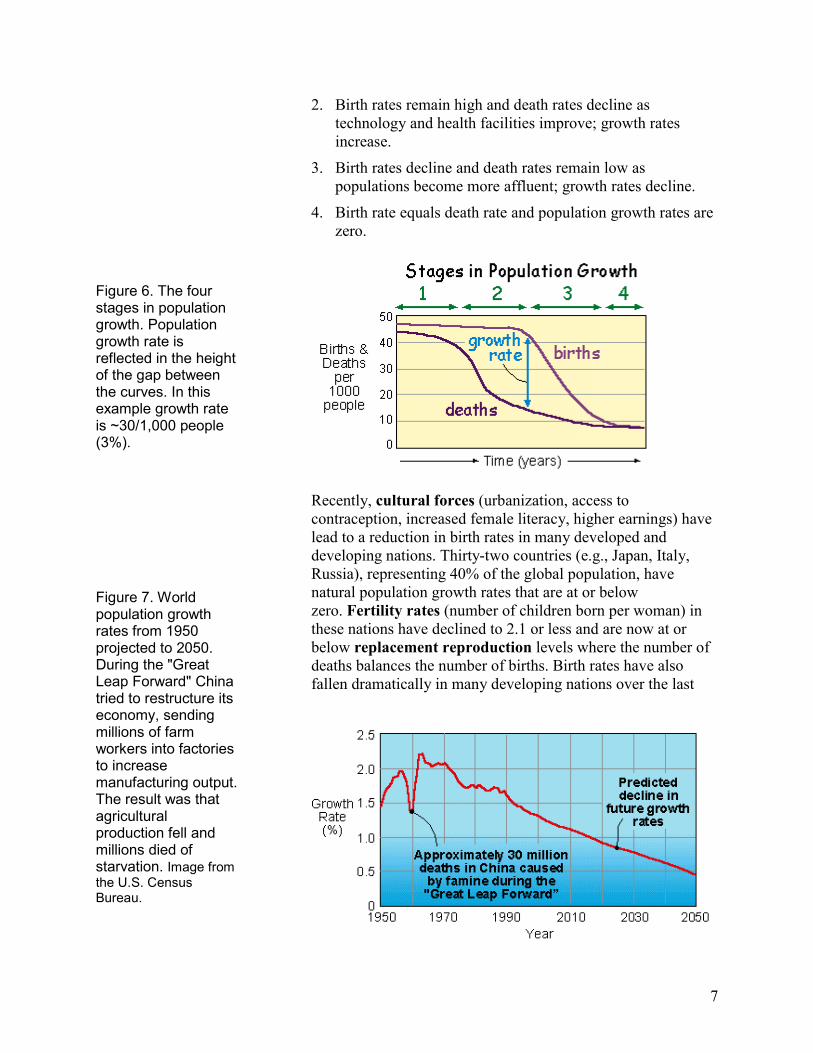
2. Birth rates remain high and death rates decline astechnology and health facilities improve; growth ratesincrease.
3. Birth rates decline and death rates remain low aspopulations become more affluent; growth rates decline.
4. Birth rate equals death rate and population growth rates arezero.
Recently, cultural forces (urbanization, access tocontraception, increased female literacy, higher earnings) havelead to a reduction in birth rates in many developed anddeveloping nations. Thirty-two countries (e.g., Japan, Italy,Russia), representing 40% of the global population, havenatural population growth rates that are at or belowzero. Fertility rates (number of children born per woman) inthese nations have declined to 2.1 or less and are now at orbelow replacement reproduction levels where the number ofdeaths balances the number of births. Birth rates have alsofallen dramatically in many developing nations over the last
Figure 6. The fourstages in populationgrowth. Populationgrowth rate isreflected in the heightof the gap betweenthe curves. In thisexample growth rateis ~30/1,000 people(3%).
Figure 7. Worldpopulation growthrates from 1950projected to 2050.During the "GreatLeap Forward" Chinatried to restructure itseconomy, sendingmillions of farmworkers into factoriesto increasemanufacturing output.The result was thatagriculturalproduction fell andmillions died ofstarvation. Image fromthe U.S. CensusBureau.
7
8
few decades. Fertility rates declined in Bangladesh, one of theworld's most densely populated nations, from 7 in 1975 to 3.3today.
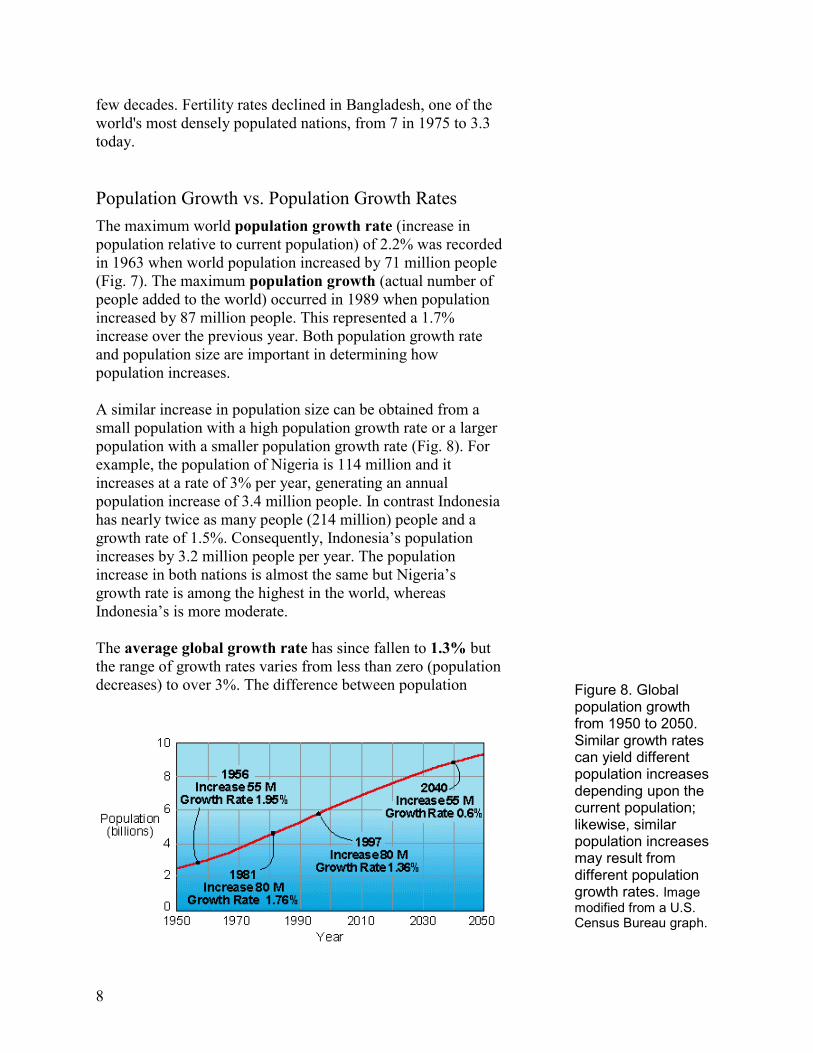
Population Growth vs. Population Growth RatesThe maximum world population growth rate (increase inpopulation relative to current population) of 2.2% was recordedin 1963 when world population increased by 71 million people(Fig. 7). The maximum population growth (actual number ofpeople added to the world) occurred in 1989 when populationincreased by 87 million people. This represented a 1.7%increase over the previous year. Both population growth rateand population size are important in determining howpopulation increases.
A similar increase in population size can be obtained from asmall population with a high population growth rate or a largerpopulation with a smaller population growth rate (Fig. 8). Forexample, the population of Nigeria is 114 million and itincreases at a rate of 3% per year, generating an annualpopulation increase of 3.4 million people. In contrast Indonesiahas nearly twice as many people (214 million) people and agrowth rate of 1.5%. Consequently, Indonesia’s populationincreases by 3.2 million people per year. The populationincrease in both nations is almost the same but Nigeria’sgrowth rate is among the highest in the world, whereasIndonesia’s is more moderate.
The average global growth rate has since fallen to 1.3% butthe range of growth rates varies from less than zero (populationdecreases) to over 3%. The difference between population Figure 8. Global
population growthfrom 1950 to 2050.Similar growth ratescan yield differentpopulation increasesdepending upon thecurrent population;likewise, similarpopulation increasesmay result fromdifferent populationgrowth rates. Imagemodified from a U.S.Census Bureau graph.
9
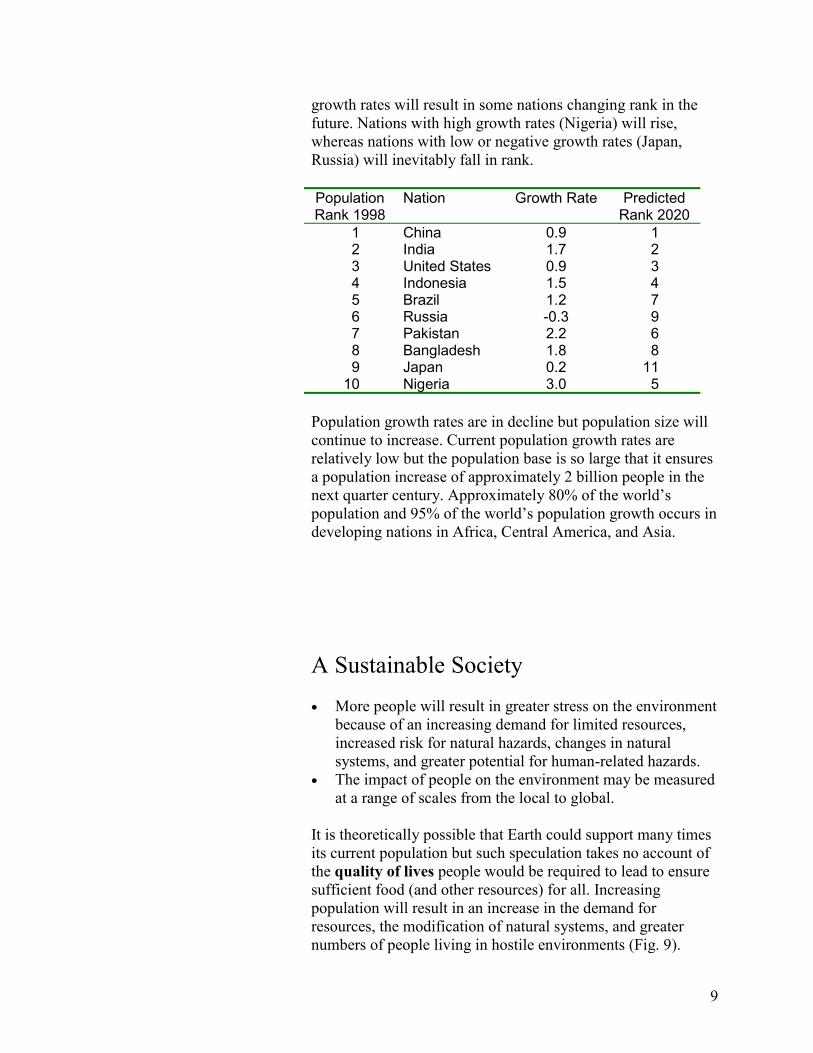
growth rates will result in some nations changing rank in thefuture. Nations with high growth rates (Nigeria) will rise,whereas nations with low or negative growth rates (Japan,Russia) will inevitably fall in rank.
PopulationRank 1998
Nation Growth Rate PredictedRank 2020
1 China 0.9 12 India 1.7 23 United States 0.9 34 Indonesia 1.5 45 Brazil 1.2 76 Russia -0.3 97 Pakistan 2.2 68 Bangladesh 1.8 89 Japan 0.2 11
10 Nigeria 3.0 5
Population growth rates are in decline but population size willcontinue to increase. Current population growth rates arerelatively low but the population base is so large that it ensuresa population increase of approximately 2 billion people in thenext quarter century. Approximately 80% of the world’spopulation and 95% of the world’s population growth occurs indeveloping nations in Africa, Central America, and Asia.
A Sustainable Society• More people will result in greater stress on the environment
because of an increasing demand for limited resources,increased risk for natural hazards, changes in naturalsystems, and greater potential for human-related hazards.
• The impact of people on the environment may be measuredat a range of scales from the local to global.
It is theoretically possible that Earth could support many timesits current population but such speculation takes no account ofthe quality of lives people would be required to lead to ensuresufficient food (and other resources) for all. Increasingpopulation will result in an increase in the demand forresources, the modification of natural systems, and greaternumbers of people living in hostile environments (Fig. 9).

10
Living standards are likely to impose the greatest constraintson future population growth.
Increasing the population of people on planet Earth will haveimpacts at a range of scales:• Global concerns (greenhouse effect, ozone depletion).• National problems (soil erosion, oil supply).• Regional issues (groundwater sources, air quality).• Local issues (pollution, waste disposal, urban sprawl).
When faced with a diminishing pool of resources, should it beour objective to grab as much as we can as quickly as possibleor should we deliberately use less on the premise that futuregenerations may one day need these resources? Citizens andgovernments of the developed nations in North America andEurope have protested loudly over the depletion of the tropicalrain forests. Yet they rarely point out that little of the originalforests of Europe and the United States remain. If a sustainableglobal future requires persuading individual nations like Braziland Zaire not to mow down their own trees, how will thesenations be compensated? Some developing nations may be ableto use otherwise scarce resources as a stepping stone toward amore prosperous future. However, nations with less to offercan do little more than protest their imperiled status.
Current estimates suggest a maximum global population ofover 10 billion people. In a finite world, how many people canthe planet support? If we are to reach the carrying capacity ofEarth (the maximum population with a given technology andsocial organization that Earth can support indefinitely) we willhave to create a sustainable society.
Figure 9. Contrastingimpact of humanactivity between thesparsely populatedcentral Wyomingcommunity of Hiland(that's it in thebackground) and themore denselypopulated city ofToronto, Canada. Thehuman impact onHiland is almostnegligible incomparison to thechanges in naturalsystems that occur inassociation withlarger cities.
11
Sustainable DevelopmentWhen humans first glimpsed the Earth from space it was fromthe Apollo 8 spacecraft orbiting the Moon in December 1968(Fig. 10). These early views of the planet from the inkydarkness of space helped illustrate for many the uniquewonders of the fragile environment we share on spaceshipEarth. Our isolation in space emphasizes our reliance on ourhome planet's resources.
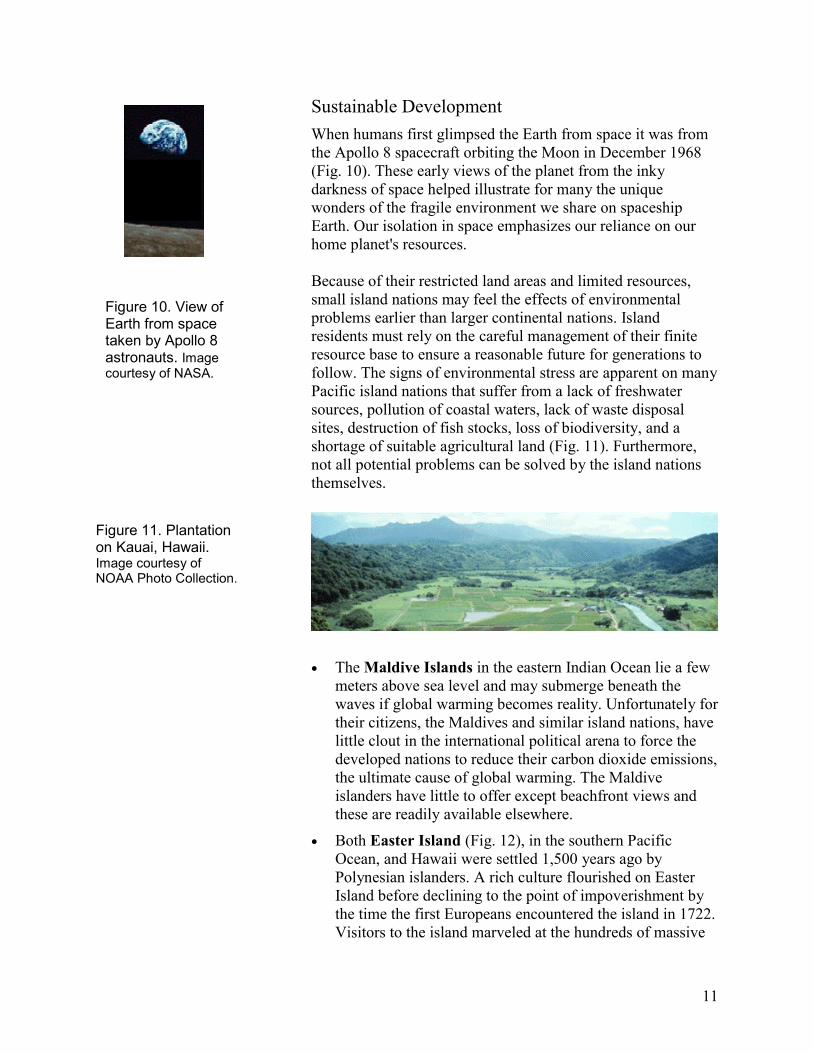
Because of their restricted land areas and limited resources,small island nations may feel the effects of environmentalproblems earlier than larger continental nations. Islandresidents must rely on the careful management of their finiteresource base to ensure a reasonable future for generations tofollow. The signs of environmental stress are apparent on manyPacific island nations that suffer from a lack of freshwatersources, pollution of coastal waters, lack of waste disposalsites, destruction of fish stocks, loss of biodiversity, and ashortage of suitable agricultural land (Fig. 11). Furthermore,not all potential problems can be solved by the island nationsthemselves.
• The Maldive Islands in the eastern Indian Ocean lie a fewmeters above sea level and may submerge beneath thewaves if global warming becomes reality. Unfortunately fortheir citizens, the Maldives and similar island nations, havelittle clout in the international political arena to force thedeveloped nations to reduce their carbon dioxide emissions,the ultimate cause of global warming. The Maldiveislanders have little to offer except beachfront views andthese are readily available elsewhere.
• Both Easter Island (Fig. 12), in the southern PacificOcean, and Hawaii were settled 1,500 years ago byPolynesian islanders. A rich culture flourished on EasterIsland before declining to the point of impoverishment bythe time the first Europeans encountered the island in 1722.Visitors to the island marveled at the hundreds of massive
Figure 10. View ofEarth from spacetaken by Apollo 8astronauts. Imagecourtesy of NASA.
Figure 11. Plantationon Kauai, Hawaii.Image courtesy ofNOAA Photo Collection.
12
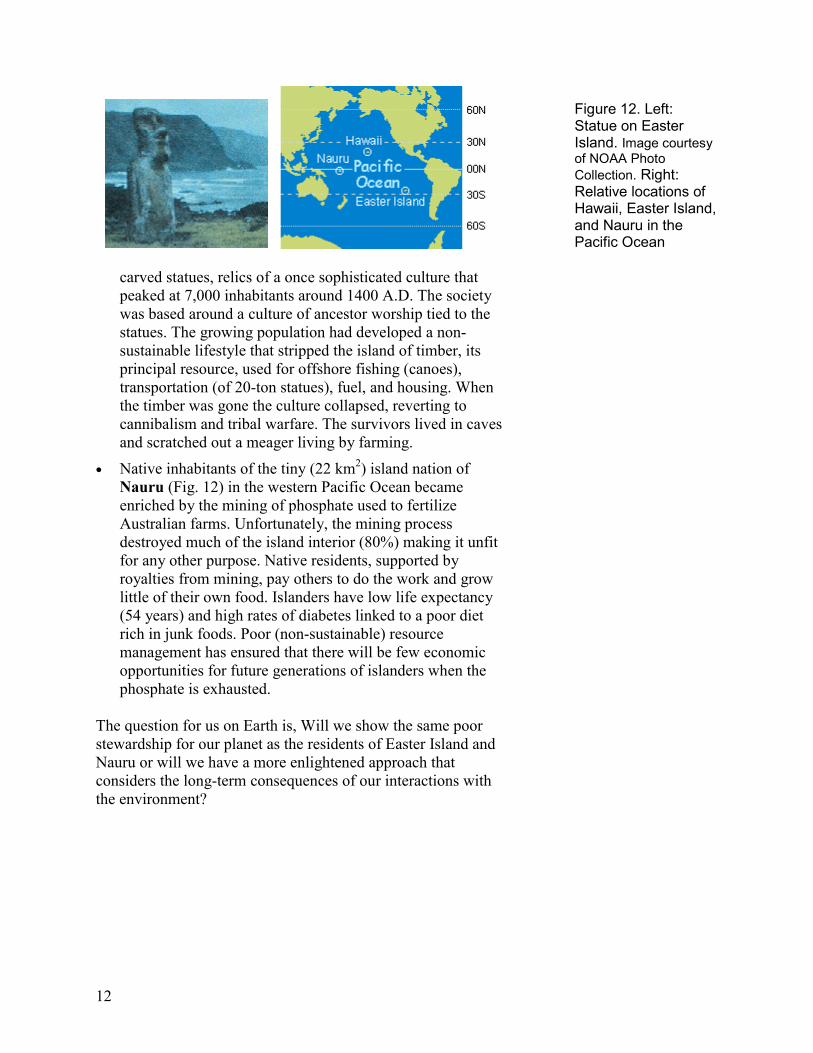
carved statues, relics of a once sophisticated culture thatpeaked at 7,000 inhabitants around 1400 A.D. The societywas based around a culture of ancestor worship tied to thestatues. The growing population had developed a non-sustainable lifestyle that stripped the island of timber, itsprincipal resource, used for offshore fishing (canoes),transportation (of 20-ton statues), fuel, and housing. Whenthe timber was gone the culture collapsed, reverting tocannibalism and tribal warfare. The survivors lived in cavesand scratched out a meager living by farming.
• Native inhabitants of the tiny (22 km2) island nation ofNauru (Fig. 12) in the western Pacific Ocean becameenriched by the mining of phosphate used to fertilizeAustralian farms. Unfortunately, the mining processdestroyed much of the island interior (80%) making it unfitfor any other purpose. Native residents, supported byroyalties from mining, pay others to do the work and growlittle of their own food. Islanders have low life expectancy(54 years) and high rates of diabetes linked to a poor dietrich in junk foods. Poor (non-sustainable) resourcemanagement has ensured that there will be few economicopportunities for future generations of islanders when thephosphate is exhausted.
The question for us on Earth is, Will we show the same poorstewardship for our planet as the residents of Easter Island andNauru or will we have a more enlightened approach thatconsiders the long-term consequences of our interactions withthe environment?
Figure 12. Left:Statue on EasterIsland. Image courtesyof NOAA PhotoCollection. Right:Relative locations ofHawaii, Easter Island,and Nauru in thePacific Ocean

13
Modification of Natural Systems• 38% of Earth’s land surface has been domesticated.• Both the area of grain producing lands and grain production
per person have declined in recent decades.• Wetlands provide many benefits for the environment.• Over half of U.S. wetlands have been drained for
agriculture or development.
The physical surface on which we live can represent anaesthetic, economic, and/or recreational resource. Land haslong held a special place in American culture. Belting out a fewverses of “America the Beautiful” should be enough toconvince anyone of the significance of the connection betweenAmericans and the land. The appeal of the New World tocolonists was the availability of land for the common man. TheUnited States grew by adding lands by purchase, by treaty, orby taking them in war. The nation’s early economic vitalitywas largely based upon resources from the land. Majesticunspoiled natural landscapes of the continent contrasted withoverdeveloped and overpopulated European nations. The land,and how it was used, have been a source of inspiration andconsternation for centuries.
Friction between economic forces that seek to use the land andcultural forces endeavoring to protect it continues to generatesome of the most heated debates on environmental policy inAmerica and elsewhere. Pressure to convert natural lands foragriculture and urbanization will only increase as populationincreases. Such increases are most acute in poor, denselypopulated nations that can’t afford the high cost of imports andmust rely on their land base to generate food to sustain theirpeople.
Domestication of Natural LandsApproximately 38% of Earth's surface has been"domesticated," converted to cropland, pasture, forestplantations, urban use, etc. The degree of domestication (Fig.13) depends upon the land area, population of the country, andcharacter of the landscape. Nations with relatively highpopulation densities typically have more domestication of land.For example, the small Asian nation of Bangladesh has 81%domestication and 9.2 people per hectare. In contrast, the U.S.has a 45% domestication rate and only 0.3 people per hectare.

14
(Note: a hectare = 2.5 acres.) However, some small nationswith large populations have relatively low levels ofdomestication because of the rugged nature of their landscape(e.g., Japan). Nation Land Area
(millionhectares)
Population(density per
hectare)
%Converted
AreaUnited States 957 0.28 45Brazil 846 0.19 28Australia 764 0.02 60India 297 3.25 61Bangladesh 13 9.60 81
One of the most significant effects of increasing urbanizationand development is the loss of agricultural lands, especiallylands that were originally situated close to cities and that wereused to grow grain crops (Fig. 14). Approximately 1% ofworld’s land area is dedicated to urban uses and representshome to nearly half (45%) of the world's population. Twenty-six million hectares (approximately the area of Wyoming) arededicated to urban uses in the U.S. Nearly half a millionhectares (467,000) of arable land in developing nations is lostannually to urbanization. More land is lost to the growth ofcities in nations with rapidly expanding urban populations.Population growth rates vary for the world’s largest cities, butare typically higher in developing nations and in nations withrapidly growing economies (e.g., China).
Rank City Population(millions)
Growth Rate(1990-95)
1 Tokyo, Japan 26.8 1.41%2 Sao Paulo, Brazil 16.4 2.01%3 New York, U.S. 16.3 0.34%4 Mexico City, Mexico 15.6 0.73%5 Bombay, India 15.1 4.22%
Figure 13.Domesticated landarea as a proportionof land available forcontinents andselected nations. Boldvalues represent landuse for selectedcontinents.
Figure 14. The city ofCleveland hasexpanded to the eastand west along thesouthern shore ofLake Erie.

15
The total land area available for grain production has decreasedin recent years but production has continued to increasebecause of the increased use of fertilizers and improvedfarming techniques (Fig. 15). Unfortunately, population growthhas increased more rapidly than grain production and grainproduction per person has declined for over a decade.Improved living standards have resulted in an increasingdemand for grain to support "Western-style" diets that includegrain-fed beef.
Valuable agricultural lands are lost to expanding cities. Thetotal area of land dedicated to growing grain crops hasremained essentially static since the early 1970’s but grainproduction has risen because of increased use of fertilizers andimprovements in agricultural methods.
Year World GrainArea (millionhectares)
World GrainProduction(million tons)
World GrainProduction perPerson(kilograms)
1955 639 759 2731975 708 1237 3031995 679 1703 299
The China SyndromeImproved living standards in developing nations have created agreater demand for meat and dairy products that are suppliedby domestic animals fed a diet of grains. Grain production perperson has steadily declined from a high of 342 kg in 1984 toless than 300 kg today. Continued declines in cropland areaand increases in population will make it increasingly difficultfor technological advances to meet the future demand for grain.Nowhere is this more evident than in China. China isundergoing a period of rapid industrialization as its economy isexpanding rapidly. This economic boom is fueling a rise inliving standards. Increasing affluence has meant more beef,
Figure 15. Changesin grain-producingarea and grainproduction from 1965to 1995.
16
pork, poultry, and eggs are consumed, resulting in anincreasing demand for grain to feed domestic livestock.
Industrial expansion is gobbling up cropland, and contributingto a decline in grain production. In 1994, China was a netexporter of 8 million tons of grain, but in 1995 it became a netgrain importer of 16 million tons. Some estimates suggest thatChinese grain imports will rise to at least 200 million tons by2030. If China’s grain consumption per person increases to thelevel of Taiwan today, consuming even more livestockproducts, then grain imports may approach 400 million tons.However, the important question is: Who can supply grain onthat scale? World grain exports are about 200 million tons peryear, of which the U.S. supplies about half. If China becomesthe 300-pound gorilla of world grain markets, other nationswill either go hungry or go broke.
The Land Ethic• Cultural forces are causing changes in Western views of
land use.• Approximately a third of the U.S. is made up of federal
lands.• The land ethic views each person as a member of an
ecological community.
With the passage of the 1785 Land Ordinance, governmentlands were opened for public sale in tidy squares of 640 acreseach. Unfortunately, land ownership didn't always ensure goodstewardship. Since the nation’s earliest days, poor farmingmethods have often depleted the soil and degraded the land.While the nation was young and the western lands beckoned,few concerned themselves with soil conservation. The landseemed to stretch unlimited to the west in comparison to theirEuropean homelands.
Even as the nation expanded westward, there were largesections of the public domain that were never sold. Nearly athird of the nation is made up of federal lands administered bya variety of government agencies (National Park Service, NPS;

17
National Forest Service, NFS; Fish and Wildlife Service, FWS;Bureau of Land Management, BLM). Much of this land may beleased for logging, grazing, or mining, or used for recreation.Of these public lands, the most heavily used are the nationalpark system, which is made up of over 50 parks plus nationalhistoric sites, battlefields, parkways, recreation areas, trails,seashores, and monuments. Although the National Park Servicewas not created until 1916, the first lands were set aside forpublic use by congress in 1832, when four square miles ofthermal springs were reserved near Hot Springs, Arkansas. Itwas in this same year that the artist, George Catlin, first wroteabout “a nation's park” that would preserve the buffalo and thenative cultures of the western plains. However, it was not until40 years later, in 1872, that Congress authorized Yellowstoneas the world's first national park.
The relative remoteness of sites like Yellowstone meant thatthey were enjoyed by an affluent clientele and they earned areputation as elitist vacation spots, until the advent of widelyavailable motorized transportation in early 1900s. Today, thereare more visitors to our national park system than there arepeople living in the U.S., and the parks suffer from theproblems attendant with such overcrowding. In Yellowstone'searliest days, its principal environmental concern waspoaching. Today, park officials must monitor many otherproblems, including (1) the development of surrounding landswhich fragments ecosystems essential to park animals, (2)water pollution from abandoned (and potential future) mines onadjoining federal lands, (3) increasing numbers ofconfrontations between visitors and park animals, and (4) theuse of thermal waters by others outside the park boundaries.
Historian, Frederick Jackson Turner, speaking at the 1893Columbian Exposition in Chicago, suggested that the frontierhad played a decisive role in creating the hallmarks of theAmerican character. Turner believed that life on the frontier ledto the development of personal traits such as pragmatism,individualism, materialism, nationalism, optimism, anddemocracy. Turner's view implied a type of social Darwinism
Figure 16. Nationalforest lands in theBlack Hills, SouthDakota

18
in which a niche was developed on the frontier forBunyanesque characters forging an American identity.
This theme of individualism and the frontier spirit it generatedhas remained a constant theme in American art, literature, andpolitics. In recent years, some westerners have taken symbolicsteps to demonstrate their opposition to the federalmanagement of public lands. Most of the initiative (sometimescalled wise use) comes from those using public lands forgrazing, logging, mining, or oil exploration. The public appearssympathetic to those whose land values have been diminishedby the effects of environmental legislation. Yet, they are morelikely to choose protection of the environment overdevelopment or property rights issues, and a majority favorcharging fees for grazing, drilling, mining, and logging onfederal lands.
Aldo Leopold was born at the end of the Nineteenth century,into a time when people’s impact on natural systems wasbecoming clear. Leopold, a trained forester, published theconservation classic A Sand County Almanac and SketchesHere and There, in 1949. The book included his seminal essay,The Land Ethic, wherein Leopold presented an argument infavor of the preservation of all elements of nature, which hecollectively considered as the land. The land ethic defined eachperson as a member of both the social community of peopleand the ecological community of plants, animals, and the land.He suggested that just as in society, where we have certainobligations and privileges, we have similar constraints on ourbehavior as members of an ecological community.
The Biosphere• The biosphere represents all animal and plant life on Earth
and the environments in which they live.• Ecology is the study of the interaction of organisms with
each other and their environment.• The stability of ecosystems are influenced by a
combination of abiotic and biotic factors.

19
• All organisms rely on the intake of energy from the Sun(plants) or through the consumption of plants (herbivores)and/or other animals (omnivores, carnivores).
• Some elements serve as essential nutrients for life in plantsand animals and move through the Earth system inbiogeochemical cycles.
• Most of Earth's biomass is concentrated in forests withtropical rain forests accounting for the most biomass persquare kilometer.
The biosphere represents life on Earth and is confined to arelatively narrow strip of the planet's surface that extends fromthe deepest portion of the ocean floor to the Himalayas highestmountains. The diversity of life on Earth ranges amongmillions of species, from the simplest single-cell organisms togiant marine mammals such as the blue whale. Ecology is thestudy of the interaction of organisms with each other and theirenvironment. Communities of organisms that inhabit specificphysical environments, defined primarily by their climate andlandforms, make up ecosystems. Best estimates suggest thatthere are from 5 to 30 million species worldwide. Biodiversity,the number of species in an ecosystem, varies depending uponthe characteristics of the individual ecosystems but is typicallygreatest in environments with warm temperatures, plentifulrainfall, and rich soils.
The stability of ecosystems are influenced by a combination ofbiotic (organic) and abiotic (non-organic, e.g., sunlight,precipitation) factors (Fig. 17). Where we choose to live islargely determined by the abiotic characteristics of our physicalenvironment (e.g., climate, landscape) and the availability ofbasic resources such as food. Other organisms are littledifferent. Individual abiotic factors may be limiting factors
Figure 17. Abioticenvironmental factorsthat influence thedistribution ofecosystems. Themajority of specieslive within the upper200 meters (660 feet)of the ocean(euphotic zone) andbelow 6200 m(20,500 feet) on land.
20
that can control the growth of an organism’s population in agiven area. For example, water quality controls fishpopulations in acidified lakes in the Adirondack Mountains ofNew York. Reproduction in lake trout ceased as lakes becameincreasingly contaminated by acid precipitation because ofupwind air pollution.
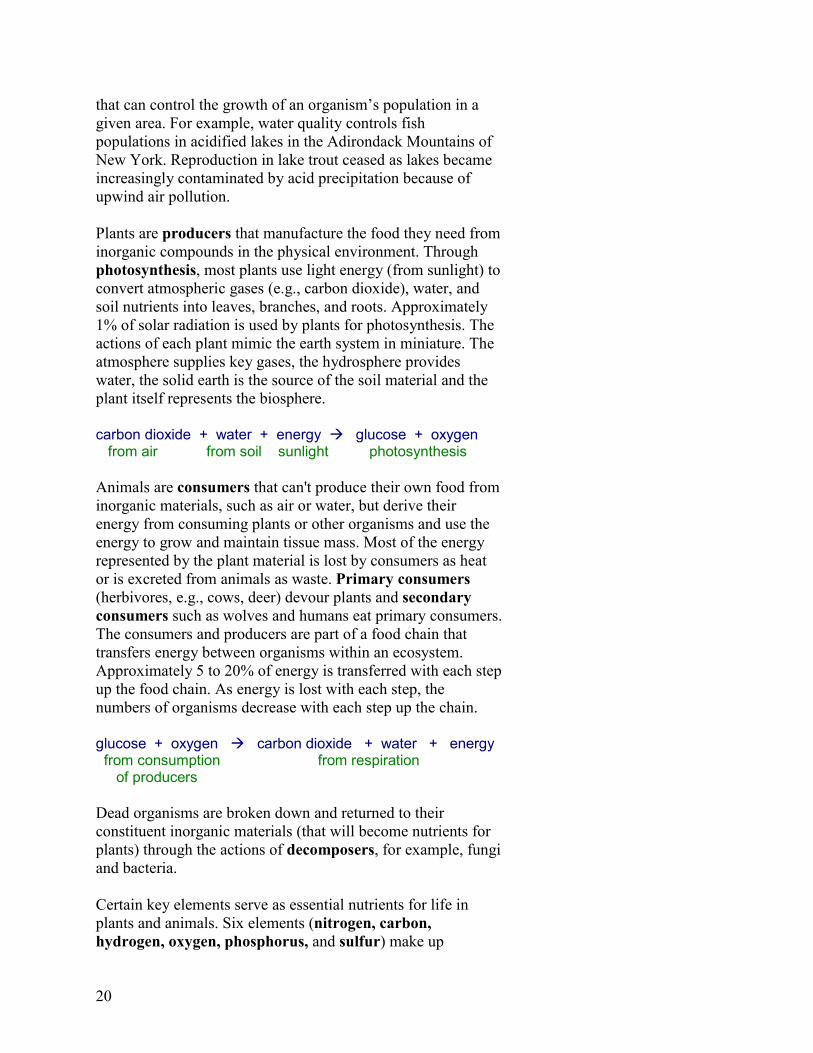
Plants are producers that manufacture the food they need frominorganic compounds in the physical environment. Throughphotosynthesis, most plants use light energy (from sunlight) toconvert atmospheric gases (e.g., carbon dioxide), water, andsoil nutrients into leaves, branches, and roots. Approximately1% of solar radiation is used by plants for photosynthesis. Theactions of each plant mimic the earth system in miniature. Theatmosphere supplies key gases, the hydrosphere provideswater, the solid earth is the source of the soil material and theplant itself represents the biosphere.
carbon dioxide + water + energy glucose + oxygen from air from soil sunlight photosynthesis
Animals are consumers that can't produce their own food frominorganic materials, such as air or water, but derive theirenergy from consuming plants or other organisms and use theenergy to grow and maintain tissue mass. Most of the energyrepresented by the plant material is lost by consumers as heator is excreted from animals as waste. Primary consumers(herbivores, e.g., cows, deer) devour plants and secondaryconsumers such as wolves and humans eat primary consumers.The consumers and producers are part of a food chain thattransfers energy between organisms within an ecosystem.Approximately 5 to 20% of energy is transferred with each stepup the food chain. As energy is lost with each step, thenumbers of organisms decrease with each step up the chain.
glucose + oxygen carbon dioxide + water + energy from consumption from respiration of producers
Dead organisms are broken down and returned to theirconstituent inorganic materials (that will become nutrients forplants) through the actions of decomposers, for example, fungiand bacteria.
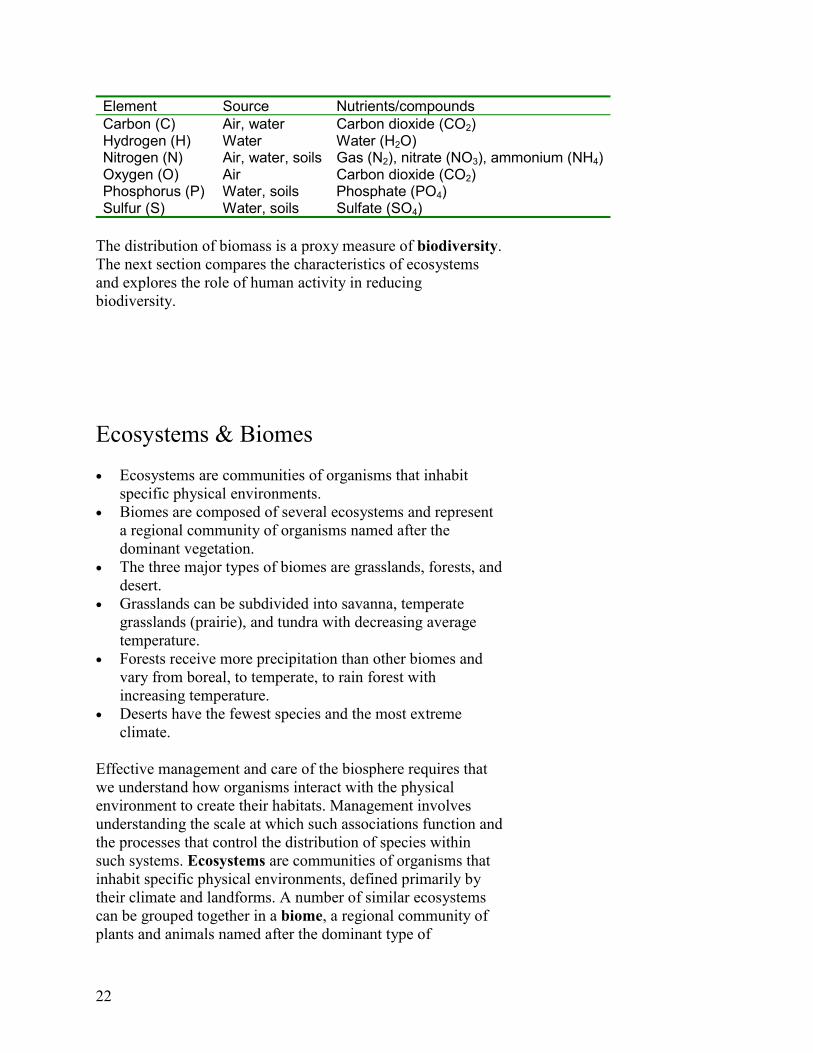
Certain key elements serve as essential nutrients for life inplants and animals. Six elements (nitrogen, carbon,hydrogen, oxygen, phosphorus, and sulfur) make up

21
approximately 95% of materials in plants and animals andcombine to form compounds that are essential nutrients for lifeon Earth. These and other elements pass through the Earthsystem in biogeochemical cycles (Fig. 18) that link togetherprocesses in the biosphere, atmosphere, hydrosphere, and solidearth.
The amount of organic material in an ecosystem is the biomassand can be divided into phytomass (plants) and zoomass(animals). The vast majority (99%) of biomass is phytomass.Phytomass represents a reservoir for key elements of chemicalcycles on Earth. Current debate over the role of tropical rainforests in sequestering carbon from the atmosphere and thusmoderating the potential impact of the global warmingillustrates how important it is to understand the distribution ofbiomass within the Earth system. Tropical rain forestsrepresent a third of Earth's biomass but cover only 7% of theland surface. All of the planet's forests account forapproximately three-quarters of all biomass on 20% of theland. In contrast, deserts cover about the same land area butaccount for less than 2% of biomass
Figure 18.Biogeochemicalcycles link some ofthe major elements ofthe Earth systemincluding carbon (C),nitrogen (N), oxygen(O), phosphorus (P),and sulfur (S).
22
Element Source Nutrients/compoundsCarbon (C) Air, water Carbon dioxide (CO2)Hydrogen (H) Water Water (H2O)Nitrogen (N) Air, water, soils Gas (N2), nitrate (NO3), ammonium (NH4)Oxygen (O) Air Carbon dioxide (CO2)Phosphorus (P) Water, soils Phosphate (PO4)Sulfur (S) Water, soils Sulfate (SO4)
The distribution of biomass is a proxy measure of biodiversity.The next section compares the characteristics of ecosystemsand explores the role of human activity in reducingbiodiversity.
Ecosystems & Biomes• Ecosystems are communities of organisms that inhabit
specific physical environments.• Biomes are composed of several ecosystems and represent
a regional community of organisms named after thedominant vegetation.
• The three major types of biomes are grasslands, forests, anddesert.
• Grasslands can be subdivided into savanna, temperategrasslands (prairie), and tundra with decreasing averagetemperature.
• Forests receive more precipitation than other biomes andvary from boreal, to temperate, to rain forest withincreasing temperature.
• Deserts have the fewest species and the most extremeclimate.
Effective management and care of the biosphere requires thatwe understand how organisms interact with the physicalenvironment to create their habitats. Management involvesunderstanding the scale at which such associations function andthe processes that control the distribution of species withinsuch systems. Ecosystems are communities of organisms thatinhabit specific physical environments, defined primarily bytheir climate and landforms. A number of similar ecosystemscan be grouped together in a biome, a regional community ofplants and animals named after the dominant type of
23
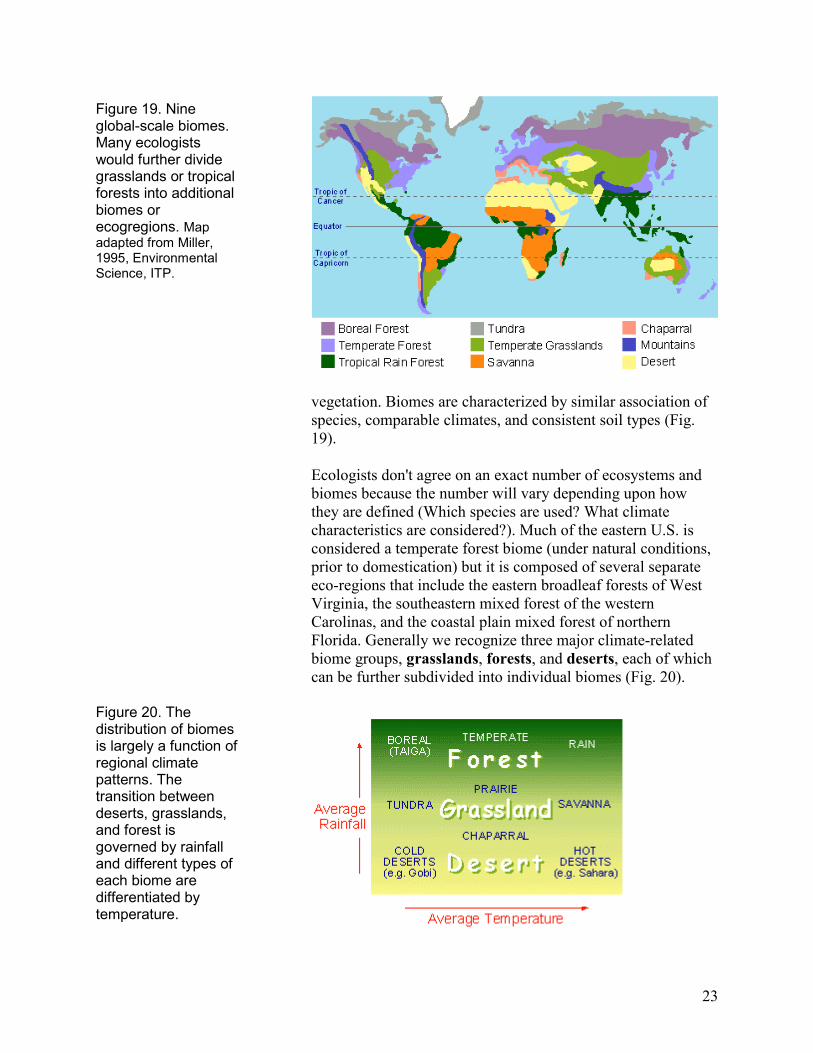
vegetation. Biomes are characterized by similar association ofspecies, comparable climates, and consistent soil types (Fig.19).
Ecologists don't agree on an exact number of ecosystems andbiomes because the number will vary depending upon howthey are defined (Which species are used? What climatecharacteristics are considered?). Much of the eastern U.S. isconsidered a temperate forest biome (under natural conditions,prior to domestication) but it is composed of several separateeco-regions that include the eastern broadleaf forests of WestVirginia, the southeastern mixed forest of the westernCarolinas, and the coastal plain mixed forest of northernFlorida. Generally we recognize three major climate-relatedbiome groups, grasslands, forests, and deserts, each of whichcan be further subdivided into individual biomes (Fig. 20).
Figure 19. Nineglobal-scale biomes.Many ecologistswould further dividegrasslands or tropicalforests into additionalbiomes orecogregions. Mapadapted from Miller,1995, EnvironmentalScience, ITP.
Figure 20. Thedistribution of biomesis largely a function ofregional climatepatterns. Thetransition betweendeserts, grasslands,and forest isgoverned by rainfalland different types ofeach biome aredifferentiated bytemperature.
24
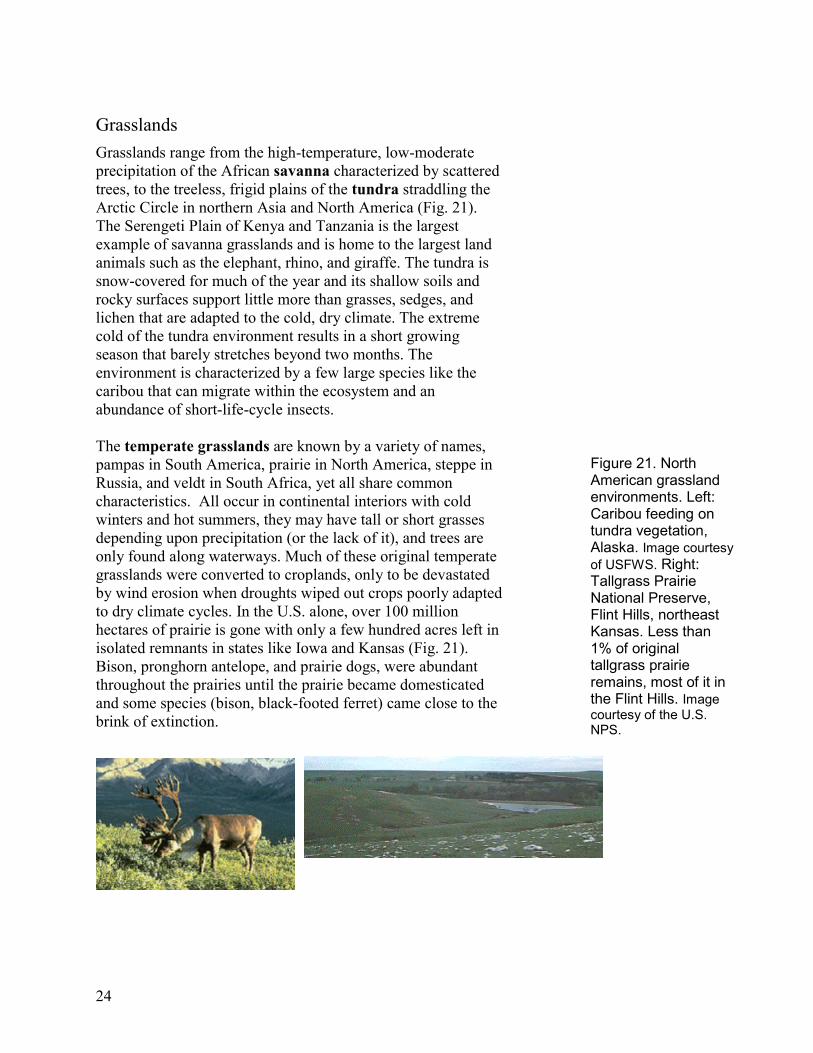
GrasslandsGrasslands range from the high-temperature, low-moderateprecipitation of the African savanna characterized by scatteredtrees, to the treeless, frigid plains of the tundra straddling theArctic Circle in northern Asia and North America (Fig. 21).The Serengeti Plain of Kenya and Tanzania is the largestexample of savanna grasslands and is home to the largest landanimals such as the elephant, rhino, and giraffe. The tundra issnow-covered for much of the year and its shallow soils androcky surfaces support little more than grasses, sedges, andlichen that are adapted to the cold, dry climate. The extremecold of the tundra environment results in a short growingseason that barely stretches beyond two months. Theenvironment is characterized by a few large species like thecaribou that can migrate within the ecosystem and anabundance of short-life-cycle insects.
The temperate grasslands are known by a variety of names,pampas in South America, prairie in North America, steppe inRussia, and veldt in South Africa, yet all share commoncharacteristics. All occur in continental interiors with coldwinters and hot summers, they may have tall or short grassesdepending upon precipitation (or the lack of it), and trees areonly found along waterways. Much of these original temperategrasslands were converted to croplands, only to be devastatedby wind erosion when droughts wiped out crops poorly adaptedto dry climate cycles. In the U.S. alone, over 100 millionhectares of prairie is gone with only a few hundred acres left inisolated remnants in states like Iowa and Kansas (Fig. 21).Bison, pronghorn antelope, and prairie dogs, were abundantthroughout the prairies until the prairie became domesticatedand some species (bison, black-footed ferret) came close to thebrink of extinction.
Figure 21. NorthAmerican grasslandenvironments. Left:Caribou feeding ontundra vegetation,Alaska. Image courtesyof USFWS. Right:Tallgrass PrairieNational Preserve,Flint Hills, northeastKansas. Less than1% of originaltallgrass prairieremains, most of it inthe Flint Hills. Imagecourtesy of the U.S.NPS.
25
ForestsThree principal forest biomes can be separated on the basis ofthe types of vegetation in each. Boreal forests (taiga) ofnorthern latitudes are composed of coniferous evergreens(spruce, fir, pine) growing on acidic soils. Such environmentsare characterized by cold temperatures and low plant diversity.Moose, wolf, bear, and lynx are characteristic of boreal forestenvironments. Much of the eastern U.S. and northern Europeare covered by temperate forests dominated by broadleafdeciduous tree species (oak, sycamore, maple, poplar) that losetheir leaves prior to their dormant winter season. The loss ofleaves during fall provides nutrients for the underlying soils.Areas of especially high rainfall may be home to temperaterain forests (e.g., Pacific Northwest) with both evergreen anddeciduous species, including the giant redwoods. Thetemperate forests are home to the tallest species on Earth, thecoastal redwoods as well as animals such as fox, deer, andsquirrel.
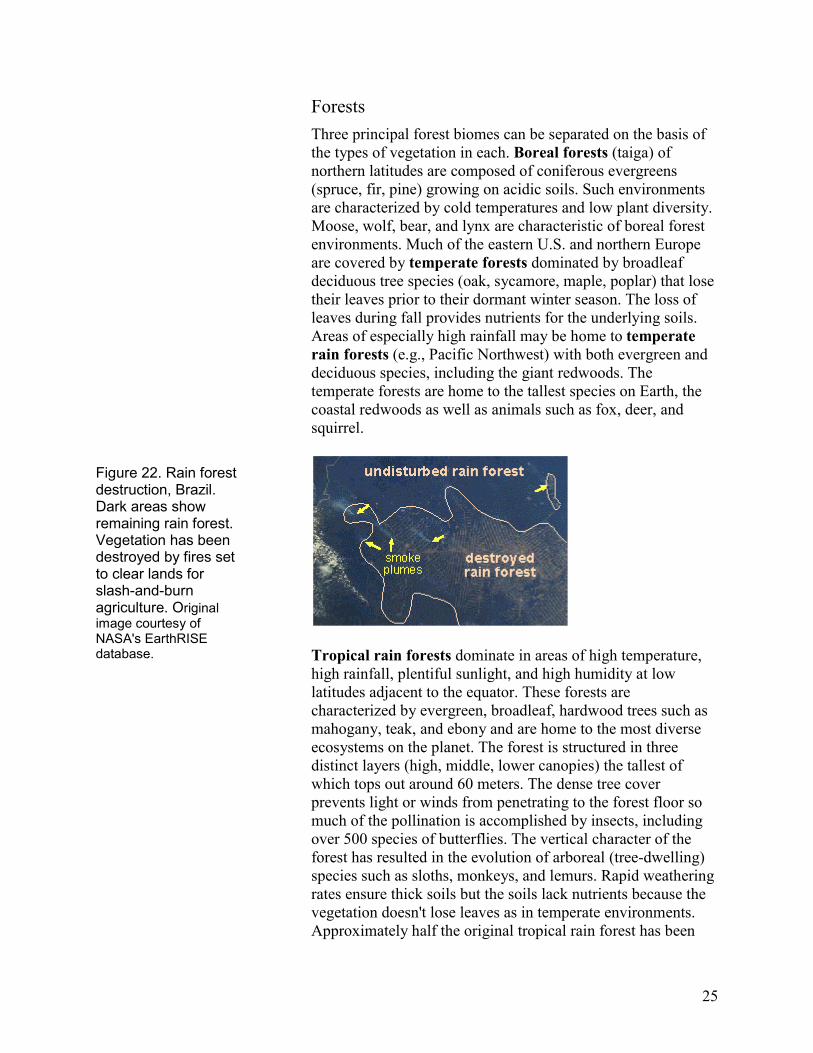
Tropical rain forests dominate in areas of high temperature,high rainfall, plentiful sunlight, and high humidity at lowlatitudes adjacent to the equator. These forests arecharacterized by evergreen, broadleaf, hardwood trees such asmahogany, teak, and ebony and are home to the most diverseecosystems on the planet. The forest is structured in threedistinct layers (high, middle, lower canopies) the tallest ofwhich tops out around 60 meters. The dense tree coverprevents light or winds from penetrating to the forest floor somuch of the pollination is accomplished by insects, includingover 500 species of butterflies. The vertical character of theforest has resulted in the evolution of arboreal (tree-dwelling)species such as sloths, monkeys, and lemurs. Rapid weatheringrates ensure thick soils but the soils lack nutrients because thevegetation doesn't lose leaves as in temperate environments.Approximately half the original tropical rain forest has been
Figure 22. Rain forestdestruction, Brazil.Dark areas showremaining rain forest.Vegetation has beendestroyed by fires setto clear lands forslash-and-burnagriculture. Originalimage courtesy ofNASA's EarthRISEdatabase.

26
destroyed (Fig. 22) to open lands for slash-and-burn agriculturethat soon depletes the limited soil nutrients before cutting downmore forest cover. In comparison the U.S. has lostapproximately a third of its forested land area since the 1600s.
DesertsDry climates are characterized by hot and cold deserts andsemi-desert environments such as chaparral. Theseenvironments are home to plants adapted to conserve water(long roots, succulent tissues) and burrowing animals thatknow enough to stay out of the sun. Hot deserts have hightemperatures throughout the year and are home to a few plantsthat cling to life on a substrate of sand or rock (e.g., Sahara,North Africa). Cacti are relatively common in temperatedeserts that have hot summers but cool winters (e.g., MojaveDesert, southeast California; Fig. 23). Animals are rare indesert environments but camels, scorpions, and the kangaroorat have adapted to life in such extreme conditions.
Chaparral, also known as Mediterranean shrubland, ischaracterized by dry summers but has a similar total rainfall assome temperate grasslands. It contains woody shrubs and mayhave grassy woodlands with species such as the cork oak,olive, and eucalyptus trees.
MountainsMountains represent a special case as their increasingelevations have the same effect as increasing latitude.Temperatures decline and precipitation increases as bothelevation and latitude increase. Equatorial mountain (alpine)biomes are characterized by tundra vegetation at highelevations and descend through coniferous (boreal), deciduous(temperate), and tropical (rain) forests with decreasing altitude.
Figure 23. Saguarocactus, southwesternU.S. Image courtesy ofUSFWS.
27
Biodiversity & Species Preservation• Species loss is most commonly attributed to the destruction
of habitat.• There are three basic reasons to preserve species: (1)
Practical - species benefit mankind; (2) ecological - formaintenance of biological systems; (3) aesthetic - topreserve the natural environment for human enjoyment.
• The Endangered Species Act was passed in attempt toprotect species of aesthetic, ecological, educational,historical, recreational, and scientific value.
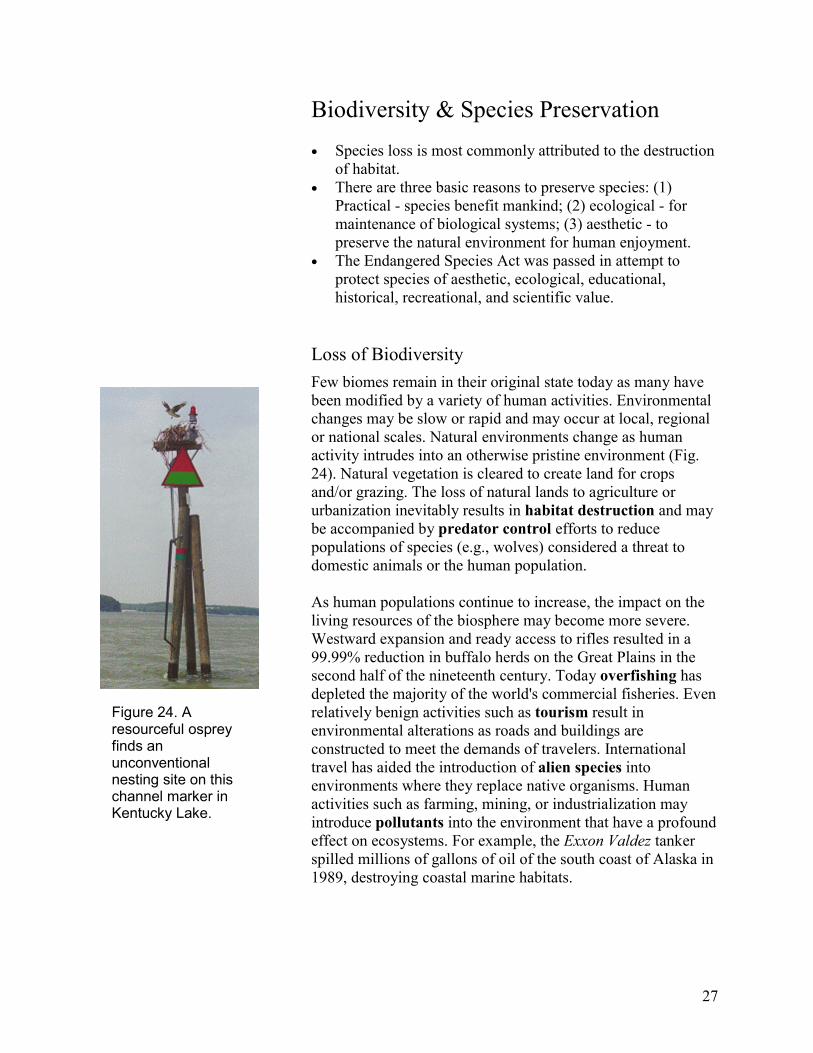
Loss of BiodiversityFew biomes remain in their original state today as many havebeen modified by a variety of human activities. Environmentalchanges may be slow or rapid and may occur at local, regionalor national scales. Natural environments change as humanactivity intrudes into an otherwise pristine environment (Fig.24). Natural vegetation is cleared to create land for cropsand/or grazing. The loss of natural lands to agriculture orurbanization inevitably results in habitat destruction and maybe accompanied by predator control efforts to reducepopulations of species (e.g., wolves) considered a threat todomestic animals or the human population.
As human populations continue to increase, the impact on theliving resources of the biosphere may become more severe.Westward expansion and ready access to rifles resulted in a99.99% reduction in buffalo herds on the Great Plains in thesecond half of the nineteenth century. Today overfishing hasdepleted the majority of the world's commercial fisheries. Evenrelatively benign activities such as tourism result inenvironmental alterations as roads and buildings areconstructed to meet the demands of travelers. Internationaltravel has aided the introduction of alien species intoenvironments where they replace native organisms. Humanactivities such as farming, mining, or industrialization mayintroduce pollutants into the environment that have a profoundeffect on ecosystems. For example, the Exxon Valdez tankerspilled millions of gallons of oil of the south coast of Alaska in1989, destroying coastal marine habitats.
Figure 24. Aresourceful ospreyfinds anunconventionalnesting site on thischannel marker inKentucky Lake.
28
Preserving Endangered SpeciesWe have long recognized that human development inevitablyleads to declines in wildlife populations. Awareness ofdecreasing wildlife populations prompted the formation ofseveral conservation organizations among hunters and fueledefforts to create federal regulations to prevent the exploitationof game species. The federal government would later introducelegislation to form wildlife refuges, bird reservations, forestreserves, and wilderness areas (preserving habitat). Morerecently, habitat destruction and pollution have replacedhunting as the primary cause of species decline in many partsof the world. The destruction of habitat is the prime reason whyspecies go into decline. Maintaining natural habitat for wildlifebecame increasingly difficult as the human population grewand as the nation’s transportation infrastructure expanded,making almost the whole continent accessible. It is estimatedthat we lose over 200 acres of land in the U.S. each hour todevelopment.
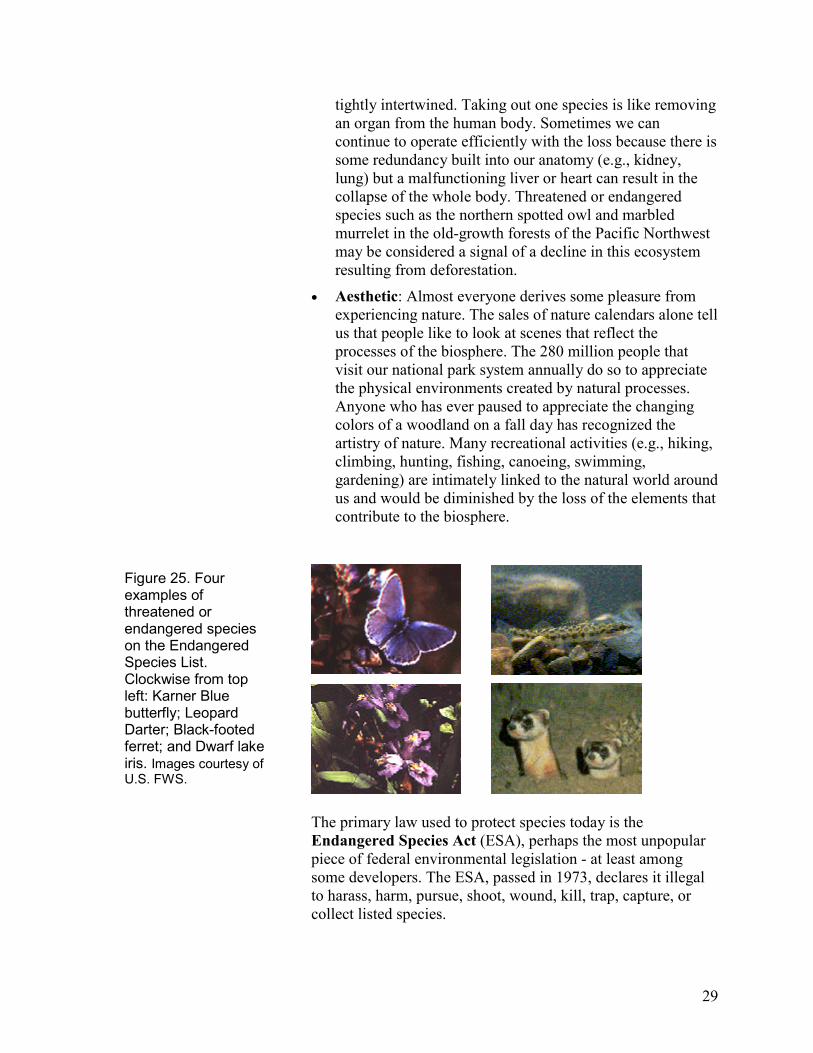
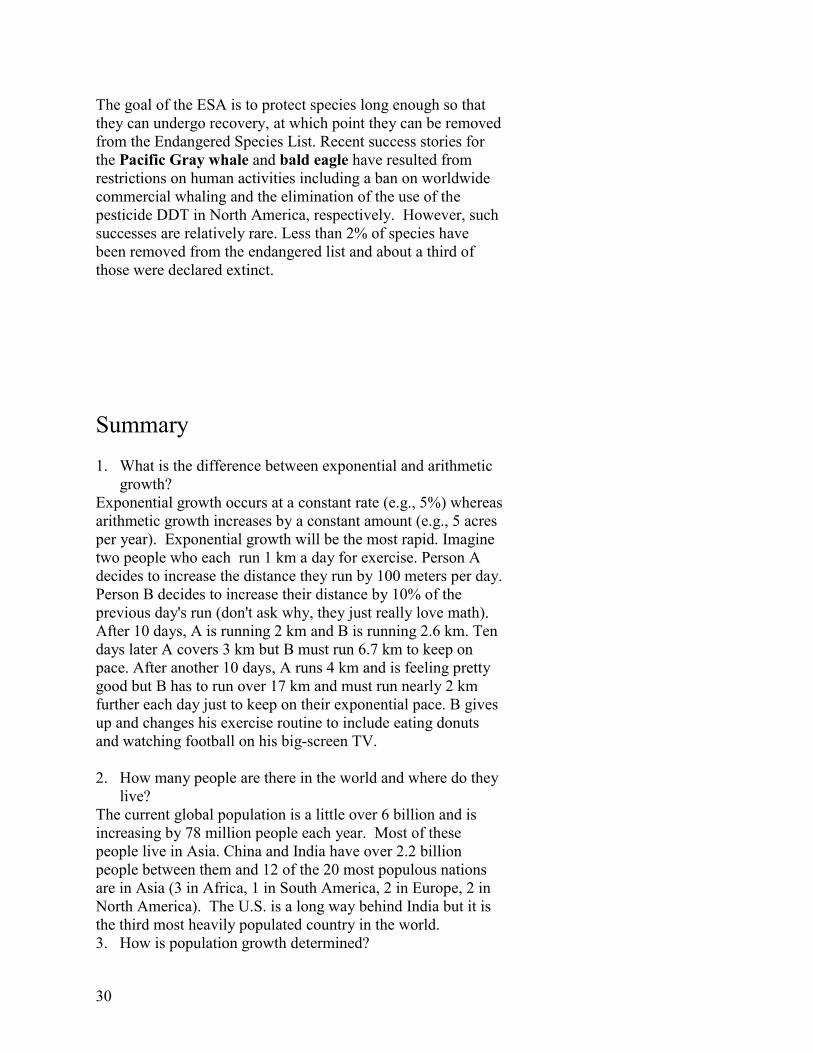
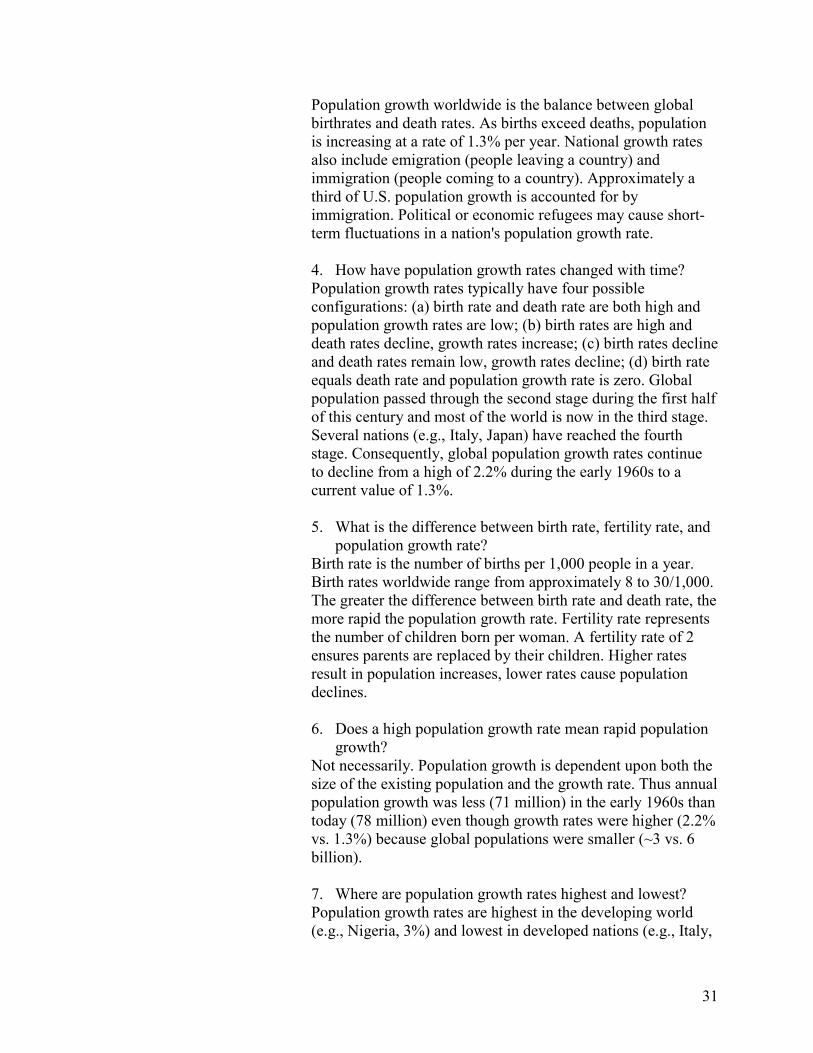
Given that there are millions of species on Earth and that morethan 99% of all species that ever lived are now extinct, it mayseem that the loss of a few additional organisms (Fig. 25) as aresult of human activity is a small and relatively insignificantprice to pay for progress. There are three basic reasons given tocounter this position:
• Practical: Certain species benefit human beings byproviding resources essential for our present or futureexistence. The most basic examples are species that areharvested for food, but many others are used forpharmaceuticals and those currently threatened byextinction may have yet undiscovered benefits includingcures for human ailments. The rosy periwinkle, a plantfound only on Madagascar that contains organiccompounds that have been used to help treat cancer, istoday threatened by habitat destruction. There areapproximately 80,000 edible plant species and we use justthree (corn, wheat, rice) to provide half the world's foodsupply. Wild relatives of common crops represent areservoir of genetic material that we can dip into to createdisease-resistant strains of domesticated species.
• Ecological: Although some organisms have no directbenefit to humans they are essential to maintaining theorder of the biosphere. The web of life is a complex systemwith the life cycles of hundreds or thousands of species
29
tightly intertwined. Taking out one species is like removingan organ from the human body. Sometimes we cancontinue to operate efficiently with the loss because there issome redundancy built into our anatomy (e.g., kidney,lung) but a malfunctioning liver or heart can result in thecollapse of the whole body. Threatened or endangeredspecies such as the northern spotted owl and marbledmurrelet in the old-growth forests of the Pacific Northwestmay be considered a signal of a decline in this ecosystemresulting from deforestation.
• Aesthetic: Almost everyone derives some pleasure fromexperiencing nature. The sales of nature calendars alone tellus that people like to look at scenes that reflect theprocesses of the biosphere. The 280 million people thatvisit our national park system annually do so to appreciatethe physical environments created by natural processes.Anyone who has ever paused to appreciate the changingcolors of a woodland on a fall day has recognized theartistry of nature. Many recreational activities (e.g., hiking,climbing, hunting, fishing, canoeing, swimming,gardening) are intimately linked to the natural world aroundus and would be diminished by the loss of the elements thatcontribute to the biosphere.
The primary law used to protect species today is theEndangered Species Act (ESA), perhaps the most unpopularpiece of federal environmental legislation - at least amongsome developers. The ESA, passed in 1973, declares it illegalto harass, harm, pursue, shoot, wound, kill, trap, capture, orcollect listed species.
Figure 25. Fourexamples ofthreatened orendangered specieson the EndangeredSpecies List.Clockwise from topleft: Karner Bluebutterfly; LeopardDarter; Black-footedferret; and Dwarf lakeiris. Images courtesy ofU.S. FWS.
30
The goal of the ESA is to protect species long enough so thatthey can undergo recovery, at which point they can be removedfrom the Endangered Species List. Recent success stories forthe Pacific Gray whale and bald eagle have resulted fromrestrictions on human activities including a ban on worldwidecommercial whaling and the elimination of the use of thepesticide DDT in North America, respectively. However, suchsuccesses are relatively rare. Less than 2% of species havebeen removed from the endangered list and about a third ofthose were declared extinct.
Summary1. What is the difference between exponential and arithmetic
growth?Exponential growth occurs at a constant rate (e.g., 5%) whereasarithmetic growth increases by a constant amount (e.g., 5 acresper year). Exponential growth will be the most rapid. Imaginetwo people who each run 1 km a day for exercise. Person Adecides to increase the distance they run by 100 meters per day.Person B decides to increase their distance by 10% of theprevious day's run (don't ask why, they just really love math).After 10 days, A is running 2 km and B is running 2.6 km. Tendays later A covers 3 km but B must run 6.7 km to keep onpace. After another 10 days, A runs 4 km and is feeling prettygood but B has to run over 17 km and must run nearly 2 kmfurther each day just to keep on their exponential pace. B givesup and changes his exercise routine to include eating donutsand watching football on his big-screen TV.
2. How many people are there in the world and where do theylive?
The current global population is a little over 6 billion and isincreasing by 78 million people each year. Most of thesepeople live in Asia. China and India have over 2.2 billionpeople between them and 12 of the 20 most populous nationsare in Asia (3 in Africa, 1 in South America, 2 in Europe, 2 inNorth America). The U.S. is a long way behind India but it isthe third most heavily populated country in the world.3. How is population growth determined?
31
Population growth worldwide is the balance between globalbirthrates and death rates. As births exceed deaths, populationis increasing at a rate of 1.3% per year. National growth ratesalso include emigration (people leaving a country) andimmigration (people coming to a country). Approximately athird of U.S. population growth is accounted for byimmigration. Political or economic refugees may cause short-term fluctuations in a nation's population growth rate.
4. How have population growth rates changed with time?Population growth rates typically have four possibleconfigurations: (a) birth rate and death rate are both high andpopulation growth rates are low; (b) birth rates are high anddeath rates decline, growth rates increase; (c) birth rates declineand death rates remain low, growth rates decline; (d) birth rateequals death rate and population growth rate is zero. Globalpopulation passed through the second stage during the first halfof this century and most of the world is now in the third stage.Several nations (e.g., Italy, Japan) have reached the fourthstage. Consequently, global population growth rates continueto decline from a high of 2.2% during the early 1960s to acurrent value of 1.3%.
5. What is the difference between birth rate, fertility rate, andpopulation growth rate?
Birth rate is the number of births per 1,000 people in a year.Birth rates worldwide range from approximately 8 to 30/1,000.The greater the difference between birth rate and death rate, themore rapid the population growth rate. Fertility rate representsthe number of children born per woman. A fertility rate of 2ensures parents are replaced by their children. Higher ratesresult in population increases, lower rates cause populationdeclines.
6. Does a high population growth rate mean rapid populationgrowth?
Not necessarily. Population growth is dependent upon both thesize of the existing population and the growth rate. Thus annualpopulation growth was less (71 million) in the early 1960s thantoday (78 million) even though growth rates were higher (2.2%vs. 1.3%) because global populations were smaller (~3 vs. 6billion).
7. Where are population growth rates highest and lowest?Population growth rates are highest in the developing world(e.g., Nigeria, 3%) and lowest in developed nations (e.g., Italy,
32
0%). Consequently, 95% of the people added to the world'spopulation will be born in developing nations.
8. What is the carrying capacity of Earth?Good question. The carrying capacity is the maximumpopulation that Earth can support indefinitely. The answer isprobably anything between 6 to 20 billion depending upon thestandard of living we are willing to "enjoy." Human populationis expected to stabilize around 10 billion, essentially a self-imposed limit dictated by cultural standards.
9. Do we have a sustainable society now?Do you use anything that is not renewable? The petroleumproducts that allow us to drive our cars (or airplanes) or heatour homes, the coal that is burned to generate our electricity;both of these energy sources are non-renewable. Forests andfish should be renewable on the human time-scale but bothhave been substantially diminished in this century. TheAtlantic cod fishery off Nova Scotia collapsed due tooverfishing, despite warnings that it would happen. Tropicalrainforests are being burned as you read this, those trees are notcoming back any time soon. In short, we are some distanceaway from being a sustainable society and we are not likely toget close without the threat of more drastic shortages than isapparent now.
10. Why didn't the people of Easter Island recognize what wasinevitably going to happen to their society?
Each generation focused on its own needs and ignored thelong-term consequences of their actions. Much of what theydid was influenced by the cultural norms of their society thatemphasized the need to make their big-headed statues.
11. What is "domesticated" land?Over a third of Earth's land surface has been domesticated, thatis, it has been converted from its natural state to cropland,pasture, forest plantations, or urban use.
12. What factors influence the degree of domestication?Domestication is influenced by population density, thecharacter of the landscape and climate, and the rate of growthof urban areas. Nations with relatively high populationdensities typically have more domestication of land unless thelandscape is too rugged to support development or the climateis too extreme to support human life. Lands surroundingrapidly growing cities are most susceptible to domestication.
33
Urban growth rates are typically higher in major cities indeveloping nations.
13. How has domestication influenced agricultural production?Initially, natural lands were converted to agricultural lands andproduction expanded. However, those same croplands andpastures are now being consumed under expanding cities. Theland area available for grain production has decreased over thelast few decades but agricultural yields increased because ofimprovements in technology and increased use of fertilizers.Population has increased more rapidly than grain production soproduction per person is now actually less than in the past.
14. What is the land ethic?The land ethic defines each person as a member of theecological community of plants and animals, or collectively,the land. Aldo Leopold suggested that just as in society, wherewe have certain obligations and privileges, we have similarconstraints on our behavior as members of an ecologicalcommunity. The land ethic views our role as stewards of thenatural world.
15. What is the biosphere?Earth is composed of several components, including thehydrosphere (all waters, mainly the oceans), atmosphere (allair, from Earth's surface to space), and the biosphere (all life onEarth from bacteria to elephants). The biosphere is interwovenwith other components of the Earth system. Most life occurs inthe shallow oceans and at relatively low elevations on the landsurface but even in extreme conditions of the deep ocean flooror the frozen poles, some organisms manage to survive.
16. What controls the distribution of life in the biosphere?Life is limited by abiotic factors such as temperature andprecipitation that characterize the physical environment. Theseconditions are independent of organic activity. Life is mostabundant in environments with plentiful supplies of key abioticcomponents and is least abundant in regions with extremeconditions.
17. How are energy and nutrients transferred from the physicalenvironment to plants and animals?
Plants use energy from the Sun to generate mass throughphotosynthesis. They absorb key nutrients from water andsoils. Animals (consumers) eat the plants, thus receiving someof the stored energy and nutrients, and may in turn be eaten by

34
other animals. Key elements cycle through the biospherethrough a series of biogeochemical cycles involving processessuch as respiration, photosynthesis, weathering, and rockformation.
18. What is the relationship between biomass and biodiversity?Biodiversity represents the variety of species and biomass isthe amount (mass) of material in part or all of the biosphere.Increasing biodiversity typically is reflected in increasingbiomass, therefore, biomass per unit area can be used as anapproximate measure of biodiversity.
19. What is the difference between a biome and an ecosystem?The difference is mainly one of scale. Biomes are bigger thanecosystems. Ecosystems are communities of organisms thatinhabit specific physical environments, whereas, biomesrepresent collections of ecosystems and are regional orinternational in scale. Biomes are characterized by similarassociation of species, comparable climates, and consistent soiltypes.
20. What are the major biomes?Biomes can be loosely divided into three major groups,grasslands (savanna, temperate, tundra), forests (rain,temperate, boreal), and deserts. These major groups are dividedby precipitation (more in forests, less in deserts) and aresubdivided by temperature (low temperature in boreal forestsand tundra; high temperatures in rain forests and savanna).Some biomes may be transitional between the major biomes,for example, chaparral occurs around the Mediterranean Seaand is defined by dry summers and may contain grasslands orshrublands.
21. What causes biodiversity to decrease?Biodiversity can gradually decrease due to natural changes inthe physical environment but typically occurs more rapidly as aresult of human activity. Human actions such as agriculturalpractices, commercial fishing, hunting, predator controls,pollution, and tourism can destroy natural habitats and reducebiodiversity.
22. What steps can be taken to preserve biodiversity?Actions that ensure the preservation of natural habitats have thegreatest effect in preserving species because habitat destructionis the primary cause of biodiversity loss. Habitat preservationcan occur through private or corporate programs, or through

35
government agencies that preserve forest lands (although theseagencies also oversee logging), national parks, and wildliferefuges.
23. Why should we care to preserve biodiversity?There are three principal reasons why we might consider it agood idea to minimize species loss. First, for purely self-centered reasons, we want to preserve species to helpourselves. Domesticated plants and animals provide us with themajority of our food resources. Related wild species represent agenetic resource that can be used to improve domestic species.The majority of species have yet to be formally described,consequently, their potential for human benefit is unknown.Relatively rare plant species provide us with treatments forserious diseases. Second, we don't know what role most speciesplay in the functioning of the biosphere yet we know we likethe idea of having a biosphere so logic suggests we shouldn'tdo anything to meddle with the natural order of life. Finally,much human enjoyment is derived from the simple pleasures ofobserving life on Earth. By preserving all elements of thebiosphere, we preserve a source of delight for the generationsthat will follow us.


![[PPT]Chapter Four Flood Routing - Kean University | World …csmart/Hydrology/Lectures/Lecture 15u Flood... · Web viewTitle Chapter Four Flood Routing Author Chuck Last modified](https://img.pdfslide.net/doc/110x75/5b43ab4d7f8b9a2d328b746c/pptchapter-four-flood-routing-kean-university-world-csmarthydrologylectureslecture.jpg)