Embed Size (px)
Citation preview
PORKBRAND
WP2: How does the Chinese consumer
form brand images of pork?
Report
By Susanne Pedersen1, Klaus G. Grunert1, Maartje Mulders1, Karen
Brunsø1 & Yanfeng Zhou2
1 MAPP Centre, Department of Management, Aarhus University, Denmark 2 Business School, Sun Yat-sen University, People's Republic of China

2
This report is an outcome of the second work package in the PorkBrand project (2019-2020), which
is funded by Svineafgiftsfonden (Muligheder for branding af dansk grisekød på det kinesiske
marked). It is led by Klaus G. Grunert with participation of Yanfeng Zhou, Hanne Kragh, Karen
Brunsø, Stephan Zielke, Maartje Mulders and Susanne Pedersen. The advisory board consists of
Søren Tinggaard, Vice President, Danish Crown and Nicolaj Christoffersen, Head of Sector, Danish
Agriculture and Food Council. The advisory board has not been involved in writing or commenting
on this report.
3
Table of Contents
1. AIM ....................................................................................................................................................................... 4 2. THEORETICAL APPROACH ...................................................................................................................................... 4 3. FOCUS GROUP STUDY ............................................................................................................................................ 6
3.1. METHODS .................................................................................................................................................................. 6 3.2. RESULTS ..................................................................................................................................................................... 6
4. SURVEY STUDY ...................................................................................................................................................... 8 4.1. METHODS .................................................................................................................................................................. 8 4.2. RESULTS ..................................................................................................................................................................... 8
4.2.1. Channel use ..................................................................................................................................................... 9 4.2.2. Buyer segments ............................................................................................................................................. 10 4.2.3. Use of other media ........................................................................................................................................ 11 4.2.4. Brand awareness and purchase .................................................................................................................... 13 4.2.5. Brand image .................................................................................................................................................. 22 4.2.6. Brand attitude and brand loyalty .................................................................................................................. 23
5. SUMMARY AND IMPLICATIONS ........................................................................................................................... 25 REFERENCES ............................................................................................................................................................ 28
4
1. Aim The purpose of the PorkBrand project is to support branding of Danish pork meat in China by
providing knowledge about how Chinese consumers form brand images and develop preferences for
pork brands across sales channels, identify the pros and cons for different branding strategies and
come up with recommendations for cooperation strategies with Chinese stakeholders. The short-term
aim is to improve the basis for decisions on export strategies for Danish pork meat, so that Chinese
consumers will establish preferences and a willingness to pay a premium. The longer-term aim is to
continue the growth of Danish export of pork meat to China based on stable preferences among the
Chinese consumers.
Whereas the first work package provided knowledge about the major brands currently on the Chinese
market, their positioning and the currently used branding practices on the Chinese market for pork
the aim of the second work package is to provide knowledge on how Chinese consumers form brand
images for pork brands based on their interaction with multiple sales channels and other brand
touchpoints such as traditional and social media.
Work package 2 has investigated the current brand image for major pork brands among Chinese
consumers and whether it differs according to sales channels used and interaction with different
touchpoints across the customer journey.
This is done with a mixed-method approach, where focus groups were conducted to get a better
understanding of Chinese consumers’ use of different sales channels and of their brand images of
pork, and an online survey on brand images, sales channel use and interaction with brand touchpoints.
2. Theoretical approach In accordance with the branding literature, we define brand image as the set of associations that
consumer have with a brand (Keller, 2003). Brand image is therefore the result of all interactions that
the consumer has had with the brand, no matter whether these were based on own experiences with
brand, contact with the brand in a shopping situation, or any other contact with the brand through
traditional marketing communication channels, social media, or personal communication. Brand
image is commonly distinguished from brand identity (Nandan, 2005) – the latter is the positioning
of the brand that the brand owner would like to achieve in the market, whereas the brand image is
how the brand is actually perceived by consumers. In the present study, we conceptualize brand image
as consisting of four dimensions: the perceived quality of the brand, whether the brand is viewed as

5
being value for money, the enjoyment expected from using the brand, and whether buying and using
the brand is expected to give social recognition (Sweeney & Soutar, 2001).
The brand image will determine how consumers react to the brand when they encounter it. We
distinguish two types of reactions: attitudinal and behavioural. The attitudinal reaction is how the
consumer will evaluate the brand when seeing it in a shopping situation. The behavioural reaction
refers to consumers intention to buy the brand in the future. Attitudinal and behavioural reactions can
be assumed to be related, but it is known that their determinants can differ (e.g., Esch, Langner,
Schmitt, & Geus, 2006).
As noted, the brand image is the result of all interactions that the consumer has had with the brand.
The sequence of these interactions is often called the customer journey in the marketing literature
(Lemon & Verhoef, 2016). For frequently bought consumer products like pork, the customer journey
will be expressed by the pattern of usage of different sales channels and other touchpoints where the
consumer meets the brand. Relevant channels in our context are wet markets, online retailers, and
supermarkets – mainstream, high end, convenience and imported goods stores. Additional
touchpoints are contact with the brand in traditional marketing media and in the social media. The
way the same brand is presented can differ across channels and touchpoints, and the resulting brand
image can therefore differ depending on the pattern of usage of channels and other touchpoints.
Figure 1 summarizes our theoretical approach. We are interested in Chinese consumers’ brand image
of the major pork brands on the Chinese market, and how these influence brand attitude and brand
loyalty. We try to related brand images to patterns of usage of different sales channels for pork and
other brand touchpoints, taking into account consumer motives for shopping for food.
Figure 1: Conceptual approach

6
3. Focus group study 3.1. Methods An exploratory approach was applied to obtain a better understanding of Chinese consumers’ brand
images of pork. Two focus groups (n = 11 in each) were conducted among Chinese consumers in
Guangzhou in July 2019. Participants were screened for being at least partly responsible for grocery
shopping in their household and for buying and eating pork regularly. Also, it was attempted to obtain
variation in terms of gender, age and education, see Table 1 for details.
Table 1: Socio-demographic characteristics of focus group participants
Focus group 1 2 Participants, n 11 11 Female/Male 8/3 7/4 Age, mean 42.8 38 Youngest 21 20 Oldest 56 64 Education High school/vocational school 3 3 College 2 1 University (bachelor or master) 6 7
A semi-structured interview guide was followed covering three topics of interest: Pork brand
associations to 11 main brands identified in work package 1, sales channel usage (types and
frequency) and interaction with pork brand touchpoints. Both focus groups lasted approximately 90
minutes and were moderated by an experienced native researcher together with an assistant. The focus
groups were audio recorded, transcribed, translated to English and checked by another translator.
Participants were not compensated for their time and effort. Content analysis was performed using
Nvivo 11.
3.2. Results Focus groups participants were asked to write down all the pork brands on the Chinese market they
could think of. The three most mentioned brands (out of 22 brands mentioned) were Yihaotuzhu,
Qian Dama and Park’n’shop’s private label pork in focus group 1, while the top-three in focus group
2 (out of 19) were Yihaotuzhu, Wen’s and Jingqishen. The participants’ associations to these brands
are shown in Table 2.
7
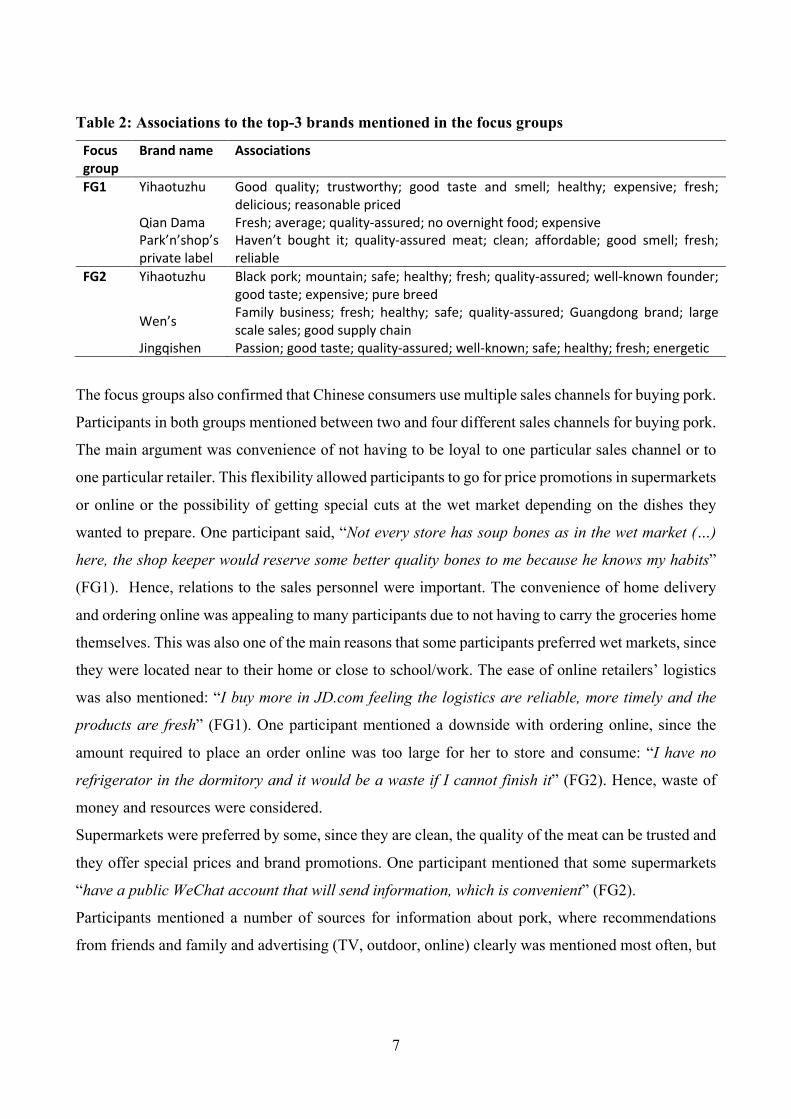
Table 2: Associations to the top-3 brands mentioned in the focus groups
Focus group
Brand name Associations
FG1 Yihaotuzhu Good quality; trustworthy; good taste and smell; healthy; expensive; fresh; delicious; reasonable priced
Qian Dama Fresh; average; quality-assured; no overnight food; expensive Park’n’shop’s
private label Haven’t bought it; quality-assured meat; clean; affordable; good smell; fresh; reliable
FG2 Yihaotuzhu Black pork; mountain; safe; healthy; fresh; quality-assured; well-known founder; good taste; expensive; pure breed
Wen’s Family business; fresh; healthy; safe; quality-assured; Guangdong brand; large scale sales; good supply chain
Jingqishen Passion; good taste; quality-assured; well-known; safe; healthy; fresh; energetic
The focus groups also confirmed that Chinese consumers use multiple sales channels for buying pork.
Participants in both groups mentioned between two and four different sales channels for buying pork.
The main argument was convenience of not having to be loyal to one particular sales channel or to
one particular retailer. This flexibility allowed participants to go for price promotions in supermarkets
or online or the possibility of getting special cuts at the wet market depending on the dishes they
wanted to prepare. One participant said, “Not every store has soup bones as in the wet market (…)
here, the shop keeper would reserve some better quality bones to me because he knows my habits”
(FG1). Hence, relations to the sales personnel were important. The convenience of home delivery
and ordering online was appealing to many participants due to not having to carry the groceries home
themselves. This was also one of the main reasons that some participants preferred wet markets, since
they were located near to their home or close to school/work. The ease of online retailers’ logistics
was also mentioned: “I buy more in JD.com feeling the logistics are reliable, more timely and the
products are fresh” (FG1). One participant mentioned a downside with ordering online, since the
amount required to place an order online was too large for her to store and consume: “I have no
refrigerator in the dormitory and it would be a waste if I cannot finish it” (FG2). Hence, waste of
money and resources were considered.
Supermarkets were preferred by some, since they are clean, the quality of the meat can be trusted and
they offer special prices and brand promotions. One participant mentioned that some supermarkets
“have a public WeChat account that will send information, which is convenient” (FG2).
Participants mentioned a number of sources for information about pork, where recommendations
from friends and family and advertising (TV, outdoor, online) clearly was mentioned most often, but

8
also introductions and recommendations from sales persons in different sales channels, pork brands’
WeChat accounts, supermarket promotions, newspapers, TV and social media.
Hence, Chinese consumers have many associations to pork brands, buy pork through multiple sales
channels and pay attention to promotion of pork brands and listen to recommendations of brands.
4. Survey study 4.1. Methods Data were collected in October 2019 by means of an online survey with consumers in Guangzhou,
Shanghai, Shenzhen, Hangzhou and Nanjing, n = 400 per city, resulting in a total sample size of 2000.
Respondents were screened for being at least partly responsible for food shopping in the household
and for having bought pork at least once during the last month.
Brand awareness for the eleven most prominent pork brands on the Chinese market was measured
along with channel usage habits and buying frequency of the brands across the major channels: wet
markets, mainstream supermarkets, high-end supermarkets, convenience stores, imported goods
stores and online stores. Brand image of two brands randomly selected among all known to the
respondent was measured, and channel image of the supermarket channel and the online channel were
also measured by items adapted from Sweeney and Soutar (2001). Social media usage habits were
also measured as well as respondents’ attention to advertisement for pork.
Food choice motives were measured using an adaptation of the Food Choice Questionnaire (Steptoe,
Pollard, & Wardle, 1995) that has been developed for the Chinese context (Wang, De Steur, Gellynck,
& Verbeke, 2015). Shopping motives were measured using items adapted from Rohm and
Swaminathan (2004). The questionnaire also contained measure of brand loyalty and channel loyalty
as well as respondent demographics.
4.2. Results In the following section, we will first present how the different pork sales channels in China have
been used to purchase pork (4.2.1). Then we will distinguish different segments of pork buyers based
on their use of the different sales channels (4.2.2). This is followed by an analysis of the use of other
brand touchpoints - social media and advertising – by the different consumer segments (4.2.3). We
then analyze the frequency of purchase for different pork brands, and the familiarity with the different
9
brands (4.2.4). Then, brand image (4.2.5) and finally its impact on brand attitude and brand loyalty
(4.2.6) are discussed.
As mentioned in the report from WP 1, 11 brands were identified as main pork brands. The present
study is centered around these brands. The 11 pork brands identified as the main brands on the
Chinese market were Shuanghui, Yurun, Jinluo, Chumuxiang, Wens, Jingqishen, Sushi, NetEase
Weiyang, Meal Boss, Cofco Joycome and Yihao Tuzhu.
4.2.1. Channel use
In relation to channel use, consumers were asked to think of the last ten times that they purchased
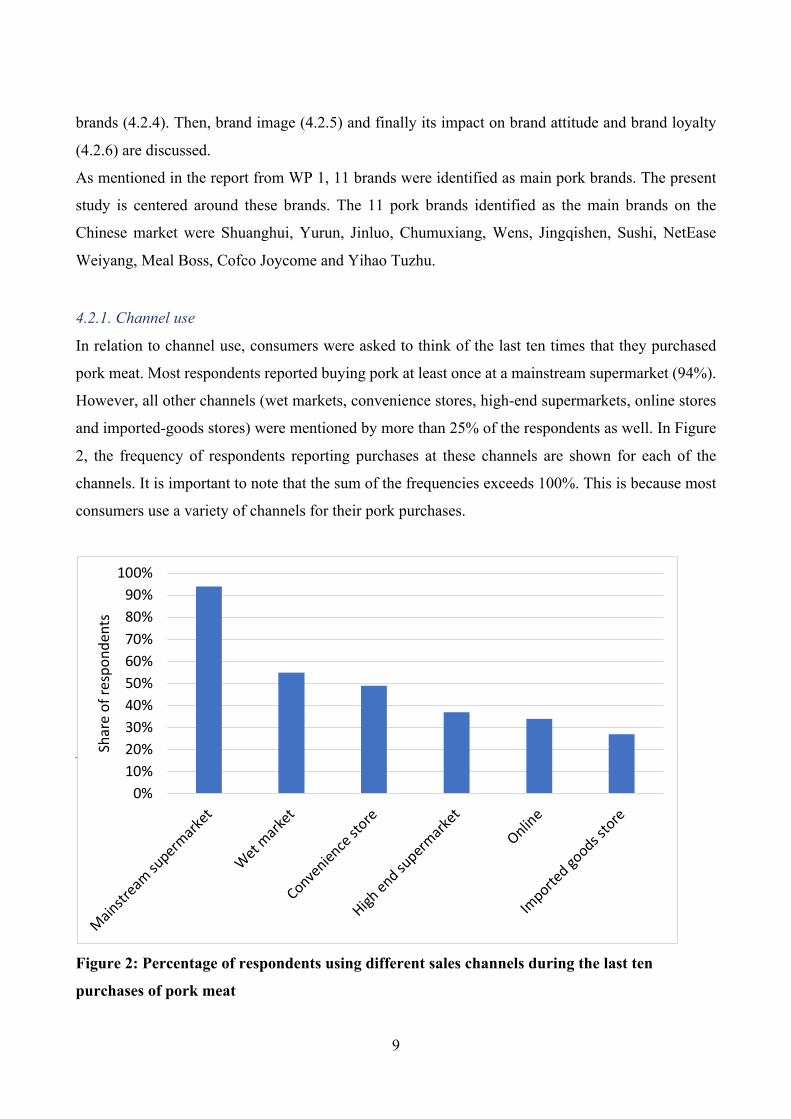
pork meat. Most respondents reported buying pork at least once at a mainstream supermarket (94%).
However, all other channels (wet markets, convenience stores, high-end supermarkets, online stores
and imported-goods stores) were mentioned by more than 25% of the respondents as well. In Figure
2, the frequency of respondents reporting purchases at these channels are shown for each of the
channels. It is important to note that the sum of the frequencies exceeds 100%. This is because most
consumers use a variety of channels for their pork purchases.
Figure 2: Percentage of respondents using different sales channels during the last ten
purchases of pork meat
0%10%20%30%40%50%60%70%80%90%
100%
Mainstream su
permarke
t
Wet marke
t
Convenience
store
High end su
permarke
t
Online
Importe
d goods s
tore
Shar
e of
resp
onde
nts

10
Looking into the frequency of purchases in the different channels in more detail, indeed many
consumers report using multiple channels (see Figure 3). Most consumers (51%) reported buying in
two or three different channels during the last ten purchases of pork, whereas 33% reported using
more than three channels. Only 17% of consumers consistently used one channel during their last 10
purchases.
Figure 3: Number of channels used to purchase pork meat
4.2.2. Buyer segments
As consumers may have different patterns of use of the different sales channels, we tried to identify
clusters of consumer segments within our data. Here we find that, even though almost all consumers
buy pork at mainstream supermarkets, different segments of consumers can be identified by their use
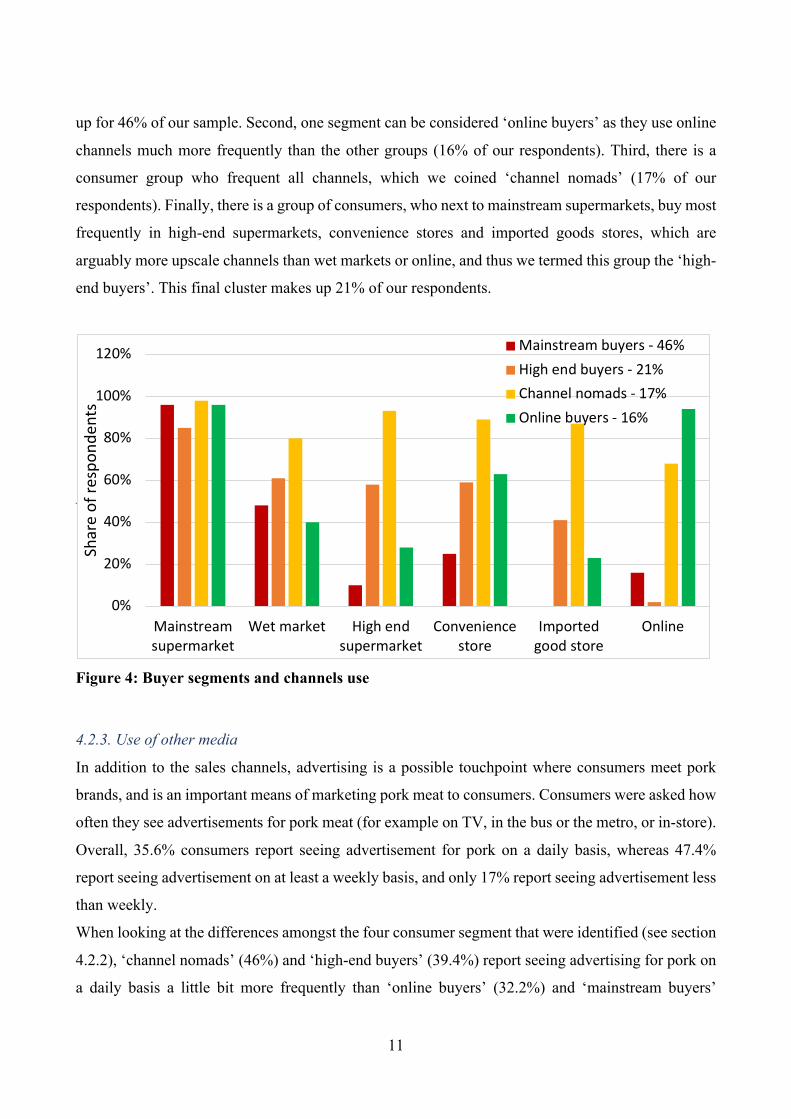
of the other channels in addition to using mainstream supermarkets (see Figure 4). Based on a latent
cluster analysis for the frequency of channel usage, we find that we can distinguish four segments of
consumers based on their probability of buying in a given channel. First, a large segment of
consumers buys most frequently at mainstream supermarkets, and do not use other channels very
frequently, except for the wet markets. We termed this group the ‘mainstream buyers’, and they make
0%
5%
10%
15%
20%
25%
30%
1 2 3 4 5 6
Shar
e of
resp
onde
nts
11
up for 46% of our sample. Second, one segment can be considered ‘online buyers’ as they use online
channels much more frequently than the other groups (16% of our respondents). Third, there is a
consumer group who frequent all channels, which we coined ‘channel nomads’ (17% of our
respondents). Finally, there is a group of consumers, who next to mainstream supermarkets, buy most
frequently in high-end supermarkets, convenience stores and imported goods stores, which are
arguably more upscale channels than wet markets or online, and thus we termed this group the ‘high-
end buyers’. This final cluster makes up 21% of our respondents.
Figure 4: Buyer segments and channels use
4.2.3. Use of other media
In addition to the sales channels, advertising is a possible touchpoint where consumers meet pork
brands, and is an important means of marketing pork meat to consumers. Consumers were asked how
often they see advertisements for pork meat (for example on TV, in the bus or the metro, or in-store).
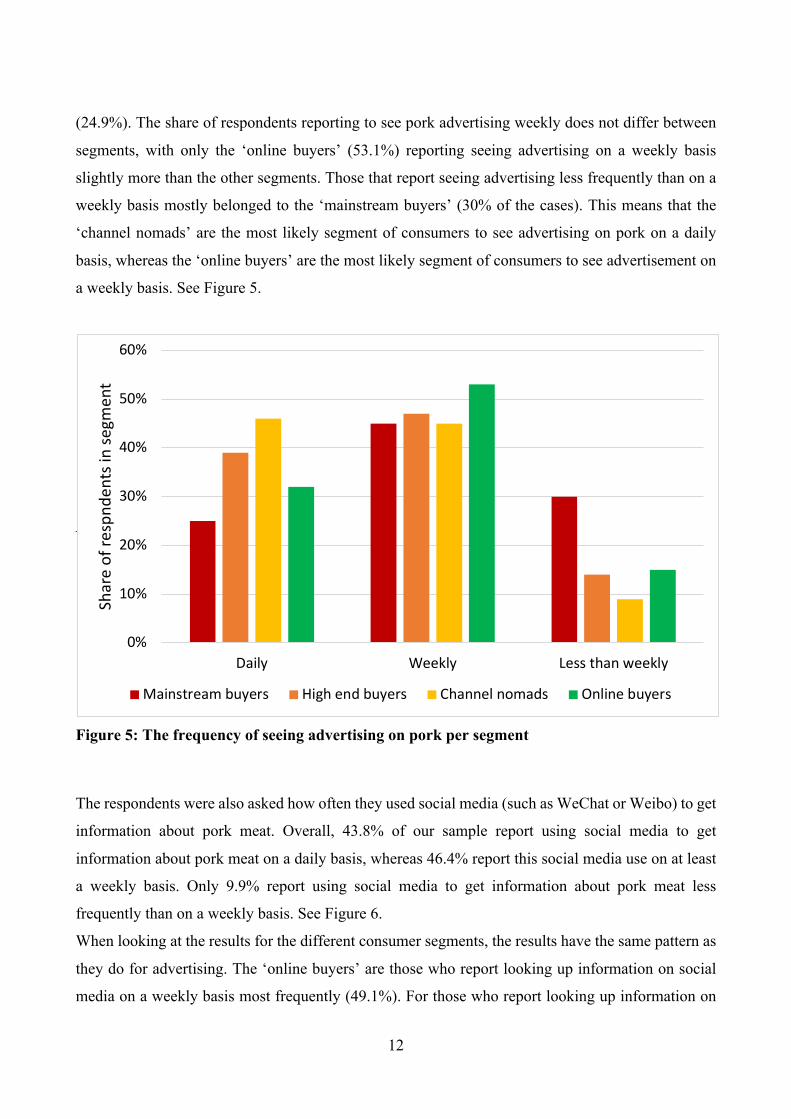
Overall, 35.6% consumers report seeing advertisement for pork on a daily basis, whereas 47.4%
report seeing advertisement on at least a weekly basis, and only 17% report seeing advertisement less
than weekly.
When looking at the differences amongst the four consumer segment that were identified (see section
4.2.2), ‘channel nomads’ (46%) and ‘high-end buyers’ (39.4%) report seeing advertising for pork on
a daily basis a little bit more frequently than ‘online buyers’ (32.2%) and ‘mainstream buyers’
0%
20%
40%
60%
80%
100%
120%
Mainstreamsupermarket
Wet market High endsupermarket
Conveniencestore
Importedgood store
Online
Shar
e of
resp
onde
nts
Mainstream buyers - 46%High end buyers - 21%Channel nomads - 17%Online buyers - 16%
12
(24.9%). The share of respondents reporting to see pork advertising weekly does not differ between
segments, with only the ‘online buyers’ (53.1%) reporting seeing advertising on a weekly basis
slightly more than the other segments. Those that report seeing advertising less frequently than on a
weekly basis mostly belonged to the ‘mainstream buyers’ (30% of the cases). This means that the
‘channel nomads’ are the most likely segment of consumers to see advertising on pork on a daily
basis, whereas the ‘online buyers’ are the most likely segment of consumers to see advertisement on
a weekly basis. See Figure 5.
Figure 5: The frequency of seeing advertising on pork per segment
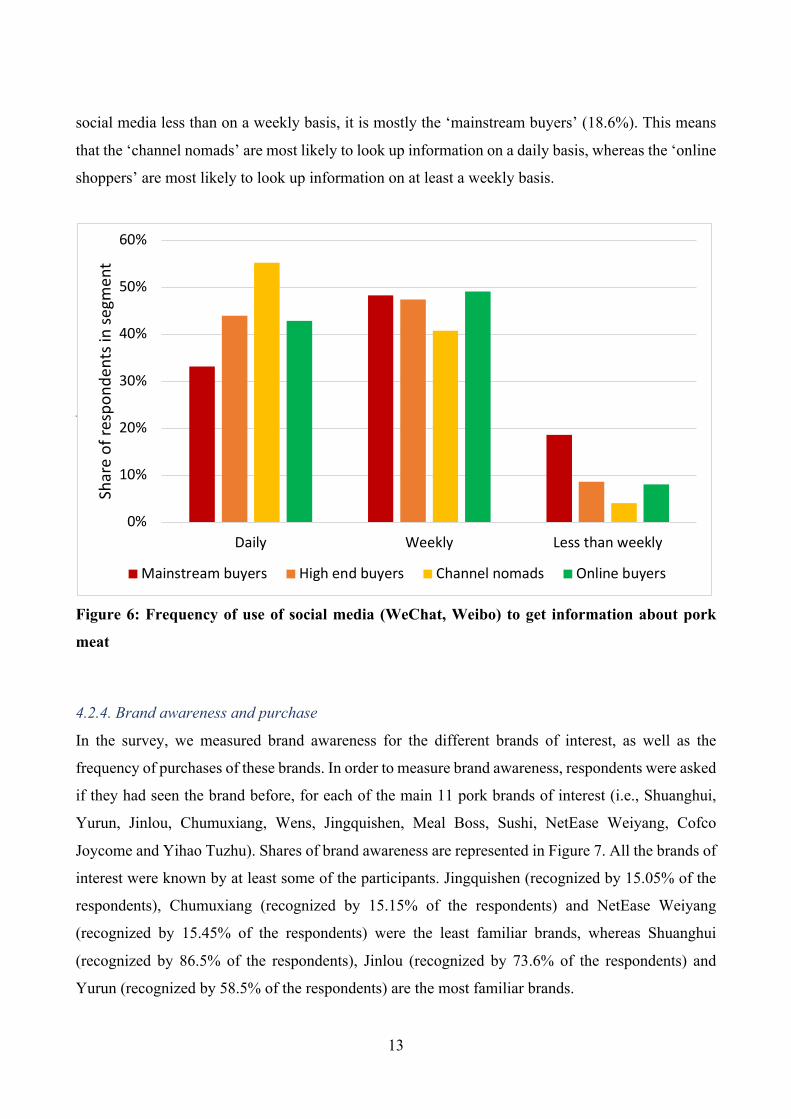
The respondents were also asked how often they used social media (such as WeChat or Weibo) to get
information about pork meat. Overall, 43.8% of our sample report using social media to get
information about pork meat on a daily basis, whereas 46.4% report this social media use on at least
a weekly basis. Only 9.9% report using social media to get information about pork meat less
frequently than on a weekly basis. See Figure 6.
When looking at the results for the different consumer segments, the results have the same pattern as
they do for advertising. The ‘online buyers’ are those who report looking up information on social
media on a weekly basis most frequently (49.1%). For those who report looking up information on
0%
10%
20%
30%
40%
50%
60%
Daily Weekly Less than weekly
Shar
e of
resp
nden
ts in
segm
ent
Mainstream buyers High end buyers Channel nomads Online buyers
13
social media less than on a weekly basis, it is mostly the ‘mainstream buyers’ (18.6%). This means
that the ‘channel nomads’ are most likely to look up information on a daily basis, whereas the ‘online
shoppers’ are most likely to look up information on at least a weekly basis.
Figure 6: Frequency of use of social media (WeChat, Weibo) to get information about pork
meat
4.2.4. Brand awareness and purchase
In the survey, we measured brand awareness for the different brands of interest, as well as the
frequency of purchases of these brands. In order to measure brand awareness, respondents were asked
if they had seen the brand before, for each of the main 11 pork brands of interest (i.e., Shuanghui,
Yurun, Jinlou, Chumuxiang, Wens, Jingquishen, Meal Boss, Sushi, NetEase Weiyang, Cofco
Joycome and Yihao Tuzhu). Shares of brand awareness are represented in Figure 7. All the brands of
interest were known by at least some of the participants. Jingquishen (recognized by 15.05% of the
respondents), Chumuxiang (recognized by 15.15% of the respondents) and NetEase Weiyang
(recognized by 15.45% of the respondents) were the least familiar brands, whereas Shuanghui
(recognized by 86.5% of the respondents), Jinlou (recognized by 73.6% of the respondents) and
Yurun (recognized by 58.5% of the respondents) are the most familiar brands.
0%
10%
20%
30%
40%
50%
60%
Daily Weekly Less than weekly
Shar
e of
resp
onde
nts i
n se
gmen
t
Mainstream buyers High end buyers Channel nomads Online buyers

14
Figure 7: Brand awareness Note: premium pork brands displayed in red
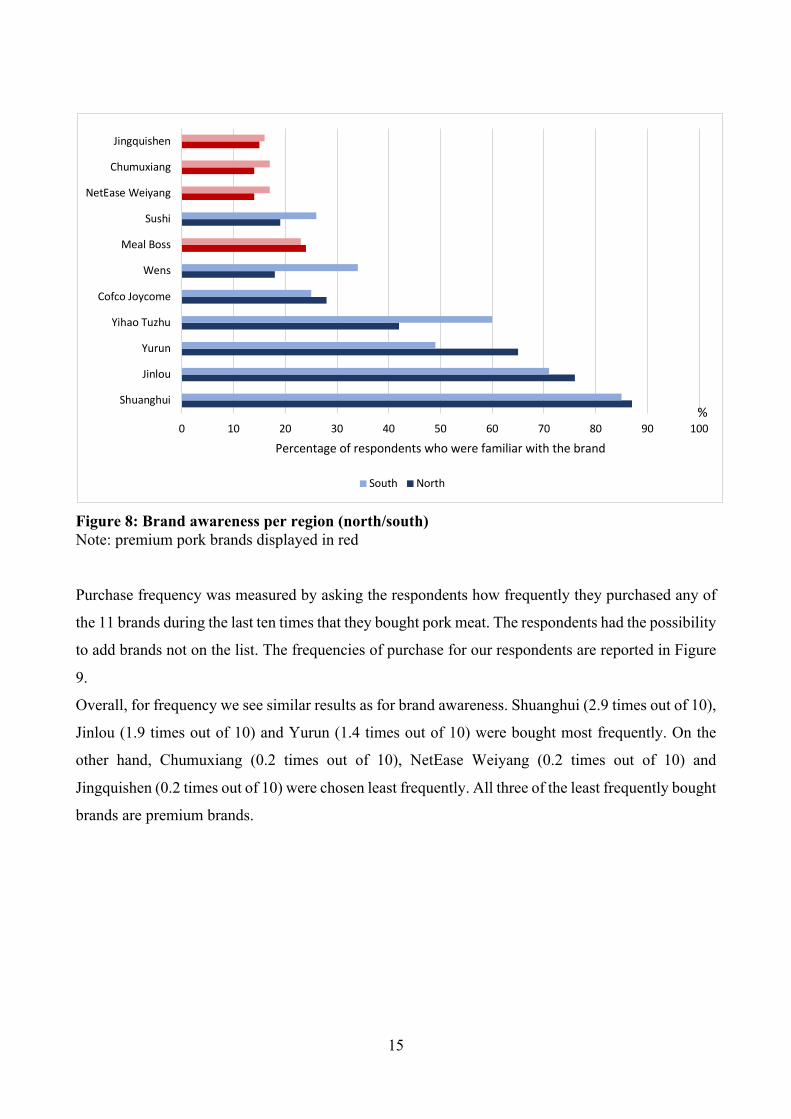
We also investigated if there are any regional differences for brand awareness. Overall, we find that
for some brands there is no impact of the region people live in, but some brands are more popular in
the northern cities (Shanghai, Nanjing, Hangzhou) whereas others are more popular in the southern
cities (Guangzhou & Shenzhen). The results can be found in Figure 8, which is essentially the same
as Figure 7, but with the North/South regional differences included. Respondents in the southern
cities are more aware of Sushi, Wens and Yihao Tuzhu, whereas in the northern cities respondents
are more aware of Yurun and Jinlou. For the remaining brands, including the premium brands (again
displayed with red bars), there are no regional differences in brand awareness.
0 10 20 30 40 50 60 70 80 90 100
Shuanghui
Jinlou
Yurun
Yihao Tuzhu
Cofco Joycome
Wens
Meal Boss
Sushi
NetEase Weiyang
Chumuxiang
Jingquishen
Percentage of respondents who were familiar with the brand
%
15
Figure 8: Brand awareness per region (north/south) Note: premium pork brands displayed in red
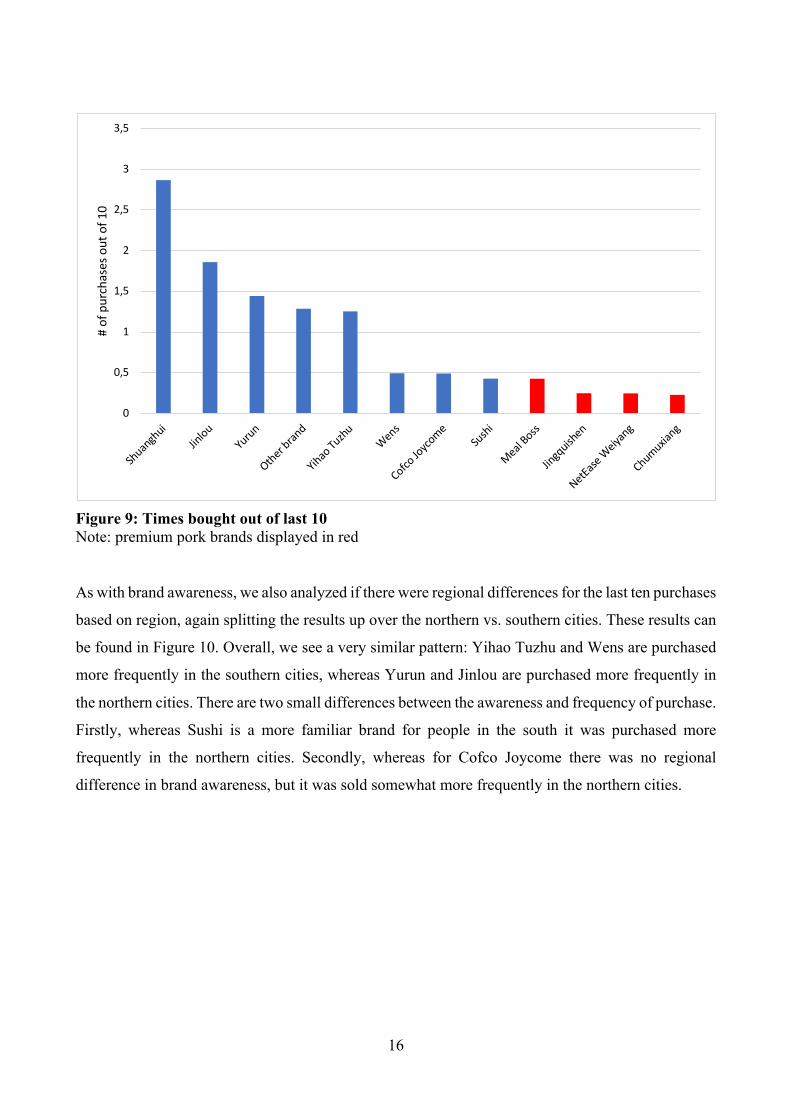
Purchase frequency was measured by asking the respondents how frequently they purchased any of
the 11 brands during the last ten times that they bought pork meat. The respondents had the possibility
to add brands not on the list. The frequencies of purchase for our respondents are reported in Figure
9.
Overall, for frequency we see similar results as for brand awareness. Shuanghui (2.9 times out of 10),
Jinlou (1.9 times out of 10) and Yurun (1.4 times out of 10) were bought most frequently. On the
other hand, Chumuxiang (0.2 times out of 10), NetEase Weiyang (0.2 times out of 10) and
Jingquishen (0.2 times out of 10) were chosen least frequently. All three of the least frequently bought
brands are premium brands.
0 10 20 30 40 50 60 70 80 90 100
Shuanghui
Jinlou
Yurun
Yihao Tuzhu
Cofco Joycome
Wens
Meal Boss
Sushi
NetEase Weiyang
Chumuxiang
Jingquishen
Percentage of respondents who were familiar with the brand
South North
%
16
Figure 9: Times bought out of last 10 Note: premium pork brands displayed in red
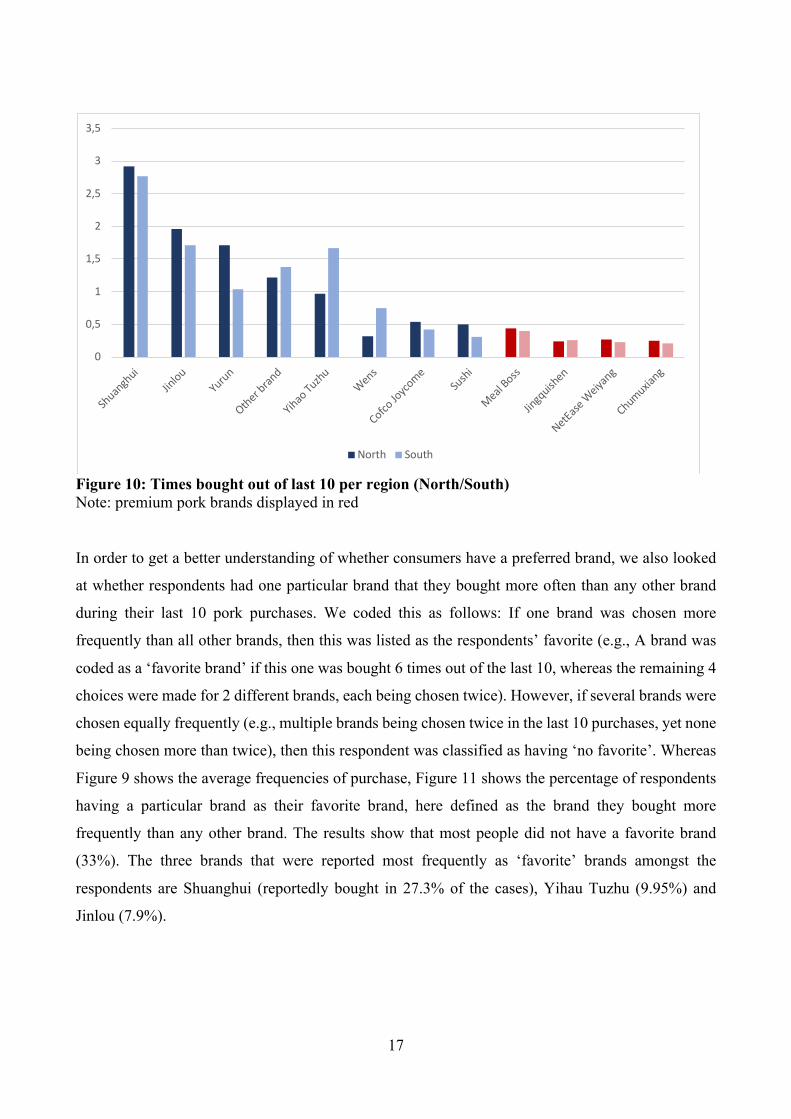
As with brand awareness, we also analyzed if there were regional differences for the last ten purchases
based on region, again splitting the results up over the northern vs. southern cities. These results can
be found in Figure 10. Overall, we see a very similar pattern: Yihao Tuzhu and Wens are purchased
more frequently in the southern cities, whereas Yurun and Jinlou are purchased more frequently in
the northern cities. There are two small differences between the awareness and frequency of purchase.
Firstly, whereas Sushi is a more familiar brand for people in the south it was purchased more
frequently in the northern cities. Secondly, whereas for Cofco Joycome there was no regional
difference in brand awareness, but it was sold somewhat more frequently in the northern cities.
0
0,5
1
1,5
2
2,5
3
3,5
Shuan
ghui
Jinlou
Yurun
Other bran
d
Yihao
Tuzh
uWens
Cofco Jo
ycome
Sush
i
Meal Boss
Jingq
uishen
NetEase W
eiyang
Chumuxiang
# of
pur
chas
es o
ut o
f 10
17
Figure 10: Times bought out of last 10 per region (North/South) Note: premium pork brands displayed in red
In order to get a better understanding of whether consumers have a preferred brand, we also looked
at whether respondents had one particular brand that they bought more often than any other brand
during their last 10 pork purchases. We coded this as follows: If one brand was chosen more
frequently than all other brands, then this was listed as the respondents’ favorite (e.g., A brand was
coded as a ‘favorite brand’ if this one was bought 6 times out of the last 10, whereas the remaining 4
choices were made for 2 different brands, each being chosen twice). However, if several brands were
chosen equally frequently (e.g., multiple brands being chosen twice in the last 10 purchases, yet none
being chosen more than twice), then this respondent was classified as having ‘no favorite’. Whereas
Figure 9 shows the average frequencies of purchase, Figure 11 shows the percentage of respondents
having a particular brand as their favorite brand, here defined as the brand they bought more
frequently than any other brand. The results show that most people did not have a favorite brand
(33%). The three brands that were reported most frequently as ‘favorite’ brands amongst the
respondents are Shuanghui (reportedly bought in 27.3% of the cases), Yihau Tuzhu (9.95%) and
Jinlou (7.9%).
0
0,5
1
1,5
2
2,5
3
3,5
Shuan
ghui
Jinlou
Yurun
Other bran
d
Yihao
Tuzh
uWens
Cofco Jo
ycome
Sush
i
Meal Boss
Jingq
uishen
NetEase W
eiyang
Chumuxiang
North South
18
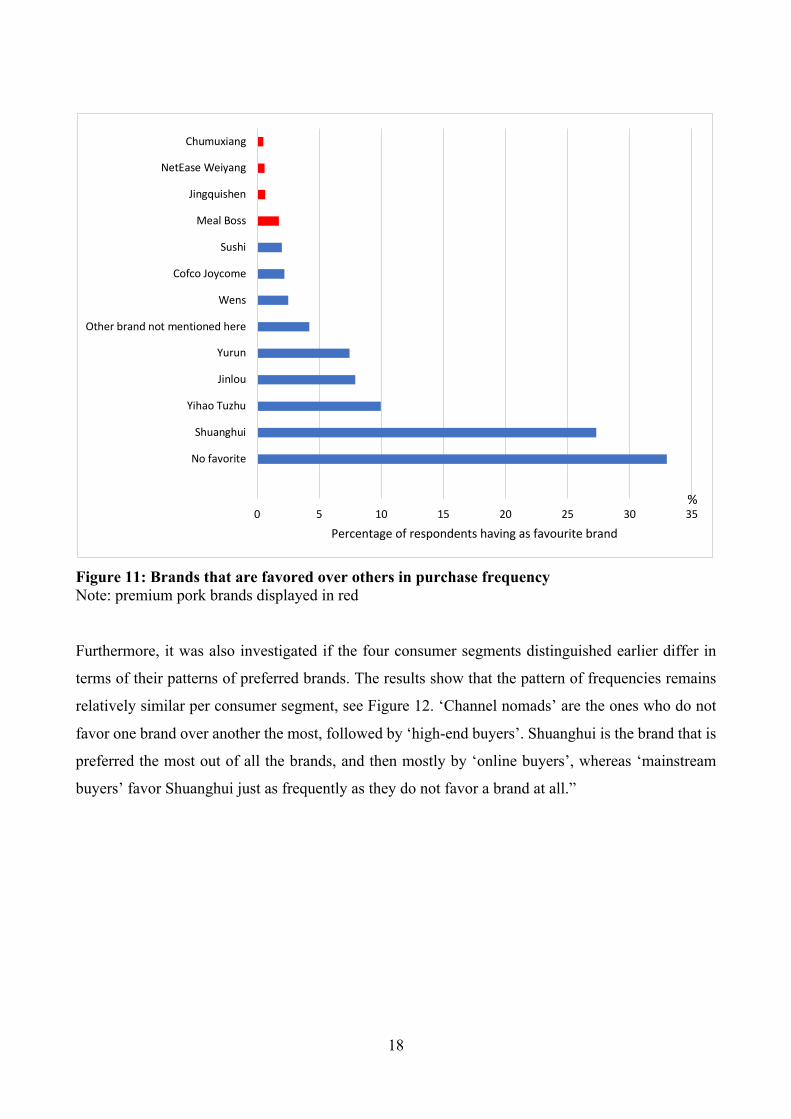
Figure 11: Brands that are favored over others in purchase frequency Note: premium pork brands displayed in red
Furthermore, it was also investigated if the four consumer segments distinguished earlier differ in
terms of their patterns of preferred brands. The results show that the pattern of frequencies remains
relatively similar per consumer segment, see Figure 12. ‘Channel nomads’ are the ones who do not
favor one brand over another the most, followed by ‘high-end buyers’. Shuanghui is the brand that is
preferred the most out of all the brands, and then mostly by ‘online buyers’, whereas ‘mainstream
buyers’ favor Shuanghui just as frequently as they do not favor a brand at all.”
0 5 10 15 20 25 30 35
No favorite
Shuanghui
Yihao Tuzhu
Jinlou
Yurun
Other brand not mentioned here
Wens
Cofco Joycome
Sushi
Meal Boss
Jingquishen
NetEase Weiyang
Chumuxiang
Percentage of respondents having as favourite brand
%
19
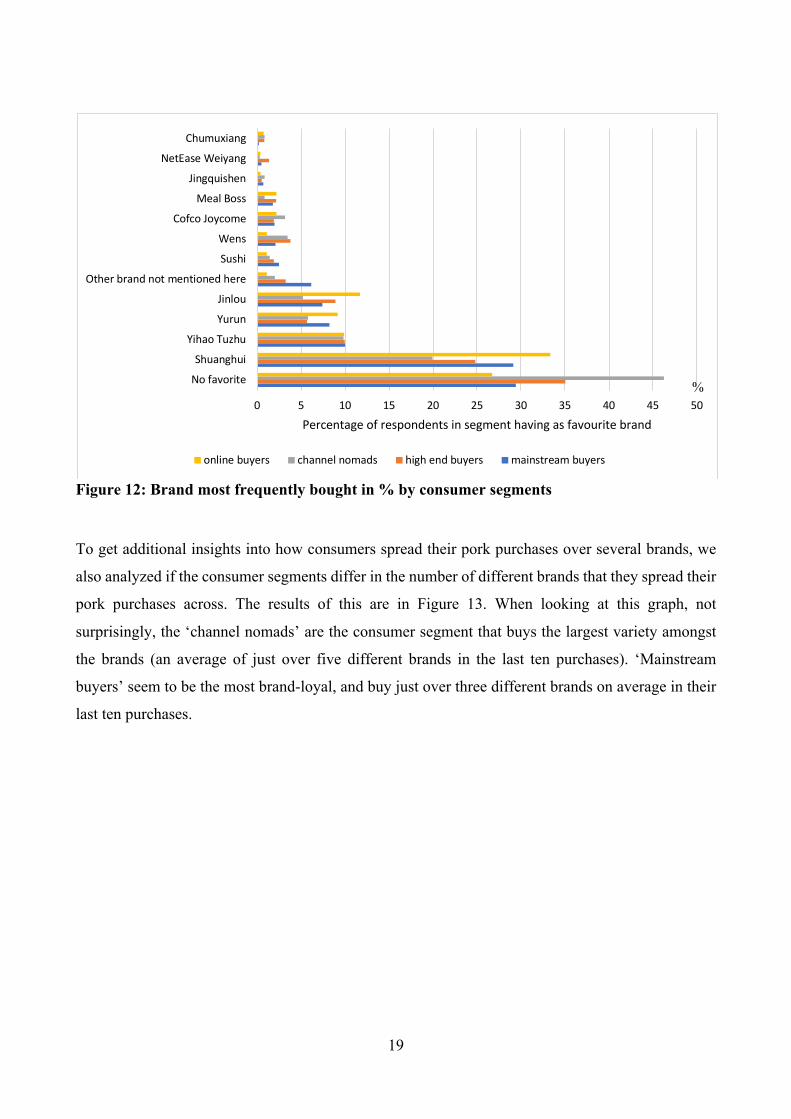
Figure 12: Brand most frequently bought in % by consumer segments
To get additional insights into how consumers spread their pork purchases over several brands, we
also analyzed if the consumer segments differ in the number of different brands that they spread their
pork purchases across. The results of this are in Figure 13. When looking at this graph, not
surprisingly, the ‘channel nomads’ are the consumer segment that buys the largest variety amongst
the brands (an average of just over five different brands in the last ten purchases). ‘Mainstream
buyers’ seem to be the most brand-loyal, and buy just over three different brands on average in their
last ten purchases.
0 5 10 15 20 25 30 35 40 45 50
No favorite
Shuanghui
Yihao Tuzhu
Yurun
Jinlou
Other brand not mentioned here
Sushi
Wens
Cofco Joycome
Meal Boss
Jingquishen
NetEase Weiyang
Chumuxiang
Percentage of respondents in segment having as favourite brand
online buyers channel nomads high end buyers mainstream buyers
%

20
Figure 13: Number of different brands bought by consumer segment
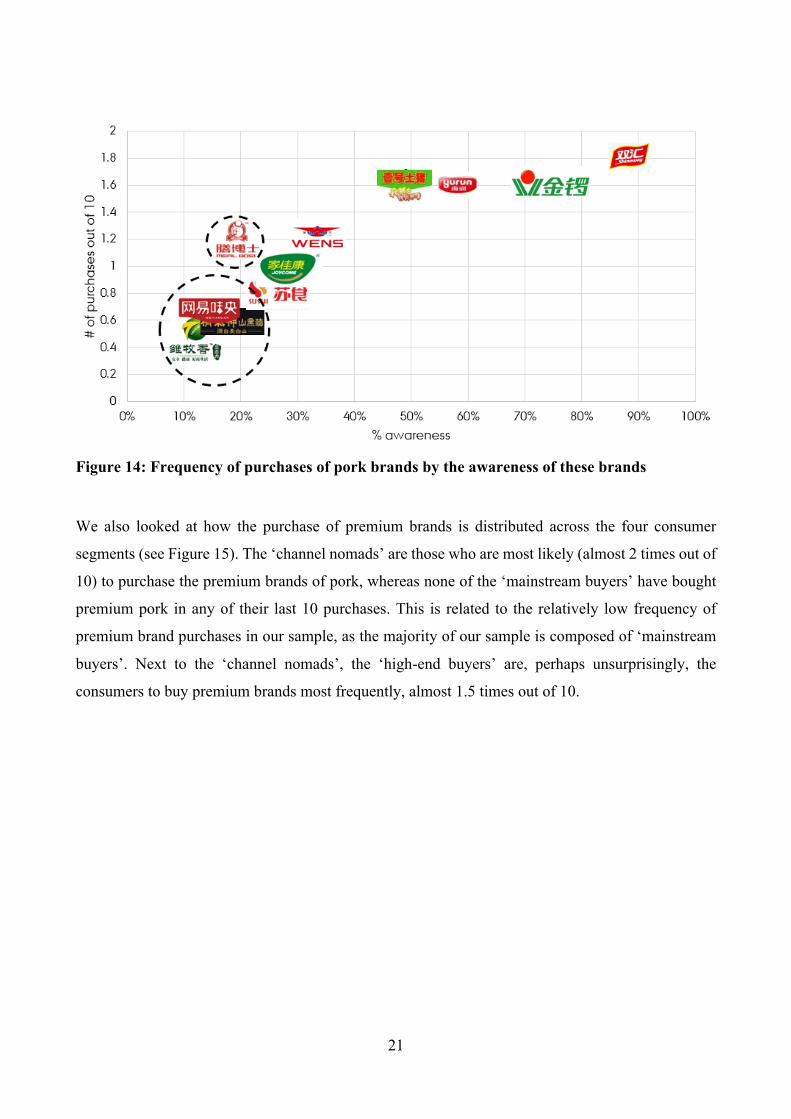
Figure 14 shows the relationship between brand awareness and frequency of brand purchases. Most
familiar and most frequently purchased in the last 10 times are Shuanghui, Jinlou, Yurun and Yihao
Tuzhu (from right to left in Figure 14), with Shuanghui being purchased most frequently (about 1.8
times out of 10 on average) and being most familiar to our sample (about 88% or respondents report
having seen this brand before). The circled brands are the premium brands based on black pork.
1,0
1,5
2,0
2,5
3,0
3,5
4,0
4,5
5,0
5,5
6,0
Mainstream buyers High end buyers Channel nomads Online buyers
Num
ber o
f diff
eren
t bra
nds b
ough
t
21
Figure 14: Frequency of purchases of pork brands by the awareness of these brands
We also looked at how the purchase of premium brands is distributed across the four consumer
segments (see Figure 15). The ‘channel nomads’ are those who are most likely (almost 2 times out of
10) to purchase the premium brands of pork, whereas none of the ‘mainstream buyers’ have bought
premium pork in any of their last 10 purchases. This is related to the relatively low frequency of
premium brand purchases in our sample, as the majority of our sample is composed of ‘mainstream
buyers’. Next to the ‘channel nomads’, the ‘high-end buyers’ are, perhaps unsurprisingly, the
consumers to buy premium brands most frequently, almost 1.5 times out of 10.

22
Figure 15: Premium brand purchases out of 10 purchases by consumer segment
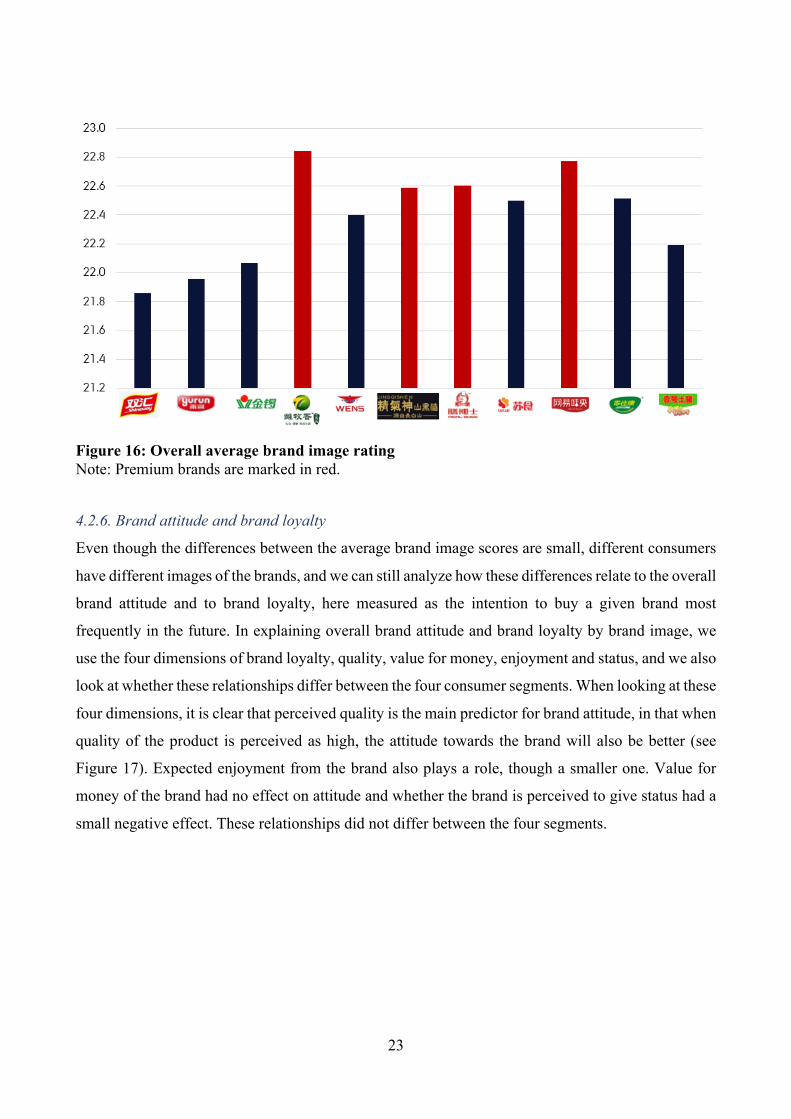
4.2.5. Brand image
As noted in the methods section, brand image was measured in four dimensions: perceived quality of
the brand, whether the brand is perceived to be value for money, whether the brand is expected to
give enjoyment, and whether the brand is expected to give status. Each of these dimensions has a
score from 1 (very low) to 7 (very high). When summed up these ratings together then form the
overall brand image, meaning that this score can range between 4 (very poor brand image) and 28
(very high brand image). This is important to note, as the differences between the average brand
image scores was very small (all total scores ranged between 21.8 and 22.9), see Figure 16. The red
bars in this Figure are the premium pork brands, which have a slightly higher brand image than the
other brands, even though the differences are very small.
1,01,11,21,31,41,51,61,71,81,92,0
Mainstream buyers High end buyers Channel nomads Online buyers
Prem
ium
bra
nd p
urch
ases
out
of
10
purc
hase
s
23
Figure 16: Overall average brand image rating Note: Premium brands are marked in red.
4.2.6. Brand attitude and brand loyalty
Even though the differences between the average brand image scores are small, different consumers
have different images of the brands, and we can still analyze how these differences relate to the overall
brand attitude and to brand loyalty, here measured as the intention to buy a given brand most
frequently in the future. In explaining overall brand attitude and brand loyalty by brand image, we
use the four dimensions of brand loyalty, quality, value for money, enjoyment and status, and we also
look at whether these relationships differ between the four consumer segments. When looking at these
four dimensions, it is clear that perceived quality is the main predictor for brand attitude, in that when
quality of the product is perceived as high, the attitude towards the brand will also be better (see
Figure 17). Expected enjoyment from the brand also plays a role, though a smaller one. Value for
money of the brand had no effect on attitude and whether the brand is perceived to give status had a
small negative effect. These relationships did not differ between the four segments.

24
Figure 17: Influence of brand image on brand attitude
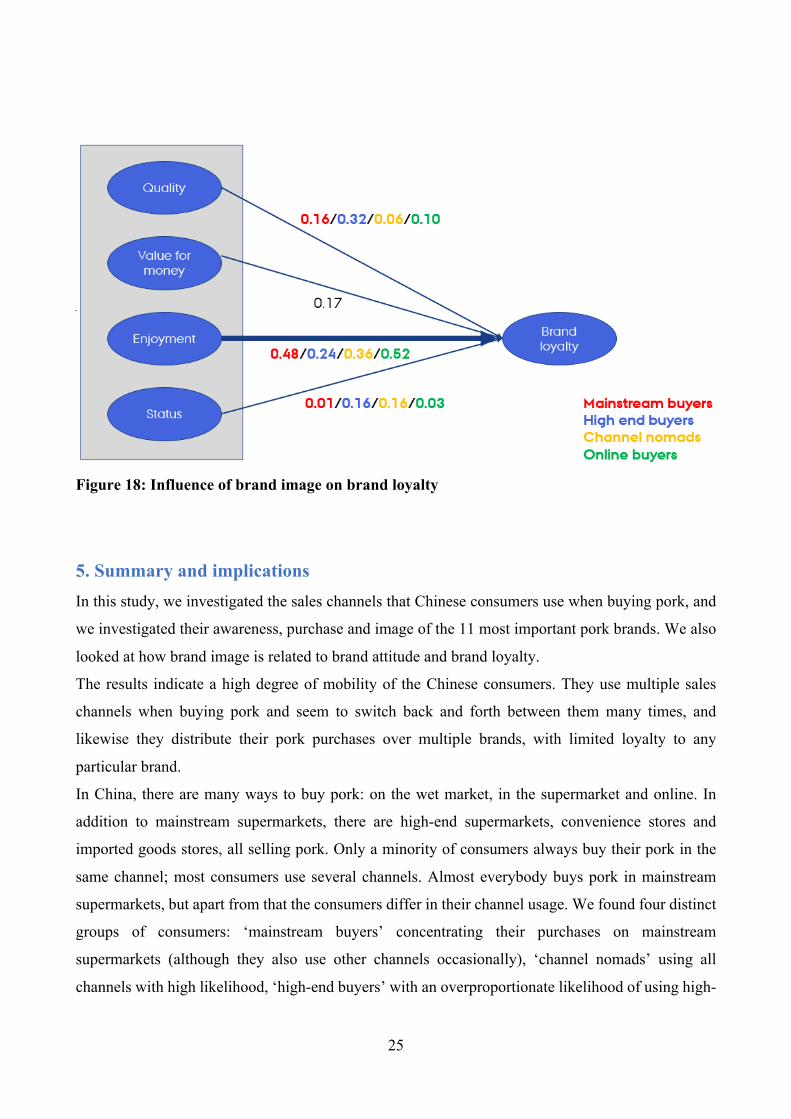
The relationships between brand image and brand loyalty looked different, see Figure 18. Here we
found some interesting differences per consumer segment. Firstly, quality, value for money,
enjoyment and status all had a positive impact on the brand loyalty of consumers. Out of these, the
enjoyment of the brand was the best predictor of subsequent brand loyalty. When looking at the
differences per consumer segments a few things stand out. Firstly, there is no difference for the
consumer segments when it comes to the impact value for money has on brand loyalty. There are,
however, differences for the other three categories. Firstly, quality of the brand has the highest impact
on brand loyalty for ‘high-end buyers’, whereas it has the lowest impact for ‘channel nomads’.
Enjoyment on the other hand plays the biggest role in brand loyalty for the ‘online buyers’, closely
followed by ‘mainstream buyers’, and a still important but somewhat lower impact on brand loyalty
for ‘channel nomads’ and ‘high-end buyers’. Finally, status has the biggest role in brand loyalty for
the ‘channel nomads’ and ‘high-end buyers’, whereas it plays only a very minute role for ‘online
buyers’ and ‘mainstream buyers’.
25
Figure 18: Influence of brand image on brand loyalty
5. Summary and implications In this study, we investigated the sales channels that Chinese consumers use when buying pork, and
we investigated their awareness, purchase and image of the 11 most important pork brands. We also
looked at how brand image is related to brand attitude and brand loyalty.
The results indicate a high degree of mobility of the Chinese consumers. They use multiple sales
channels when buying pork and seem to switch back and forth between them many times, and
likewise they distribute their pork purchases over multiple brands, with limited loyalty to any
particular brand.
In China, there are many ways to buy pork: on the wet market, in the supermarket and online. In
addition to mainstream supermarkets, there are high-end supermarkets, convenience stores and
imported goods stores, all selling pork. Only a minority of consumers always buy their pork in the
same channel; most consumers use several channels. Almost everybody buys pork in mainstream
supermarkets, but apart from that the consumers differ in their channel usage. We found four distinct
groups of consumers: ‘mainstream buyers’ concentrating their purchases on mainstream
supermarkets (although they also use other channels occasionally), ‘channel nomads’ using all
channels with high likelihood, ‘high-end buyers’ with an overproportionate likelihood of using high-
26
end supermarkets and imported goods stores, and finally ‘online buyers’ who buy frequently online,
although they buy frequently in mainstream supermarkets too. These four consumer segments also
differ in their likelihood of encountering pork brands in other media.
When analyzing brand purchases, we found that most people are not loyal to one brand, but rather
spread their purchases across several brands. There is some North-South variation in which brands
people know and buy. Relatively few people buy the premium brands based on black pork, although
this varies considerably over the four consumer segments that we identified.
Our brand image measure showed little variation in the average brand image score across brands. Part
of this is probably a methodological issue, as cultural factors mean that Chinese respondents have a
tendency to concentrate their survey response in the positive end of a scale, meaning that the range
of outcomes becomes narrowed down. However, our results from Work Package 1 already indicated
that the degree of brand differentiation in China is low. Even though there is a considerable
proliferation of pork brands, the main selling points and the brand positioning does not differ
noticeably between the mainstream brands, and the same is true within the group of premium brands.
Thus, the fact that the average brand image scores do not differ much also mirrors the fact that the
various brands’ brand identity does not differ much either.
We did, however, find interesting results on the relationship between the brand image and the overall
attitude towards buying the brand and the loyalty to the brand. The overall attitude to the brand is
mainly driven by the extent to which the brand is associated with high quality. However, brand loyalty
is driven more by what can be called the ‘soft’ dimensions of brand image, namely the enjoyment
and the status that the brand is perceived to convey. While Chinese consumers’ evaluation of whether
a brand is good to buy thus is driven mainly by the perception of the functional benefits of the brand,
their purchases are more driven by the emotional and expressive benefits.
Branding is a tool that allows consumers to become loyal to a product that they believe is superior to
its competitors. This basic function of branding is contingent on consumers actually perceiving
differences between competing brands that they regard as important and relevant for themselves. Our
results suggest that pork brands in China do not yet fully achieve this aim, as brand loyalty is low and
perceived differences between brands are small. This may be bad news for the existing brands, but it
is good news for those that aim at professional brand building in China. It is well-known that Chinese
consumers view buying pork as risky, given a history of food scandals and a lack of trust in food
chain actors (Kim, Shim, & Dinnie, 2013; Liu, Pieniak, & Verbeke, 2014). This does give room for
brand development, as a clear and credible brand is a major risk reliever for consumers (Roselius,
27
1971). A clear and credible brand needs to be developed over time, and it needs to build on a brand
history that is relevant for consumers, is differentiated from competitors, and is substantiated in a way
that builds trust in the brand. Chinese consumers’ risk perception when buying pork is linked to
aspects of safety, health and quality, but our results underline the importance of linking these
functional benefits to the benefits relating to enjoyment and status. Finding ways of best combining
these different types of benefits in a credible brand positioning will be a major task to be addressed
in WP4.
When building and implementing such a brand positioning, our results underline the importance of
doing this consistently across the different sales channels. Most consumers use several sales channels
simultaneously, and a clear and credible brand positioning can only be achieved if the consumer
encounters the brand in the same way across the channels. Brand building therefore requires close
cooperation with the different channel intermediaries, and the conditions under which this can be
achieved will be addressed in WP3.

28
References Esch, F.-R., Langner, T., Schmitt, B. H., & Geus, P. (2006). Are brands forever? How brand knowledge and
relationships affect current and future purchases. Journal of Product & Brand Management, 15(2),
98-105.
Keller, K. (2003). Strategic brand management: Building, measuring, and managing brand equity. Upper
Saddle River, NJ: Prentice Hall.
Kim, Y. K., Shim, S. W., & Dinnie, K. (2013). The Dimensions of Nation Brand Personality: A Study of
Nine Countries. Corporate Reputation Review, 16(1), 34-47. doi:10.1057/crr.2012.22
Lemon, K. N., & Verhoef, P. C. (2016). Understanding customer experience throughout the customer
journey. Journal of Marketing, 80(6), 69-96.
Liu, R., Pieniak, Z., & Verbeke, W. (2014). Food-related hazards in China. Consumers' perceptions of risk
and trust in information sources. Food Control, 46, 291–298.
Nandan, S. (2005). An exploration of the brand identity–brand image linkage: A communications
perspective. Journal of Brand Management, 12(4), 264-278.
Rohm, A. J., & Swaminathan, V. (2004). A typology of online shoppers based on shopping motivations.
Journal of Business Research, 57, 748-757.
Roselius, T. (1971). Consumer rankings of risk reduction methods. Journal of Marketing, 31(1), 56-61.
Steptoe, A., Pollard, T. M., & Wardle, J. (1995). Development of a measure of the motives underlying the
selection of food. The food choice questionnaire. Appetite, 25(3), 267-284.
Sweeney, J. C., & Soutar, G. N. (2001). Consumer perceived value: The development of a multiple item
scale. Journal of Retailing, 77, 203-220.
Wang, O., De Steur, H., Gellynck, X., & Verbeke, W. (2015). Motives for consumer choice of traditional
food and European food in mainland China. Appetite, 87, 143-151. doi:10.1016/j.appet.2014.12.211