Embed Size (px)
Citation preview

PORT COMPETITION IN CHINAPORT COMPETITION IN CHINA
Prof. Kevin Cullinane
Director, Transport Research Institute,
Napier University

23 October 2007 ITRR Seminar 2
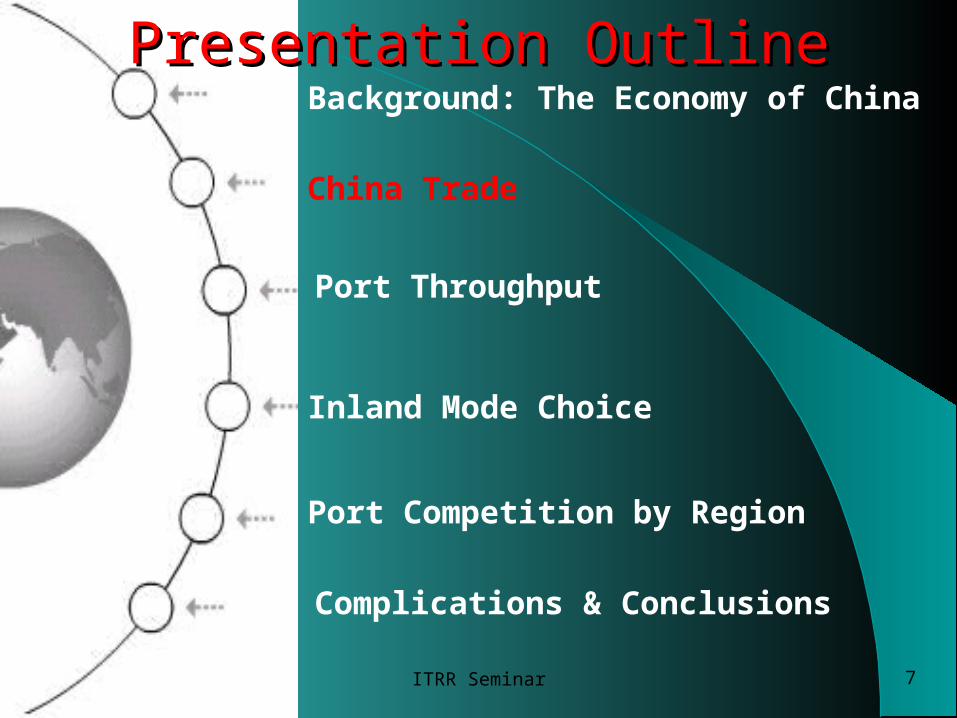
Presentation OutlinePresentation Outline
Port Throughput
China Trade
Background: The Economy of China
Port Competition by Region
Complications & Conclusions
Inland Mode Choice

23 October 2007 ITRR Seminar 3
0
5000
10000
15000
20000
1970 1975 1980 1985 1990 1995 2000 2005
Year
Rm
b (
bil
lio
ns)
-5
0
5
10
15
20
25
Per
cen
tag
e
GDP at current prices Real annual growth rate (%)
CHINA’S GDP GROWTHCHINA’S GDP GROWTH

23 October 2007 ITRR Seminar 4
CHINA’S REAL GROWTH IN CHINA’S REAL GROWTH IN INDUSTRIAL OUTPUT INDUSTRIAL OUTPUT
0
5
10
15
20
25
1980 1985 1990 1995 2000 2005
Year
Per
cen
tag
e

23 October 2007 ITRR Seminar 5
0
20
40
60
80
100
120
140
1985 1988 1991 1994 1997 2000 2003
Year
US
$ B
illi
on
s
Contracted Utilised
FDI INFLOWSFDI INFLOWS

23 October 2007 ITRR Seminar 6
FDI INFLOWS IN ASIAFDI INFLOWS IN ASIA
23 October 2007 ITRR Seminar 7
Presentation OutlinePresentation Outline
Port Throughput
China Trade
Background: The Economy of China
Port Competition by Region
Complications & Conclusions
Inland Mode Choice

23 October 2007 ITRR Seminar 8
0100200300400500600700800900
1995 1996 1997 1998 1999 2000 2001 2002 2003 2004 2005
Year
US
$ b
illi
on
Exports Imports
CHINA’S INTERNATIONAL CHINA’S INTERNATIONAL TRADETRADE

23 October 2007 ITRR Seminar 9
Commodity Description US$ billion
Electrical machinery & equipment 172.32
Power generation equipment 149.72
Apparel 65.90
Iron & steel 34.12
Optics & medical equipment 25.48
Furniture & bedding 22.36
Toys & games 19.12
Inorganic & organic chemicals 19.06
Footwear & parts thereof 19.05
Plastics 17.78
Commodity Description US$ billion
Electrical machinery & equipment 174.84
Power generation equipment 96.37
Mineral fuel & oil 64.10
Optical & medical equipment 49.97
Plastics & articles thereof 33.32
Inorganic & organic chemicals 32.83
Iron & steel 31.91
Ore, slag, & ash 26.01
Copper & articles thereof 12.90
Vehicles & parts other than rail 12.31
CHINA’S TOP IMPORTS CHINA’S TOP EXPORTS
20052005

23 October 2007 ITRR Seminar 10
CHINA’S TOP IMPORT ORIGINS
CHINA’S TOP EXPORT DESTINATIONS
Country/Region US$ billion
Japan 100.45
South Korea 76.82
Taiwan 74.68
United States 48.73
Germany 30.72
Malaysia 20.10
Singapore 16.52
Australia 16.19
Russia 15.89
Thailand 13.99
Country/Region US$ billion
United States 162.90
Hong Kong 124.48
Japan 83.99
South Korea 35.11
Germany 32.53
Netherlands 25.88
United Kingdom 18.98
Singapore 16.63
Taiwan 16.55
Russia 13.21
20052005

23 October 2007 ITRR Seminar 11
Presentation OutlinePresentation Outline
Port Throughput
China Trade
Background: The Economy of China
Port Competition by Region
Other Influential Factors & Conclusions
Inland Mode Choice
23 October 2007 ITRR Seminar 12
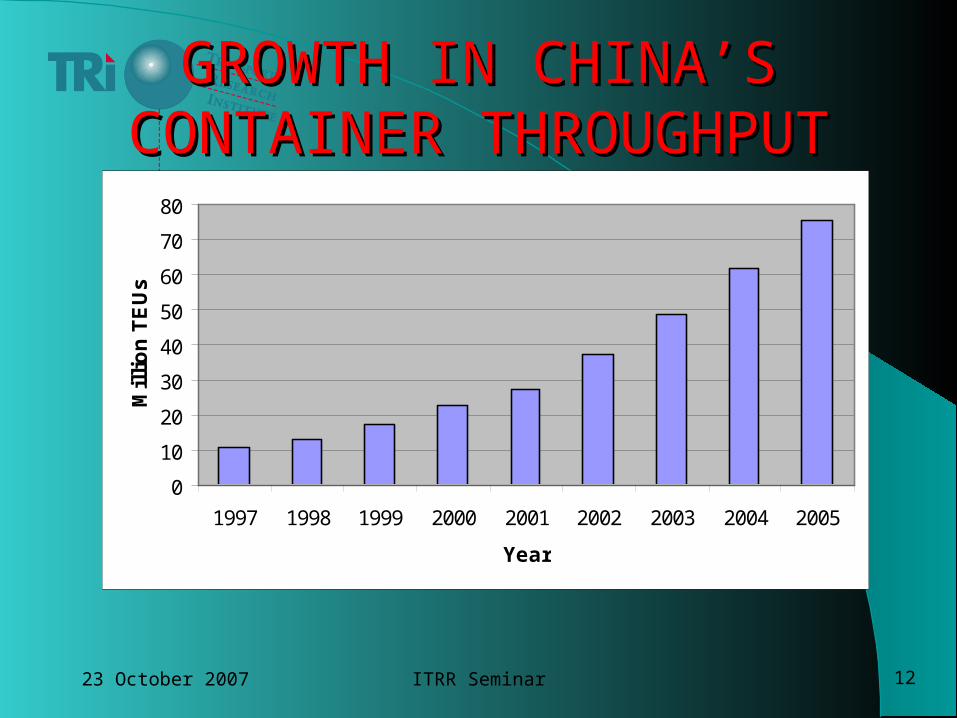
GROWTH IN CHINA’S GROWTH IN CHINA’S CONTAINER THROUGHPUTCONTAINER THROUGHPUT
0
10
20
30
40
50
60
70
80
1997 1998 1999 2000 2001 2002 2003 2004 2005
Year
Mil
lio
n T
EU
s
23 October 2007 ITRR Seminar 13
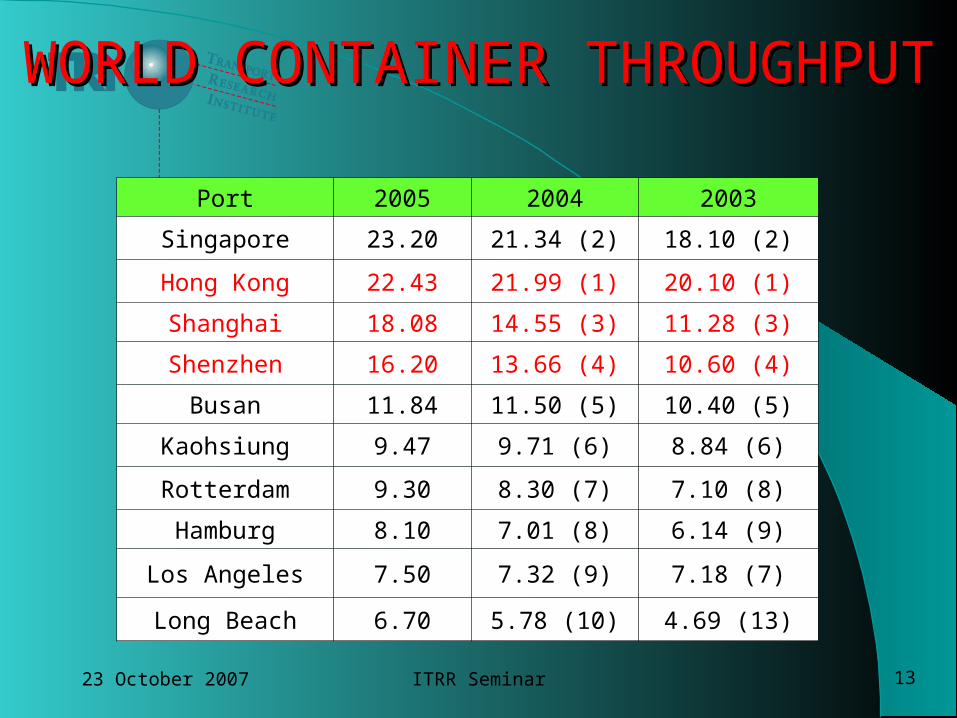
Port 2005 2004 2003
Singapore 23.20 21.34 (2) 18.10 (2)
Hong Kong 22.43 21.99 (1) 20.10 (1)
Shanghai 18.08 14.55 (3) 11.28 (3)
Shenzhen 16.20 13.66 (4) 10.60 (4)
Busan 11.84 11.50 (5) 10.40 (5)
Kaohsiung 9.47 9.71 (6) 8.84 (6)
Rotterdam 9.30 8.30 (7) 7.10 (8)
Hamburg 8.10 7.01 (8) 6.14 (9)
Los Angeles 7.50 7.32 (9) 7.18 (7)
Long Beach 6.70 5.78 (10) 4.69 (13)
WORLD CONTAINER WORLD CONTAINER THROUGHPUTTHROUGHPUT

23 October 2007 ITRR Seminar 14
Presentation OutlinePresentation Outline
Port Throughput
China Trade
Background: The Economy of China
Port Competition by Region
Other Influential Factors & Conclusions
Inland Mode Choice

23 October 2007 ITRR Seminar 15
Internal DistributionInternal Distribution
CharacteristicsModes
Truck Rail Barge and coastal ship
cost high low low
market coverage point-to-point terminal-to-terminal
terminal-to-terminal
speed fast slow-moderate slow
schedule casual fixed fixed
damage low moderate-high low-moderate

23 October 2007 ITRR Seminar 16
Disadvantages ofDisadvantages of Truck Haulage Truck Haulage
Poor quality highwaysPrevalence of non-ISO containersShortages of dedicated container haulage
companiesShortages of tractor and container unitsMany small operators

23 October 2007 ITRR Seminar 17
Disadvantages ofDisadvantages of Rail Haulage Rail Haulage
Old technology and poor train facilitiesPoor quality railway infrastructureInadequate ICDsNetwork priority given to military, coal,
passengers, rather than containersThe prevalence of non-ISO containersThe poor quality of the tracking systemInadequate softwareNo effective competition

23 October 2007 ITRR Seminar 18
Modal SharesModal Shares
85%
13%2%
Truck
Water
Rail
23 October 2007 ITRR Seminar 19
Presentation OutlinePresentation Outline
Port Throughput
China Trade
Background: The Economy of China
Port Competition by Region
Other Influential Factors & Conclusions
Inland Mode Choice

23 October 2007 ITRR Seminar 20

23 October 2007 ITRR Seminar 21
Top Ten Container Ports in China in 1998Top Ten Container Ports in China in 1998
0 500,000 1,000,000 1,500,000 2,000,000 2,500,000 3,000,000 3,500,000
Zhuhai
Ningbo
Zhoushan
Dalian
Xiamen
Guangzhou
Tianjin
Qingdao
Shenzhen
Shanghai
0 5 10 15 20
TEUs (Millions)
Dalian
Xiamen
Guangzhou
Tianjin
Ningbo
Qingdao
Shenzhen
Shanghai
Top Eight Container Ports in China in 2005Top Eight Container Ports in China in 2005
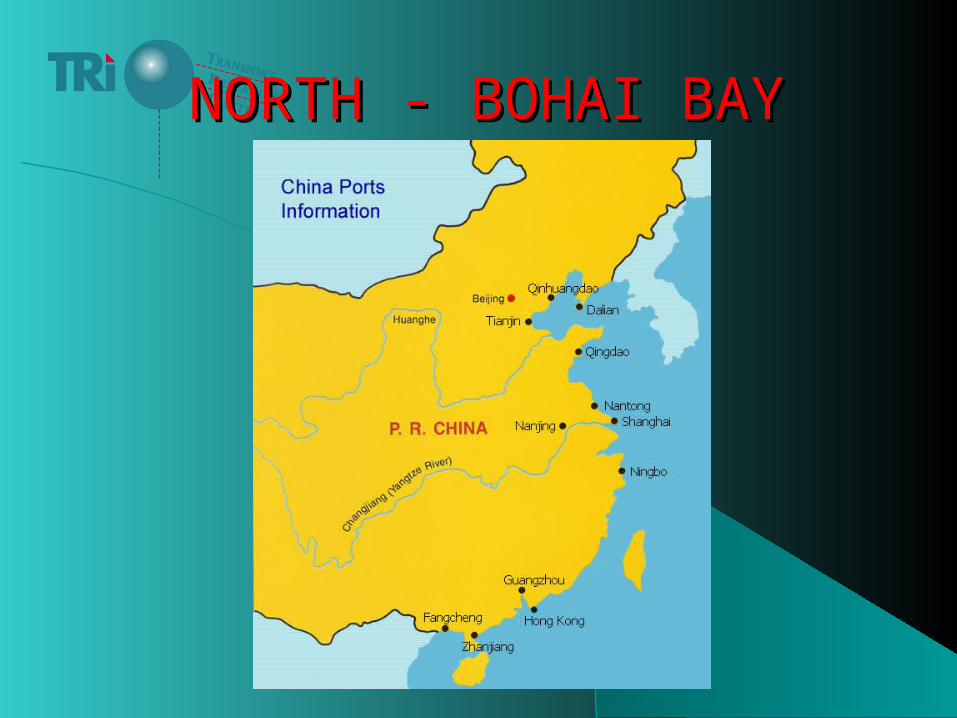
NORTH - BOHAI BAYNORTH - BOHAI BAY

23 October 2007 ITRR Seminar 23
Competition FactorsCompetition Factors
Proximity to Beijing Access to traditional industry sector in
Liaoning province Presence of major international container
handling companies in competing ports Poor inland transport links except for Tianjin Sea distance and time to Tianjin Air freight potential at Tianjin Political preference for Tianjin

CENTRAL EASTERNCENTRAL EASTERN SEABOARDSEABOARD

23 October 2007 ITRR Seminar 25
Historic Throughput at Shanghai Port
0.0
0.5
1.0
1.5
2.0
2.5
3.0
3.5
1980 1982 1984 1986 1988 1990 1992 1994 1996 1998
Year
TE
U (
Millio
ns)
)
Imports Exports

23 October 2007 ITRR Seminar 26
Container Throughput for Shanghai and Ningbo
0
2
4
6
8
10
12
1997 1998 1999 2000 2001 2002
Year
TE
U (
Mil
lio
ns)
)
Shanghai Ningbo

23 October 2007 ITRR Seminar 27
Annual Growth Rates in Container Throughput for Shanghai and Ningbo
0
10
20
30
40
50
60
70
1998 1999 2000 2001 2002
Year
Gro
wth
Ra
te (
%)
Shanghai Ningbo

23 October 2007 ITRR Seminar 28
SCT
WAIGAOQIAO PHASE 1~4
YANGSHAN TERMINAL
NBCT & BL2CT
BL3CT
HANGZHOU BAY BRIDGE
23 October 2007 ITRR Seminar 29
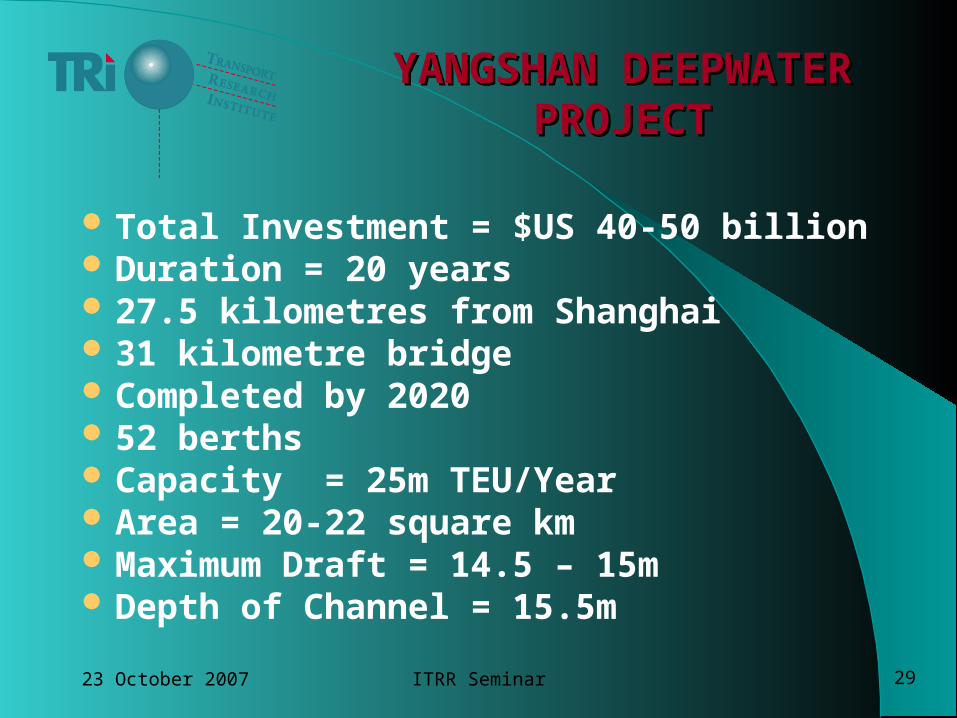
YANGSHAN DEEPWATER YANGSHAN DEEPWATER PROJECTPROJECT
Total Investment = $US 40-50 billion Duration = 20 years 27.5 kilometres from Shanghai 31 kilometre bridge Completed by 2020 52 berths Capacity = 25m TEU/Year Area = 20-22 square km Maximum Draft = 14.5 – 15m Depth of Channel = 15.5m

23 October 2007 ITRR Seminar 30
YANGSHAN PHASE 1YANGSHAN PHASE 1(ARTIST’S IMPRESSION)(ARTIST’S IMPRESSION)

23 October 2007 ITRR Seminar 31
YANGSHAN PHASE 1YANGSHAN PHASE 1(OPEN FOR BUSINESS)(OPEN FOR BUSINESS)

23 October 2007 ITRR Seminar 32
DONG HAI BRIDGE DONG HAI BRIDGE PROJECTPROJECT
Links Yangshan with mainlandCost estimated at US$ 11.5bn4-5 years to complete – 200531.3km long31.5m wide with six lanesShanghai Municipal Government
responsible for all investment

23 October 2007 ITRR Seminar 33

23 October 2007 ITRR Seminar 34

23 October 2007 ITRR Seminar 35
HANGZHOU BAYHANGZHOU BAYBRIDGE PROJECTBRIDGE PROJECT
Construction started in 2003In service in 2009Total length = 36 kilometres6 lanesBoth sides of bridge connect
directly with expressways – no congestion problems

23 October 2007 ITRR Seminar 36
JIAXIN
Cargo through Ningbo Cargo through Shanghai.

23 October 2007 ITRR Seminar 37
SOUTHERN CHINASOUTHERN CHINA

Main Container Ports in Main Container Ports in the PRDthe PRD
23 October 2007 ITRR Seminar 39
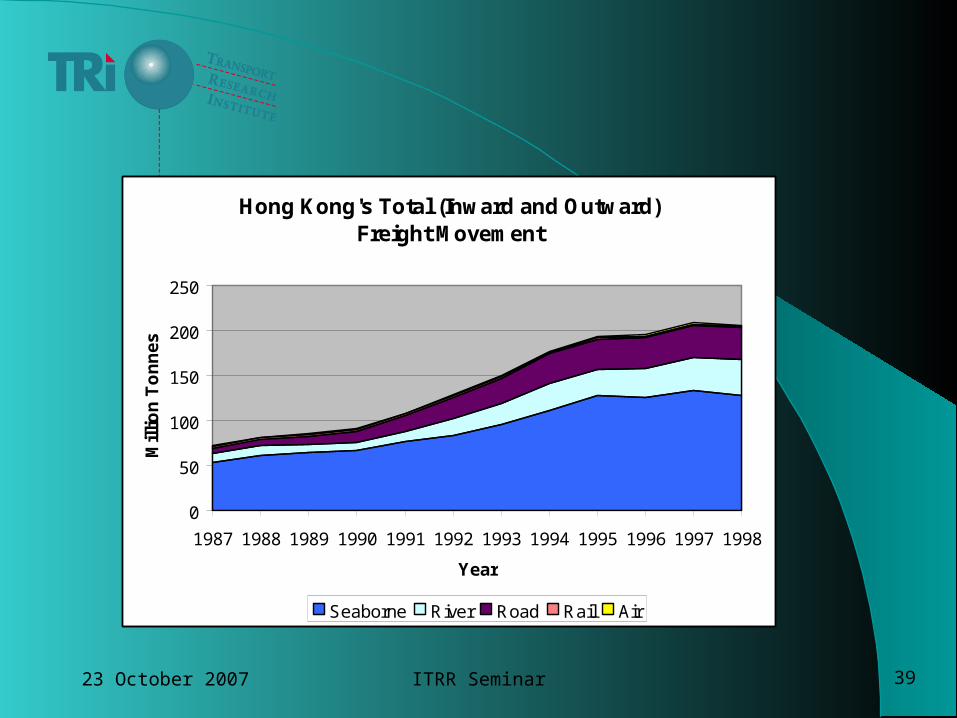
Hong Kong's Total (Inward and Outward)Freight Movement
0
50
100
150
200
250
1987 1988 1989 1990 1991 1992 1993 1994 1995 1996 1997 1998
Year
Mil
lio
n T
on
ne
s
Seaborne River Road Rail Air

23 October 2007 ITRR Seminar 40
Modal Split in 2005Modal Split in 2005
Seaborne: 85%
Road: 14%
Road has stabilised
Water has grown tremendously
Rail continues to decline
Air continues to increase – now carries 4 times that of rail

23 October 2007 ITRR Seminar 41
FEU Transport Costs FEU Transport Costs (Dongguan to Long Beach)(Dongguan to Long Beach)
Via Hong Kong (US$)
Via Yantian (US$)
Cost Differential
(US$)Trucking to main terminal 360 166 194Declaration fee 50 30 20Documentation fee 14 14 0Basic oceanfreight charge 1160 1210 -50Destination delivery 740 740 0BAF 230 230 0Origin receiving Charge N/A N/A 0Terminal handling charge 366 269 97
Total 2,920 2,659 261

23 October 2007 ITRR Seminar 42
Projected Container Throughput for the Port of Hong Kong
16.2
29.5
40.135.7
24.9
0
5
10
15
20
25
30
35
40
45
1999 2005 2010 2015 2020
Year
Mill
ion
TE
Us

23 October 2007 ITRR Seminar 43
PORT CARGO PORT CARGO FORECASTSFORECASTS
Forecast average annual growth rate for PRD cargo base is 8.6% to 2020
Forecast average annual growth rate for Hong Kong port is 4.4% to 2020
This implies the market share of Shenzhen will grow from 16% as of 1999 to 55% by 2020

23 October 2007 ITRR Seminar 44
Presentation OutlinePresentation Outline
Port Throughput
China Trade
Background: The Economy of China
Port Competition by Region
Complications & Conclusions
Inland Mode Choice
23 October 2007 ITRR Seminar 45
What China DoesWhat China Does(Policy Decisions)(Policy Decisions)
Infrastructure Improvements The ‘Go West’ Policy Yangszte River Improvements Deregulation and privatisation
New port clusters announced in Xiamen and Zhuhai
If trade relations are restored between Taiwan and China Taiwan will take all of the North China trade
and 65% of the South China trade that moves through Hong Kong

23 October 2007 ITRR Seminar 46

23 October 2007 ITRR Seminar 47
Impact of China’s accession to the WTO Changes to customs procedures etc Impact on FDI and trade Port Law 2004 Opening up of port and logistics market
Price vs Efficiency – you get what you pay for! Larger Containerships
Maintain load factors Load centring/ Hub and spoke systems
Increased concentration in liner shipping Vertical integration by liner shipping
Dedicated terminals Whole ports
Role of 3PLs in port choice
BUSINESS STRATEGYBUSINESS STRATEGY

23 October 2007 ITRR Seminar 48
Become more price competitive Improve service quality Expand service range (logistics parks
etc) Reap economies of scale
Greater efficiency Lower prices
Globalisation and concentration of port operations
Diversification into logistics
PORT SECTOR PORT SECTOR RESPONSERESPONSE

23 October 2007 ITRR Seminar 49
Presentation OutlinePresentation Outline
Port Throughput
China Trade
Background: The Economy of China
Port Competition by Region
Complications & Conclusions
Inland Mode Choice

23 October 2007 ITRR Seminar 50
China economy will continue to grow and trade expand – demand increasing
Infrastructure investment and improvements in ports and inland logistics will continue – fuelled by WTO accession, FDI, technology & knowledge transfer
Continued service rationalisation and the deployment of large containerships

23 October 2007 ITRR Seminar 51
Reinforcement of load centre concept and expansion of ports
Hinterlands will increasingly overlap and ports compete for the same cargo base
Greater industrial concentration in ports and in shipping sectors is a complication (economic vs commercial benefits, as is vertical integration into logistics (capturing the cargo)

Thank You