Embed Size (px)
Citation preview
Port Harcourt
Waterfront Urban Regeneration Scoping Study
Port Harcourt Waterfront looking north over Aggrey Estate towards the State Secretariat
December 2009
Max Lock Consultancy Nigeria Ltd was commissioned by Brunel Engineering and Consulting Limited to research and produce this report on the Port Harcourt Waterfront Urban Regeneration Scoping Study. © Max Lock Consultancy Nigeria Ltd. 2009 ISBN 978-1-905632-06-0 Published by MLC Press, University of Westminster, London, UK 2009 All rights reserved. No part of this publication may be reproduced, stored in any retrieval system or transmitted in any form or by any means electronic, mechanical, photocopying, recording or otherwise, without prior permission of the copyright owners. Nevertheless, short excerpts may be reproduced without authorisation, on condition that the source is clearly indicated. For rights of reproduction or translation, applications should be made to the copyright contacts given below: Max Lock Consultancy Nigeria Ltd 17, Fadan Kaje Street, Narayi, Kaduna South, Kaduna State, NIGERIA Mo: + 234 (0) 8023366843 Ph: + 234 (0) 62230400 www.maxlockcentre.org [email protected]
Max Lock Centre School of Architecture & the Built Environment, University of Westminster, 35, Marylebone Road, London NW1 5LS UNITED KINGDOM Ph: + 44 (0) 20 79115000 ext:3131 www.maxlockcentre.org [email protected]
Acknowledgements This report was produced with the collective inputs of the team listed below consisting of participants from, and close associates of, the Max Lock Consultancy Nigeria Ltd and the Max Lock Centre at the University of Westminster. The report was edited by Tony Lloyd-Jones in London and Mike Theis is Kaduna, and project managed by Simon Gusah.
Our special thanks go to TPL Mina Aprioku, Director (Development Control) Rivers State Ministry for Urban Development, whose extensive local knowledge of the Waterfront Area we drew on.
The Team: Dr Mike Theis Tony Lloyd-Jones Samuel Adenekan Simon Gusah Malcolm Moor Dominic Gusah Budhi Mulyawan
Contents 1. Executive summary 2. Introduction
2.1 Port Harcourt Waterfront study area background 2.2 Methodology
3. Key issues and challenges 3.1 Living conditions in the informal settlements and the MDGs 3.2 Strategic and environmental planning concerns
4. The policy context 4.1 Planning policy context 4.2 The Rivers State Government demolitions policy 4.3 Housing and planning policy implications
5. Survey findings 5.1. The Port Harcourt Waterfront communities: satellite image analysis 5.2 Pilot sample household interview survey: key findings
6. Urban regeneration proposals 6.1 Planning principles, guidelines and strategic options 6.2 Urban design for the new Garden Cities 6.3 Housing and demand and supply options 6.4 Implementing the Urban Regeneration Strategy
References Appendices
Appendix A: Stakeholder consultation and local survey Appendix B: Household interview survey report Appendix C: Interview transcript Appendix D: Satellite images of Waterfront Communities Appendix E: Regional maps Appendix F: Brief for Main Study Appendix G: UN-HABITAT Mission Report recommendations
List of figures 1.1. Study area 5 1.2. Waterside area 5 1.3. Maps of Rivers State 6 4.1. Rivers State Government publicity leaflet 18 5.1. Port Harcourt satellite image analysis 23 5.2. Type A survey area 24 5.3. Type B survey area 25 5.4. Type C survey area 25 5.5. Typical long building 25 6.1. Potential infill development and environmental potential of wetlands area 33 6.2. Development opportunities Garden City proposals 35 6.3. Land use proposal of Borokiri Garden City 36 6.4. Commercial mixed-use development 37 6.5. Medium density residential development 38 6.6. High density mixed use development 40 6.7. Building typologies 41 6.8. Port Harcourt Waterfront Regeneration partnership 44 List of tables
5.1. Selected Areas of Waterfront Development 26 6.1. Port Harcourt Land use budget/service delivery standards 31

Port Harcourt Waterfront Urban Regeneration Strategy
1
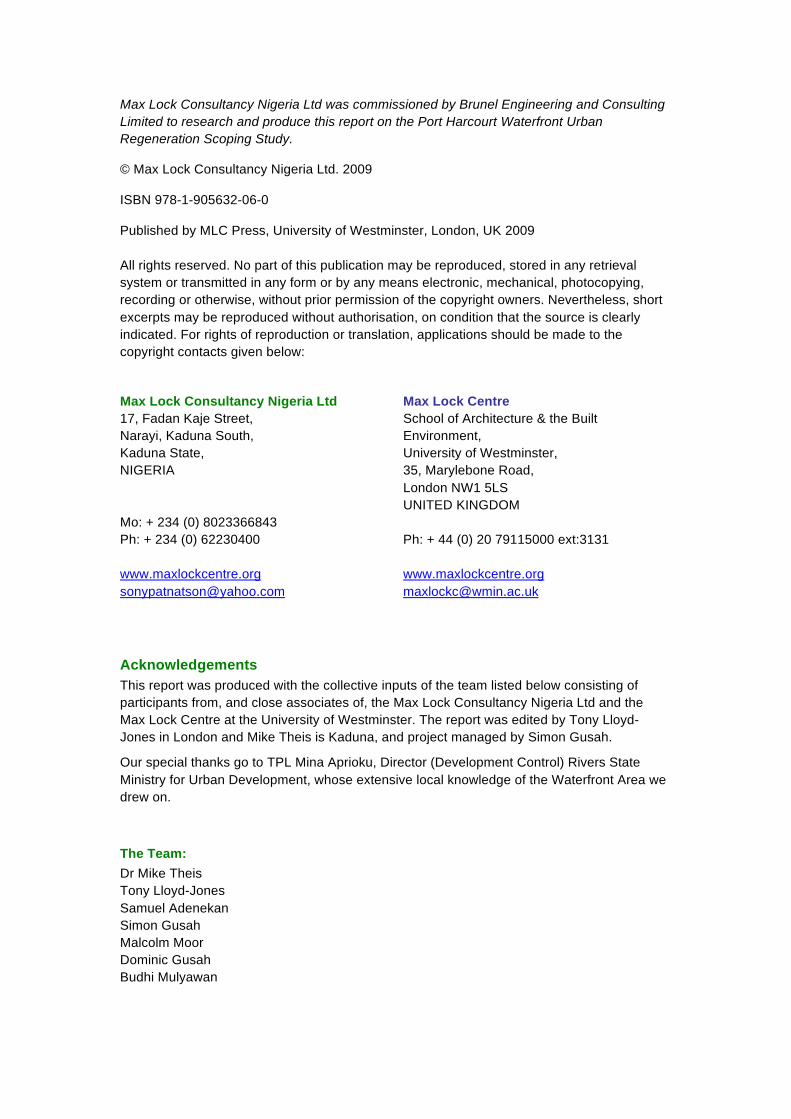
Low density waterfront community
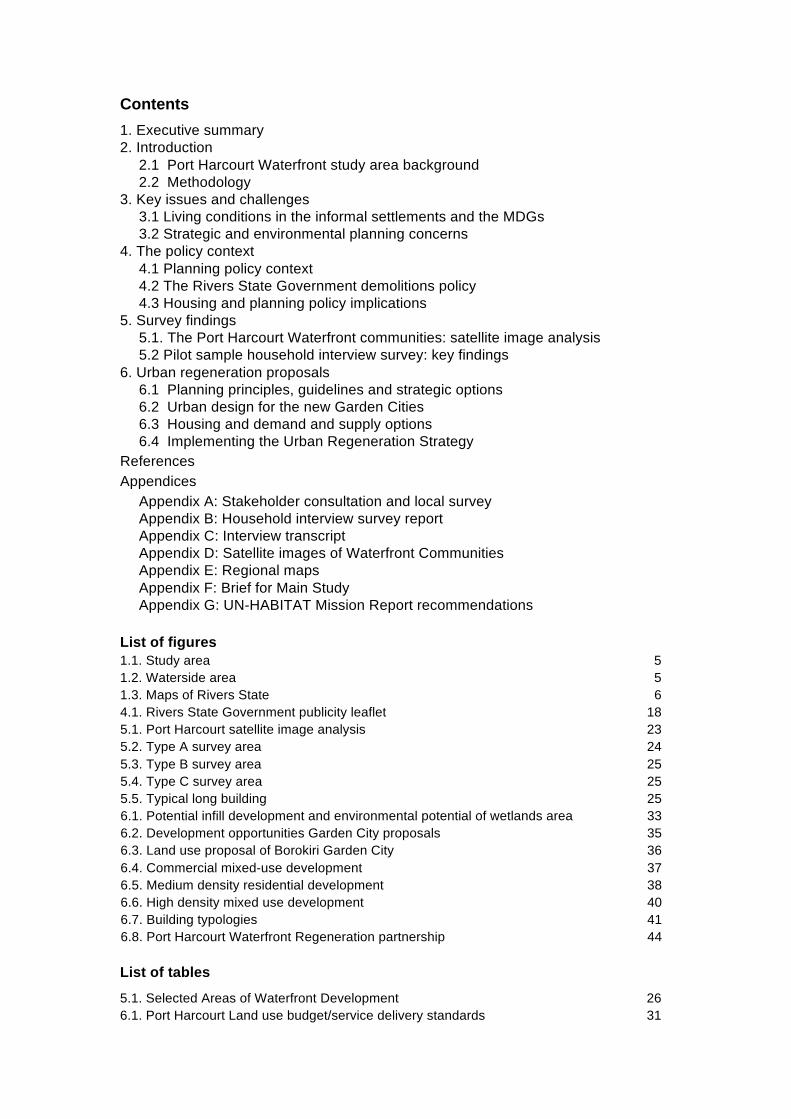
Well kept footpath and drainage in the waterside
1. Executive summary Purpose of study: The study outlines a long term, sustainable, urban plan-based solution to the current conflict of interest involving the Rivers State Government and residents of the Port Harcourt Waterfront communities whose neighbourhoods are under threat of demolition. It is intended to be the preliminary, scoping phase of a more extensive, in-depth main study to be undertaken in 2010, aimed at meeting needs both of the government and the existing population.
Waterfront as a development opportunity: In the regeneration of the Waterfront area, It is important to look at land development opportunities and redevelopment issues within the context of a careful consideration of both demand and supply side constraints, the broader human and physical development priorities of the city, and the current planning policy context. We argue in this report that neither wholesale demolition nor wholesale retention of the informal Waterfront settlements is viable when looked at in the context of the longer term planning issues facing the city.
A long-term planning approach: Whilst we respect and accept the even-handedness of the UN Habitat Report which reports on the demolition policy in Port Harcourt, it is not our aim, in this report to comment on the legal aspects of this policy. A long-term planning approach to the sustainable regeneration of the Waterfront can contribute to helping defuse the current polarised situation as well as increase the land value of the waterfront, rehabilitate its degrading environment and allow all the residents of central Port Harcourt to integrate into the future prosperity and security of the regeneration of the Old City and its Waterfront.
Key findings:Tackled correctly, the Waterfront Area offers a tremendous potential to restore the fast fading image of the Port Harcourt Garden City concept. A strategic urban regeneration plan, carried out across the Waterfront in a systematic and sequential manner, will not only enable Rivers State Government to realise the broader objectives of the 2009 Greater Port Harcourt Master Plan. It is essential to the effective implementation of that plan. A revitalised Waterfront is also essential to the broader regeneration of the Old City and to the image that Port Harcourt presents to the world as a modern 21st century city.
Subject to a proper financial and technical appraisal, a policy of large scale reclamation of new Waterfront areas on ‘infill’ locations close to the city centre can offer multiple advantages.
Port Harcourt Waterfront Urban Regeneration Strategy
2
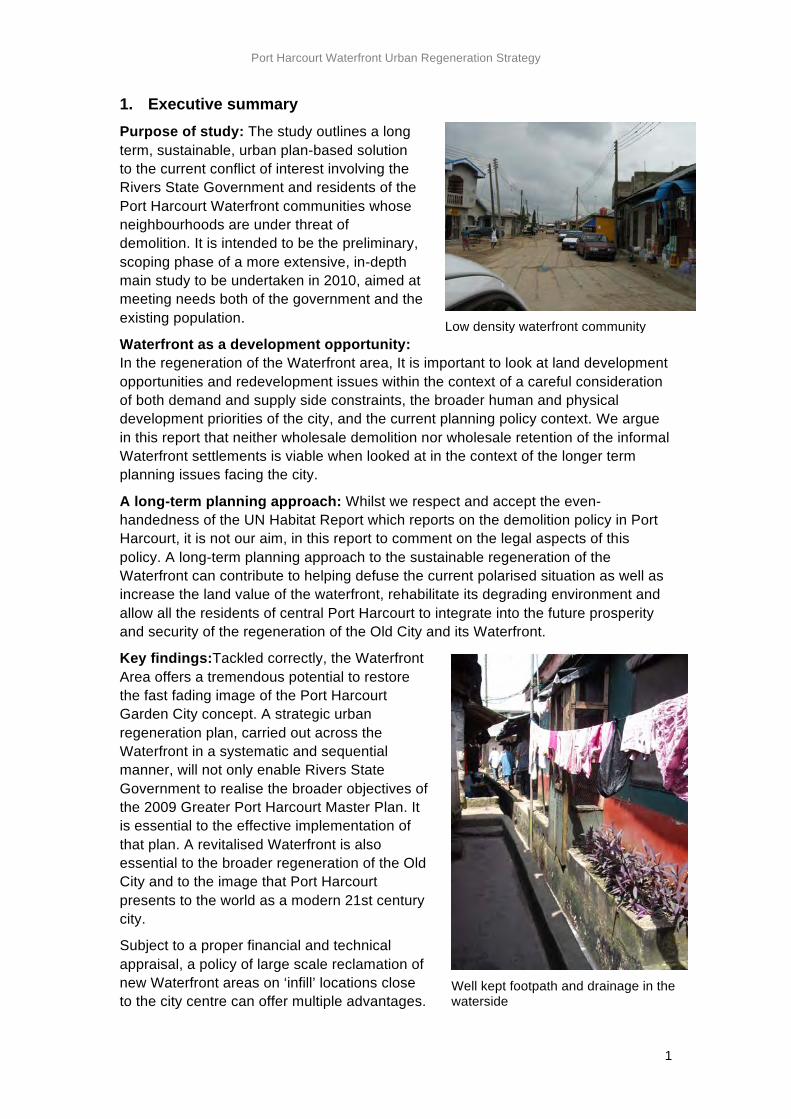
Medium density waterfront community
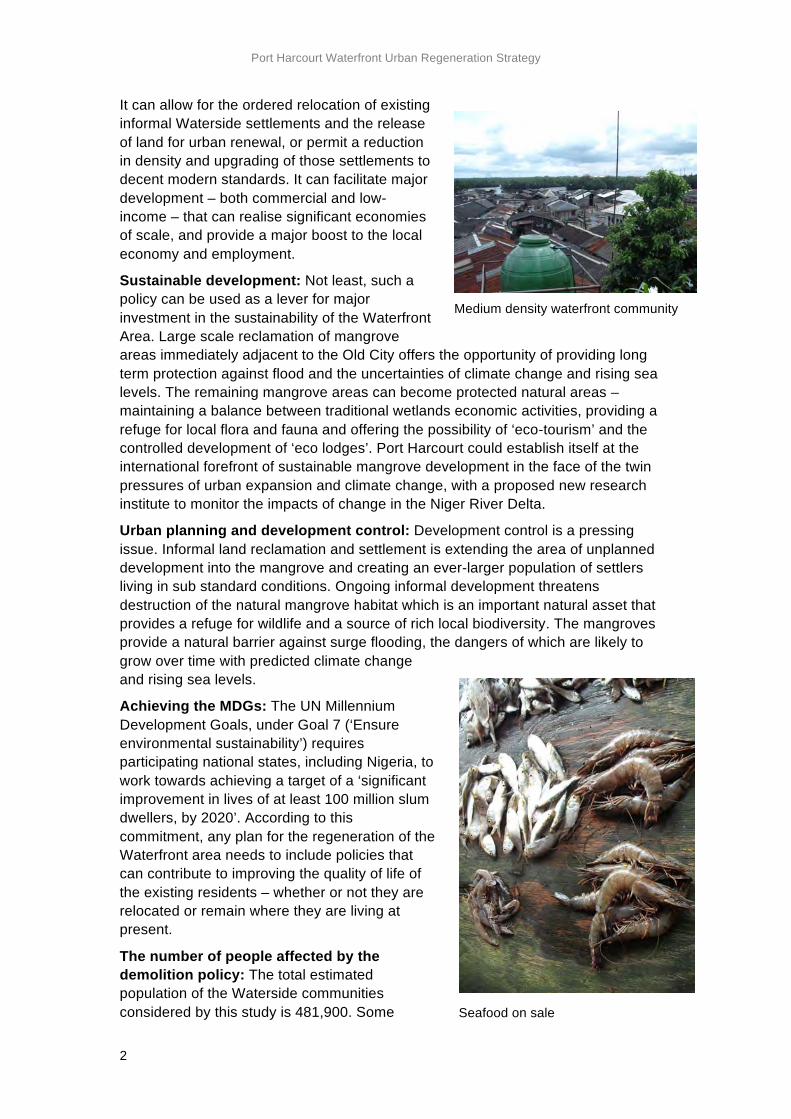
Seafood on sale
It can allow for the ordered relocation of existing informal Waterside settlements and the release of land for urban renewal, or permit a reduction in density and upgrading of those settlements to decent modern standards. It can facilitate major development – both commercial and low-income – that can realise significant economies of scale, and provide a major boost to the local economy and employment.
Sustainable development: Not least, such a policy can be used as a lever for major investment in the sustainability of the Waterfront Area. Large scale reclamation of mangrove areas immediately adjacent to the Old City offers the opportunity of providing long term protection against flood and the uncertainties of climate change and rising sea levels. The remaining mangrove areas can become protected natural areas – maintaining a balance between traditional wetlands economic activities, providing a refuge for local flora and fauna and offering the possibility of ‘eco-tourism’ and the controlled development of ‘eco lodges’. Port Harcourt could establish itself at the international forefront of sustainable mangrove development in the face of the twin pressures of urban expansion and climate change, with a proposed new research institute to monitor the impacts of change in the Niger River Delta.
Urban planning and development control: Development control is a pressing issue. Informal land reclamation and settlement is extending the area of unplanned development into the mangrove and creating an ever-larger population of settlers living in sub standard conditions. Ongoing informal development threatens destruction of the natural mangrove habitat which is an important natural asset that provides a refuge for wildlife and a source of rich local biodiversity. The mangroves provide a natural barrier against surge flooding, the dangers of which are likely to grow over time with predicted climate change and rising sea levels.
Achieving the MDGs: The UN Millennium Development Goals, under Goal 7 (‘Ensure environmental sustainability’) requires participating national states, including Nigeria, to work towards achieving a target of a ‘significant improvement in lives of at least 100 million slum dwellers, by 2020’. According to this commitment, any plan for the regeneration of the Waterfront area needs to include policies that can contribute to improving the quality of life of the existing residents – whether or not they are relocated or remain where they are living at present.
The number of people affected by the demolition policy: The total estimated population of the Waterside communities considered by this study is 481,900. Some
Port Harcourt Waterfront Urban Regeneration Strategy
3
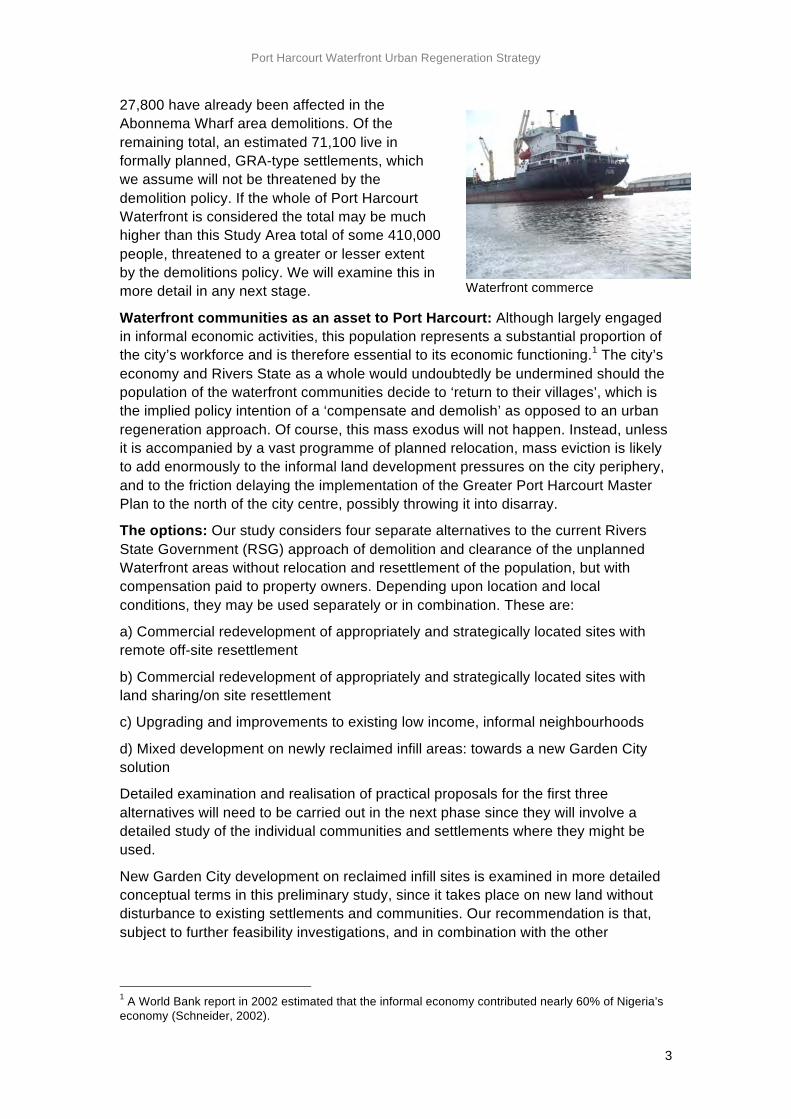
Waterfront commerce
27,800 have already been affected in the Abonnema Wharf area demolitions. Of the remaining total, an estimated 71,100 live in formally planned, GRA-type settlements, which we assume will not be threatened by the demolition policy. If the whole of Port Harcourt Waterfront is considered the total may be much higher than this Study Area total of some 410,000 people, threatened to a greater or lesser extent by the demolitions policy. We will examine this in more detail in any next stage.
Waterfront communities as an asset to Port Harcourt: Although largely engaged in informal economic activities, this population represents a substantial proportion of the city’s workforce and is therefore essential to its economic functioning.1 The city’s economy and Rivers State as a whole would undoubtedly be undermined should the population of the waterfront communities decide to ‘return to their villages’, which is the implied policy intention of a ‘compensate and demolish’ as opposed to an urban regeneration approach. Of course, this mass exodus will not happen. Instead, unless it is accompanied by a vast programme of planned relocation, mass eviction is likely to add enormously to the informal land development pressures on the city periphery, and to the friction delaying the implementation of the Greater Port Harcourt Master Plan to the north of the city centre, possibly throwing it into disarray.
The options: Our study considers four separate alternatives to the current Rivers State Government (RSG) approach of demolition and clearance of the unplanned Waterfront areas without relocation and resettlement of the population, but with compensation paid to property owners. Depending upon location and local conditions, they may be used separately or in combination. These are:
a) Commercial redevelopment of appropriately and strategically located sites with remote off-site resettlement
b) Commercial redevelopment of appropriately and strategically located sites with land sharing/on site resettlement
c) Upgrading and improvements to existing low income, informal neighbourhoods
d) Mixed development on newly reclaimed infill areas: towards a new Garden City solution
Detailed examination and realisation of practical proposals for the first three alternatives will need to be carried out in the next phase since they will involve a detailed study of the individual communities and settlements where they might be used.
New Garden City development on reclaimed infill sites is examined in more detailed conceptual terms in this preliminary study, since it takes place on new land without disturbance to existing settlements and communities. Our recommendation is that, subject to further feasibility investigations, and in combination with the other
1 A World Bank report in 2002 estimated that the informal economy contributed nearly 60% of Nigeria’s economy (Schneider, 2002).
Port Harcourt Waterfront Urban Regeneration Strategy
4
alternatives outlined above where appropriate, it should form the main element of any future plan for regeneration of the Port Harcourt Waterfront.
The Garden City development would be sustainably planned around four complementary land use typologies:
a) Commercial, mixed use development
b) Educational and community uses
c) Medium density residential development
d) High density, mixed use development
Each Garden City settlement would incorporate landscaping and water features that would enhance the new development and provide buffer strips between the different zones as appropriate. Substantial flood and erosion control measures to address the long term climate change issues would form part of the new development.
In the study we identify about 360 hectares of infill land that could be reclaimed as a matter of priority. In the medium and high density development zones around 100,000 could be resettled in these new locations, if existing Waterfront owners and tenants were given some degree of priority in the allocations procedure.
A phased Waterfront urban regeneration plan would consist of a rolling programme of large scale Garden City infill developments and Waterfront urban renewal projects. In the second phase of this study we will carry out a more extensive survey to get a more accurate profile of the existing housing markets and the different niches within it. This will enable us to better match proposed supply to current and projected demand. It will provide the basis for a co-ordinated sequence of action plans for the Waterfront area.
It is important that the development of the Waterfront areas is addressed through appropriate forms of public-private partnership, as noted in the UN-HABITAT Mission Report. New development on a large scale on substantial infill sites within a protected and attractive Garden City setting is likely to attract the interest of major developers and investors. Substantial investment in basic infrastructure, including flood defences and land reclamation would be required and this could be funded, in whole or part, through commercial development. International development finance would be sought to support investment in flood-protection infrastructure. A Port Harcourt Urban Regeneration Partnership will be established to manage the implementation of the Urban Regeneration Strategy.
In considering re-settlement from the point of view of sustainability, our aim has been to replicate the existing low cost rental market in the new development through the ‘Tenant-Financed Housing Model’ rather than by providing the typical single-family ‘low-cost’ flat. At the same time, re-settlement should be achieved as part of a well-planned and co-ordinated programme of large scale urban development and renewal, which would offer massive economies of scale and employment opportunities.
Port Harcourt Waterfront Urban Regeneration Strategy
5
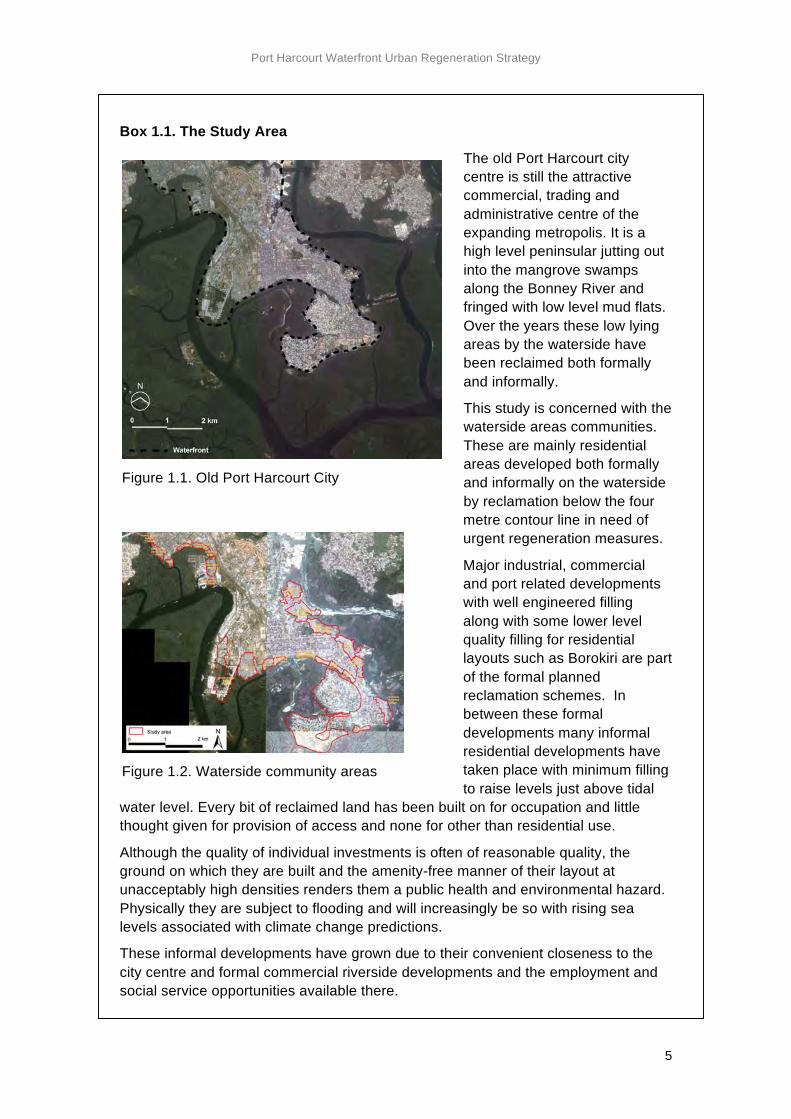
Box 1.1. The Study Area
The old Port Harcourt city centre is still the attractive commercial, trading and administrative centre of the expanding metropolis. It is a high level peninsular jutting out into the mangrove swamps along the Bonney River and fringed with low level mud flats. Over the years these low lying areas by the waterside have been reclaimed both formally and informally.
This study is concerned with the waterside areas communities. These are mainly residential areas developed both formally and informally on the waterside by reclamation below the four metre contour line in need of urgent regeneration measures.
Major industrial, commercial and port related developments with well engineered filling along with some lower level quality filling for residential layouts such as Borokiri are part of the formal planned reclamation schemes. In between these formal developments many informal residential developments have taken place with minimum filling to raise levels just above tidal
water level. Every bit of reclaimed land has been built on for occupation and little thought given for provision of access and none for other than residential use.
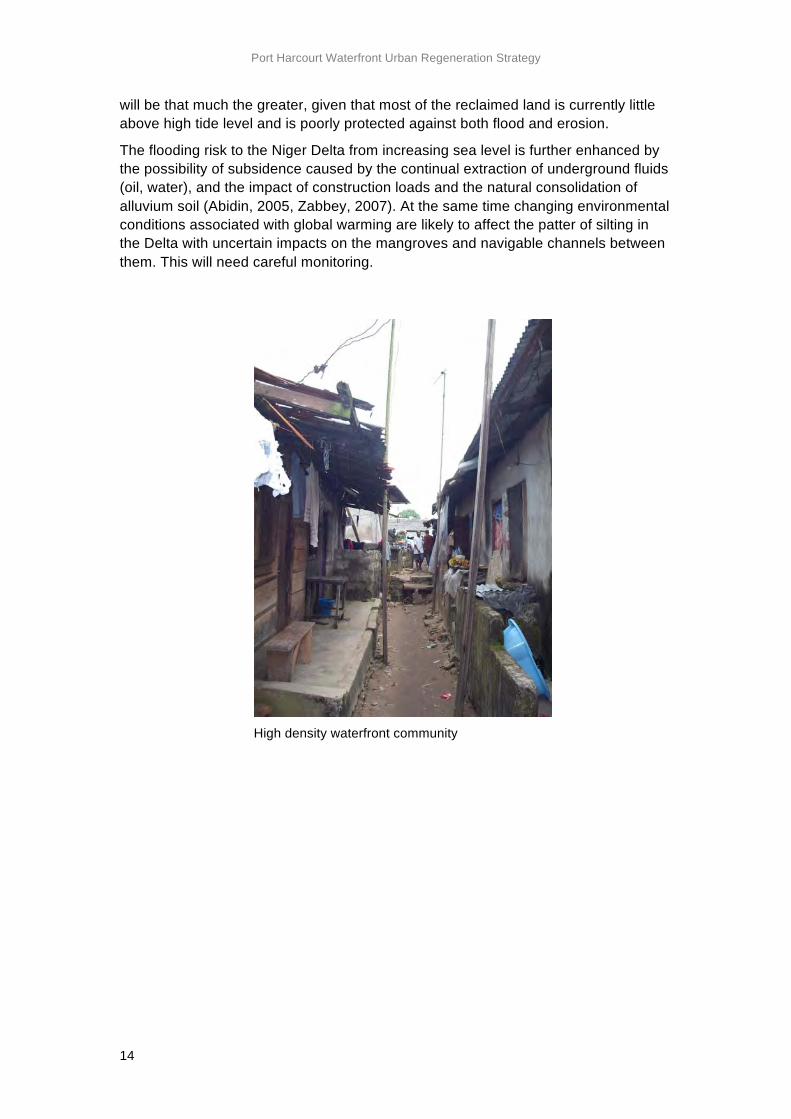
Although the quality of individual investments is often of reasonable quality, the ground on which they are built and the amenity-free manner of their layout at unacceptably high densities renders them a public health and environmental hazard. Physically they are subject to flooding and will increasingly be so with rising sea levels associated with climate change predictions.
These informal developments have grown due to their convenient closeness to the city centre and formal commercial riverside developments and the employment and social service opportunities available there.
Figure 1.1. Old Port Harcourt City
Figure 1.2. Waterside community areas
Port Harcourt Waterfront Urban Regeneration Strategy
6
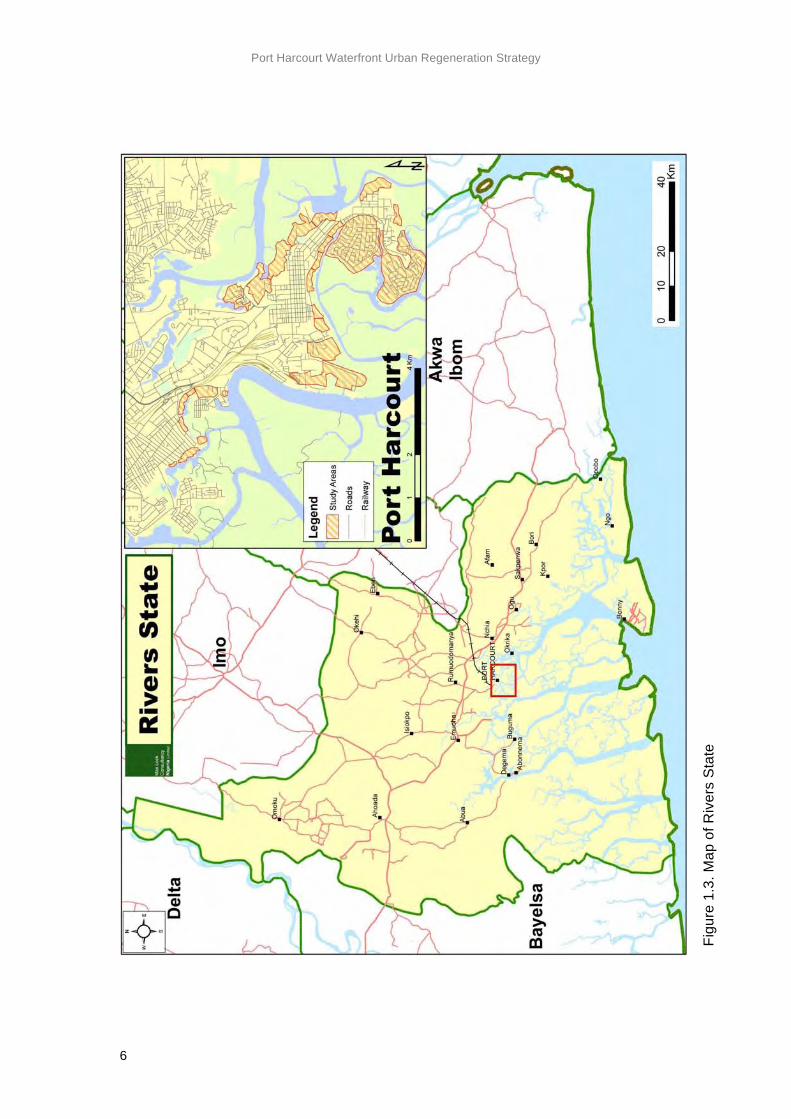
Figu
re 1
.3. M
ap o
f Riv
ers
Sta
te
Port Harcourt Waterfront Urban Regeneration Strategy
7
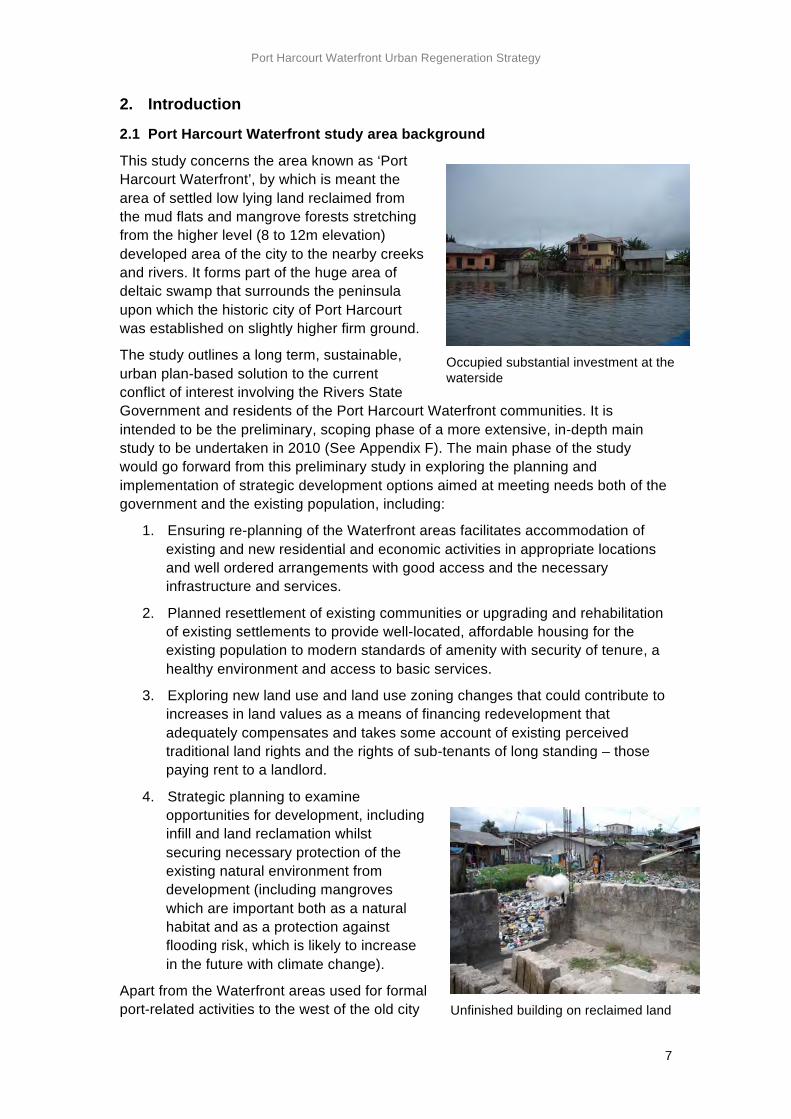
Occupied substantial investment at the waterside
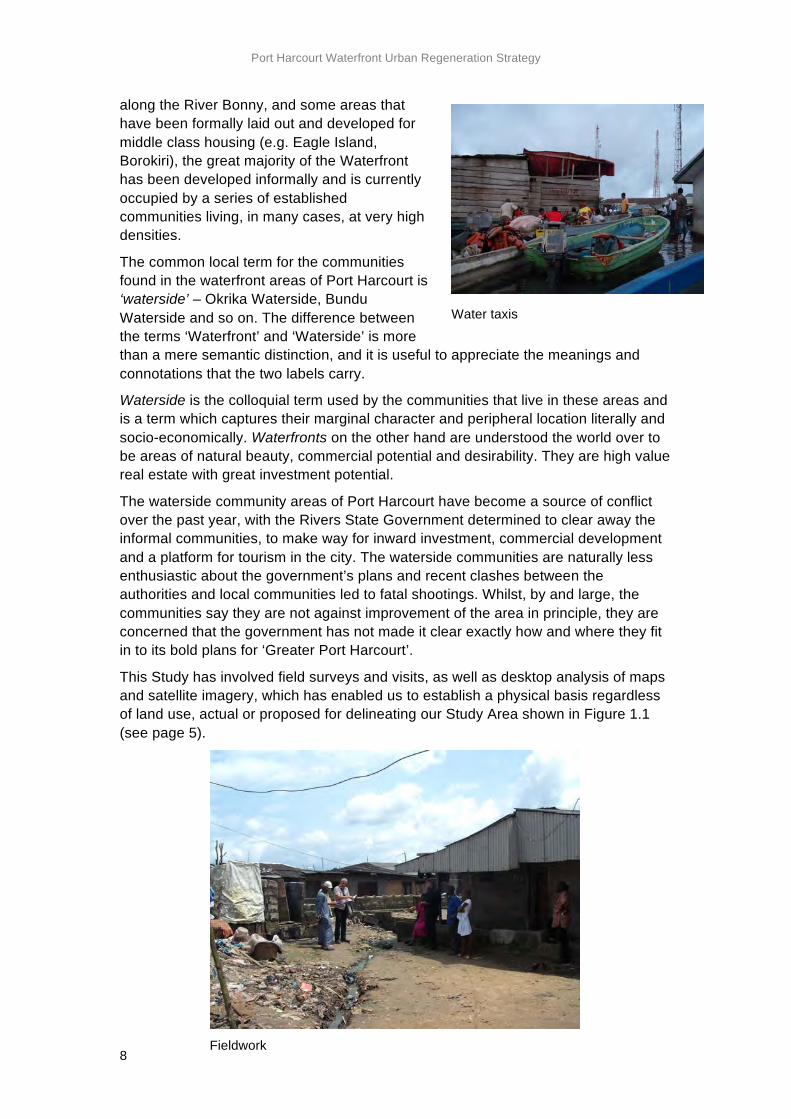
Unfinished building on reclaimed land
2. Introduction
2.1 Port Harcourt Waterfront study area background
This study concerns the area known as ‘Port Harcourt Waterfront’, by which is meant the area of settled low lying land reclaimed from the mud flats and mangrove forests stretching from the higher level (8 to 12m elevation) developed area of the city to the nearby creeks and rivers. It forms part of the huge area of deltaic swamp that surrounds the peninsula upon which the historic city of Port Harcourt was established on slightly higher firm ground.
The study outlines a long term, sustainable, urban plan-based solution to the current conflict of interest involving the Rivers State Government and residents of the Port Harcourt Waterfront communities. It is intended to be the preliminary, scoping phase of a more extensive, in-depth main study to be undertaken in 2010 (See Appendix F). The main phase of the study would go forward from this preliminary study in exploring the planning and implementation of strategic development options aimed at meeting needs both of the government and the existing population, including:
1. Ensuring re-planning of the Waterfront areas facilitates accommodation of existing and new residential and economic activities in appropriate locations and well ordered arrangements with good access and the necessary infrastructure and services.
2. Planned resettlement of existing communities or upgrading and rehabilitation of existing settlements to provide well-located, affordable housing for the existing population to modern standards of amenity with security of tenure, a healthy environment and access to basic services.
3. Exploring new land use and land use zoning changes that could contribute to increases in land values as a means of financing redevelopment that adequately compensates and takes some account of existing perceived traditional land rights and the rights of sub-tenants of long standing – those paying rent to a landlord.
4. Strategic planning to examine opportunities for development, including infill and land reclamation whilst securing necessary protection of the existing natural environment from development (including mangroves which are important both as a natural habitat and as a protection against flooding risk, which is likely to increase in the future with climate change).
Apart from the Waterfront areas used for formal port-related activities to the west of the old city
Port Harcourt Waterfront Urban Regeneration Strategy
8
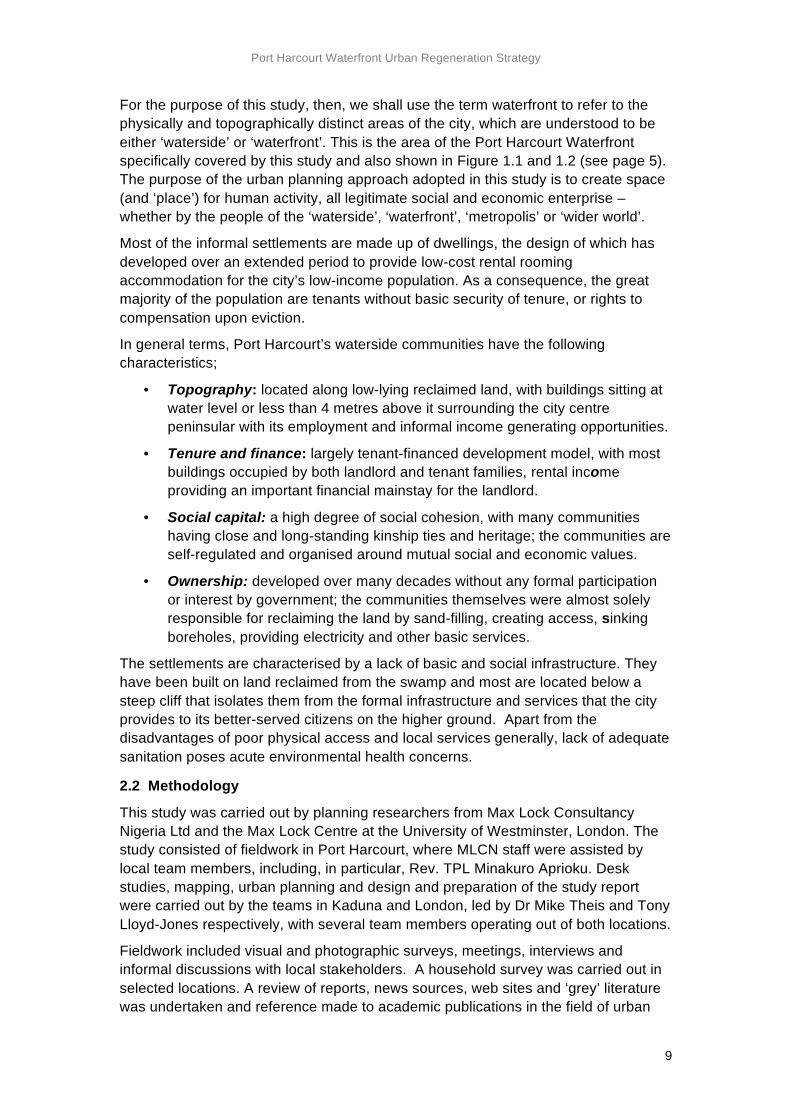
Water taxis
along the River Bonny, and some areas that have been formally laid out and developed for middle class housing (e.g. Eagle Island, Borokiri), the great majority of the Waterfront has been developed informally and is currently occupied by a series of established communities living, in many cases, at very high densities.
The common local term for the communities found in the waterfront areas of Port Harcourt is ‘waterside’ – Okrika Waterside, Bundu Waterside and so on. The difference between the terms ‘Waterfront’ and ‘Waterside’ is more than a mere semantic distinction, and it is useful to appreciate the meanings and connotations that the two labels carry.
Waterside is the colloquial term used by the communities that live in these areas and is a term which captures their marginal character and peripheral location literally and socio-economically. Waterfronts on the other hand are understood the world over to be areas of natural beauty, commercial potential and desirability. They are high value real estate with great investment potential.
The waterside community areas of Port Harcourt have become a source of conflict over the past year, with the Rivers State Government determined to clear away the informal communities, to make way for inward investment, commercial development and a platform for tourism in the city. The waterside communities are naturally less enthusiastic about the government’s plans and recent clashes between the authorities and local communities led to fatal shootings. Whilst, by and large, the communities say they are not against improvement of the area in principle, they are concerned that the government has not made it clear exactly how and where they fit in to its bold plans for ‘Greater Port Harcourt’.
This Study has involved field surveys and visits, as well as desktop analysis of maps and satellite imagery, which has enabled us to establish a physical basis regardless of land use, actual or proposed for delineating our Study Area shown in Figure 1.1 (see page 5).
Fieldwork
Port Harcourt Waterfront Urban Regeneration Strategy
9
For the purpose of this study, then, we shall use the term waterfront to refer to the physically and topographically distinct areas of the city, which are understood to be either ‘waterside’ or ‘waterfront’. This is the area of the Port Harcourt Waterfront specifically covered by this study and also shown in Figure 1.1 and 1.2 (see page 5). The purpose of the urban planning approach adopted in this study is to create space (and ‘place’) for human activity, all legitimate social and economic enterprise – whether by the people of the ‘waterside’, ‘waterfront’, ‘metropolis’ or ‘wider world’.
Most of the informal settlements are made up of dwellings, the design of which has developed over an extended period to provide low-cost rental rooming accommodation for the city’s low-income population. As a consequence, the great majority of the population are tenants without basic security of tenure, or rights to compensation upon eviction.
In general terms, Port Harcourt’s waterside communities have the following characteristics;
• Topography: located along low-lying reclaimed land, with buildings sitting at water level or less than 4 metres above it surrounding the city centre peninsular with its employment and informal income generating opportunities.
• Tenure and finance: largely tenant-financed development model, with most buildings occupied by both landlord and tenant families, rental income providing an important financial mainstay for the landlord.
• Social capital: a high degree of social cohesion, with many communities having close and long-standing kinship ties and heritage; the communities are self-regulated and organised around mutual social and economic values.
• Ownership: developed over many decades without any formal participation or interest by government; the communities themselves were almost solely responsible for reclaiming the land by sand-filling, creating access, sinking boreholes, providing electricity and other basic services.
The settlements are characterised by a lack of basic and social infrastructure. They have been built on land reclaimed from the swamp and most are located below a steep cliff that isolates them from the formal infrastructure and services that the city provides to its better-served citizens on the higher ground. Apart from the disadvantages of poor physical access and local services generally, lack of adequate sanitation poses acute environmental health concerns.
2.2 Methodology
This study was carried out by planning researchers from Max Lock Consultancy Nigeria Ltd and the Max Lock Centre at the University of Westminster, London. The study consisted of fieldwork in Port Harcourt, where MLCN staff were assisted by local team members, including, in particular, Rev. TPL Minakuro Aprioku. Desk studies, mapping, urban planning and design and preparation of the study report were carried out by the teams in Kaduna and London, led by Dr Mike Theis and Tony Lloyd-Jones respectively, with several team members operating out of both locations.
Fieldwork included visual and photographic surveys, meetings, interviews and informal discussions with local stakeholders. A household survey was carried out in selected locations. A review of reports, news sources, web sites and ‘grey’ literature was undertaken and reference made to academic publications in the field of urban

Port Harcourt Waterfront Urban Regeneration Strategy
10
planning and sustainable development in developing countries. Mapping studies were carried out using high resolution satellite images, Google Earth and GIS software. Preliminary urban planning and design studies were carried out by hand and using computer based graphics.
The fieldwork was led by TPL Samuel Adenekan, with Simon Gusah as Project Manager. GIS and graphic design was carried out by Dominic Gusah and Budhi Mulyawan. Urban planning and design concepts were originated by Tony Lloyd-Jones, Michael Mutter and Malcolm Moor. The innovative urban development and management approach advocated in this report was the outcome of an intensive dialogue between team members in Nigeria and the UK.
Port Harcourt Waterfront Urban Regeneration Strategy
11
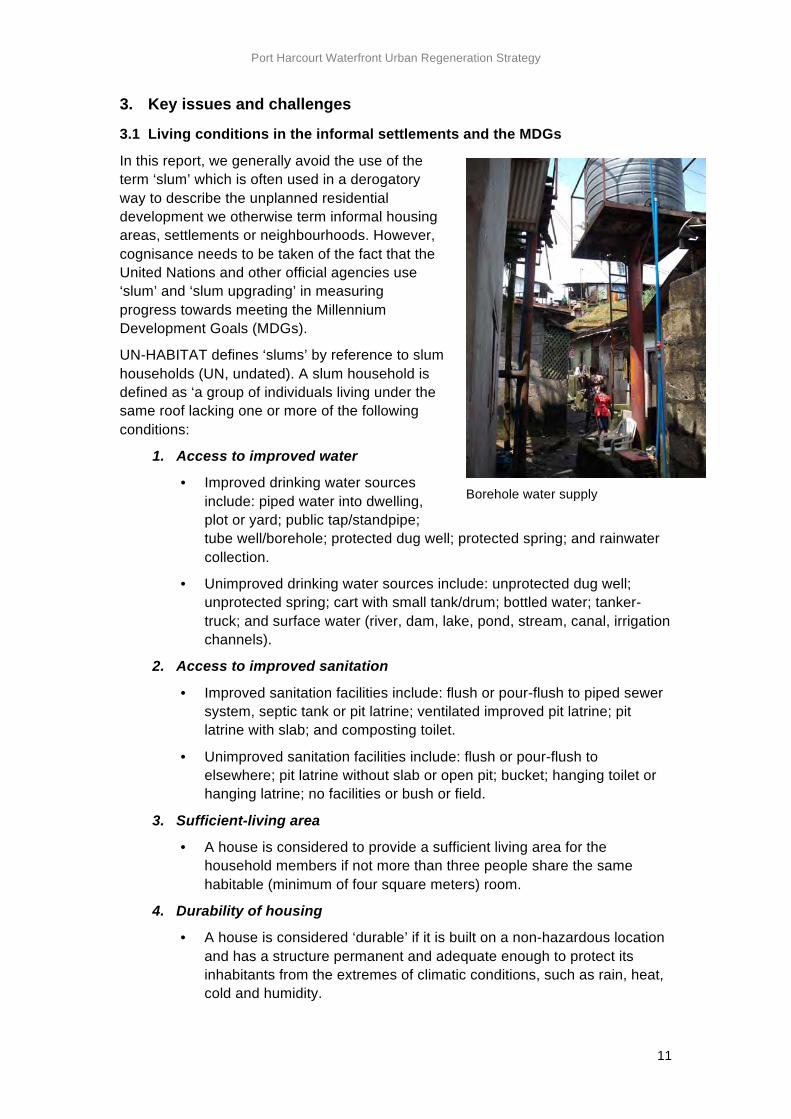
Borehole water supply
3. Key issues and challenges
3.1 Living conditions in the informal settlements and the MDGs
In this report, we generally avoid the use of the term ‘slum’ which is often used in a derogatory way to describe the unplanned residential development we otherwise term informal housing areas, settlements or neighbourhoods. However, cognisance needs to be taken of the fact that the United Nations and other official agencies use ‘slum’ and ‘slum upgrading’ in measuring progress towards meeting the Millennium Development Goals (MDGs).
UN-HABITAT defines ‘slums’ by reference to slum households (UN, undated). A slum household is defined as ‘a group of individuals living under the same roof lacking one or more of the following conditions:
1. Access to improved water
• Improved drinking water sources include: piped water into dwelling, plot or yard; public tap/standpipe; tube well/borehole; protected dug well; protected spring; and rainwater collection.
• Unimproved drinking water sources include: unprotected dug well; unprotected spring; cart with small tank/drum; bottled water; tanker-truck; and surface water (river, dam, lake, pond, stream, canal, irrigation channels).
2. Access to improved sanitation
• Improved sanitation facilities include: flush or pour-flush to piped sewer system, septic tank or pit latrine; ventilated improved pit latrine; pit latrine with slab; and composting toilet.
• Unimproved sanitation facilities include: flush or pour-flush to elsewhere; pit latrine without slab or open pit; bucket; hanging toilet or hanging latrine; no facilities or bush or field.
3. Sufficient-living area
• A house is considered to provide a sufficient living area for the household members if not more than three people share the same habitable (minimum of four square meters) room.
4. Durability of housing
• A house is considered ‘durable’ if it is built on a non-hazardous location and has a structure permanent and adequate enough to protect its inhabitants from the extremes of climatic conditions, such as rain, heat, cold and humidity.
Port Harcourt Waterfront Urban Regeneration Strategy
12
5. Security of tenure
• Since information on secure tenure is not available for most of the countries, only the first four indicators are used to define slum household (and then to estimate the proportion of urban population living in slums).
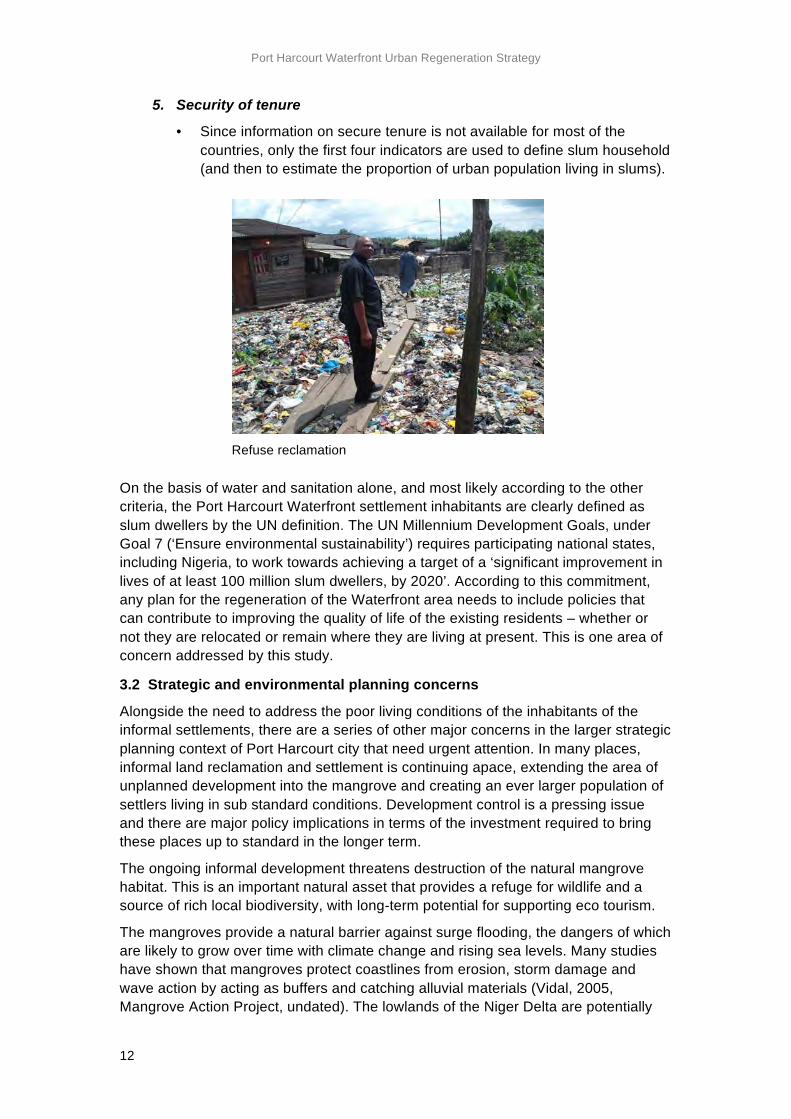
On the basis of water and sanitation alone, and most likely according to the other criteria, the Port Harcourt Waterfront settlement inhabitants are clearly defined as slum dwellers by the UN definition. The UN Millennium Development Goals, under Goal 7 (‘Ensure environmental sustainability’) requires participating national states, including Nigeria, to work towards achieving a target of a ‘significant improvement in lives of at least 100 million slum dwellers, by 2020’. According to this commitment, any plan for the regeneration of the Waterfront area needs to include policies that can contribute to improving the quality of life of the existing residents – whether or not they are relocated or remain where they are living at present. This is one area of concern addressed by this study.
3.2 Strategic and environmental planning concerns
Alongside the need to address the poor living conditions of the inhabitants of the informal settlements, there are a series of other major concerns in the larger strategic planning context of Port Harcourt city that need urgent attention. In many places, informal land reclamation and settlement is continuing apace, extending the area of unplanned development into the mangrove and creating an ever larger population of settlers living in sub standard conditions. Development control is a pressing issue and there are major policy implications in terms of the investment required to bring these places up to standard in the longer term.
The ongoing informal development threatens destruction of the natural mangrove habitat. This is an important natural asset that provides a refuge for wildlife and a source of rich local biodiversity, with long-term potential for supporting eco tourism.
The mangroves provide a natural barrier against surge flooding, the dangers of which are likely to grow over time with climate change and rising sea levels. Many studies have shown that mangroves protect coastlines from erosion, storm damage and wave action by acting as buffers and catching alluvial materials (Vidal, 2005, Mangrove Action Project, undated). The lowlands of the Niger Delta are potentially
Refuse reclamation
Port Harcourt Waterfront Urban Regeneration Strategy
13
highly vulnerable to any rise in sea level. A major recent review of climate change in Antarctica by the Scientific Committee on Antarctic Research says that sea levels globally are likely to rise by about 1.4m (4ft 6in) by 2100 as polar ice melts (SCAR, 2009).
The Niger Delta is dissected by many estuaries, rivers, creeks and streams, multiple sources of potential riverine flooding risk to the surrounding low-level flatlands (particularly where rivers and creeks have been encroached upon, thus disturbing their natural flow) during the periods of intense ‘monsoon’ type rainfall in the region. This rainfall is likely to become increasingly unpredictable with climate change.
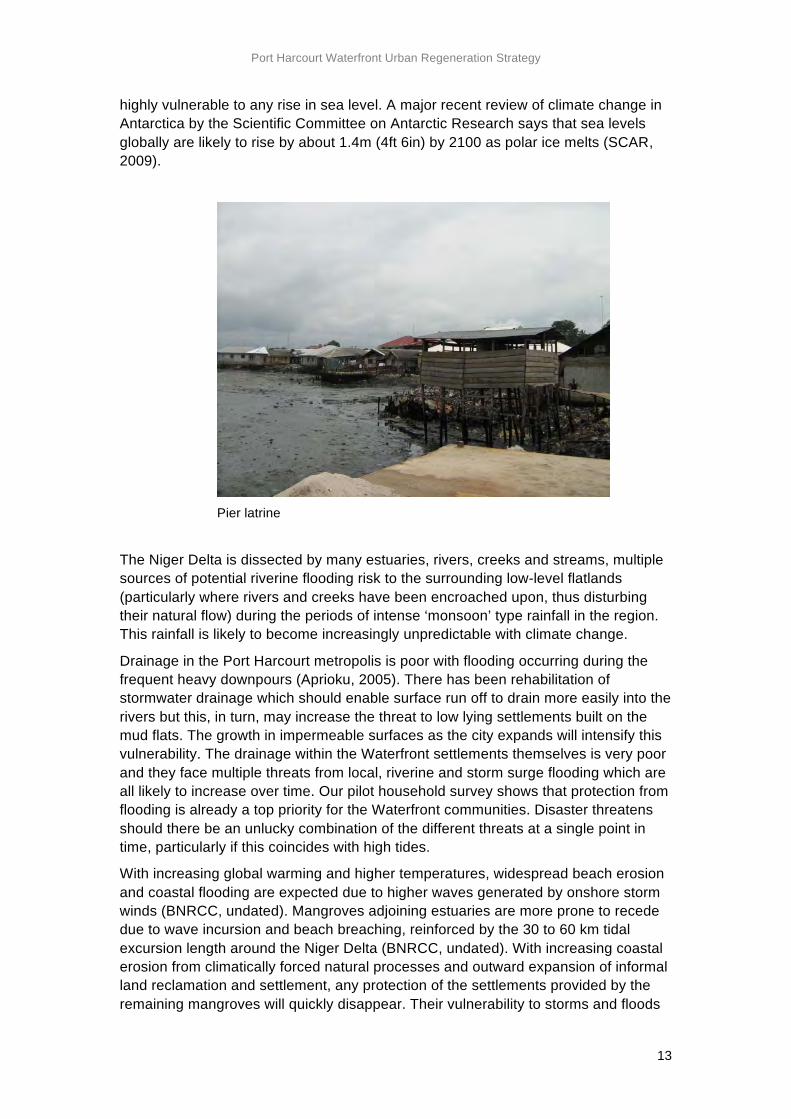
Drainage in the Port Harcourt metropolis is poor with flooding occurring during the frequent heavy downpours (Aprioku, 2005). There has been rehabilitation of stormwater drainage which should enable surface run off to drain more easily into the rivers but this, in turn, may increase the threat to low lying settlements built on the mud flats. The growth in impermeable surfaces as the city expands will intensify this vulnerability. The drainage within the Waterfront settlements themselves is very poor and they face multiple threats from local, riverine and storm surge flooding which are all likely to increase over time. Our pilot household survey shows that protection from flooding is already a top priority for the Waterfront communities. Disaster threatens should there be an unlucky combination of the different threats at a single point in time, particularly if this coincides with high tides.
With increasing global warming and higher temperatures, widespread beach erosion and coastal flooding are expected due to higher waves generated by onshore storm winds (BNRCC, undated). Mangroves adjoining estuaries are more prone to recede due to wave incursion and beach breaching, reinforced by the 30 to 60 km tidal excursion length around the Niger Delta (BNRCC, undated). With increasing coastal erosion from climatically forced natural processes and outward expansion of informal land reclamation and settlement, any protection of the settlements provided by the remaining mangroves will quickly disappear. Their vulnerability to storms and floods
Pier latrine
Port Harcourt Waterfront Urban Regeneration Strategy
14
will be that much the greater, given that most of the reclaimed land is currently little above high tide level and is poorly protected against both flood and erosion.
The flooding risk to the Niger Delta from increasing sea level is further enhanced by the possibility of subsidence caused by the continual extraction of underground fluids (oil, water), and the impact of construction loads and the natural consolidation of alluvium soil (Abidin, 2005, Zabbey, 2007). At the same time changing environmental conditions associated with global warming are likely to affect the patter of silting in the Delta with uncertain impacts on the mangroves and navigable channels between them. This will need careful monitoring.
High density waterfront community
Port Harcourt Waterfront Urban Regeneration Strategy
15
4. The policy context
4.1 Planning policy context
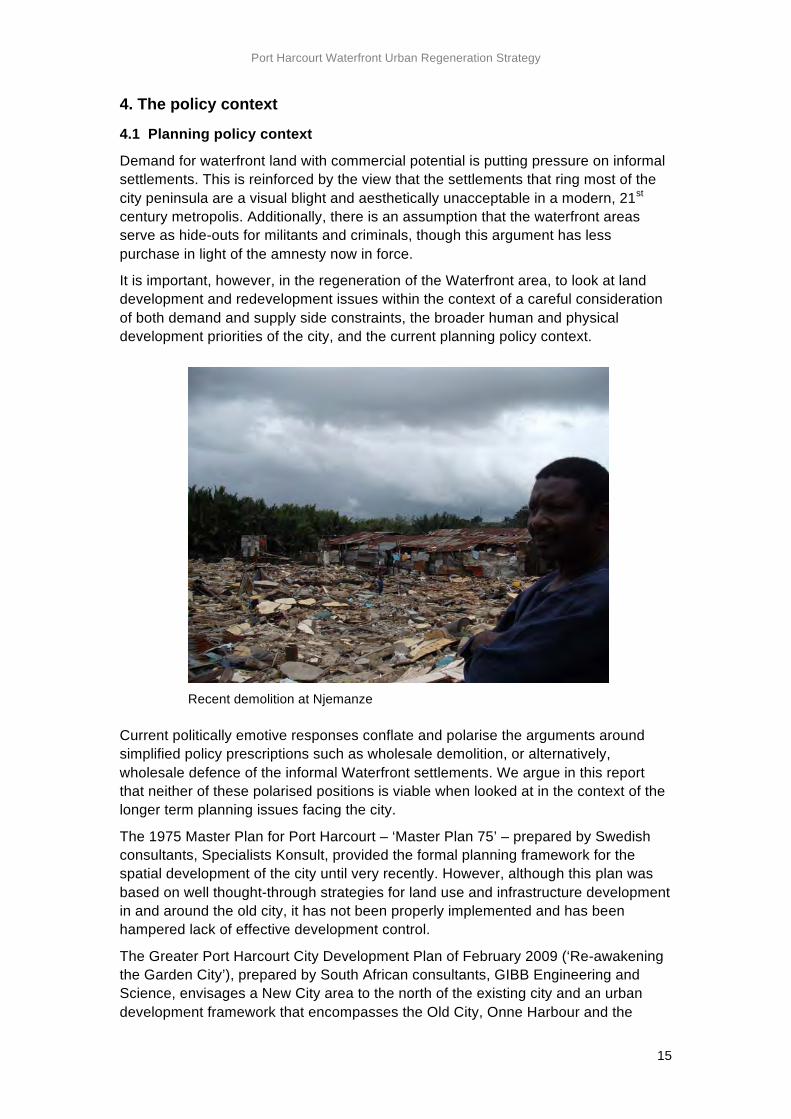
Demand for waterfront land with commercial potential is putting pressure on informal settlements. This is reinforced by the view that the settlements that ring most of the city peninsula are a visual blight and aesthetically unacceptable in a modern, 21st century metropolis. Additionally, there is an assumption that the waterfront areas serve as hide-outs for militants and criminals, though this argument has less purchase in light of the amnesty now in force.
It is important, however, in the regeneration of the Waterfront area, to look at land development and redevelopment issues within the context of a careful consideration of both demand and supply side constraints, the broader human and physical development priorities of the city, and the current planning policy context.
Current politically emotive responses conflate and polarise the arguments around simplified policy prescriptions such as wholesale demolition, or alternatively, wholesale defence of the informal Waterfront settlements. We argue in this report that neither of these polarised positions is viable when looked at in the context of the longer term planning issues facing the city.
The 1975 Master Plan for Port Harcourt – ‘Master Plan 75’ – prepared by Swedish consultants, Specialists Konsult, provided the formal planning framework for the spatial development of the city until very recently. However, although this plan was based on well thought-through strategies for land use and infrastructure development in and around the old city, it has not been properly implemented and has been hampered lack of effective development control.
The Greater Port Harcourt City Development Plan of February 2009 (‘Re-awakening the Garden City’), prepared by South African consultants, GIBB Engineering and Science, envisages a New City area to the north of the existing city and an urban development framework that encompasses the Old City, Onne Harbour and the
Recent demolition at Njemanze
Port Harcourt Waterfront Urban Regeneration Strategy
16
International Airport. The standards referred into in this report include those outlined in Part A of the City Development Plan: Design Plan/Town Planning Manual.
Among the basic objectives of the Plan are the following:
• Introducing open spaces into the Old City as a symbol of renewal.
• Reducing the density of housing development especially where infill development has taken place and removing 13 of the city’s squatter settlements (housing about 275,000 people). The plan proposes re-settlement of the residents of squatter settlements living in unsafe environments.
• Building on and adding to the existing network of roads and designated major roads to create a network of arterial routes carrying traffic across the east-west axes and the north-south spine roads.
• Allocating land to various uses to reflect the garden city concept, with clear urban and landscape design principles. The housing distribution should be 20%, low density, 30% medium density and 50% high density and low-income housing.
• Defining nodes of development including the Central Business District/Old City, sites for two universities (University of Science and Technology and Port Harcourt University), airport, harbours, industrial area and residential belt.
• Major expansion of the city northwards into new areas to embrace the airport and south-east towards Onne Harbour.
• Integrating the old and new parts and purposely to boost investment opportunities in the New City, including tourism.
The Greater Port Harcourt City Development Plan characterises the status quo as ‘extremely high residential densities, an informal economic base, lack of formal services and infrastructure, poverty, unemployment, poor health, urban decay and unmanaged urban expansion.’ As well as putting forward an infrastructure and land use plan for building the New City, it suggests that the Old City should be ‘upgraded, renewed, and revitalised into a vibrant centre located around the primary rivers providing excellent opportunities for waterfront development and awakening the tourism industry.’ (GIBB, 2009)
Indeed, in any planned development strategy the city needs to maintain this difficult balance between urban regeneration and urban expansion, within its currently limited capacity to manage development. In the case of the Waterfront, this represents an important potential asset in the broader regeneration of the Old City. However, we suggest that the full potential of this asset can best be realised, not through a wholesale demolish and ‘open door’ commercial development process, but through a carefully managed sequential process of new infill development, urban redevelopment and neighbourhood improvement and upgrading.
4.2 The Rivers State Government demolitions policy
UN-HABITAT, in the report of its recent fact-finding on evictions and demolitions, characterises the housing situation in Port Harcourt city as follows:
Port Harcourt Waterfront Urban Regeneration Strategy
17
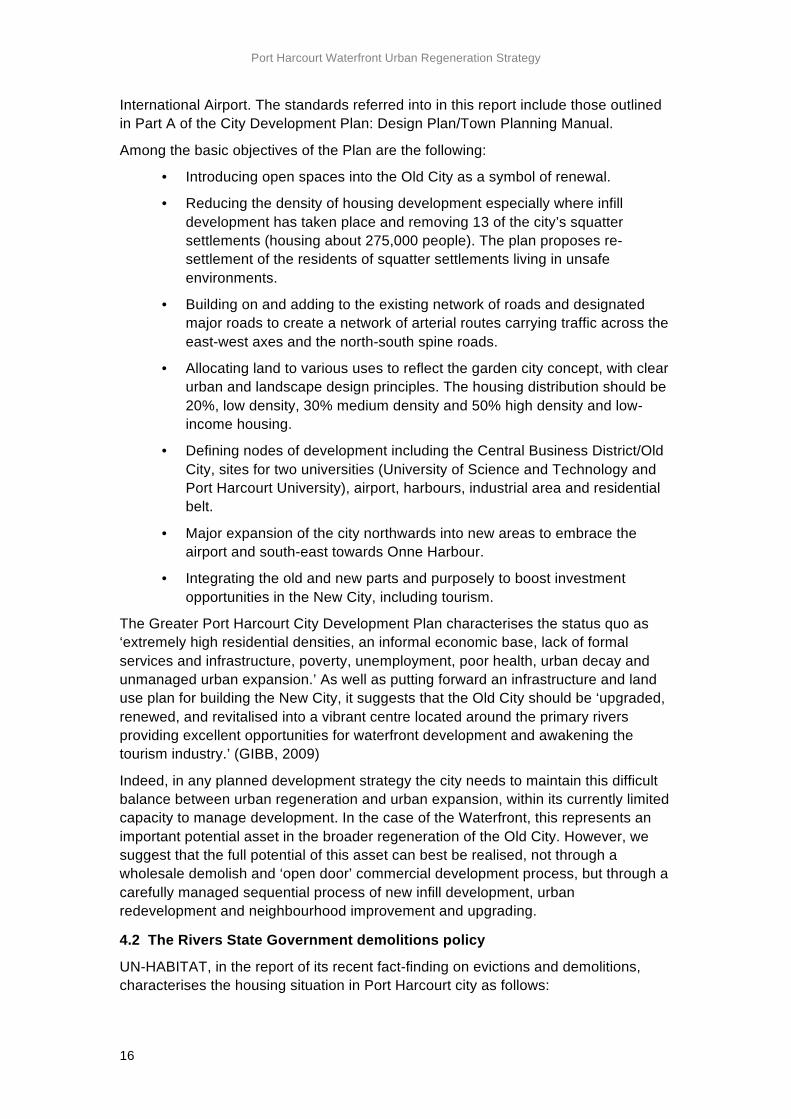
‘Port Harcourt city has more than 800,000 inhabitants (2006 census) living within its municipal boundary. According to RSG, the population of Greater Port Harcourt currently stands at 1.2 million. The city has experienced spontaneous and uncontrolled physical growth arising from rapid urbanisation during the last four decades. Faced with the high cost of inner-city rentals and scarcity of housing, many households, especially rural migrants, resorted to land reclamation of swamps along the waterfronts and their subsequent occupation via self-help housing construction. This process of growth was not foreseen by the 1975 Master Plan that aimed at providing infrastructure and orderly development for the fast-growing city. The city’s 1975 Plan was never fully implemented.’ (UN-HABITAT, 2009)
This report further notes that ‘areas have been cleared and other sites are earmarked for further demolitions. The RSG justifies its clearance actions on its urban renewal strategy and its attempts to execute part of the 1975 Master Plan…. re-establishment of development control – which has been neglected by previous administrations resulting into encroachments on vacant land and into residential development along the waterfronts – is one of the most important drivers behind the on-going demolitions.’ (UN-HABITAT, 2009)
The UN-HABITAT mission identifies three types of demolitions:
1. (‘Allegedly’) illegal structures, for which compensation is not paid, including (a) unauthorised extensions and transformations of originally legal structures in planned/GRA neighbourhoods and (b) ‘clusters’ of structures that have been erected allegedly without development permits in areas not planned for this purpose, including unplanned markets and workshops.
2. Legal structures for which compensation is paid where owners hold a Certificate of Occupancy, approved building plans and building permits.
3. Entire waterfront settlements: unplanned residential developments along the waterfronts (areas between the creeks and higher-lying planned areas of Port Harcourt).
View of Waterside community from the cliff edge
Port Harcourt Waterfront Urban Regeneration Strategy
18
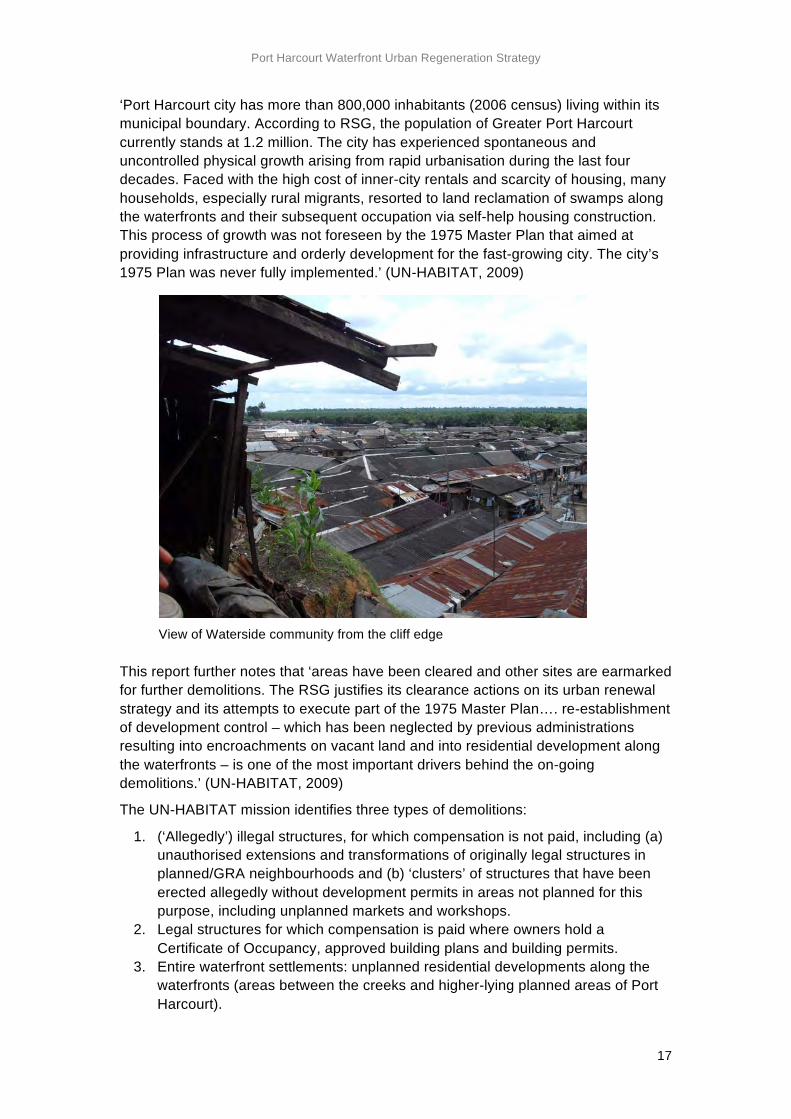
Figure 4.1. Rivers State Government publicity leaflet p1
Port Harcourt Waterfront Urban Regeneration Strategy
19
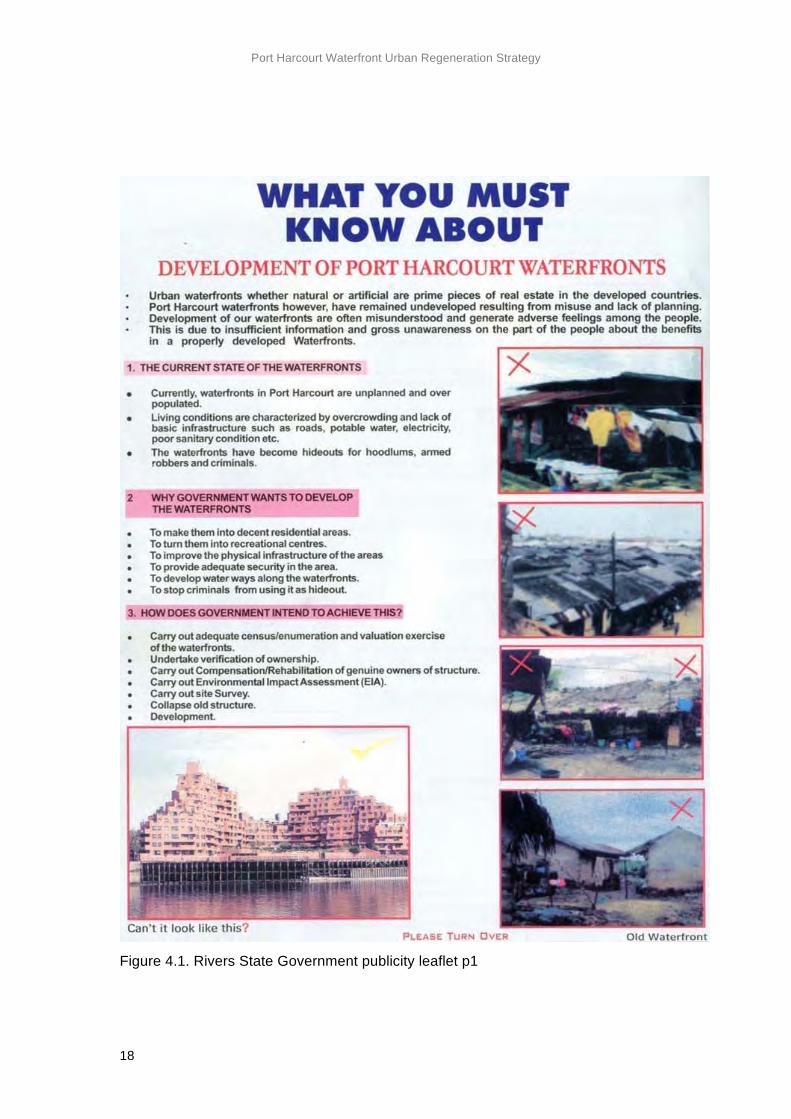
Figure 4.1. Rivers State Government publicity leaflet p2

Port Harcourt Waterfront Urban Regeneration Strategy
20
Of these three types of demolition, the main controversy surrounds the last, with accusations that the Rivers State Government is infringing laws and basic housing rights. According to the UN-HABITAT report, the legal situation regarding these settlements needs clarification, both in relation to the implementation of the Rivers State Physical Planning and Development Law of 2003 and its prescriptions for due process regarding urban renewal activities (specifically, the requirement to declare Improvement Area status) and alternatives provided for in the law, such as in situ upgrading/rehabilitation and resettlement of the residents of housing that cannot be upgraded and/or serviced, and also regarding the National Inland Waterways Act of 1997.
As the report notes:
‘The 1975 Master Plan does not provide for residential occupation of the waterfronts, and parts of them are likely to fall under the jurisdiction of the National Inland Waterways Authority. Waterfront residents do not hold land titles but Temporary Occupation Licenses (TOL). A TOL is revocable and only allows construction of a temporary hut. Since most structures in the waterfronts are built from permanent materials, they are – strictly speaking – illegal. However, the fact that residents have gone beyond what the TOL permits has not stopped Government officials from regularly renewing the TOLs, thus tacitly tolerating and recognising these settlements.’ (UN-HABITAT, 2009)
According to Aprioku (2005), the question of land ownership is controversial and the RSG claims ownership of the Waterfront areas set aside for the development of the metropolis under the Land Use Decree of 1978. There seems to be an unresolved conflict between laws passed at different times by different levels of government.
At the time of the UN-HABITAT visit ‘no waterfront had (yet) been demolished …. but the RSG had announced that it would demolish all waterfronts and redevelop them. Enumeration of property owners was underway at Abonnema Wharf and Njemanze waterfronts at the time of the Mission. The RSG intends to compensate structure owners.’ No resettlement was foreseen (UN-HABITAT, 2009). Since this visit, of course, demolitions have begun in some areas leading to temporary injunctions against the RSG by Federal judges and violent confrontations between the authorities and residents.
Whilst we respect and accept the even-handedness of the UN Habitat Report which reports on the demolition policy in Port Harcourt, it is not our aim, in this report to comment on the legal aspects of this policy. Rather, we take a long-term planning approach to the sustainable regeneration of the Waterfront area. We argue this can contribute to helping defuse the current polarised situation as well as increase the land value of the waterfront, rehabilitate its degrading environment and allow all the residents of central Port Harcourt to integrate into the future prosperity and security of the regeneration of the Old City and its Waterfront.
4.3 Housing and planning policy implications
In its consideration of the numbers of people likely to be affected by the demolitions policy, UN-HABITAT notes ‘the main difficulty in estimating affected populations is that there is no comprehensive, reliable and recent data about the total number of residents who live in the waterfront settlements’ (UN-HABITAT, 2009). They note that the ‘alarming’ numbers quoted in petitions prepared by land and housing rights
Port Harcourt Waterfront Urban Regeneration Strategy
21
organisations (e.g. 325,000 people or nearly 50 per cent of the city’s population evicted from their homes by the end of 2008) do not match the observations of the Mission.
According to a 2007 Government committee report, there are 41 waterfront communities that house 25 per cent of the total population of Port Harcourt city, which according to the 2006 Census, would translate into residential population of 200,000.
The National Union of Tenants of Nigeria (NUTN) estimates that the waterfront settlements together contain more than 75,000 buildings with a total population of over 900,000, or two-thirds of the total population of Port Harcourt city according to the 2006 census. As the UN-HABITAT report notes, ‘this is unlikely to be correct and gives evidence about the difficulties in assessing the exact number of waterfront residents.’ A ‘much needed enumeration exercise would not only identify the total number of waterfront residents; it would also provide data on absent owners, occupancy rates, number of tenants, etc.’
The UN-HABITAT Mission’s own estimates suggest that, if the demolition of all waterfront settlements goes ahead as planned and announced by the RSG, ‘at least 200,000 residents will loose their homes.’ However, they regard this as a conservative figure based on the Government’s total waterfront population estimate. By their own analysis of the resident population, and taking into account other ongoing demolition in the city, ‘the RSG’s urban renewal programme – if executed as announced – will probably destroy the homes of up to 300,000 Port Harcourt residents. In addition to residential structures, there are the numerous demolished shops, workshops and other small business structures in various parts of the city that provided livelihoods for thousands of low-income residents.’ (UN-HABITAT, 2009)
At this stage of the study we have restricted our examination to the locations that seem to be under greatest pressure from the government’s demolition policy. Many other waterfront locations outside this area would need to be considered in the next phase. Our own estimate of the total population of the waterfront communities based on our surveys (See Table 5.1) is 480,000. This covers the majority of the waterfront development although there are additional communities beyond the boundary of the study area so the total population may be larger still. It also includes formally laid out neighbourhoods such as Borokiri, which are clearly not under threat of demolition. Omitting these areas, our estimate of the affected population which may be threatened, is 410,000. This is considerably in excess of the government's total waterfront population estimate of 200,000 and tends to reinforce the findings on the UN-HABITAT Mission. It sits approximately mid-way between official Government estimates, and the estimates of the housing rights bodies.
However, it is our view that, if the population of the Waterfront area is so much greater than official estimates, as based on a proportion of the census population figure for the city, this is possibly a reflection that the 2006 census did not properly enumerate the population of the informally settled areas. If a quarter of the population live in the Waterfront settlements, by our estimate this would make the true population of the city around 2 million.
Whether the population of the larger urban population is much greater as some sources suggest (the GIBB Development Plan report of 2009, for example, suggests
Port Harcourt Waterfront Urban Regeneration Strategy
22
the current population is 1.9 million) or not, the wholesale eviction and/or relocation of between 300,000 and 400,000 people represents a huge planning challenge.
Although largely engaged in informal economic activities, this population represents a substantial proportion of the city’s workforce and is therefore essential to its economic functioning. The city’s economy and Rivers State as a whole would undoubtedly be undermined should half a million of its population decide to ‘return to their villages’, which is the implied policy intention of a ‘compensate and demolish’ as opposed to an urban regeneration approach. Of course, this mass exodus will not happen. Instead, unless it is accompanied by a vast programme of planned relocation, mass eviction is likely to add enormously to the informal land development pressures on the city periphery, and to the friction delaying the implementation of the Greater Port Harcourt Master Plan to the north of the city centre, possibly throwing it into disarray.
Port Harcourt Waterfront Urban Regeneration Strategy
23
5. Survey findings
5.1 The Port Waterfront communities: satellite image analysis
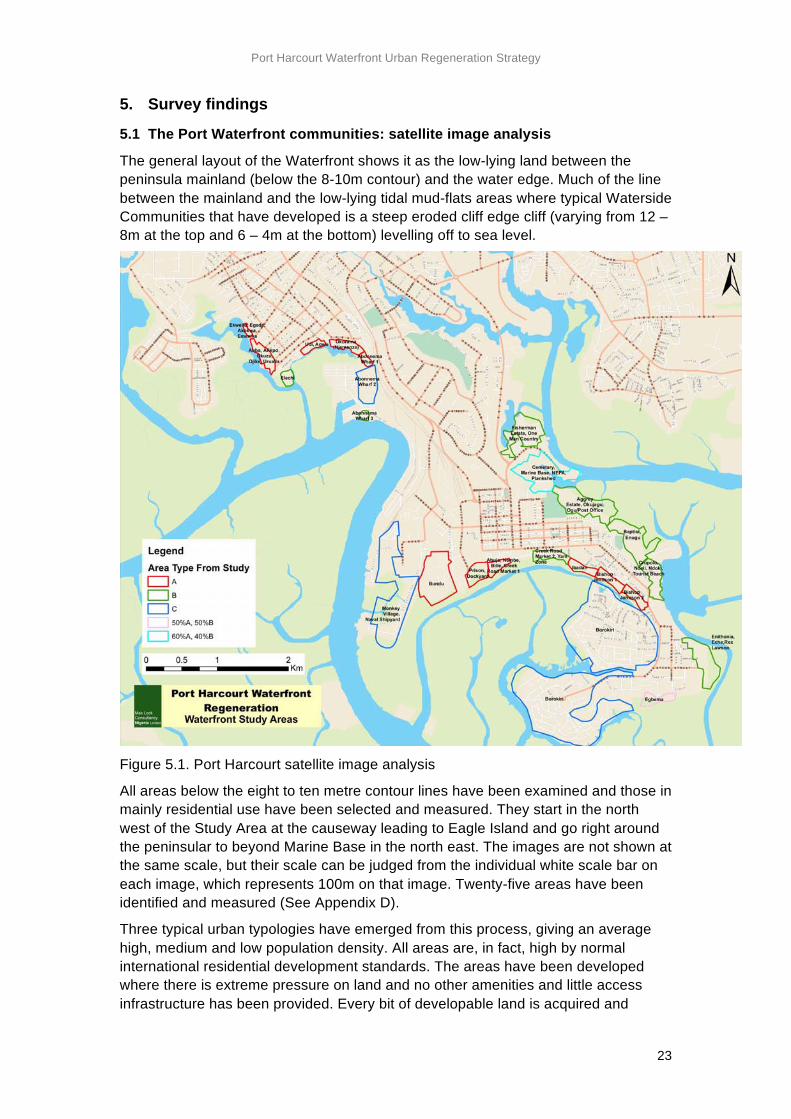
The general layout of the Waterfront shows it as the low-lying land between the peninsula mainland (below the 8-10m contour) and the water edge. Much of the line between the mainland and the low-lying tidal mud-flats areas where typical Waterside Communities that have developed is a steep eroded cliff edge cliff (varying from 12 – 8m at the top and 6 – 4m at the bottom) levelling off to sea level.
Figure 5.1. Port Harcourt satellite image analysis
All areas below the eight to ten metre contour lines have been examined and those in mainly residential use have been selected and measured. They start in the north west of the Study Area at the causeway leading to Eagle Island and go right around the peninsular to beyond Marine Base in the north east. The images are not shown at the same scale, but their scale can be judged from the individual white scale bar on each image, which represents 100m on that image. Twenty-five areas have been identified and measured (See Appendix D).
Three typical urban typologies have emerged from this process, giving an average high, medium and low population density. All areas are, in fact, high by normal international residential development standards. The areas have been developed where there is extreme pressure on land and no other amenities and little access infrastructure has been provided. Every bit of developable land is acquired and
Port Harcourt Waterfront Urban Regeneration Strategy
24
developed for private residential use. Because of their relatively central location and sustainable journey to work costs, occupancy rates are high, for both plots and rooms.
These three typologies have been looked at in order to get a reasonable estimate of the populations living in them. In total this estimate works out at just under 500 hectares with over half a million people. There is naturally at this early stage a likely wide margin of error in these estimates and these will need to be firmed up and confirmed in the next Stage.
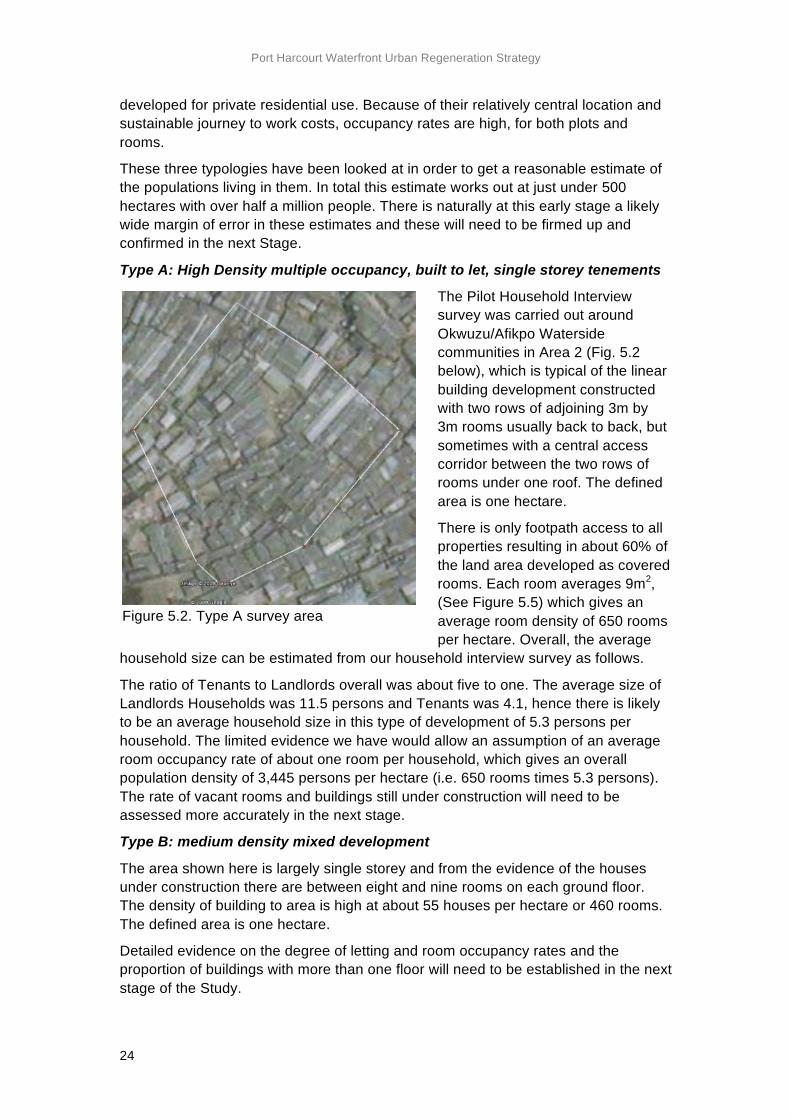
Type A: High Density multiple occupancy, built to let, single storey tenements
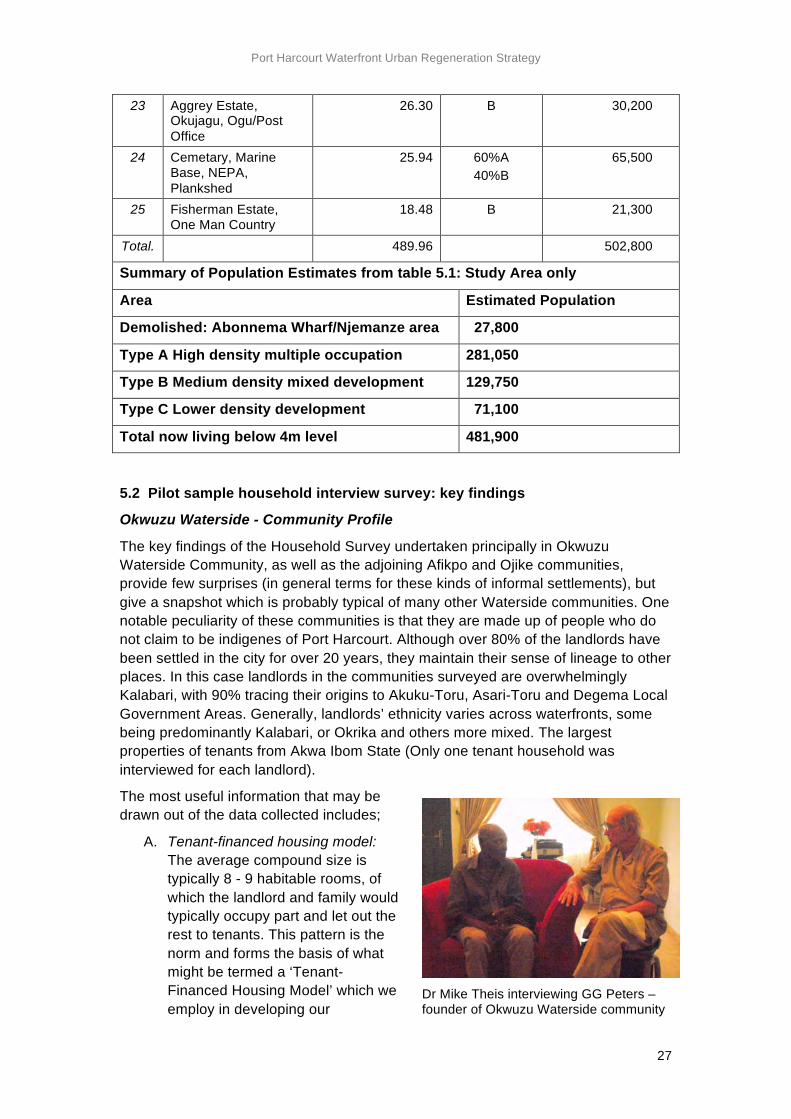
The Pilot Household Interview survey was carried out around Okwuzu/Afikpo Waterside communities in Area 2 (Fig. 5.2 below), which is typical of the linear building development constructed with two rows of adjoining 3m by 3m rooms usually back to back, but sometimes with a central access corridor between the two rows of rooms under one roof. The defined area is one hectare.
There is only footpath access to all properties resulting in about 60% of the land area developed as covered rooms. Each room averages 9m2, (See Figure 5.5) which gives an average room density of 650 rooms per hectare. Overall, the average
household size can be estimated from our household interview survey as follows.
The ratio of Tenants to Landlords overall was about five to one. The average size of Landlords Households was 11.5 persons and Tenants was 4.1, hence there is likely to be an average household size in this type of development of 5.3 persons per household. The limited evidence we have would allow an assumption of an average room occupancy rate of about one room per household, which gives an overall population density of 3,445 persons per hectare (i.e. 650 rooms times 5.3 persons). The rate of vacant rooms and buildings still under construction will need to be assessed more accurately in the next stage.
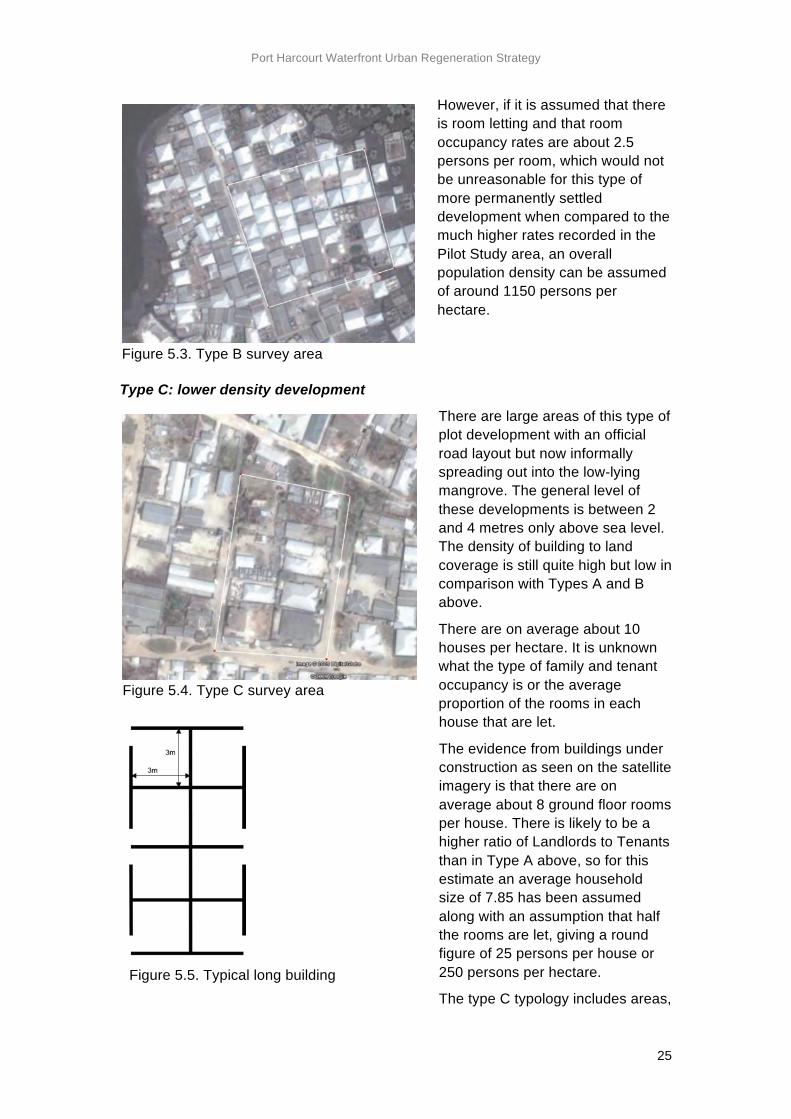
Type B: medium density mixed development
The area shown here is largely single storey and from the evidence of the houses under construction there are between eight and nine rooms on each ground floor. The density of building to area is high at about 55 houses per hectare or 460 rooms. The defined area is one hectare.
Detailed evidence on the degree of letting and room occupancy rates and the proportion of buildings with more than one floor will need to be established in the next stage of the Study.
Figure 5.2. Type A survey area
Port Harcourt Waterfront Urban Regeneration Strategy
25
Figure 5.5. Typical long building
However, if it is assumed that there is room letting and that room occupancy rates are about 2.5 persons per room, which would not be unreasonable for this type of more permanently settled development when compared to the much higher rates recorded in the Pilot Study area, an overall population density can be assumed of around 1150 persons per hectare.
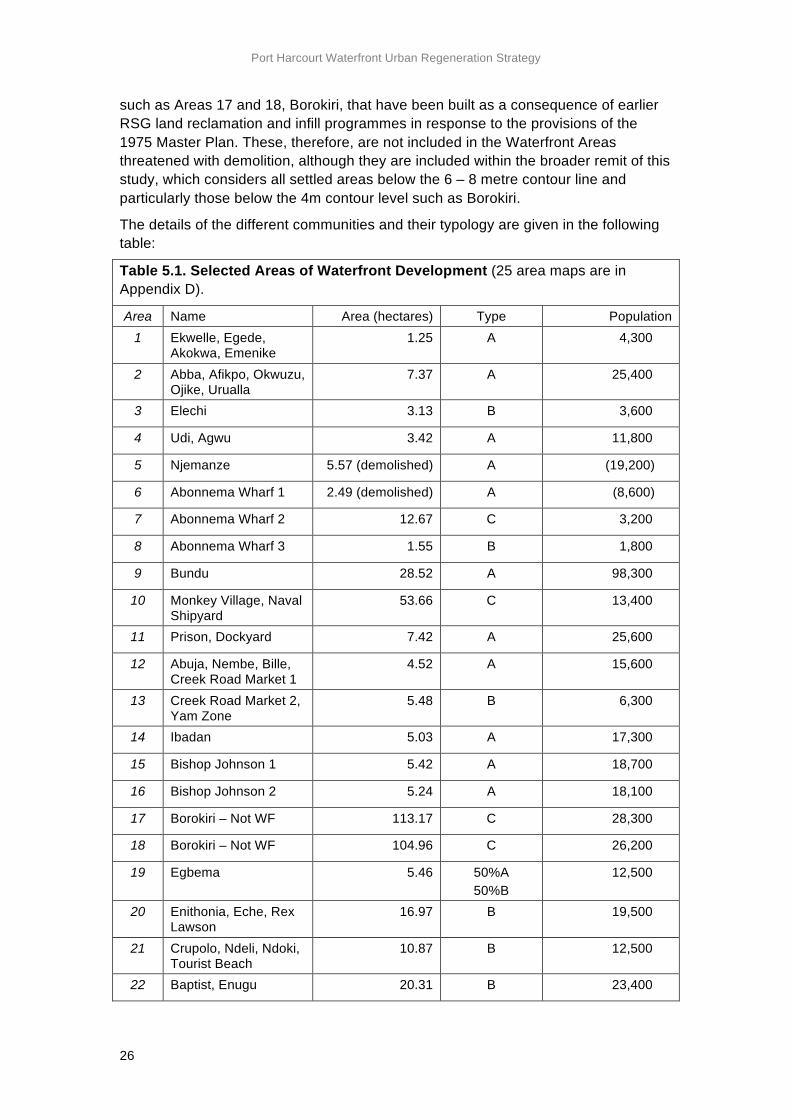
Type C: lower density development
There are large areas of this type of plot development with an official road layout but now informally spreading out into the low-lying mangrove. The general level of these developments is between 2 and 4 metres only above sea level. The density of building to land coverage is still quite high but low in comparison with Types A and B above.
There are on average about 10 houses per hectare. It is unknown what the type of family and tenant occupancy is or the average proportion of the rooms in each house that are let.
The evidence from buildings under construction as seen on the satellite imagery is that there are on average about 8 ground floor rooms per house. There is likely to be a higher ratio of Landlords to Tenants than in Type A above, so for this estimate an average household size of 7.85 has been assumed along with an assumption that half the rooms are let, giving a round figure of 25 persons per house or 250 persons per hectare.
The type C typology includes areas,
Figure 5.4. Type C survey area
Figure 5.3. Type B survey area
Port Harcourt Waterfront Urban Regeneration Strategy
26
such as Areas 17 and 18, Borokiri, that have been built as a consequence of earlier RSG land reclamation and infill programmes in response to the provisions of the 1975 Master Plan. These, therefore, are not included in the Waterfront Areas threatened with demolition, although they are included within the broader remit of this study, which considers all settled areas below the 6 – 8 metre contour line and particularly those below the 4m contour level such as Borokiri.
The details of the different communities and their typology are given in the following table:
Table 5.1. Selected Areas of Waterfront Development (25 area maps are in Appendix D).
Area Name Area (hectares) Type Population 1 Ekwelle, Egede,
Akokwa, Emenike 1.25 A 4,300
2 Abba, Afikpo, Okwuzu, Ojike, Urualla
7.37 A 25,400
3 Elechi 3.13 B 3,600
4 Udi, Agwu 3.42 A 11,800
5 Njemanze 5.57 (demolished) A (19,200)
6 Abonnema Wharf 1 2.49 (demolished) A (8,600)
7 Abonnema Wharf 2 12.67 C 3,200
8 Abonnema Wharf 3 1.55 B 1,800
9 Bundu 28.52 A 98,300
10 Monkey Village, Naval Shipyard
53.66 C 13,400
11 Prison, Dockyard 7.42 A 25,600
12 Abuja, Nembe, Bille, Creek Road Market 1
4.52 A 15,600
13 Creek Road Market 2, Yam Zone
5.48 B 6,300
14 Ibadan 5.03 A 17,300
15 Bishop Johnson 1 5.42 A 18,700
16 Bishop Johnson 2 5.24 A 18,100
17 Borokiri – Not WF 113.17 C 28,300
18 Borokiri – Not WF 104.96 C 26,200
19 Egbema 5.46 50%A 50%B
12,500
20 Enithonia, Eche, Rex Lawson
16.97 B 19,500
21 Crupolo, Ndeli, Ndoki, Tourist Beach
10.87 B 12,500
22 Baptist, Enugu 20.31 B 23,400
Port Harcourt Waterfront Urban Regeneration Strategy
27
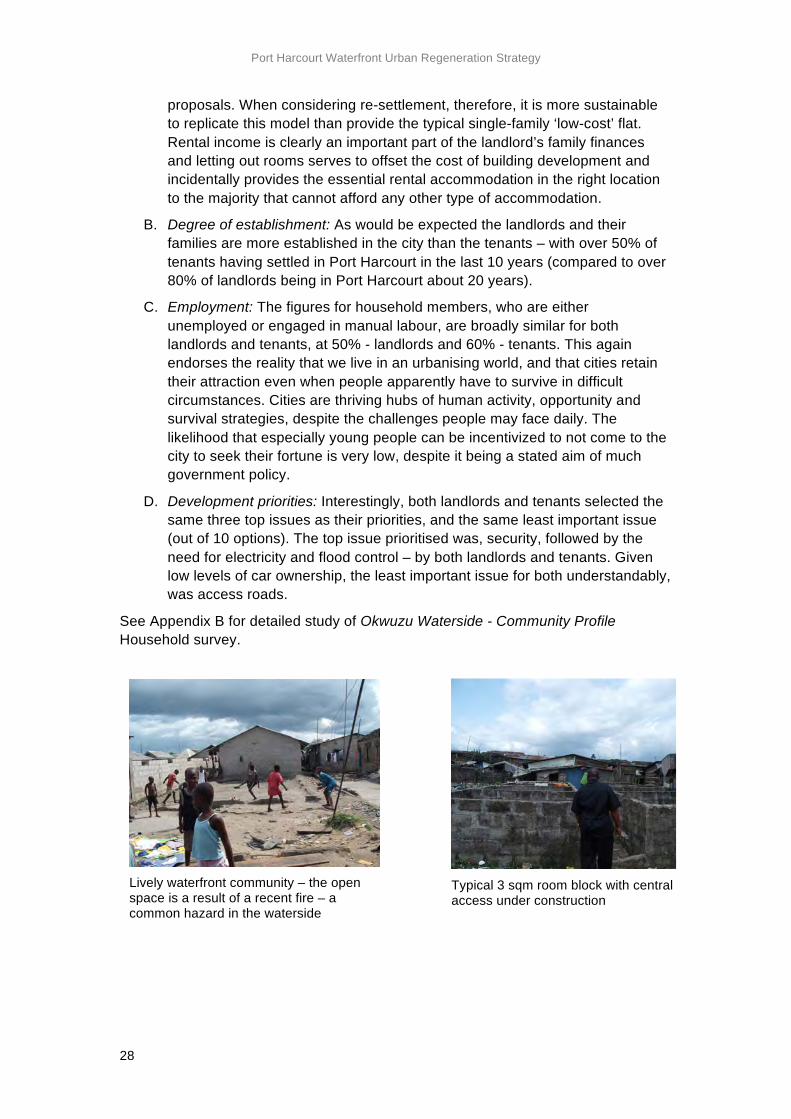
Dr Mike Theis interviewing GG Peters – founder of Okwuzu Waterside community
23 Aggrey Estate, Okujagu, Ogu/Post Office
26.30 B 30,200
24 Cemetary, Marine Base, NEPA, Plankshed
25.94 60%A 40%B
65,500
25 Fisherman Estate, One Man Country
18.48 B 21,300
Total. 489.96 502,800
Summary of Population Estimates from table 5.1: Study Area only
Area Estimated Population
Demolished: Abonnema Wharf/Njemanze area 27,800
Type A High density multiple occupation 281,050
Type B Medium density mixed development 129,750
Type C Lower density development 71,100
Total now living below 4m level 481,900
5.2 Pilot sample household interview survey: key findings
Okwuzu Waterside - Community Profile
The key findings of the Household Survey undertaken principally in Okwuzu Waterside Community, as well as the adjoining Afikpo and Ojike communities, provide few surprises (in general terms for these kinds of informal settlements), but give a snapshot which is probably typical of many other Waterside communities. One notable peculiarity of these communities is that they are made up of people who do not claim to be indigenes of Port Harcourt. Although over 80% of the landlords have been settled in the city for over 20 years, they maintain their sense of lineage to other places. In this case landlords in the communities surveyed are overwhelmingly Kalabari, with 90% tracing their origins to Akuku-Toru, Asari-Toru and Degema Local Government Areas. Generally, landlords’ ethnicity varies across waterfronts, some being predominantly Kalabari, or Okrika and others more mixed. The largest properties of tenants from Akwa Ibom State (Only one tenant household was interviewed for each landlord).
The most useful information that may be drawn out of the data collected includes;
A. Tenant-financed housing model: The average compound size is typically 8 - 9 habitable rooms, of which the landlord and family would typically occupy part and let out the rest to tenants. This pattern is the norm and forms the basis of what might be termed a ‘Tenant-Financed Housing Model’ which we employ in developing our
Port Harcourt Waterfront Urban Regeneration Strategy
28
proposals. When considering re-settlement, therefore, it is more sustainable to replicate this model than provide the typical single-family ‘low-cost’ flat. Rental income is clearly an important part of the landlord’s family finances and letting out rooms serves to offset the cost of building development and incidentally provides the essential rental accommodation in the right location to the majority that cannot afford any other type of accommodation.
B. Degree of establishment: As would be expected the landlords and their families are more established in the city than the tenants – with over 50% of tenants having settled in Port Harcourt in the last 10 years (compared to over 80% of landlords being in Port Harcourt about 20 years).
C. Employment: The figures for household members, who are either unemployed or engaged in manual labour, are broadly similar for both landlords and tenants, at 50% - landlords and 60% - tenants. This again endorses the reality that we live in an urbanising world, and that cities retain their attraction even when people apparently have to survive in difficult circumstances. Cities are thriving hubs of human activity, opportunity and survival strategies, despite the challenges people may face daily. The likelihood that especially young people can be incentivized to not come to the city to seek their fortune is very low, despite it being a stated aim of much government policy.
D. Development priorities: Interestingly, both landlords and tenants selected the same three top issues as their priorities, and the same least important issue (out of 10 options). The top issue prioritised was, security, followed by the need for electricity and flood control – by both landlords and tenants. Given low levels of car ownership, the least important issue for both understandably, was access roads.
See Appendix B for detailed study of Okwuzu Waterside - Community Profile Household survey.
Lively waterfront community – the open space is a result of a recent fire – a common hazard in the waterside
Typical 3 sqm room block with central access under construction
Port Harcourt Waterfront Urban Regeneration Strategy
29
6. Urban regeneration proposals
6.1 Planning principles, guidelines and strategic options
The current RSG approach is demolition and clearance of the unplanned Waterfront areas without policies for relocation and resettlement of the population, but with compensation paid to property owners. This is to make way for commercial redevelopment of the cleared land, normally requiring additional landfill works to bring the level of site area up to the higher level developed area of the city to provide direct physical access to the street system and the formal infrastructure of the city. This can be a costly exercise, if carried out to proper engineering specifications to avoid settlement and future coastal erosion problems.
The following alternatives to the current approach are available. These are options that can be considered for each location currently occupied by waterside communities and chosen between depending on conditions:
a) Commercial redevelopment of appropriately and strategically located sites with remote off-site resettlement
This option requires clearance of strategically located Waterfront settlement areas for commercial redevelopment with planned relocation and off site resettlement of the evicted population. It requires identification of those stretches of waterfront that area suitably located for possible exclusive commercial development i.e. with good links to related development on higher ground and open view over protected mangrove or over. Identifying these sites would be a principal aim of the main study. It requires identification of relocation sites that are preferably located close to current sources of livelihood. However, given the intensity of the current development of the Waterfront and adjacent areas, there are few choices other than further land reclamation and infill. This option is addressed below.
In the absence of land infill and reclamation, the displaced population would need to be resettled in a more remote location, probably on low cost land to the north of the city. This would permit a lower density, low rise solution with through publicly-subsidised formal housing, or through a ‘sites and services’ approach, or provision of service core housing units, which can be expanded according to individual household requirements.
One problem here is that provision of serviced sites or service core housing units, whilst more affordable, requires that sufficient time is set aside for construction of new housing through a ‘self-build’ process and while this may accommodate the needs of landlord households, the pressing housing needs of displaced tenants are unlikely to be accommodated.
A major disadvantage, particularly for tenants who currently depend on low priced accommodation close to their source of livelihoods, is the additional cost and time associated with travel to their customary places of employment in the city centre. Any further investigation of this option should give due consideration to travel-to-work issues and adequacy of public transportation facilities in identifying possible remote sites for resettlement as well as the unsustainable urban pattern of long daily journeys to work.
Port Harcourt Waterfront Urban Regeneration Strategy
30
b) Commercial redevelopment of appropriately and strategically located sites with land sharing/on site resettlement
A second option is on site resettlement through densification and multi-storey development and a ‘land sharing’ approach. The is the approached proposed by UN-HABITAT in the section of its report on the Silverbird Showtime development triggering recent demolitions long along Abonnema Wharf Road and Njemanze Road. According to the report the public-private partnership agreement implies the redevelopment of all land within a 2 km radius with land clearance affecting between 100,000 and 150,000 people (UN-HABITAT, 2009)
According to UN-HABITAT, ‘if the provisions of the 2003 Law would have been followed, it appears unlikely that the Silverbird public-private partnership project, regarded as an initiative for the public good, would have been approved and executed the way it is ….. the 2003 Law promotes – where technically, financially and environmentally possible – in situ upgrading of existing settlements as part of an inclusive, pro-poor urban renewal programme. If implemented, this would create the basis for the transformation of informal settlements located within the surrounding 2 km of the Silverbird site into sustainable neighbourhoods. These could contain possibilities for high-rise, multi-family, high-density housing where people can sustain their livelihoods while living and earning their income from Silverbird’s mall and entertainment parks and its surroundings.’ (UN-HABITAT, 2009, p.xii)
While there is much to say in favour of a land sharing approach in general, high rise, high density multi-family housing typologies are costly and would require considerable adaptation on the part of the low income residents used to living in one storey accommodation. Apart from the cultural constraints to high rise living in the Nigerian context, even with a high degree of public subsidy and access to the necessary long term finance to support such a development, cost recovery requirements for this type of accommodation is likely to make it unaffordable for the average low income tenant.
Any land sharing approach is likely to run into similar constraints, although an intermediate medium rise, high density solution involving walk-up flats in two, three or four storey accommodation might be culturally more acceptable. Any such development designed to appropriate modern standards, however, is unlikely to match the very high densities experienced in the informal Waterfront settlements and therefore only a proportion of those being displaced could be re-housed on site. This would probably be the case, even with high rise development. Any form of multi-storey development will be subject to engineering and cost feasibility constraints where their foundations are formed on filled land or sedimentary soils.
c) Upgrading and improvements to existing low income, informal neighbourhoods
As noted above, the 2003 Rivers State planning law promotes in situ upgrading and rehabilitation of existing settlements as part of an inclusive, pro-poor urban renewal programme. In the case of the Waterfront settlement, radical interventions are required to bring these up to a decent living standard, particularly in the higher density type A and type B urban typologies, as follows:
Reduction in density and provision of vehicular access:
Port Harcourt Waterfront Urban Regeneration Strategy
31
Vehicular access is absent in many parts of the developed Waterfront area and is necessary to provide basic urban services such as access to emergency service vehicles and for solid waste removal and disposal. Currently, according to Aprioku (2005), around 80% of solid waste is dumped into rivers, and /or used as a base for further land reclamation. Refuse tipping is actively encouraged as the first base for extending reclamation by the communities. This is followed by canoe imported sediment (which we were told was expensive and was not affordable for the complete infill) compacted on top. The potential environmental health and subsidence concerns associated with these practices need further investigation.
Selective demolition would be necessary to introduce essential vehicular routes and to improve pedestrian access to these. This would help reduce the overall density of the area, although a further reduction in density of some neighbourhoods would also probably be required to improve comfort and bring environmental conditions up to a suitable standard.
Sanitation
Currently, a ‘pier latrine’ where the waste is discharged directly into the rivers and creeks is the most common form of sanitation. Waste water also drains into the waterways and, together, these constitute a serious environmental health hazard, polluting the river and posing a danger to the inhabitants from contamination of drinking water from the wells that 80% of residents use to meet their daily needs (Aprioku, 2005). Alternative forms of sanitation need to be investigated as part of the overall infrastructure works to improve environmental conditions in the informal neighbourhoods. One possibility is the installation of small-scale local sewage plants with main drains, linked to communal toilet blocks (or individual houses where costs allow) and combine with other infrastructure works such as access roads and flood defences.
Social facilities and amenities
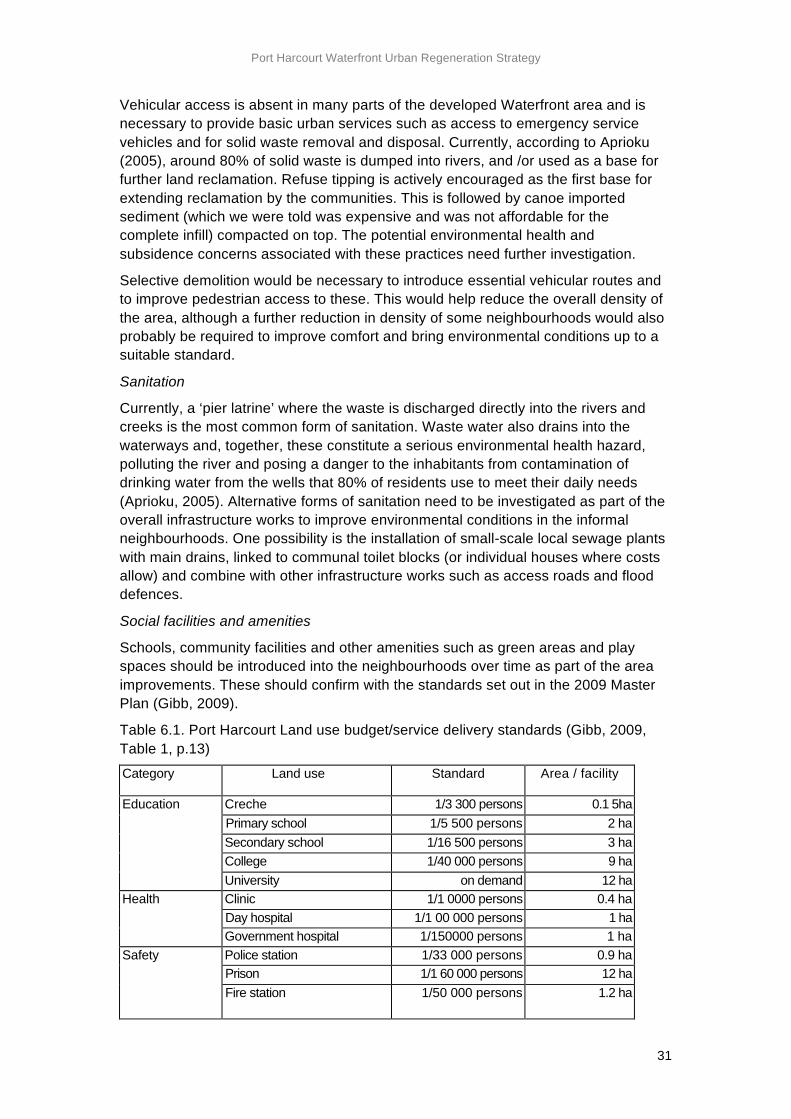
Schools, community facilities and other amenities such as green areas and play spaces should be introduced into the neighbourhoods over time as part of the area improvements. These should confirm with the standards set out in the 2009 Master Plan (Gibb, 2009).
Table 6.1. Port Harcourt Land use budget/service delivery standards (Gibb, 2009, Table 1, p.13)
Category Land use Standard Area / facility
Education Creche 1/3 300 persons 0.1 5ha
Primary school 1/5 500 persons 2 ha
Secondary school 1/16 500 persons 3 ha
College 1/40 000 persons 9 ha
University on demand 12 ha Health Clinic 1/1 0000 persons 0.4 ha
Day hospital 1/1 00 000 persons 1 ha
Government hospital 1/150000 persons 1 ha Safety Police station 1/33 000 persons 0.9 ha
Prison 1/1 60 000 persons 12 ha
Fire station 1/50 000 persons 1.2 ha
Port Harcourt Waterfront Urban Regeneration Strategy
32
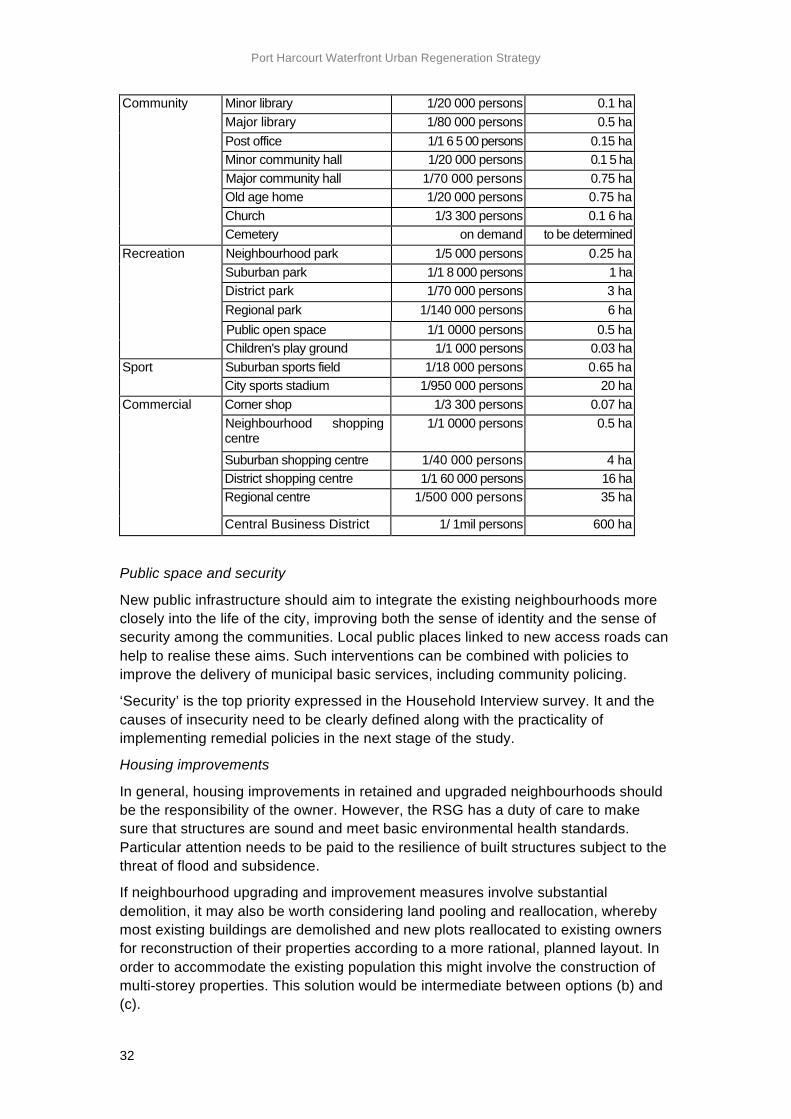
Community Minor library 1/20 000 persons 0.1 ha
Major library 1/80 000 persons 0.5 ha
Post office 1/1 6 5 00 persons 0.15 ha
Minor community hall 1/20 000 persons 0.1 5 ha
Major community hall 1/70 000 persons 0.75 ha
Old age home 1/20 000 persons 0.75 ha
Church 1/3 300 persons 0.1 6 ha
Cemetery on demand to be determined Recreation Neighbourhood park 1/5 000 persons 0.25 ha
Suburban park 1/1 8 000 persons 1 ha
District park 1/70 000 persons 3 ha
Regional park 1/140 000 persons 6 ha Public open space 1/1 0000 persons 0.5 ha
Children's play ground 1/1 000 persons 0.03 ha Sport Suburban sports field 1/18 000 persons 0.65 ha
City sports stadium 1/950 000 persons 20 ha Commercial Corner shop 1/3 300 persons 0.07 ha
Neighbourhood shopping centre
1/1 0000 persons 0.5 ha
Suburban shopping centre 1/40 000 persons 4 ha
District shopping centre 1/1 60 000 persons 16 ha
Regional centre 1/500 000 persons 35 ha
Central Business District 1/ 1mil persons 600 ha
Public space and security
New public infrastructure should aim to integrate the existing neighbourhoods more closely into the life of the city, improving both the sense of identity and the sense of security among the communities. Local public places linked to new access roads can help to realise these aims. Such interventions can be combined with policies to improve the delivery of municipal basic services, including community policing.
‘Security’ is the top priority expressed in the Household Interview survey. It and the causes of insecurity need to be clearly defined along with the practicality of implementing remedial policies in the next stage of the study.
Housing improvements
In general, housing improvements in retained and upgraded neighbourhoods should be the responsibility of the owner. However, the RSG has a duty of care to make sure that structures are sound and meet basic environmental health standards. Particular attention needs to be paid to the resilience of built structures subject to the threat of flood and subsidence.
If neighbourhood upgrading and improvement measures involve substantial demolition, it may also be worth considering land pooling and reallocation, whereby most existing buildings are demolished and new plots reallocated to existing owners for reconstruction of their properties according to a more rational, planned layout. In order to accommodate the existing population this might involve the construction of multi-storey properties. This solution would be intermediate between options (b) and (c).
Port Harcourt Waterfront Urban Regeneration Strategy
33
d) Mixed development on newly reclaimed infill areas: towards a new Garden City solution
This is the most significant of the options. It can facilitate implementation of the other options that can facilitate implementation of the other options in different locations and a proper urban regeneration strategy for the whole waterfront. Our recommendation is that, subject to further feasibility investigations, and in combination with the other alternatives outlined above where appropriate, it should form the main element of any future plan for regeneration of the Waterfront.
Reclamation of mangrove and mud flat areas was an important part of the 1975 Master Plan and resulted in the developments at Borokiri in 1980 (Aprioku, 2005). Smaller areas of reclaimed land were developed at this time by RSG at Ihekire Street (Old GRA area) and associated with the nearby Eastern By-pass. According to Aprioku, the effort to develop these waterfront areas was not sustained by subsequent administrations (Aprioku, 2005).
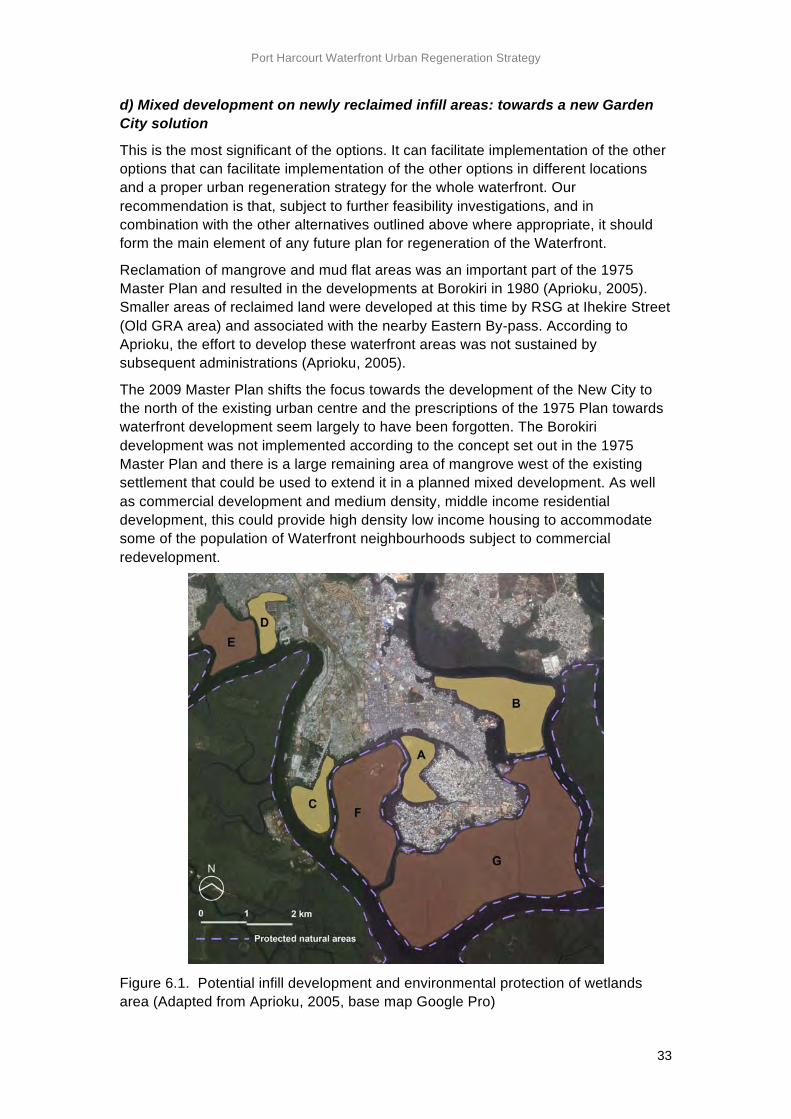
The 2009 Master Plan shifts the focus towards the development of the New City to the north of the existing urban centre and the prescriptions of the 1975 Plan towards waterfront development seem largely to have been forgotten. The Borokiri development was not implemented according to the concept set out in the 1975 Master Plan and there is a large remaining area of mangrove west of the existing settlement that could be used to extend it in a planned mixed development. As well as commercial development and medium density, middle income residential development, this could provide high density low income housing to accommodate some of the population of Waterfront neighbourhoods subject to commercial redevelopment.
Figure 6.1. Potential infill development and environmental protection of wetlands area (Adapted from Aprioku, 2005, base map Google Pro)
Port Harcourt Waterfront Urban Regeneration Strategy
34
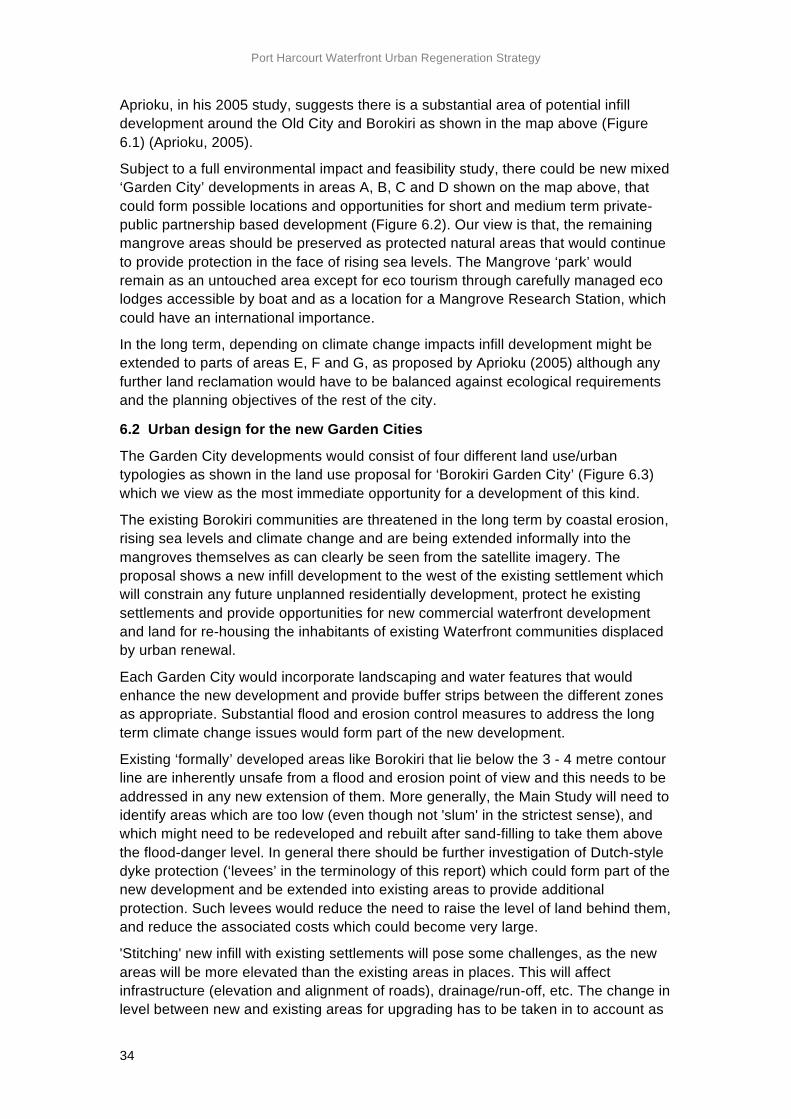
Aprioku, in his 2005 study, suggests there is a substantial area of potential infill development around the Old City and Borokiri as shown in the map above (Figure 6.1) (Aprioku, 2005).
Subject to a full environmental impact and feasibility study, there could be new mixed ‘Garden City’ developments in areas A, B, C and D shown on the map above, that could form possible locations and opportunities for short and medium term private-public partnership based development (Figure 6.2). Our view is that, the remaining mangrove areas should be preserved as protected natural areas that would continue to provide protection in the face of rising sea levels. The Mangrove ‘park’ would remain as an untouched area except for eco tourism through carefully managed eco lodges accessible by boat and as a location for a Mangrove Research Station, which could have an international importance.
In the long term, depending on climate change impacts infill development might be extended to parts of areas E, F and G, as proposed by Aprioku (2005) although any further land reclamation would have to be balanced against ecological requirements and the planning objectives of the rest of the city.
6.2 Urban design for the new Garden Cities
The Garden City developments would consist of four different land use/urban typologies as shown in the land use proposal for ‘Borokiri Garden City’ (Figure 6.3) which we view as the most immediate opportunity for a development of this kind.
The existing Borokiri communities are threatened in the long term by coastal erosion, rising sea levels and climate change and are being extended informally into the mangroves themselves as can clearly be seen from the satellite imagery. The proposal shows a new infill development to the west of the existing settlement which will constrain any future unplanned residentially development, protect he existing settlements and provide opportunities for new commercial waterfront development and land for re-housing the inhabitants of existing Waterfront communities displaced by urban renewal.
Each Garden City would incorporate landscaping and water features that would enhance the new development and provide buffer strips between the different zones as appropriate. Substantial flood and erosion control measures to address the long term climate change issues would form part of the new development.
Existing ‘formally’ developed areas like Borokiri that lie below the 3 - 4 metre contour line are inherently unsafe from a flood and erosion point of view and this needs to be addressed in any new extension of them. More generally, the Main Study will need to identify areas which are too low (even though not 'slum' in the strictest sense), and which might need to be redeveloped and rebuilt after sand-filling to take them above the flood-danger level. In general there should be further investigation of Dutch-style dyke protection (‘levees’ in the terminology of this report) which could form part of the new development and be extended into existing areas to provide additional protection. Such levees would reduce the need to raise the level of land behind them, and reduce the associated costs which could become very large.
'Stitching' new infill with existing settlements will pose some challenges, as the new areas will be more elevated than the existing areas in places. This will affect infrastructure (elevation and alignment of roads), drainage/run-off, etc. The change in level between new and existing areas for upgrading has to be taken in to account as
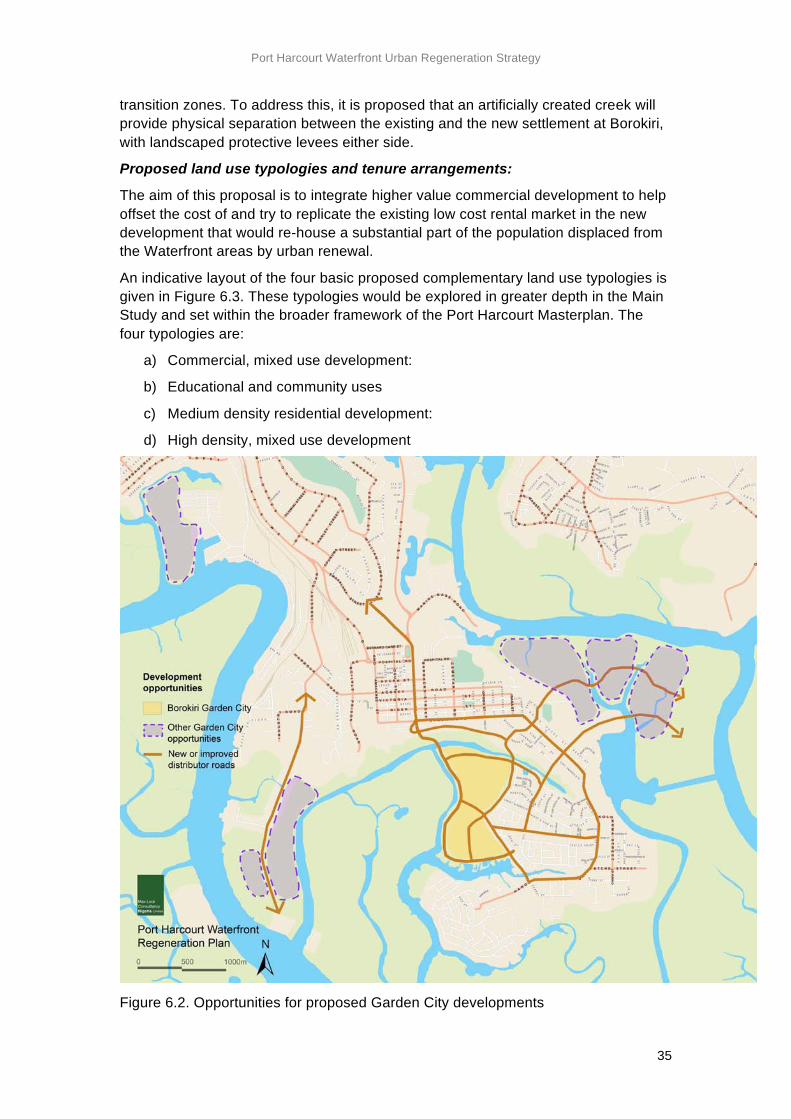
Port Harcourt Waterfront Urban Regeneration Strategy
35
transition zones. To address this, it is proposed that an artificially created creek will provide physical separation between the existing and the new settlement at Borokiri, with landscaped protective levees either side.
Proposed land use typologies and tenure arrangements:
The aim of this proposal is to integrate higher value commercial development to help offset the cost of and try to replicate the existing low cost rental market in the new development that would re-house a substantial part of the population displaced from the Waterfront areas by urban renewal.
An indicative layout of the four basic proposed complementary land use typologies is given in Figure 6.3. These typologies would be explored in greater depth in the Main Study and set within the broader framework of the Port Harcourt Masterplan. The four typologies are:
a) Commercial, mixed use development:
b) Educational and community uses
c) Medium density residential development:
d) High density, mixed use development
Figure 6.2. Opportunities for proposed Garden City developments
Port Harcourt Waterfront Urban Regeneration Strategy
36
Figure 6.3. Land use proposal of Borokiri Garden City
a) Commercial, mixed use development (Figure 6.4)
These would be the highest value land use areas, fronting a new Waterfront road and landscaped protective embankment, or central landscaped cross route. They would incorporate a mix of multi-storey (3 to 6 stories) office and apartment buildings combined, in some locations, with retail developments at ground floor level. They would be located between two ‘anchor’ developments – a hotel in the north and a
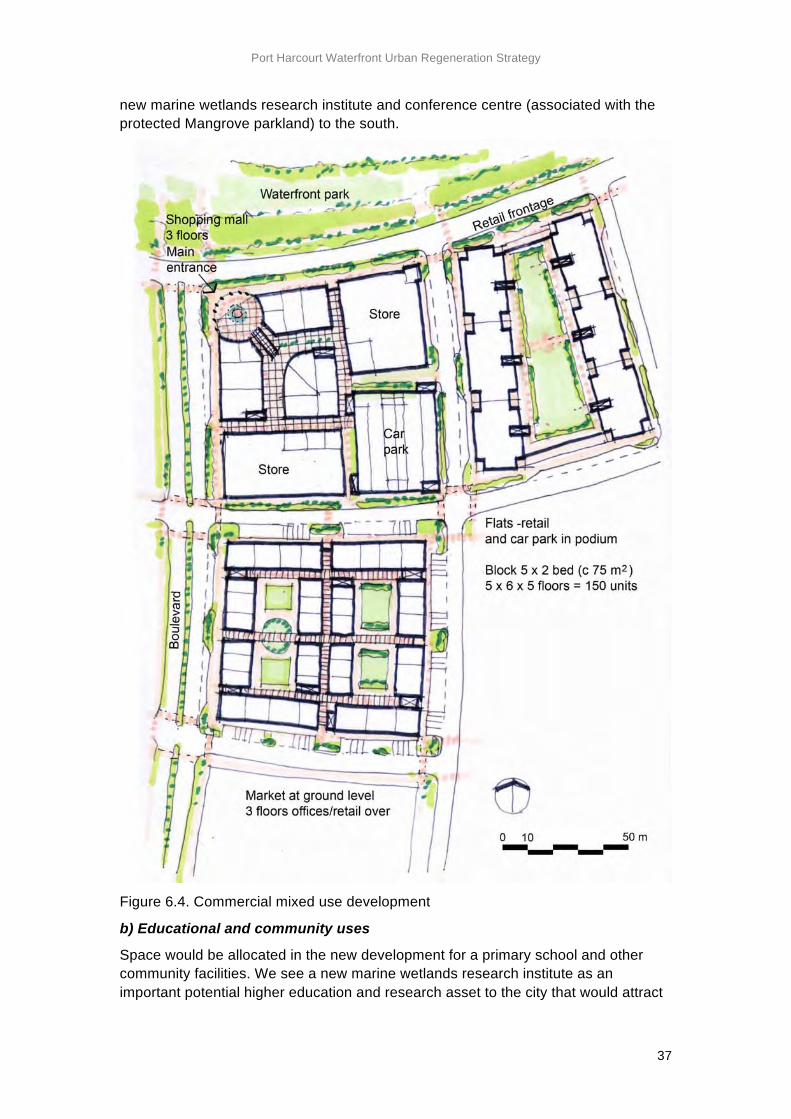
Port Harcourt Waterfront Urban Regeneration Strategy
37
new marine wetlands research institute and conference centre (associated with the protected Mangrove parkland) to the south.
Figure 6.4. Commercial mixed use development
b) Educational and community uses
Space would be allocated in the new development for a primary school and other community facilities. We see a new marine wetlands research institute as an important potential higher education and research asset to the city that would attract
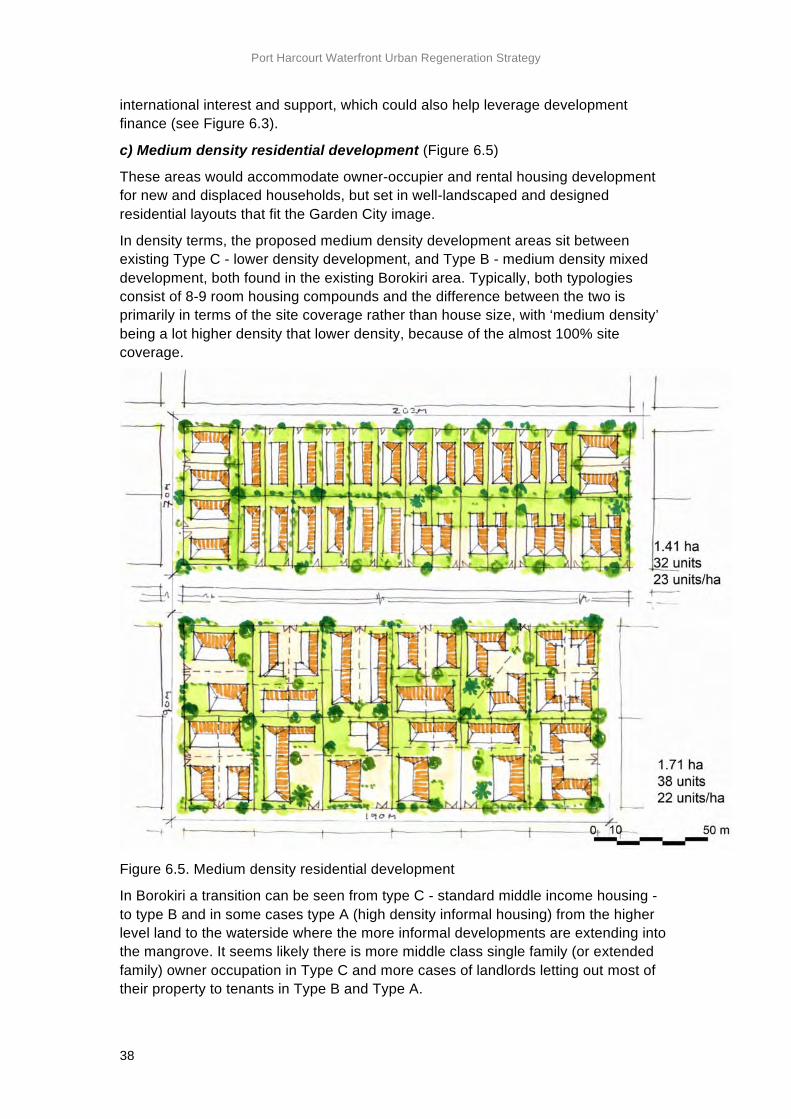
Port Harcourt Waterfront Urban Regeneration Strategy
38
international interest and support, which could also help leverage development finance (see Figure 6.3).
c) Medium density residential development (Figure 6.5)
These areas would accommodate owner-occupier and rental housing development for new and displaced households, but set in well-landscaped and designed residential layouts that fit the Garden City image.
In density terms, the proposed medium density development areas sit between existing Type C - lower density development, and Type B - medium density mixed development, both found in the existing Borokiri area. Typically, both typologies consist of 8-9 room housing compounds and the difference between the two is primarily in terms of the site coverage rather than house size, with ‘medium density’ being a lot higher density that lower density, because of the almost 100% site coverage.
Figure 6.5. Medium density residential development
In Borokiri a transition can be seen from type C - standard middle income housing - to type B and in some cases type A (high density informal housing) from the higher level land to the waterside where the more informal developments are extending into the mangrove. It seems likely there is more middle class single family (or extended family) owner occupation in Type C and more cases of landlords letting out most of their property to tenants in Type B and Type A.
Port Harcourt Waterfront Urban Regeneration Strategy
39
While, in many cases a ‘small landlord’ may occupy 3 rooms and let out 5-6, there are also 'large landlords’ who can rent out up to 40 rooms. Such large landlords are almost certainly concentrated in the high and medium density areas (Types A and B) among a larger number of owner occupiers (‘small landlords’) sub letting in these areas. In Type C area (e.g. the main part of Borokiri) there are likely to be mainly owner occupiers some of whom would be sub letting as small landlords, and others not.2
For our purposes, the proposed medium density areas will require a lower site coverage than existing type B to meet modern planning standards, but aim to achieve more houses per hectare than existing type C, through a planned layout (see Figure 6.3). At a density of 20 dwellings per hectare with an average occupancy of 25 persons per compound this gives a population density of 500 persons per hectare.
d) High density, mixed use development (Figure 6.6)
An innovative approach would be to provide high-density, low-income development in a ‘Garden City’ setting based on a range of housing typologies depending on established demand and required density. Two types of housing block from the basis of the indicative proposal for Borokiri Garden City (See Figure 6.7):
1. Walk up blocks of single aspect 1-room bedsits or studio flats for low income rental, arranged either side of a central open corridor space, with shared facilities around clusters of about 4 flats. These would be 3-5-stories high depending in density requirements at particular locations. Blocks with good street access would have non-residential uses at ground floor, while off-street housing blocks are more likely to have additional residential accommodation at ground floor to increase the overall housing density. The blocks with good street access could have open trading areas. They would have the advantage of being less vulnerable to damage should there be flooding from excessive rainfall or levee breach.
2. A higher standard lower income tenant-financed 4-storey housing block with seven habitable rooms on each floor (where the landlord lives in part of the house and rents out part). The rentable rooms in this arrangement have better ventilation, higher space standards and a high standard of amenities, with each pair of ‘bedsits’ sharing a bathroom.
These building types are appropriate to a central high-density location. Although relatively high density, they would be built at a reduced density in comparison to the existing overcrowded, high-density settlements. High density mixed use development using a mix of these types gives a density of 1400 persons per hectare at an average of 2.5 persons/room.
The tenure arrangement for the two types of high density walk up flats shown here, and similar variants, would follow the model that is being increasingly adopted in Abuja where walk up flats are sold off, on a floor by floor basis and on 99-year leases for renting or self-occupation.
2 The use of the term ‘owner-occupier’ does not imply ownership of land but ownership of a legal right to occupy.
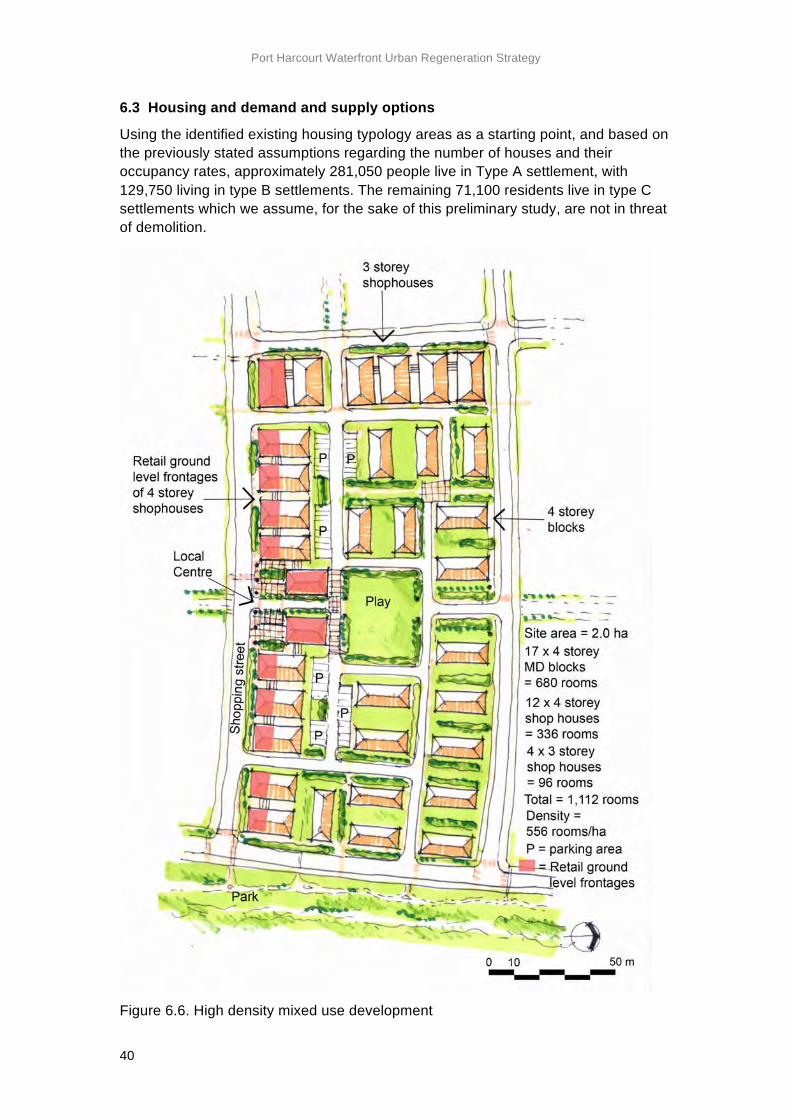
Port Harcourt Waterfront Urban Regeneration Strategy
40
6.3 Housing and demand and supply options
Using the identified existing housing typology areas as a starting point, and based on the previously stated assumptions regarding the number of houses and their occupancy rates, approximately 281,050 people live in Type A settlement, with 129,750 living in type B settlements. The remaining 71,100 residents live in type C settlements which we assume, for the sake of this preliminary study, are not in threat of demolition.
Figure 6.6. High density mixed use development
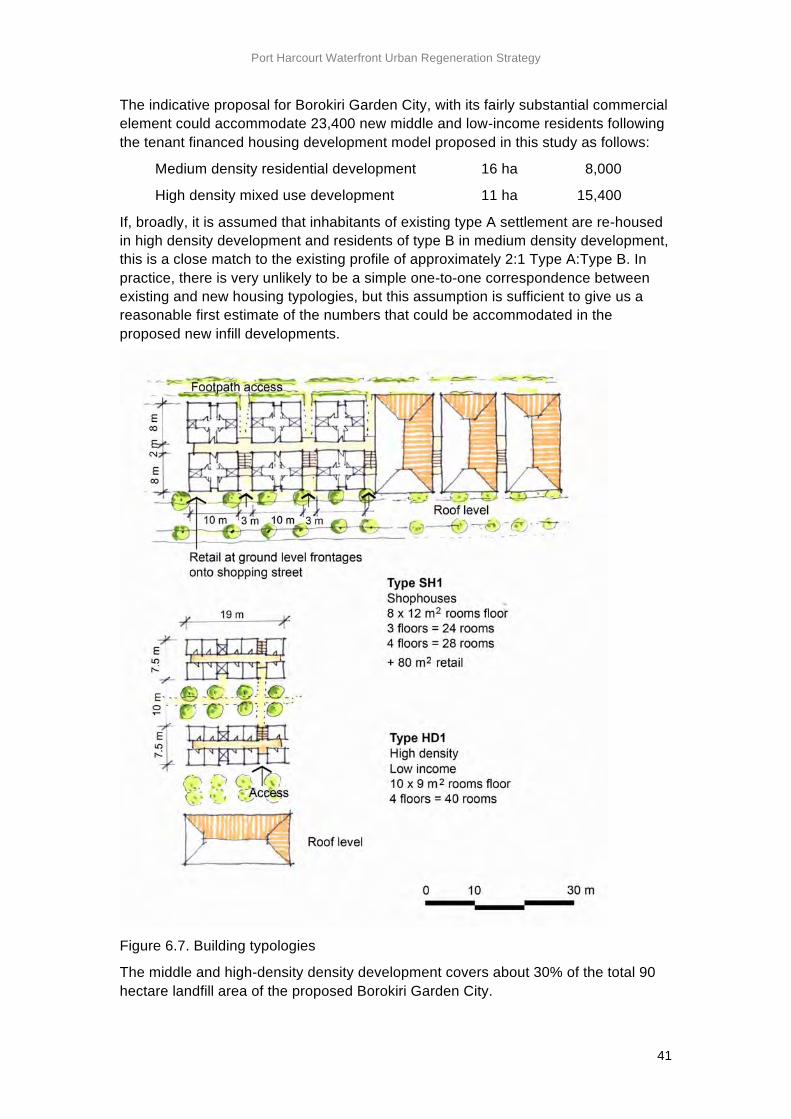
Port Harcourt Waterfront Urban Regeneration Strategy
41
The indicative proposal for Borokiri Garden City, with its fairly substantial commercial element could accommodate 23,400 new middle and low-income residents following the tenant financed housing development model proposed in this study as follows:
Medium density residential development 16 ha 8,000
High density mixed use development 11 ha 15,400
If, broadly, it is assumed that inhabitants of existing type A settlement are re-housed in high density development and residents of type B in medium density development, this is a close match to the existing profile of approximately 2:1 Type A:Type B. In practice, there is very unlikely to be a simple one-to-one correspondence between existing and new housing typologies, but this assumption is sufficient to give us a reasonable first estimate of the numbers that could be accommodated in the proposed new infill developments.
Figure 6.7. Building typologies
The middle and high-density density development covers about 30% of the total 90 hectare landfill area of the proposed Borokiri Garden City.
Port Harcourt Waterfront Urban Regeneration Strategy
42
The remaining proposed new infill development shown in Figure 6.2 covers about 270 hectares. At the same proportion of commercial:medium density:high density as Borokori, the Garden city development in the sites proposed in this study could re-settle about 94,000 people. Assuming that proportion of commercial development would be somewhat less in less prominent locations, possibly around 100,000 people could be resettled in these new locations from the Waterfront communities, if existing owners and tenants were given some degree of priority in the allocations procedure.
A phased Waterfront urban regeneration plan would consist of a rolling programme of large scale infill developments and Waterfront urban renewal projects involving, in some cases, clearance and re-housing of displaced populations in the new infill development and, in other cases, where feasible, upgrading of and improvements to existing neighbourhoods, or land sharing with new high density on-site re-settlement.
The overall aim would be self-supporting urban renewal minimising residual re-settlement in more remote locations.
In the second phase of this study we will carry out a more extensive survey to get a more accurate profile of the existing housing markets and the different niches within it so we can make a better attempt to match proposed supply to current and projected demand.
6.4 Implementing the Urban Regeneration Strategy
The vision for regenerating the Port Harcourt Waterfront set out in this preliminary report is intended to pave the way for an in-depth study setting out a long-term strategic plan for the Waterfront. This will set out a programme for a series of projects adopting one or other of the four regeneration approaches set out in Section 6.1 as applied to different site locations:
a) Commercial redevelopment of appropriately and strategically located sites with remote off-site resettlement
b) Commercial redevelopment of appropriately and strategically located sites with land sharing/on site resettlement
c) Upgrading and improvements to existing low income, informal neighbourhoods
d) Mixed development on newly reclaimed infill areas: towards a new Garden City solution
The sequence of interventions will ensure that urban extension and infill projects are completed in time to allow for the planned resettlement of those being relocated as a consequence of urban renewal of existing Waterfront neighbourhoods.
The Urban Regeneration Strategy will provide the basis for a series of action plans for the different neighbourhoods, with urban design frameworks and guidelines and site development briefs being prepared in line with the overall strategy, to guide the specific development projects in those neighbourhoods.
It is important that the development of the Waterfront areas is addressed through appropriate forms of public-private partnership, as noted in the UN-HABITAT Mission Report. New development on a large scale on substantial infill sites within a protected and attractive Garden City setting is likely to attract the interest of major developers and investors. Substantial investment in basic infrastructure, including
Port Harcourt Waterfront Urban Regeneration Strategy
43
flood defences and land reclamation would be required and this could be funded, in whole or part, through commercial development.
A Port Harcourt Urban Regeneration Partnership (PHURP) will be established to manage the implementation of the Urban Regeneration Strategy (See Figure 6.8). This is most likely to take the form of a not-for-profit company, with surplus from any financial operations being channelled back into the regeneration programme. We envisage the company being formed on a multi-stakeholder partnership basis, which would manage the whole process of Waterfront urban renewal over the whole period during which the strategic plan was being realised. RSG would take a leading role in this venture but all the key interests would be represented on the board of the regeneration company. This may include the commercial banks and agencies investing in the programme, representatives of the Waterfront communities, both owners and tenants, and/or their supporting NGOs. It would ensure a long-term buy-in to the venture by all key interests. It would follow the model of private sector investment in urban regeneration and improved low income housing being undertaken by the UN-HABITAT Slum Upgrading Facility (UN-HABITAT, 2008).
The particular roles of the Regeneration Partnership would depend on the nature of the development finance profile of the whole urban regeneration programme. In general, individual developments within the programme would be dealt with on a project-by-project basis, with separate legal agreements covering their finance and implementation. The Regeneration Partnership would have a key role in procurement, ensuring that this was carried out transparently and with regard to due process. The Partnership would also manage the overall allocation process to ensure that leases on commercially developed property were marketed by developers fairly, and in accordance with the needs of the overall urban regeneration strategy.
Each project is likely to involve the RSG operating in partnership with commercial developers according to a brief prepared by the PHURP with profits on the development shared according to a formula agreed for that particular project, and in line with the overall regeneration programme. As far as possible, development finance will be secured from commercial sources, although development bank funding may be required to cover major infrastructure investments. In this case the funding stream may be channelled through the PHURP itself.
Additionally, it may be necessary to set up a local finance facility, following the SUF model, in which case the PHURP would have a direct role in managing this. The main function of such a facility is to provide loan guarantees to facilitate access to commercial bank loans. Other possible functions include providing bridging loans or operating a grant mechanism or revolving fund to provide critical inputs to ‘kick start’ the implementation of projects. Funding for the local finance facility would come from government, development banks or other international finance facilities such as GuarantCo (GuarantCo, undated).
As previously noted, in considering re-settlement from the point of view of sustainability, our aim has been to replicate the existing low cost rental market in the new development through the ‘Tenant-Financed Housing Model’ rather than by providing the typical single-family ‘low-cost’ flat. At the same time, re-settlement should be achieved as part of a well-planned and co-ordinated programme of large scale urban development and renewal, which could offer massive economies of scale and employment opportunities.
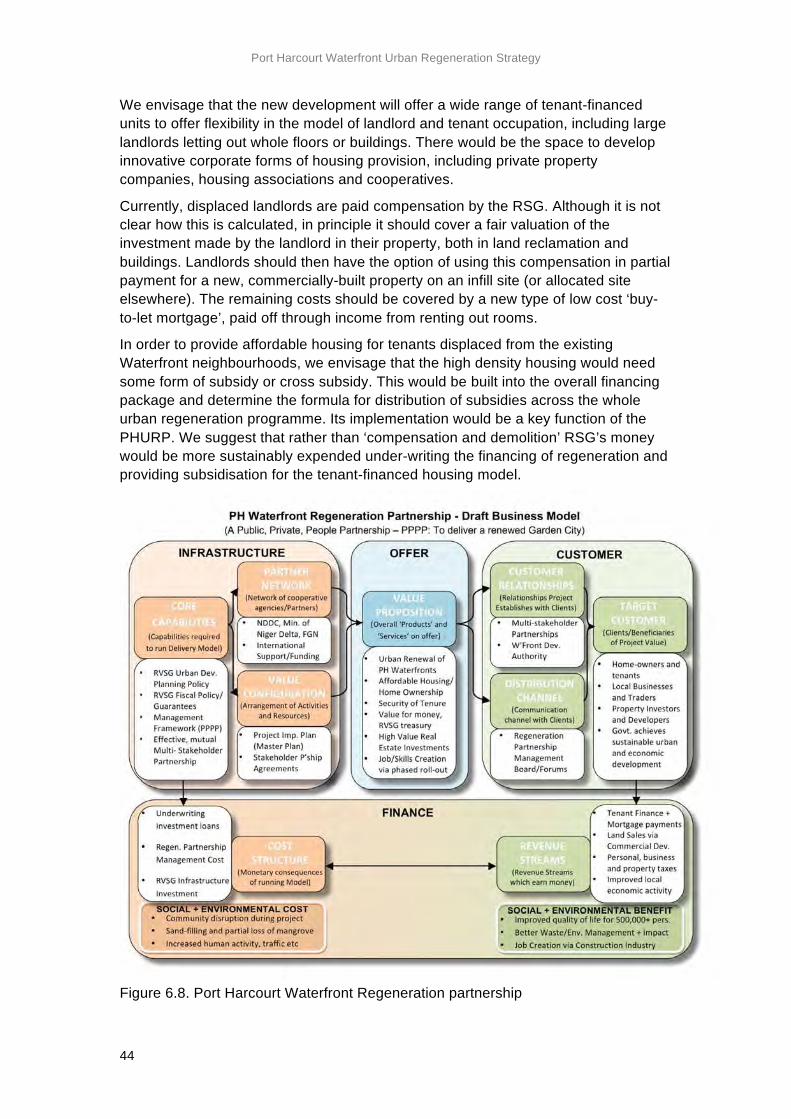
Port Harcourt Waterfront Urban Regeneration Strategy
44
We envisage that the new development will offer a wide range of tenant-financed units to offer flexibility in the model of landlord and tenant occupation, including large landlords letting out whole floors or buildings. There would be the space to develop innovative corporate forms of housing provision, including private property companies, housing associations and cooperatives.
Currently, displaced landlords are paid compensation by the RSG. Although it is not clear how this is calculated, in principle it should cover a fair valuation of the investment made by the landlord in their property, both in land reclamation and buildings. Landlords should then have the option of using this compensation in partial payment for a new, commercially-built property on an infill site (or allocated site elsewhere). The remaining costs should be covered by a new type of low cost ‘buy-to-let mortgage’, paid off through income from renting out rooms.
In order to provide affordable housing for tenants displaced from the existing Waterfront neighbourhoods, we envisage that the high density housing would need some form of subsidy or cross subsidy. This would be built into the overall financing package and determine the formula for distribution of subsidies across the whole urban regeneration programme. Its implementation would be a key function of the PHURP. We suggest that rather than ‘compensation and demolition’ RSG’s money would be more sustainably expended under-writing the financing of regeneration and providing subsidisation for the tenant-financed housing model.
Figure 6.8. Port Harcourt Waterfront Regeneration partnership
Port Harcourt Waterfront Urban Regeneration Strategy
45
The RSG/public sector share of the development would involve the provision of serviced land, although, as far as the reclaimed Waterfront areas are concerned, clearly this would be dependent on a satisfactory resolution of the issue of legal ownership rights between different levels of government, accepting that both state and federal governments are interested in a peaceful and satisfactory resolution to Port Harcourt’s Waterfront development issues.
The RSG would receive a share of the profits from its public-private partnership with commercial developers in individual development projects. The Urban Regeneration Strategy would be implemented with due regard to proper planning and land registration procedures. This would allow revenue to be collected through either a property-based local taxation system or the established system of ground rents.
Additionally, addressing climate change adaptation and city flood defence issues (as well as reducing the potential for future local conflict) would provide a good basis for obtaining development bank and international climate-change related funding to help cover the necessary and costly infrastructure works associated with the infill/reclamation proposals such as building new levees and foundations for multi-storey buildings.
The World Bank, for example, funds slum upgrading as an element of major urban environmental and infrastructure programmes more readily than it funds upgrading schemes as stand-alone projects. Port Harcourt would be an excellent test case for preparation of low-lying large urban areas for sea level rise. This could be linked with the idea of creating an international research and conference centre for the study of climate change impacts in marine wetland areas, which forms an 'anchor' development in our proposal for Borokori.
Port Harcourt Waterfront Urban Regeneration Strategy
46
References Abidin, H. (2005). ‘Suitability of leveling, GPS and INSAR for monitoring land subsidence in urban area of Indonesia’. Global Magazine for Geomatics 19 (7):12-15.
Agbroko, R. (2009) Opposition mounts against Rivers waterfront demolition, Next web publication, December 4, <http://234next.com/csp/cms/sites/Next/News/Metro/Environment/5452140-146/story.csp> [Accessed 8 December 2009].
Aprioku, M. (2005) The dilemma of urban sprawl in Port Harcourt Metropolis – A case study of waterfront areas, unpublished Thesis, Department of Geography and Environmental Management, University of Port Harcourt, Nigeria.
BNRCC (undated) Building Nigeria’s Response to Climate Change, Vulnerability, impacts and adaptation climage change in Nigeria. <www.nigeriaclimatechange.org/> [Accessed 8 December 2009].
Ebiri, K. (2009) Tears on Njemanze troubled waterfront, The MetroSection, Tuesday 01 September, p15, Port Harcourt, Nigeria.
Gibb (2009) Greater Port Harcourt City Development Plan, Government of the Rivers State, Port Harcourt.
Government of the Rivers State (2009) Greater Port Harcourt City Development Authority Bill, Rivers State House of Assembly, Government of the Rivers State, Port Harcourt.
GuarantCo (undated) Gaurantees for Development. <www.guarantco.com/> [Accessed 8 December 2009].
International Alliance of Inhabitants (2009) ‘Independent UN expert sounds alarm on mass forced evictions in Nigeria’, in Stop the killings, demolitions and evictions in Port Harcourt!, International Alliance of Inhabitants, 13 August, <http://eng.habitants.org/news/local_info/independent_un_expert_sounds_alarm_on_mass_forced_evictions_in_nigeria> [Accessed 8 December 2009].
International Alliance of Inhabitants (2009) ‘Report Bundu Waterfront Genocide’, in Stop the killings, demolitions and evictions in Port Harcourt!, International Alliance of Inhabitants, 16 October, <http://eng.habitants.org/news/inhabitants_of_africa/report_bundu_waterfront_genocide> [Accessed 8 December 2009].
SCAR (2009) SCAR publishes ‘Antarctic Climate Change and the Environment’ report, 1958 - 2008: 50 years of SCAR Science, Scientific Committee on Antarctic Research, <www.scar.org/> [Accessed 8 December 2009].
Schneider, F. (2002) Size and measures of the informal economy in 110 countries around the world. Seminar paper, Workshop of Australian National Tax Centre, ANU, Canberra, Australia, July 17, Johannes Kepler University of Linz, Linz-Auhof. <www.amnet.co.il/attachments/informal_economy110.pdf> [Accessed 14 December 2009].
UN, (undated) Millennium Development Goal Indicators: the official United Nations site for MDG Indicators, United Nations Statistics Division, UN, New York, <http://mdgs.un.org/unsd/mdg/Metadata.aspx?IndicatorId=0&SeriesId=710>
Port Harcourt Waterfront Urban Regeneration Strategy
47
[Accessed 8 December 2009].
UN-HABITAT (2008) SUF Local Finance Facilities: what they are, why they are important and how they work, working papers, UN-HABITAT, Nairobi, <www.unhabitat.org/downloads/docs/5678_42465_SUF%20local%20finance%20facilities.pdf> [Accessed 8 December 2009].
UN-HABITAT (2009) Evictions and demolitions in Port Harcourt, Report of fact-finding mission to Port Harcourt City, Federal Republic of Nigeria, 12-16 March 2009, UN-HABITAT, Nairobi. <www.stakeholderdemocracy.org/index.php?mact=News,cntnt01,print,0&cntnt01articleid=88&cntnt01showtemplate=false&cntnt01returnid=115> [Accessed 8 December 2009].
Vidal, J. (2005), ‘How the mangrove shield was lost’, The Guardian, 6 January 2005. <http://www.guardian.co.uk/print/0,3858,5096458-111414,00.html>, cited in Lloyd-Jones, T. (2006), Mind the Gap! - Post-disaster reconstruction and the transition from humanitarian relief, London: RICS Publications, ISBN 1-84219-298-1, p.24. Mangrove Action Project (undated). <http://mangroveactionproject.org/> [Accessed 8 December 2009].
Zabbey, N. (2007) Climate Change and Flooding: Fate of Riverine Communities in the Niger Delta, Paper delivered at an interactive roundtable organised by Stakeholder Democracy Network (SDN) in commemoration of World Environment Day, SDN Conference Room, Port Harcourt, Nigeria, 5th June, 2007, Centre for Environment, Human Rights and Development (CEHRD), Eleme. <www.cehrd.org/files/CLIMATE_CHANGE_AND_FLOODING.doc> [Accessed 8 December 2009].

Port Harcourt Waterfront Urban Regeneration Strategy
48
Appendix A
Stakeholder consultation and local survey The fieldwork for this study was undertaken between September and October 2009 and included the following meetings and exercises;
1. Meeting with Elders and Youths of Tomipiri-Polo Community (a.k.a. ‘Okrika Waterside’) on 16.09.09. The community comprises 7 distinct sub-communities, including; i. Wakereke Polo
ii. Amatari Polo
iii. Darrick polo
iv. Ibidoki Polo
v. Iyu Polo
vi. Ibikari Polo, and
vii. Feresika Polo.
2. Meeting with Rikese Council of Elders (an association of senior people representing the interests of Waterfront Communities), held on 17.09.09.
3. Initial meeting with Okwuzu/Afikpo Waterside Communities, held on 18.09.09.
4. Interview with Chief G.G. Peters, founder of Okwuzu Waterside Community, held on 20.09.09.
5. Household Survey of Okwuzu, Afikpo and Ojike Waterside Communities undertaken between 29.09.09 and 02.10.09.
6. Meeting with Special Adviser to Rivers State Government on Waterfront Development, Mr Theodore Georgewill, held on 02.10.09.
7. Informal discussions with Stakeholder Democracy Network (PH-based NGO), at various times during the study.
8. Meeting with Engr. Oladele Salami, of Delse Projects Ltd, on the cost and technical implications of sand-filling reclamation and shoreline protection. Held on 25.09.09.
The first contact with the communities was the open meeting at the Tomipiri-Ama Recreation Hall on Wednesday 16th September 2009, it was arranged by Rev. TPL Minakuro Aprioku (currently Director, Development Control, Ministry of Urban Development, Rivers State). The meeting was chaired by the community Chair, Chief Promise Ewo Krikenabere, with over 50 members of the community present.
The meeting began with prayers and introductions, after which MLCN explained their mission and the purpose of the fact-finding meeting, as well as their philosophy of community-led planning.
After an initial smooth start and the Community Chair recounting the history and status of the community as an indigenous Port Harcourt settlement dating back to pre-colonial times, some members became uncomfortable and persuaded others that it was not in their interests to continue.
This initial disappointment seemed to set the tone for the remainder of the study fieldwork. It was apparent that tempers were high and communities were divided and extremely perturbed by government’s plans for the waterfronts. These impressions were reinforced in subsequent meetings with Community Elders and other waterfront communities.
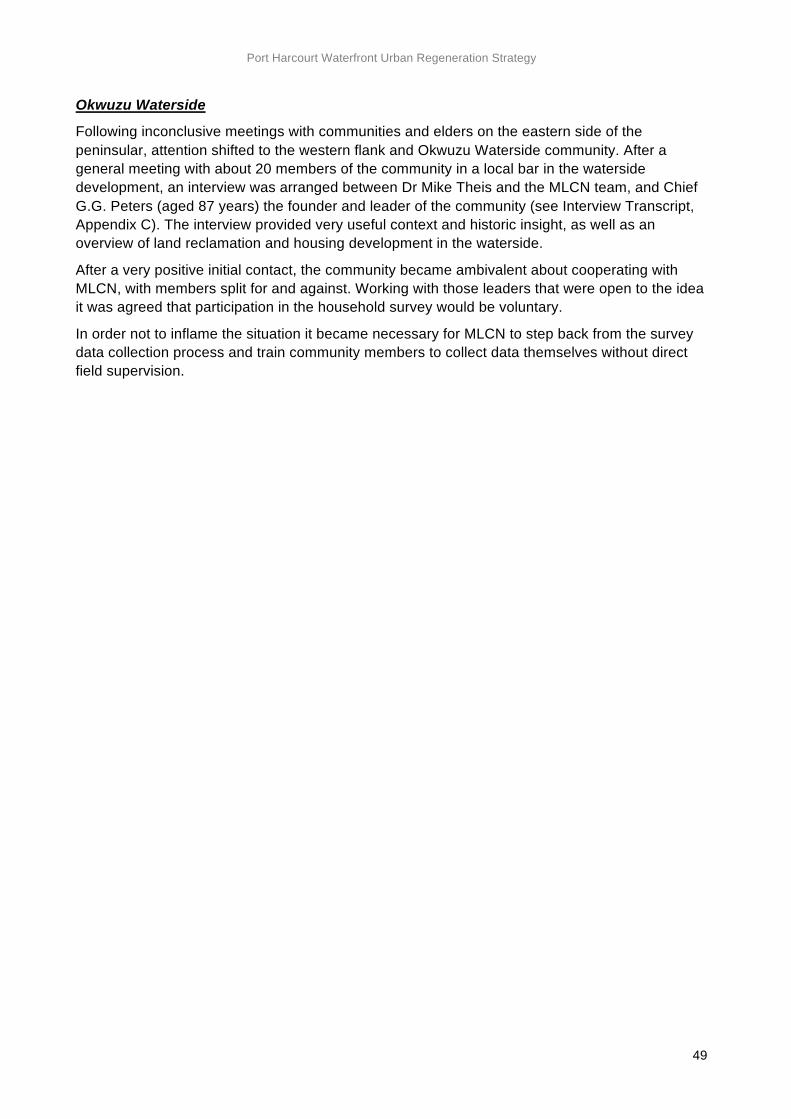
Port Harcourt Waterfront Urban Regeneration Strategy
49
Okwuzu Waterside
Following inconclusive meetings with communities and elders on the eastern side of the peninsular, attention shifted to the western flank and Okwuzu Waterside community. After a general meeting with about 20 members of the community in a local bar in the waterside development, an interview was arranged between Dr Mike Theis and the MLCN team, and Chief G.G. Peters (aged 87 years) the founder and leader of the community (see Interview Transcript, Appendix C). The interview provided very useful context and historic insight, as well as an overview of land reclamation and housing development in the waterside.
After a very positive initial contact, the community became ambivalent about cooperating with MLCN, with members split for and against. Working with those leaders that were open to the idea it was agreed that participation in the household survey would be voluntary.
In order not to inflame the situation it became necessary for MLCN to step back from the survey data collection process and train community members to collect data themselves without direct field supervision.
Port Harcourt Waterfront Urban Regeneration Strategy
50
Appendix B Household interview survey report Introduction
Household Survey Data Collection Method
1. The survey questionnaire (See pages 67 to 68) was simplified and tailored for a non-supervised (community-led) data collection method.
2. A briefing meeting was held with four key members of the Okwuzu Community on Sunday 27th September, at which the practicalities of the exercise were discussed, as well as looking over a draft of the questionnaire.
3. On Monday 28th September a training was done for the Community Supervisors (4 No.) and 250 No. Survey forms were distributed (100 No. for landlords, 150 No. for tenants).
4. Between Tuesday 29th and Friday 2nd October data collection took place, with only telephone contact with the Field Supervisors by MLCN.
5. On Saturday 3rd October 2009 completed survey sheets were returned and the Field Supervisors were de-briefed.
Household Survey Limitations
Due to the lack of direct control and field supervision by MLCN, the execution and therefore the results of the survey are somewhat restricted. However, as a ‘first stab’, scoping/preliminary analysis of a much wider and deeper waterside community, this exercise is valid as a pre-survey for the main HH Survey to be undertaken for the Main Report.
Other limiting issues arising from the data collection process include;
1. Sampling: 70 No. compounds were surveyed, chosen at random by the Community Field Supervisors, on the basis of those households willing to participate.
2. Tenants: Of the 70 No. compounds surveyed one landlord and one tenant form were completed, rather than the landlord and ALL tenants under the landlord.
3. Corrections: Due to time and practical limitations it was not possible to go back to the field after the initial collection process to check or correct errors – we only had one bite of the cherry as it were.
Address Locations: The inability of MLCN to be physically present during the collection process meant it was not possible to use satellite imagery to tie a particular form to a specific compound. We lacked the time and freedom to train community members in the use of mapping and imagery. However, it is clear that under better operating conditions community members have the capacity to be trained in community-owned data collection methods. This would make for a more user-owned and participative planning process. The questionnaire was drawn up in draft for discussion with the communities and potential interviewers. The social and political conditions in the communities were not particularly stable at this time and an opportunity for cooperation suddenly arose and volunteers were ready to interview. This opportunity was seized in spite of the fact that neither the questionnaire nor the Instructions to Interviewers had been finalised. This has led to a number of anomalies.
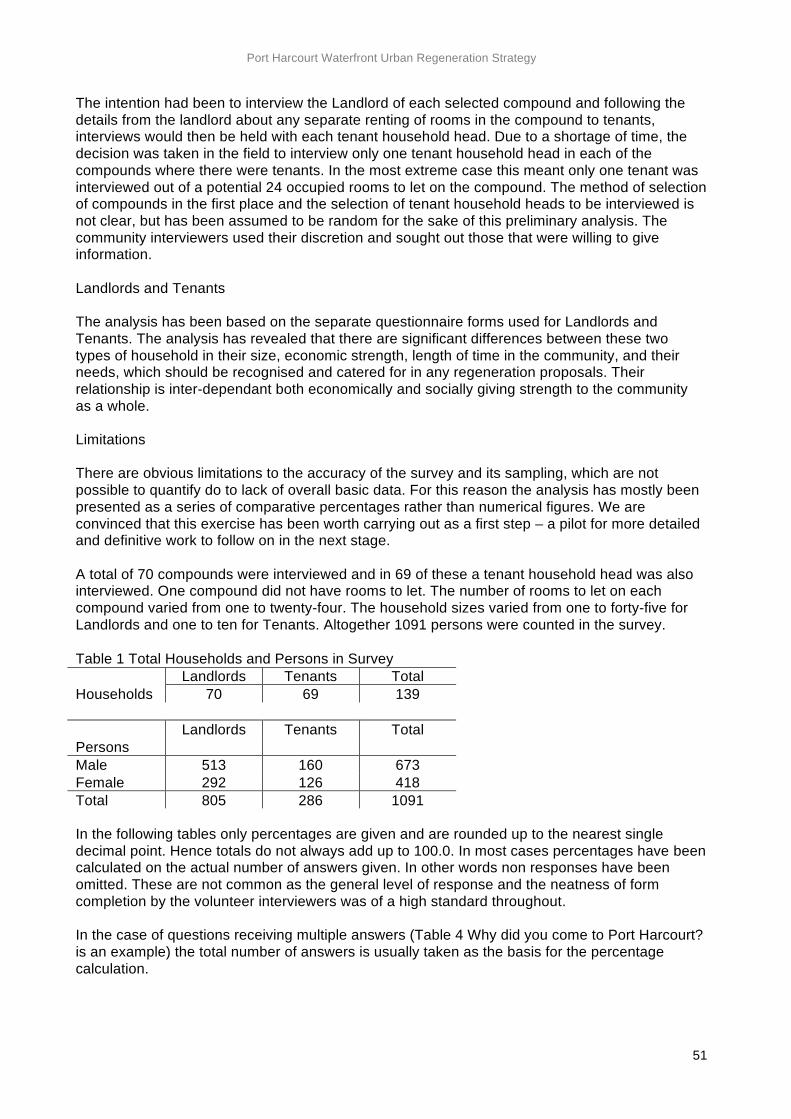
Port Harcourt Waterfront Urban Regeneration Strategy
51
The intention had been to interview the Landlord of each selected compound and following the details from the landlord about any separate renting of rooms in the compound to tenants, interviews would then be held with each tenant household head. Due to a shortage of time, the decision was taken in the field to interview only one tenant household head in each of the compounds where there were tenants. In the most extreme case this meant only one tenant was interviewed out of a potential 24 occupied rooms to let on the compound. The method of selection of compounds in the first place and the selection of tenant household heads to be interviewed is not clear, but has been assumed to be random for the sake of this preliminary analysis. The community interviewers used their discretion and sought out those that were willing to give information. Landlords and Tenants The analysis has been based on the separate questionnaire forms used for Landlords and Tenants. The analysis has revealed that there are significant differences between these two types of household in their size, economic strength, length of time in the community, and their needs, which should be recognised and catered for in any regeneration proposals. Their relationship is inter-dependant both economically and socially giving strength to the community as a whole. Limitations There are obvious limitations to the accuracy of the survey and its sampling, which are not possible to quantify do to lack of overall basic data. For this reason the analysis has mostly been presented as a series of comparative percentages rather than numerical figures. We are convinced that this exercise has been worth carrying out as a first step – a pilot for more detailed and definitive work to follow on in the next stage. A total of 70 compounds were interviewed and in 69 of these a tenant household head was also interviewed. One compound did not have rooms to let. The number of rooms to let on each compound varied from one to twenty-four. The household sizes varied from one to forty-five for Landlords and one to ten for Tenants. Altogether 1091 persons were counted in the survey. Table 1 Total Households and Persons in Survey Landlords Tenants Total Households 70 69 139 Landlords Tenants Total Persons Male 513 160 673 Female 292 126 418 Total 805 286 1091 In the following tables only percentages are given and are rounded up to the nearest single decimal point. Hence totals do not always add up to 100.0. In most cases percentages have been calculated on the actual number of answers given. In other words non responses have been omitted. These are not common as the general level of response and the neatness of form completion by the volunteer interviewers was of a high standard throughout. In the case of questions receiving multiple answers (Table 4 Why did you come to Port Harcourt? is an example) the total number of answers is usually taken as the basis for the percentage calculation.
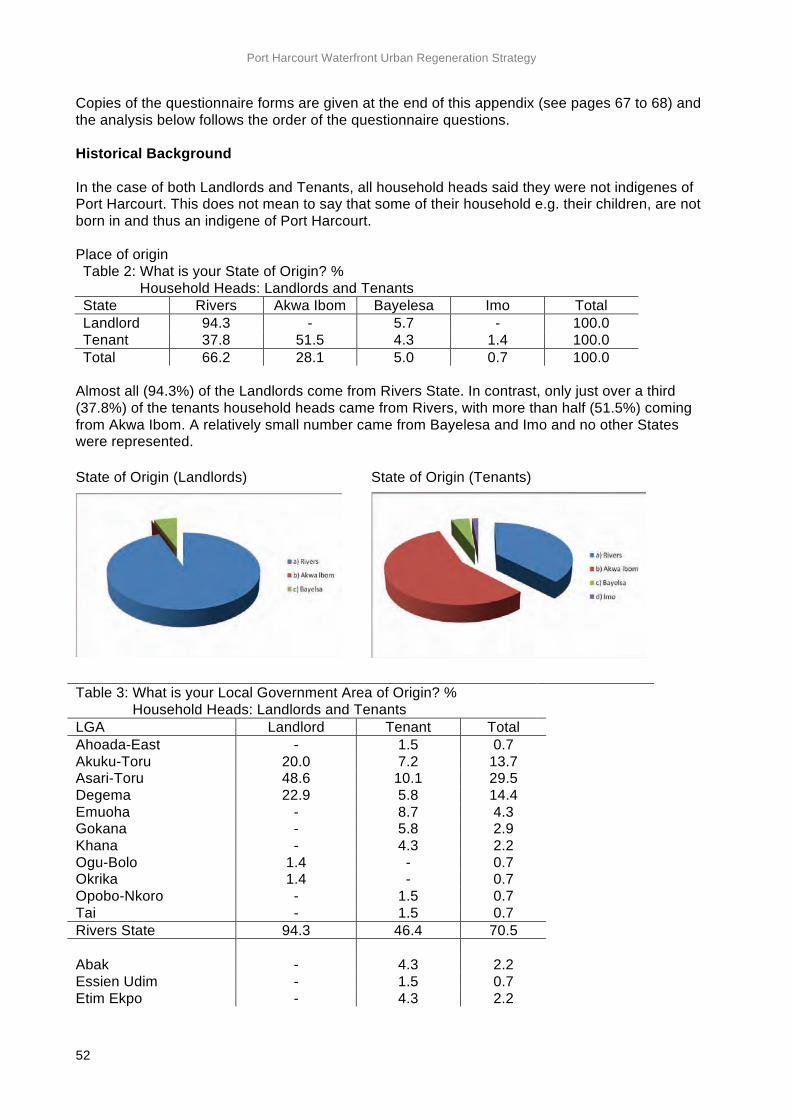
Port Harcourt Waterfront Urban Regeneration Strategy
52
Copies of the questionnaire forms are given at the end of this appendix (see pages 67 to 68) and the analysis below follows the order of the questionnaire questions. Historical Background In the case of both Landlords and Tenants, all household heads said they were not indigenes of Port Harcourt. This does not mean to say that some of their household e.g. their children, are not born in and thus an indigene of Port Harcourt. Place of origin Table 2: What is your State of Origin? % Household Heads: Landlords and Tenants State Rivers Akwa Ibom Bayelesa Imo Total Landlord 94.3 - 5.7 - 100.0 Tenant 37.8 51.5 4.3 1.4 100.0 Total 66.2 28.1 5.0 0.7 100.0
Almost all (94.3%) of the Landlords come from Rivers State. In contrast, only just over a third (37.8%) of the tenants household heads came from Rivers, with more than half (51.5%) coming from Akwa Ibom. A relatively small number came from Bayelesa and Imo and no other States were represented. State of Origin (Landlords)
State of Origin (Tenants)
Table 3: What is your Local Government Area of Origin? % Household Heads: Landlords and Tenants LGA Landlord Tenant Total Ahoada-East - 1.5 0.7 Akuku-Toru 20.0 7.2 13.7 Asari-Toru 48.6 10.1 29.5 Degema 22.9 5.8 14.4 Emuoha - 8.7 4.3 Gokana - 5.8 2.9 Khana - 4.3 2.2 Ogu-Bolo 1.4 - 0.7 Okrika 1.4 - 0.7 Opobo-Nkoro - 1.5 0.7 Tai - 1.5 0.7 Rivers State 94.3 46.4 70.5 Abak - 4.3 2.2 Essien Udim - 1.5 0.7 Etim Ekpo - 4.3 2.2
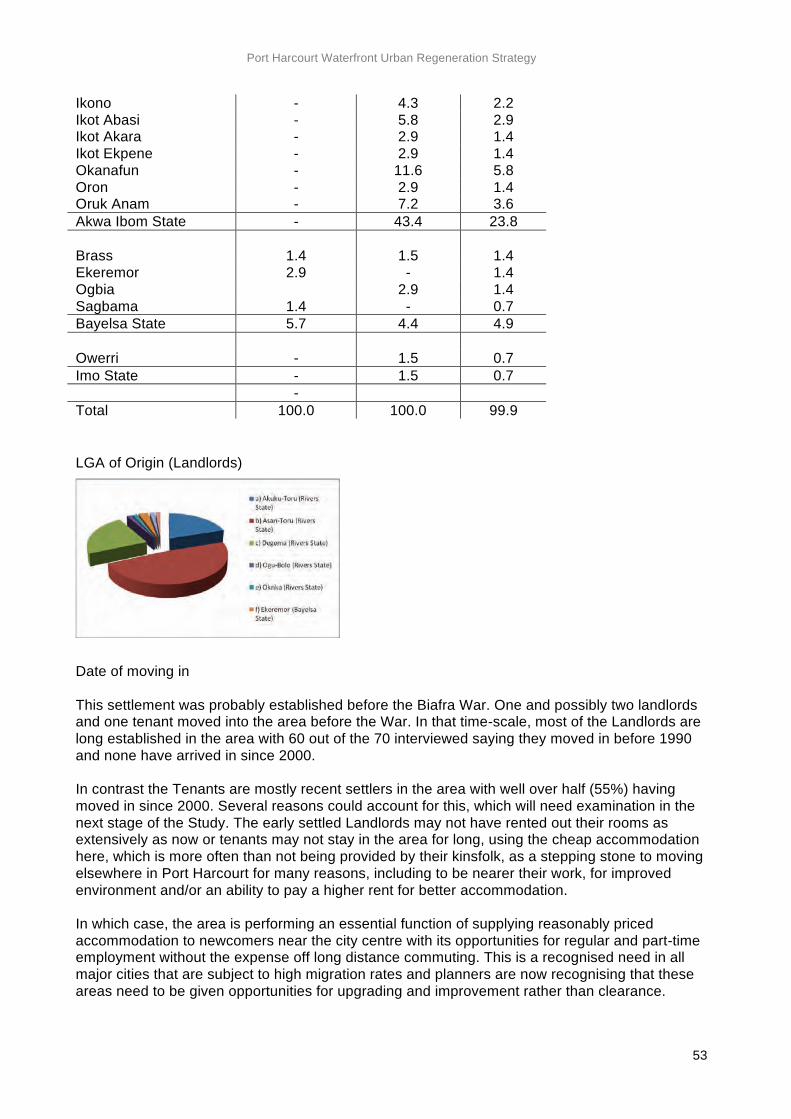
Port Harcourt Waterfront Urban Regeneration Strategy
53
Ikono - 4.3 2.2 Ikot Abasi - 5.8 2.9 Ikot Akara - 2.9 1.4 Ikot Ekpene - 2.9 1.4 Okanafun - 11.6 5.8 Oron - 2.9 1.4 Oruk Anam - 7.2 3.6 Akwa Ibom State - 43.4 23.8 Brass 1.4 1.5 1.4 Ekeremor 2.9 - 1.4 Ogbia 2.9 1.4 Sagbama 1.4 - 0.7 Bayelsa State 5.7 4.4 4.9 Owerri - 1.5 0.7 Imo State - 1.5 0.7 - Total 100.0 100.0 99.9 LGA of Origin (Landlords)
Date of moving in This settlement was probably established before the Biafra War. One and possibly two landlords and one tenant moved into the area before the War. In that time-scale, most of the Landlords are long established in the area with 60 out of the 70 interviewed saying they moved in before 1990 and none have arrived in since 2000. In contrast the Tenants are mostly recent settlers in the area with well over half (55%) having moved in since 2000. Several reasons could account for this, which will need examination in the next stage of the Study. The early settled Landlords may not have rented out their rooms as extensively as now or tenants may not stay in the area for long, using the cheap accommodation here, which is more often than not being provided by their kinsfolk, as a stepping stone to moving elsewhere in Port Harcourt for many reasons, including to be nearer their work, for improved environment and/or an ability to pay a higher rent for better accommodation. In which case, the area is performing an essential function of supplying reasonably priced accommodation to newcomers near the city centre with its opportunities for regular and part-time employment without the expense off long distance commuting. This is a recognised need in all major cities that are subject to high migration rates and planners are now recognising that these areas need to be given opportunities for upgrading and improvement rather than clearance.
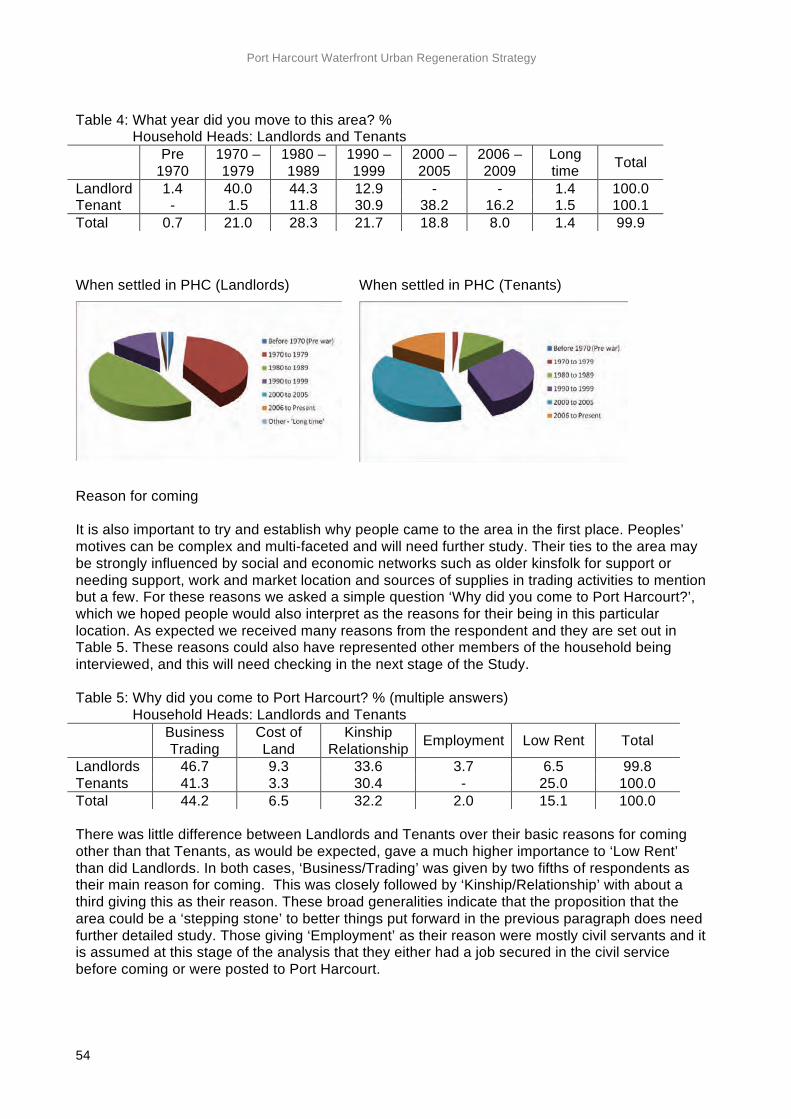
Port Harcourt Waterfront Urban Regeneration Strategy
54
Table 4: What year did you move to this area? % Household Heads: Landlords and Tenants
Pre 1970
1970 – 1979
1980 – 1989
1990 – 1999
2000 – 2005
2006 – 2009
Long time Total
Landlord 1.4 40.0 44.3 12.9 - - 1.4 100.0 Tenant - 1.5 11.8 30.9 38.2 16.2 1.5 100.1 Total 0.7 21.0 28.3 21.7 18.8 8.0 1.4 99.9
When settled in PHC (Landlords)
When settled in PHC (Tenants)
Reason for coming It is also important to try and establish why people came to the area in the first place. Peoples’ motives can be complex and multi-faceted and will need further study. Their ties to the area may be strongly influenced by social and economic networks such as older kinsfolk for support or needing support, work and market location and sources of supplies in trading activities to mention but a few. For these reasons we asked a simple question ‘Why did you come to Port Harcourt?’, which we hoped people would also interpret as the reasons for their being in this particular location. As expected we received many reasons from the respondent and they are set out in Table 5. These reasons could also have represented other members of the household being interviewed, and this will need checking in the next stage of the Study. Table 5: Why did you come to Port Harcourt? % (multiple answers) Household Heads: Landlords and Tenants
Business Trading
Cost of Land
Kinship Relationship Employment Low Rent Total
Landlords 46.7 9.3 33.6 3.7 6.5 99.8 Tenants 41.3 3.3 30.4 - 25.0 100.0 Total 44.2 6.5 32.2 2.0 15.1 100.0 There was little difference between Landlords and Tenants over their basic reasons for coming other than that Tenants, as would be expected, gave a much higher importance to ‘Low Rent’ than did Landlords. In both cases, ‘Business/Trading’ was given by two fifths of respondents as their main reason for coming. This was closely followed by ‘Kinship/Relationship’ with about a third giving this as their reason. These broad generalities indicate that the proposition that the area could be a ‘stepping stone’ to better things put forward in the previous paragraph does need further detailed study. Those giving ‘Employment’ as their reason were mostly civil servants and it is assumed at this stage of the analysis that they either had a job secured in the civil service before coming or were posted to Port Harcourt.
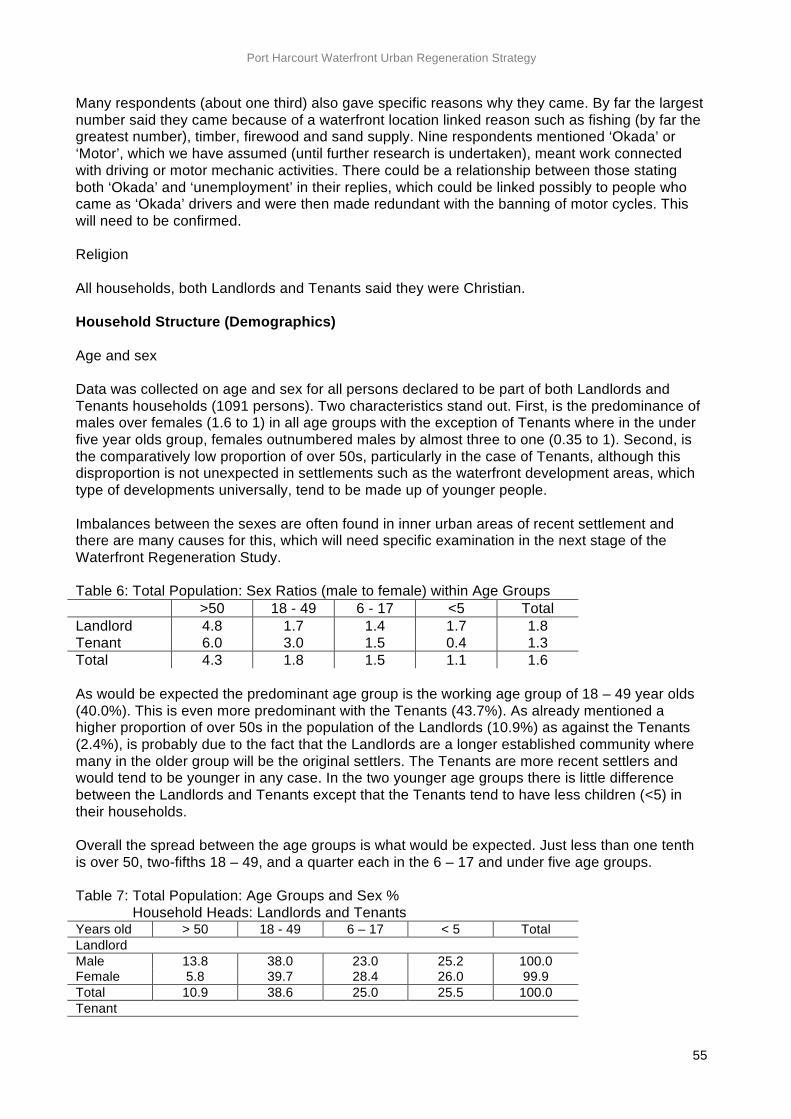
Port Harcourt Waterfront Urban Regeneration Strategy
55
Many respondents (about one third) also gave specific reasons why they came. By far the largest number said they came because of a waterfront location linked reason such as fishing (by far the greatest number), timber, firewood and sand supply. Nine respondents mentioned ‘Okada’ or ‘Motor’, which we have assumed (until further research is undertaken), meant work connected with driving or motor mechanic activities. There could be a relationship between those stating both ‘Okada’ and ‘unemployment’ in their replies, which could be linked possibly to people who came as ‘Okada’ drivers and were then made redundant with the banning of motor cycles. This will need to be confirmed. Religion All households, both Landlords and Tenants said they were Christian. Household Structure (Demographics) Age and sex Data was collected on age and sex for all persons declared to be part of both Landlords and Tenants households (1091 persons). Two characteristics stand out. First, is the predominance of males over females (1.6 to 1) in all age groups with the exception of Tenants where in the under five year olds group, females outnumbered males by almost three to one (0.35 to 1). Second, is the comparatively low proportion of over 50s, particularly in the case of Tenants, although this disproportion is not unexpected in settlements such as the waterfront development areas, which type of developments universally, tend to be made up of younger people. Imbalances between the sexes are often found in inner urban areas of recent settlement and there are many causes for this, which will need specific examination in the next stage of the Waterfront Regeneration Study. Table 6: Total Population: Sex Ratios (male to female) within Age Groups
>50 18 - 49 6 - 17 <5 Total Landlord 4.8 1.7 1.4 1.7 1.8 Tenant 6.0 3.0 1.5 0.4 1.3 Total 4.3 1.8 1.5 1.1 1.6 As would be expected the predominant age group is the working age group of 18 – 49 year olds (40.0%). This is even more predominant with the Tenants (43.7%). As already mentioned a higher proportion of over 50s in the population of the Landlords (10.9%) as against the Tenants (2.4%), is probably due to the fact that the Landlords are a longer established community where many in the older group will be the original settlers. The Tenants are more recent settlers and would tend to be younger in any case. In the two younger age groups there is little difference between the Landlords and Tenants except that the Tenants tend to have less children (<5) in their households. Overall the spread between the age groups is what would be expected. Just less than one tenth is over 50, two-fifths 18 – 49, and a quarter each in the 6 – 17 and under five age groups. Table 7: Total Population: Age Groups and Sex % Household Heads: Landlords and Tenants Years old > 50 18 - 49 6 – 17 < 5 Total Landlord Male 13.8 38.0 23.0 25.2 100.0 Female 5.8 39.7 28.4 26.0 99.9 Total 10.9 38.6 25.0 25.5 100.0 Tenant
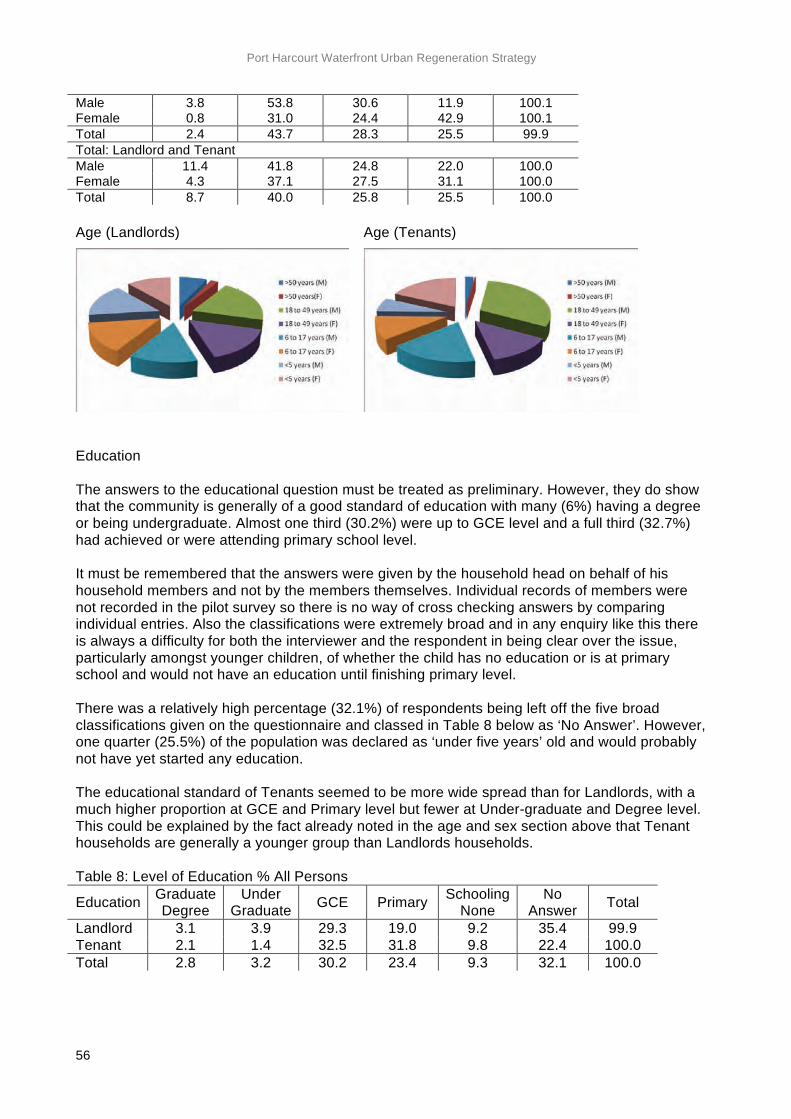
Port Harcourt Waterfront Urban Regeneration Strategy
56
Male 3.8 53.8 30.6 11.9 100.1 Female 0.8 31.0 24.4 42.9 100.1 Total 2.4 43.7 28.3 25.5 99.9 Total: Landlord and Tenant Male 11.4 41.8 24.8 22.0 100.0 Female 4.3 37.1 27.5 31.1 100.0 Total 8.7 40.0 25.8 25.5 100.0 Age (Landlords)
Age (Tenants)
Education The answers to the educational question must be treated as preliminary. However, they do show that the community is generally of a good standard of education with many (6%) having a degree or being undergraduate. Almost one third (30.2%) were up to GCE level and a full third (32.7%) had achieved or were attending primary school level. It must be remembered that the answers were given by the household head on behalf of his household members and not by the members themselves. Individual records of members were not recorded in the pilot survey so there is no way of cross checking answers by comparing individual entries. Also the classifications were extremely broad and in any enquiry like this there is always a difficulty for both the interviewer and the respondent in being clear over the issue, particularly amongst younger children, of whether the child has no education or is at primary school and would not have an education until finishing primary level. There was a relatively high percentage (32.1%) of respondents being left off the five broad classifications given on the questionnaire and classed in Table 8 below as ‘No Answer’. However, one quarter (25.5%) of the population was declared as ‘under five years’ old and would probably not have yet started any education. The educational standard of Tenants seemed to be more wide spread than for Landlords, with a much higher proportion at GCE and Primary level but fewer at Under-graduate and Degree level. This could be explained by the fact already noted in the age and sex section above that Tenant households are generally a younger group than Landlords households. Table 8: Level of Education % All Persons
Education Graduate Degree
Under Graduate GCE Primary Schooling
None No
Answer Total
Landlord 3.1 3.9 29.3 19.0 9.2 35.4 99.9 Tenant 2.1 1.4 32.5 31.8 9.8 22.4 100.0 Total 2.8 3.2 30.2 23.4 9.3 32.1 100.0
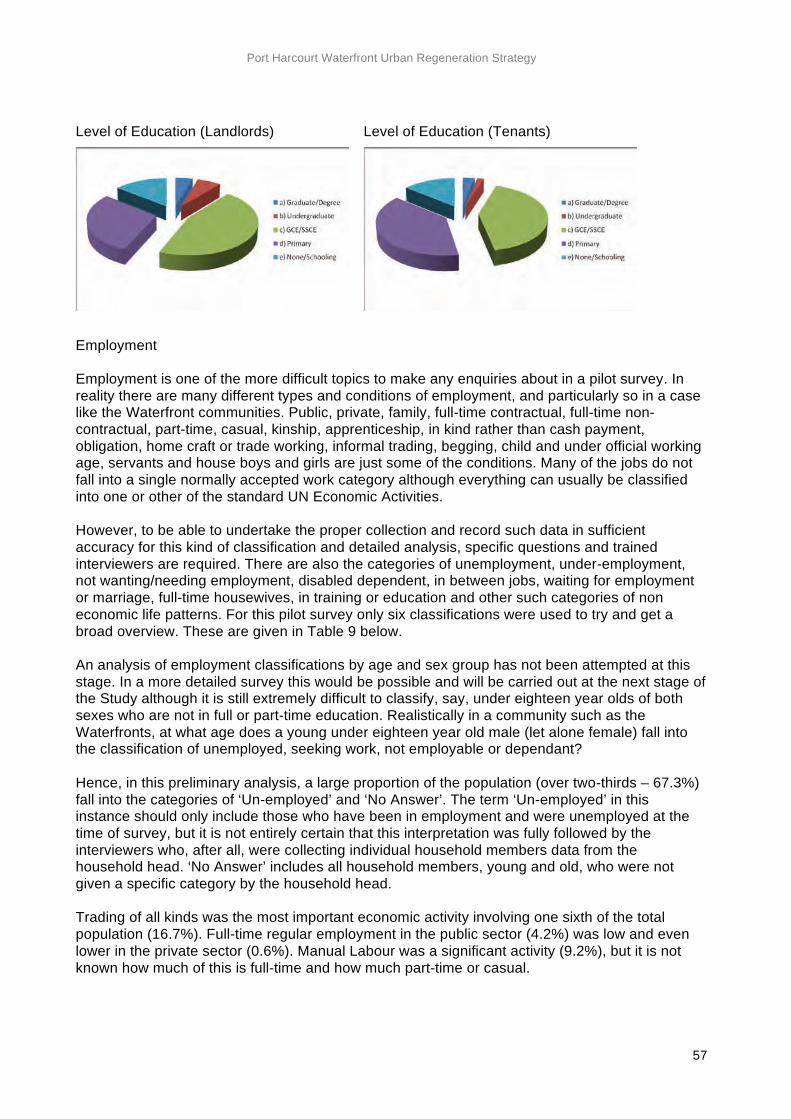
Port Harcourt Waterfront Urban Regeneration Strategy
57
Level of Education (Landlords)
Level of Education (Tenants)
Employment Employment is one of the more difficult topics to make any enquiries about in a pilot survey. In reality there are many different types and conditions of employment, and particularly so in a case like the Waterfront communities. Public, private, family, full-time contractual, full-time non-contractual, part-time, casual, kinship, apprenticeship, in kind rather than cash payment, obligation, home craft or trade working, informal trading, begging, child and under official working age, servants and house boys and girls are just some of the conditions. Many of the jobs do not fall into a single normally accepted work category although everything can usually be classified into one or other of the standard UN Economic Activities. However, to be able to undertake the proper collection and record such data in sufficient accuracy for this kind of classification and detailed analysis, specific questions and trained interviewers are required. There are also the categories of unemployment, under-employment, not wanting/needing employment, disabled dependent, in between jobs, waiting for employment or marriage, full-time housewives, in training or education and other such categories of non economic life patterns. For this pilot survey only six classifications were used to try and get a broad overview. These are given in Table 9 below. An analysis of employment classifications by age and sex group has not been attempted at this stage. In a more detailed survey this would be possible and will be carried out at the next stage of the Study although it is still extremely difficult to classify, say, under eighteen year olds of both sexes who are not in full or part-time education. Realistically in a community such as the Waterfronts, at what age does a young under eighteen year old male (let alone female) fall into the classification of unemployed, seeking work, not employable or dependant? Hence, in this preliminary analysis, a large proportion of the population (over two-thirds – 67.3%) fall into the categories of ‘Un-employed’ and ‘No Answer’. The term ‘Un-employed’ in this instance should only include those who have been in employment and were unemployed at the time of survey, but it is not entirely certain that this interpretation was fully followed by the interviewers who, after all, were collecting individual household members data from the household head. ‘No Answer’ includes all household members, young and old, who were not given a specific category by the household head. Trading of all kinds was the most important economic activity involving one sixth of the total population (16.7%). Full-time regular employment in the public sector (4.2%) was low and even lower in the private sector (0.6%). Manual Labour was a significant activity (9.2%), but it is not known how much of this is full-time and how much part-time or casual.
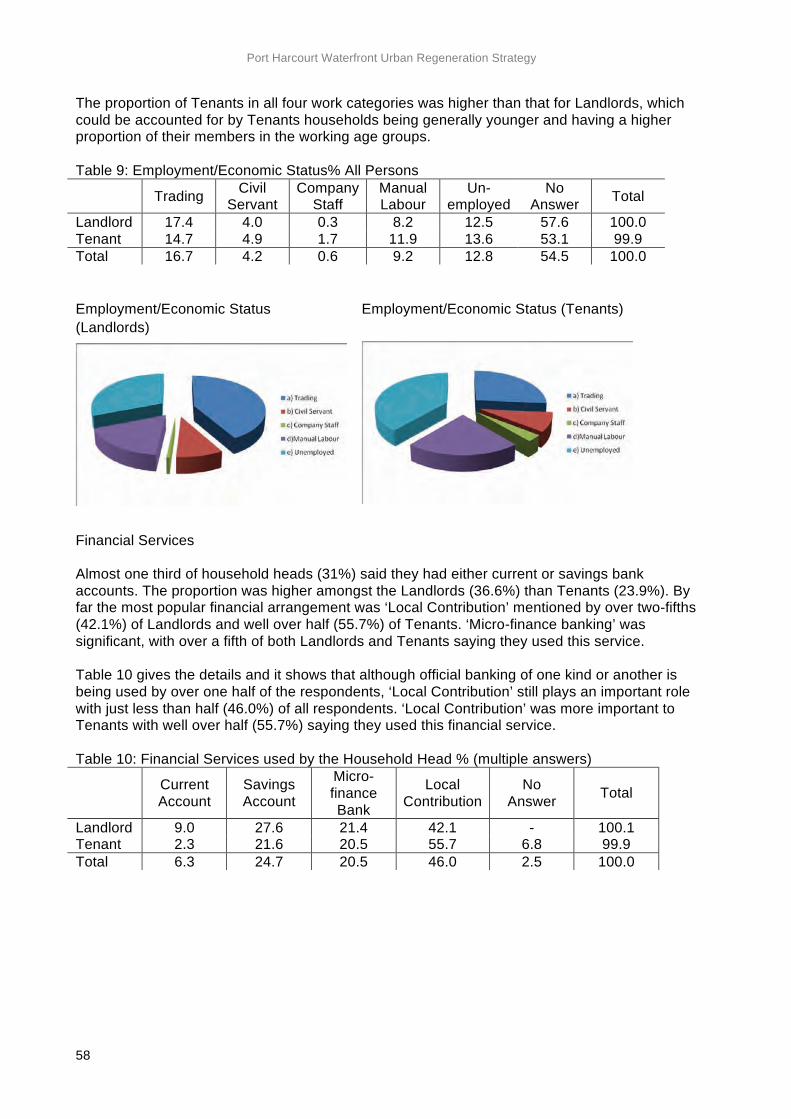
Port Harcourt Waterfront Urban Regeneration Strategy
58
The proportion of Tenants in all four work categories was higher than that for Landlords, which could be accounted for by Tenants households being generally younger and having a higher proportion of their members in the working age groups. Table 9: Employment/Economic Status% All Persons
Trading Civil Servant
Company Staff
Manual Labour
Un-employed
No Answer Total
Landlord 17.4 4.0 0.3 8.2 12.5 57.6 100.0 Tenant 14.7 4.9 1.7 11.9 13.6 53.1 99.9 Total 16.7 4.2 0.6 9.2 12.8 54.5 100.0
Employment/Economic Status (Tenants) Employment/Economic Status (Landlords)
Financial Services Almost one third of household heads (31%) said they had either current or savings bank accounts. The proportion was higher amongst the Landlords (36.6%) than Tenants (23.9%). By far the most popular financial arrangement was ‘Local Contribution’ mentioned by over two-fifths (42.1%) of Landlords and well over half (55.7%) of Tenants. ‘Micro-finance banking’ was significant, with over a fifth of both Landlords and Tenants saying they used this service. Table 10 gives the details and it shows that although official banking of one kind or another is being used by over one half of the respondents, ‘Local Contribution’ still plays an important role with just less than half (46.0%) of all respondents. ‘Local Contribution’ was more important to Tenants with well over half (55.7%) saying they used this financial service. Table 10: Financial Services used by the Household Head % (multiple answers)
Current Account
Savings Account
Micro-finance Bank
Local Contribution
No Answer Total
Landlord 9.0 27.6 21.4 42.1 - 100.1 Tenant 2.3 21.6 20.5 55.7 6.8 99.9 Total 6.3 24.7 20.5 46.0 2.5 100.0
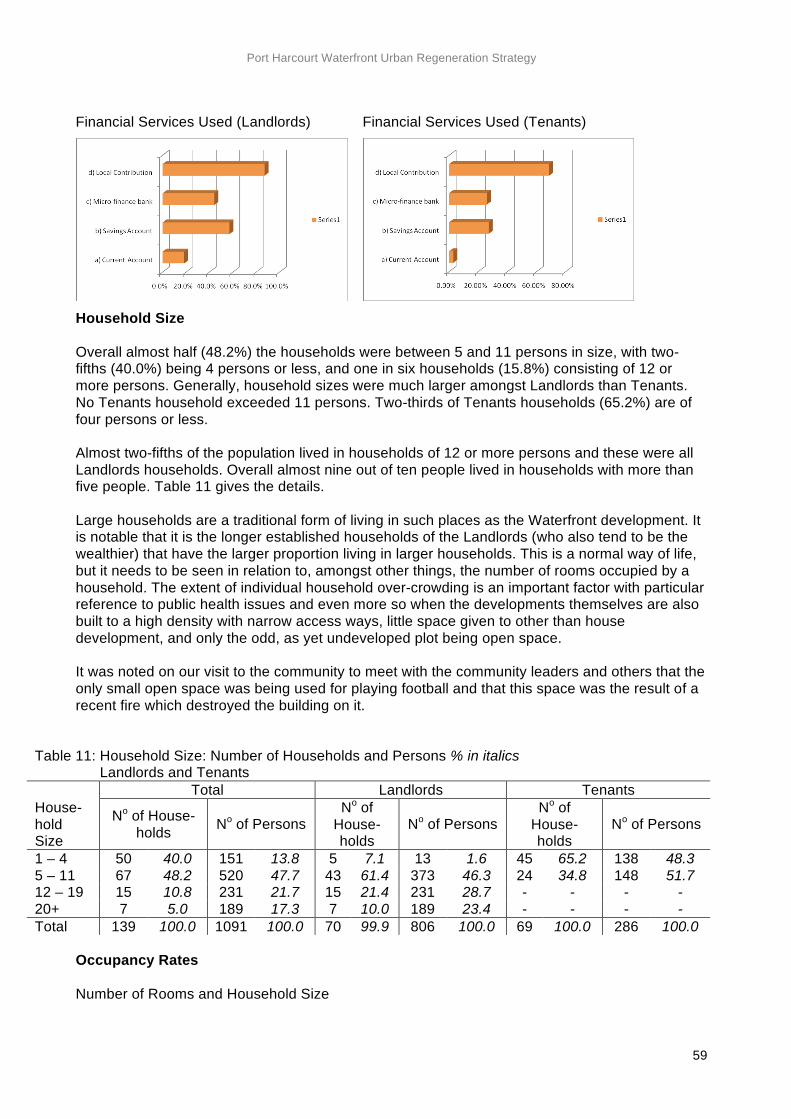
Port Harcourt Waterfront Urban Regeneration Strategy
59
Financial Services Used (Landlords)
Financial Services Used (Tenants)
Household Size Overall almost half (48.2%) the households were between 5 and 11 persons in size, with two-fifths (40.0%) being 4 persons or less, and one in six households (15.8%) consisting of 12 or more persons. Generally, household sizes were much larger amongst Landlords than Tenants. No Tenants household exceeded 11 persons. Two-thirds of Tenants households (65.2%) are of four persons or less. Almost two-fifths of the population lived in households of 12 or more persons and these were all Landlords households. Overall almost nine out of ten people lived in households with more than five people. Table 11 gives the details. Large households are a traditional form of living in such places as the Waterfront development. It is notable that it is the longer established households of the Landlords (who also tend to be the wealthier) that have the larger proportion living in larger households. This is a normal way of life, but it needs to be seen in relation to, amongst other things, the number of rooms occupied by a household. The extent of individual household over-crowding is an important factor with particular reference to public health issues and even more so when the developments themselves are also built to a high density with narrow access ways, little space given to other than house development, and only the odd, as yet undeveloped plot being open space. It was noted on our visit to the community to meet with the community leaders and others that the only small open space was being used for playing football and that this space was the result of a recent fire which destroyed the building on it.
Table 11: Household Size: Number of Households and Persons % in italics Landlords and Tenants Total Landlords Tenants House-hold Size
No of House-holds No of Persons
No of House-holds
No of Persons No of
House-holds
No of Persons
1 – 4 50 40.0 151 13.8 5 7.1 13 1.6 45 65.2 138 48.3 5 – 11 67 48.2 520 47.7 43 61.4 373 46.3 24 34.8 148 51.7 12 – 19 15 10.8 231 21.7 15 21.4 231 28.7 - - - - 20+ 7 5.0 189 17.3 7 10.0 189 23.4 - - - - Total 139 100.0 1091 100.0 70 99.9 806 100.0 69 100.0 286 100.0
Occupancy Rates Number of Rooms and Household Size
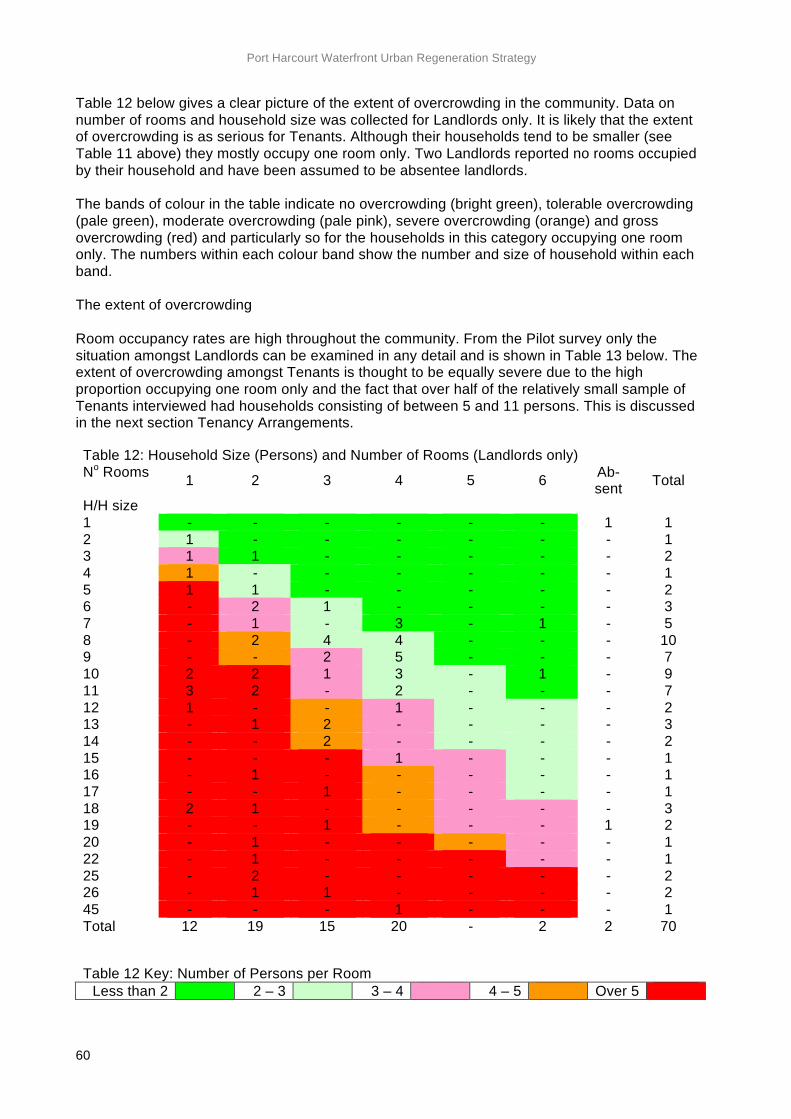
Port Harcourt Waterfront Urban Regeneration Strategy
60
Table 12 below gives a clear picture of the extent of overcrowding in the community. Data on number of rooms and household size was collected for Landlords only. It is likely that the extent of overcrowding is as serious for Tenants. Although their households tend to be smaller (see Table 11 above) they mostly occupy one room only. Two Landlords reported no rooms occupied by their household and have been assumed to be absentee landlords. The bands of colour in the table indicate no overcrowding (bright green), tolerable overcrowding (pale green), moderate overcrowding (pale pink), severe overcrowding (orange) and gross overcrowding (red) and particularly so for the households in this category occupying one room only. The numbers within each colour band show the number and size of household within each band. The extent of overcrowding Room occupancy rates are high throughout the community. From the Pilot survey only the situation amongst Landlords can be examined in any detail and is shown in Table 13 below. The extent of overcrowding amongst Tenants is thought to be equally severe due to the high proportion occupying one room only and the fact that over half of the relatively small sample of Tenants interviewed had households consisting of between 5 and 11 persons. This is discussed in the next section Tenancy Arrangements.
Table 12: Household Size (Persons) and Number of Rooms (Landlords only) No Rooms 1 2 3 4 5 6 Ab-
sent Total
H/H size 1 - - - - - - 1 1 2 1 - - - - - - 1 3 1 1 - - - - - 2 4 1 - - - - - - 1 5 1 1 - - - - - 2 6 - 2 1 - - - - 3 7 - 1 - 3 - 1 - 5 8 - 2 4 4 - - - 10 9 - - 2 5 - - - 7 10 2 2 1 3 - 1 - 9 11 3 2 - 2 - - - 7 12 1 - - 1 - - - 2 13 - 1 2 - - - - 3 14 - - 2 - - - - 2 15 - - - 1 - - - 1 16 - 1 - - - - - 1 17 - - 1 - - - - 1 18 2 1 - - - - - 3 19 - - 1 - - - 1 2 20 - 1 - - - - - 1 22 - 1 - - - - - 1 25 - 2 - - - - - 2 26 - 1 1 - - - - 2 45 - - - 1 - - - 1 Total 12 19 15 20 - 2 2 70
Table 12 Key: Number of Persons per Room Less than 2 2 – 3 3 – 4 4 – 5 Over 5
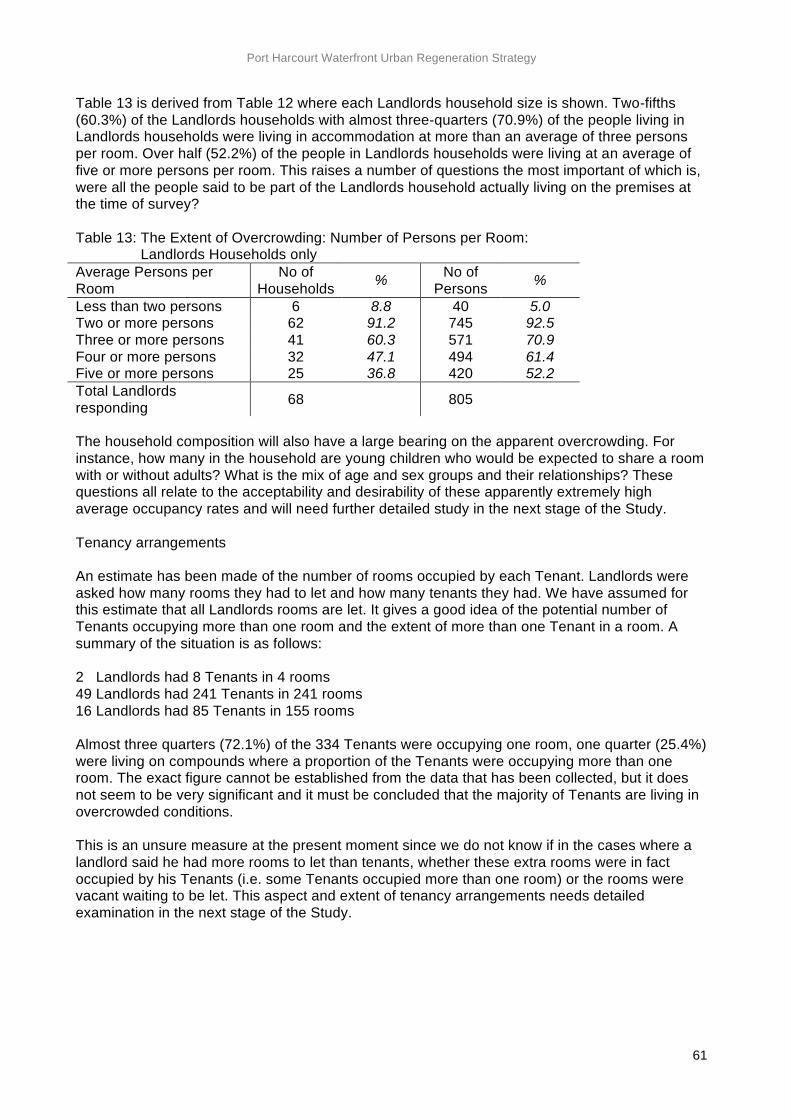
Port Harcourt Waterfront Urban Regeneration Strategy
61
Table 13 is derived from Table 12 where each Landlords household size is shown. Two-fifths (60.3%) of the Landlords households with almost three-quarters (70.9%) of the people living in Landlords households were living in accommodation at more than an average of three persons per room. Over half (52.2%) of the people in Landlords households were living at an average of five or more persons per room. This raises a number of questions the most important of which is, were all the people said to be part of the Landlords household actually living on the premises at the time of survey? Table 13: The Extent of Overcrowding: Number of Persons per Room: Landlords Households only Average Persons per Room
No of Households % No of
Persons %
Less than two persons 6 8.8 40 5.0 Two or more persons 62 91.2 745 92.5 Three or more persons 41 60.3 571 70.9 Four or more persons 32 47.1 494 61.4 Five or more persons 25 36.8 420 52.2 Total Landlords responding 68 805
The household composition will also have a large bearing on the apparent overcrowding. For instance, how many in the household are young children who would be expected to share a room with or without adults? What is the mix of age and sex groups and their relationships? These questions all relate to the acceptability and desirability of these apparently extremely high average occupancy rates and will need further detailed study in the next stage of the Study. Tenancy arrangements An estimate has been made of the number of rooms occupied by each Tenant. Landlords were asked how many rooms they had to let and how many tenants they had. We have assumed for this estimate that all Landlords rooms are let. It gives a good idea of the potential number of Tenants occupying more than one room and the extent of more than one Tenant in a room. A summary of the situation is as follows: 2 Landlords had 8 Tenants in 4 rooms 49 Landlords had 241 Tenants in 241 rooms 16 Landlords had 85 Tenants in 155 rooms Almost three quarters (72.1%) of the 334 Tenants were occupying one room, one quarter (25.4%) were living on compounds where a proportion of the Tenants were occupying more than one room. The exact figure cannot be established from the data that has been collected, but it does not seem to be very significant and it must be concluded that the majority of Tenants are living in overcrowded conditions. This is an unsure measure at the present moment since we do not know if in the cases where a landlord said he had more rooms to let than tenants, whether these extra rooms were in fact occupied by his Tenants (i.e. some Tenants occupied more than one room) or the rooms were vacant waiting to be let. This aspect and extent of tenancy arrangements needs detailed examination in the next stage of the Study.
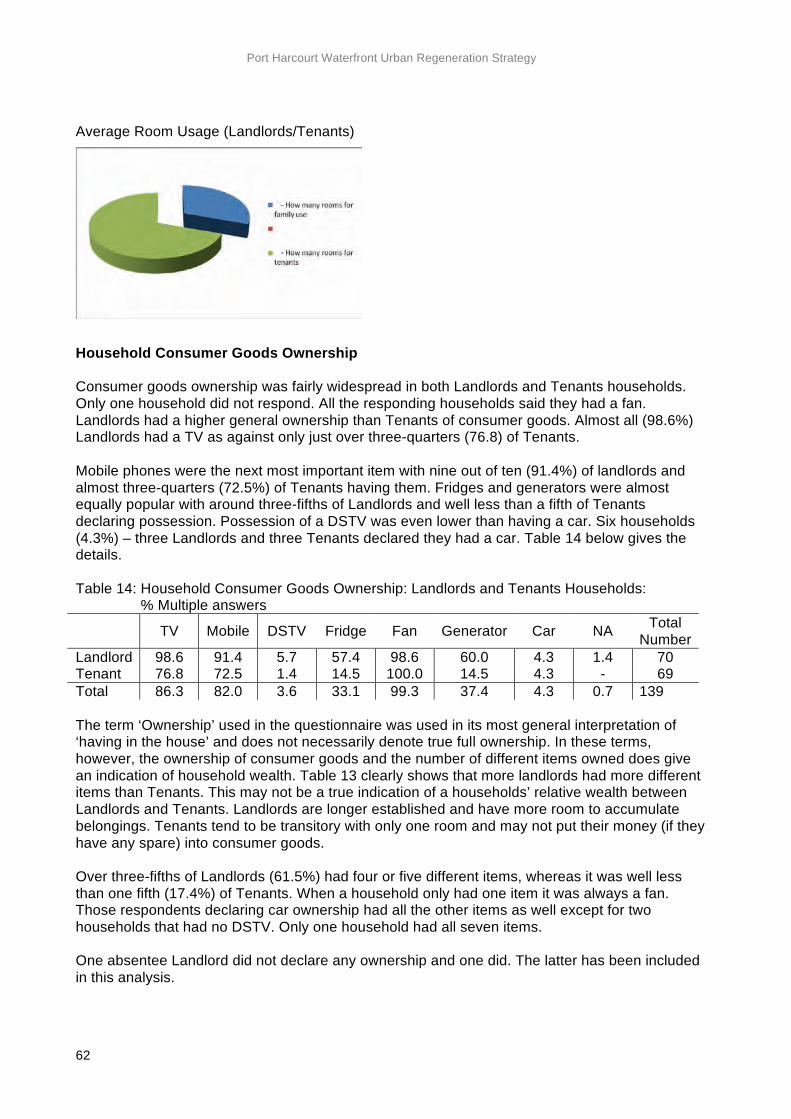
Port Harcourt Waterfront Urban Regeneration Strategy
62
Average Room Usage (Landlords/Tenants)
Household Consumer Goods Ownership Consumer goods ownership was fairly widespread in both Landlords and Tenants households. Only one household did not respond. All the responding households said they had a fan. Landlords had a higher general ownership than Tenants of consumer goods. Almost all (98.6%) Landlords had a TV as against only just over three-quarters (76.8) of Tenants. Mobile phones were the next most important item with nine out of ten (91.4%) of landlords and almost three-quarters (72.5%) of Tenants having them. Fridges and generators were almost equally popular with around three-fifths of Landlords and well less than a fifth of Tenants declaring possession. Possession of a DSTV was even lower than having a car. Six households (4.3%) – three Landlords and three Tenants declared they had a car. Table 14 below gives the details. Table 14: Household Consumer Goods Ownership: Landlords and Tenants Households: % Multiple answers TV Mobile DSTV Fridge Fan Generator Car NA Total
Number Landlord 98.6 91.4 5.7 57.4 98.6 60.0 4.3 1.4 70 Tenant 76.8 72.5 1.4 14.5 100.0 14.5 4.3 - 69 Total 86.3 82.0 3.6 33.1 99.3 37.4 4.3 0.7 139 The term ‘Ownership’ used in the questionnaire was used in its most general interpretation of ‘having in the house’ and does not necessarily denote true full ownership. In these terms, however, the ownership of consumer goods and the number of different items owned does give an indication of household wealth. Table 13 clearly shows that more landlords had more different items than Tenants. This may not be a true indication of a households’ relative wealth between Landlords and Tenants. Landlords are longer established and have more room to accumulate belongings. Tenants tend to be transitory with only one room and may not put their money (if they have any spare) into consumer goods. Over three-fifths of Landlords (61.5%) had four or five different items, whereas it was well less than one fifth (17.4%) of Tenants. When a household only had one item it was always a fan. Those respondents declaring car ownership had all the other items as well except for two households that had no DSTV. Only one household had all seven items. One absentee Landlord did not declare any ownership and one did. The latter has been included in this analysis.
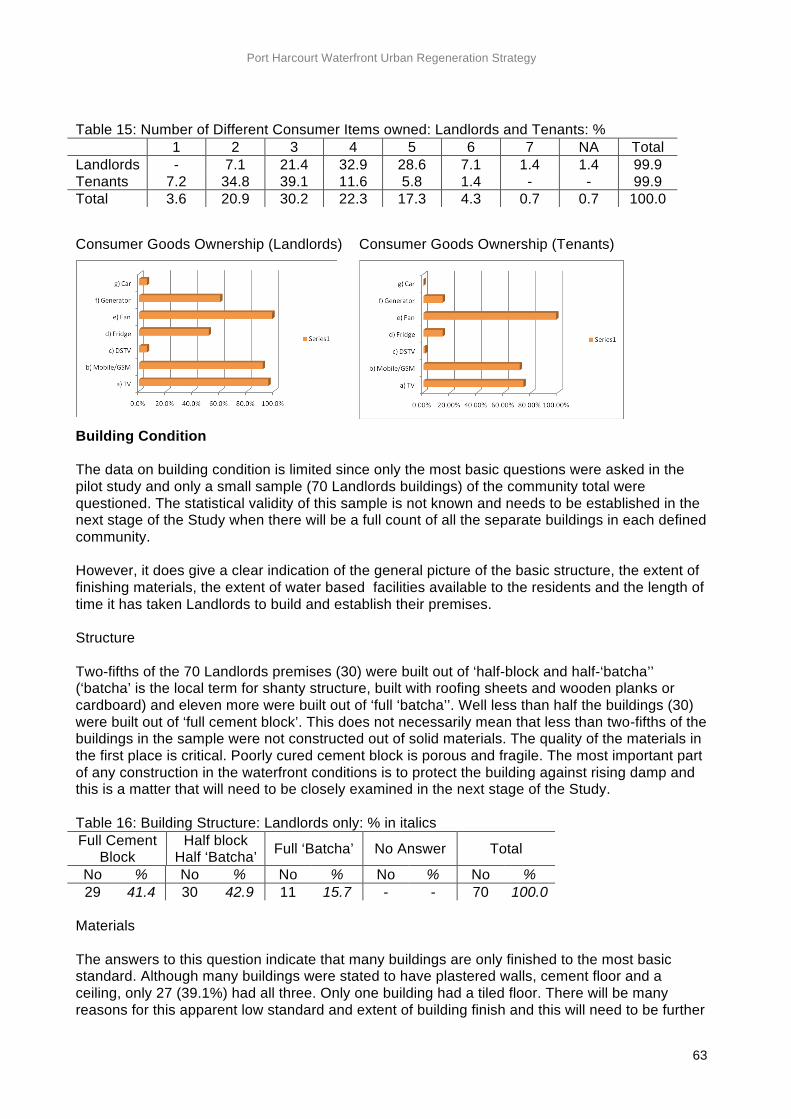
Port Harcourt Waterfront Urban Regeneration Strategy
63
Table 15: Number of Different Consumer Items owned: Landlords and Tenants: % 1 2 3 4 5 6 7 NA Total Landlords - 7.1 21.4 32.9 28.6 7.1 1.4 1.4 99.9 Tenants 7.2 34.8 39.1 11.6 5.8 1.4 - - 99.9 Total 3.6 20.9 30.2 22.3 17.3 4.3 0.7 0.7 100.0
Consumer Goods Ownership (Landlords)
Consumer Goods Ownership (Tenants)
Building Condition The data on building condition is limited since only the most basic questions were asked in the pilot study and only a small sample (70 Landlords buildings) of the community total were questioned. The statistical validity of this sample is not known and needs to be established in the next stage of the Study when there will be a full count of all the separate buildings in each defined community. However, it does give a clear indication of the general picture of the basic structure, the extent of finishing materials, the extent of water based facilities available to the residents and the length of time it has taken Landlords to build and establish their premises. Structure Two-fifths of the 70 Landlords premises (30) were built out of ‘half-block and half-‘batcha’’ (‘batcha’ is the local term for shanty structure, built with roofing sheets and wooden planks or cardboard) and eleven more were built out of ‘full ‘batcha’’. Well less than half the buildings (30) were built out of ‘full cement block’. This does not necessarily mean that less than two-fifths of the buildings in the sample were not constructed out of solid materials. The quality of the materials in the first place is critical. Poorly cured cement block is porous and fragile. The most important part of any construction in the waterfront conditions is to protect the building against rising damp and this is a matter that will need to be closely examined in the next stage of the Study. Table 16: Building Structure: Landlords only: % in italics Full Cement
Block Half block
Half ‘Batcha’ Full ‘Batcha’ No Answer Total
No % No % No % No % No % 29 41.4 30 42.9 11 15.7 - - 70 100.0
Materials The answers to this question indicate that many buildings are only finished to the most basic standard. Although many buildings were stated to have plastered walls, cement floor and a ceiling, only 27 (39.1%) had all three. Only one building had a tiled floor. There will be many reasons for this apparent low standard and extent of building finish and this will need to be further
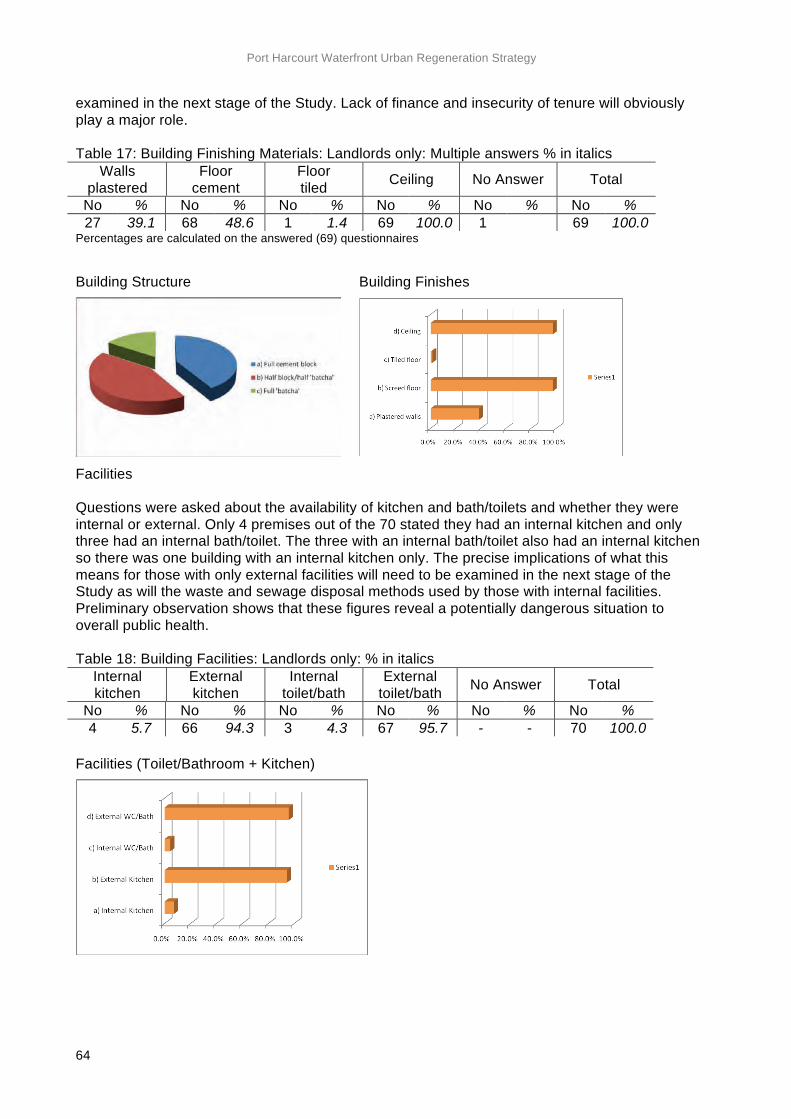
Port Harcourt Waterfront Urban Regeneration Strategy
64
examined in the next stage of the Study. Lack of finance and insecurity of tenure will obviously play a major role. Table 17: Building Finishing Materials: Landlords only: Multiple answers % in italics
Walls plastered
Floor cement
Floor tiled Ceiling No Answer Total
No % No % No % No % No % No % 27 39.1 68 48.6 1 1.4 69 100.0 1 69 100.0
Percentages are calculated on the answered (69) questionnaires
Building Structure
Building Finishes
Facilities Questions were asked about the availability of kitchen and bath/toilets and whether they were internal or external. Only 4 premises out of the 70 stated they had an internal kitchen and only three had an internal bath/toilet. The three with an internal bath/toilet also had an internal kitchen so there was one building with an internal kitchen only. The precise implications of what this means for those with only external facilities will need to be examined in the next stage of the Study as will the waste and sewage disposal methods used by those with internal facilities. Preliminary observation shows that these figures reveal a potentially dangerous situation to overall public health. Table 18: Building Facilities: Landlords only: % in italics
Internal kitchen
External kitchen
Internal toilet/bath
External toilet/bath No Answer Total
No % No % No % No % No % No % 4 5.7 66 94.3 3 4.3 67 95.7 - - 70 100.0
Facilities (Toilet/Bathroom + Kitchen)
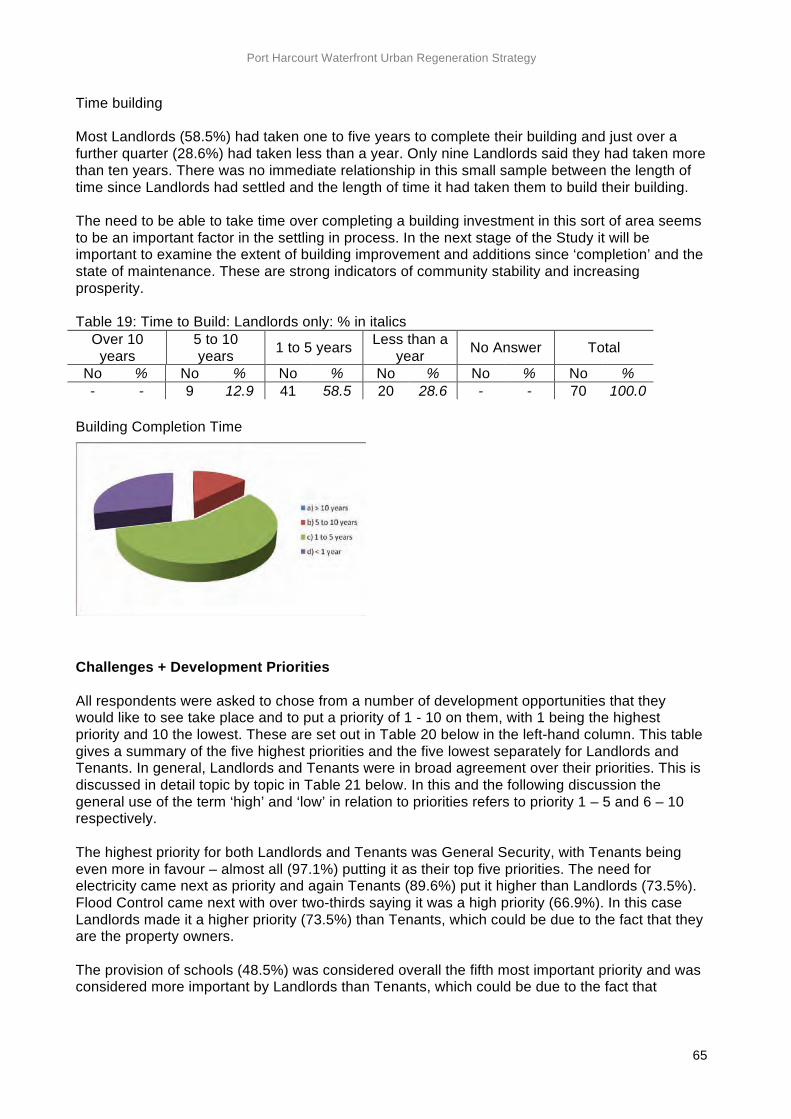
Port Harcourt Waterfront Urban Regeneration Strategy
65
Time building Most Landlords (58.5%) had taken one to five years to complete their building and just over a further quarter (28.6%) had taken less than a year. Only nine Landlords said they had taken more than ten years. There was no immediate relationship in this small sample between the length of time since Landlords had settled and the length of time it had taken them to build their building. The need to be able to take time over completing a building investment in this sort of area seems to be an important factor in the settling in process. In the next stage of the Study it will be important to examine the extent of building improvement and additions since ‘completion’ and the state of maintenance. These are strong indicators of community stability and increasing prosperity. Table 19: Time to Build: Landlords only: % in italics
Over 10 years
5 to 10 years 1 to 5 years Less than a
year No Answer Total
No % No % No % No % No % No % - - 9 12.9 41 58.5 20 28.6 - - 70 100.0
Building Completion Time
Challenges + Development Priorities All respondents were asked to chose from a number of development opportunities that they would like to see take place and to put a priority of 1 - 10 on them, with 1 being the highest priority and 10 the lowest. These are set out in Table 20 below in the left-hand column. This table gives a summary of the five highest priorities and the five lowest separately for Landlords and Tenants. In general, Landlords and Tenants were in broad agreement over their priorities. This is discussed in detail topic by topic in Table 21 below. In this and the following discussion the general use of the term ‘high’ and ‘low’ in relation to priorities refers to priority 1 – 5 and 6 – 10 respectively. The highest priority for both Landlords and Tenants was General Security, with Tenants being even more in favour – almost all (97.1%) putting it as their top five priorities. The need for electricity came next as priority and again Tenants (89.6%) put it higher than Landlords (73.5%). Flood Control came next with over two-thirds saying it was a high priority (66.9%). In this case Landlords made it a higher priority (73.5%) than Tenants, which could be due to the fact that they are the property owners. The provision of schools (48.5%) was considered overall the fifth most important priority and was considered more important by Landlords than Tenants, which could be due to the fact that
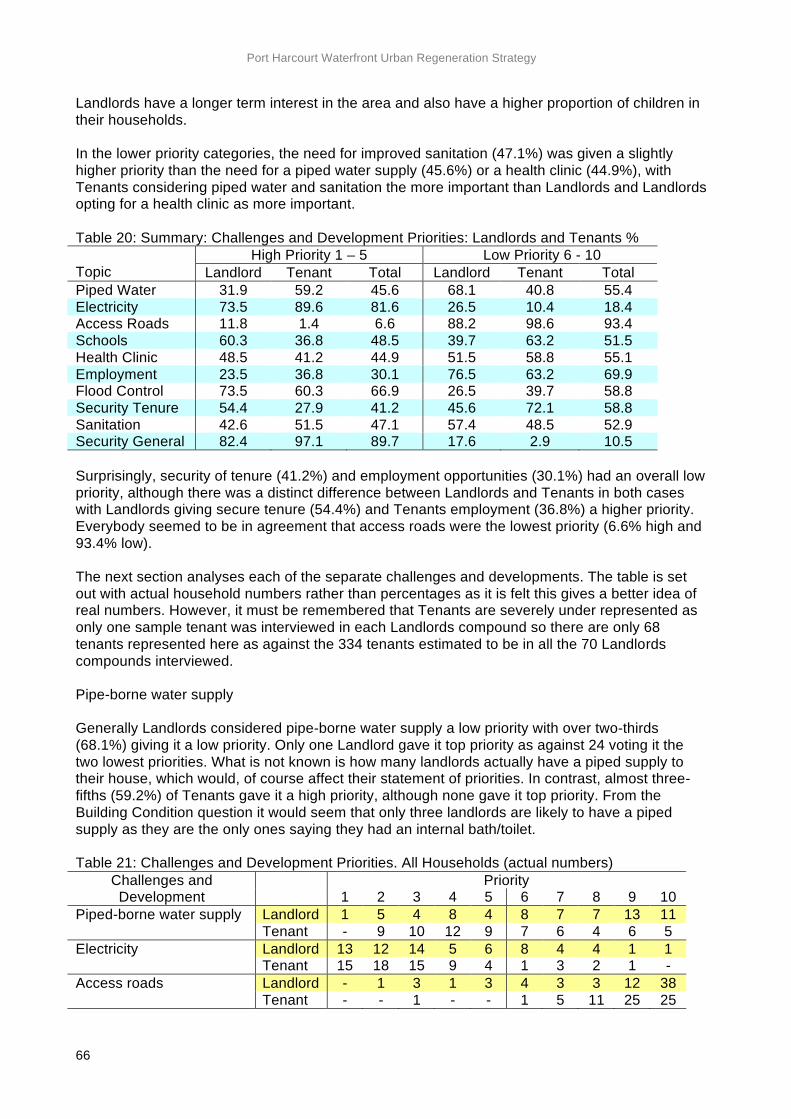
Port Harcourt Waterfront Urban Regeneration Strategy
66
Landlords have a longer term interest in the area and also have a higher proportion of children in their households. In the lower priority categories, the need for improved sanitation (47.1%) was given a slightly higher priority than the need for a piped water supply (45.6%) or a health clinic (44.9%), with Tenants considering piped water and sanitation the more important than Landlords and Landlords opting for a health clinic as more important. Table 20: Summary: Challenges and Development Priorities: Landlords and Tenants %
High Priority 1 – 5 Low Priority 6 - 10 Topic Landlord Tenant Total Landlord Tenant Total Piped Water 31.9 59.2 45.6 68.1 40.8 55.4 Electricity 73.5 89.6 81.6 26.5 10.4 18.4 Access Roads 11.8 1.4 6.6 88.2 98.6 93.4 Schools 60.3 36.8 48.5 39.7 63.2 51.5 Health Clinic 48.5 41.2 44.9 51.5 58.8 55.1 Employment 23.5 36.8 30.1 76.5 63.2 69.9 Flood Control 73.5 60.3 66.9 26.5 39.7 58.8 Security Tenure 54.4 27.9 41.2 45.6 72.1 58.8 Sanitation 42.6 51.5 47.1 57.4 48.5 52.9 Security General 82.4 97.1 89.7 17.6 2.9 10.5 Surprisingly, security of tenure (41.2%) and employment opportunities (30.1%) had an overall low priority, although there was a distinct difference between Landlords and Tenants in both cases with Landlords giving secure tenure (54.4%) and Tenants employment (36.8%) a higher priority. Everybody seemed to be in agreement that access roads were the lowest priority (6.6% high and 93.4% low). The next section analyses each of the separate challenges and developments. The table is set out with actual household numbers rather than percentages as it is felt this gives a better idea of real numbers. However, it must be remembered that Tenants are severely under represented as only one sample tenant was interviewed in each Landlords compound so there are only 68 tenants represented here as against the 334 tenants estimated to be in all the 70 Landlords compounds interviewed. Pipe-borne water supply Generally Landlords considered pipe-borne water supply a low priority with over two-thirds (68.1%) giving it a low priority. Only one Landlord gave it top priority as against 24 voting it the two lowest priorities. What is not known is how many landlords actually have a piped supply to their house, which would, of course affect their statement of priorities. In contrast, almost three-fifths (59.2%) of Tenants gave it a high priority, although none gave it top priority. From the Building Condition question it would seem that only three landlords are likely to have a piped supply as they are the only ones saying they had an internal bath/toilet. Table 21: Challenges and Development Priorities. All Households (actual numbers)
Priority Challenges and Development
1 2 3 4 5 6 7 8 9 10
Piped-borne water supply Landlord 1 5 4 8 4 8 7 7 13 11 Tenant - 9 10 12 9 7 6 4 6 5 Electricity Landlord 13 12 14 5 6 8 4 4 1 1 Tenant 15 18 15 9 4 1 3 2 1 - Access roads Landlord - 1 3 1 3 4 3 3 12 38 Tenant - - 1 - - 1 5 11 25 25
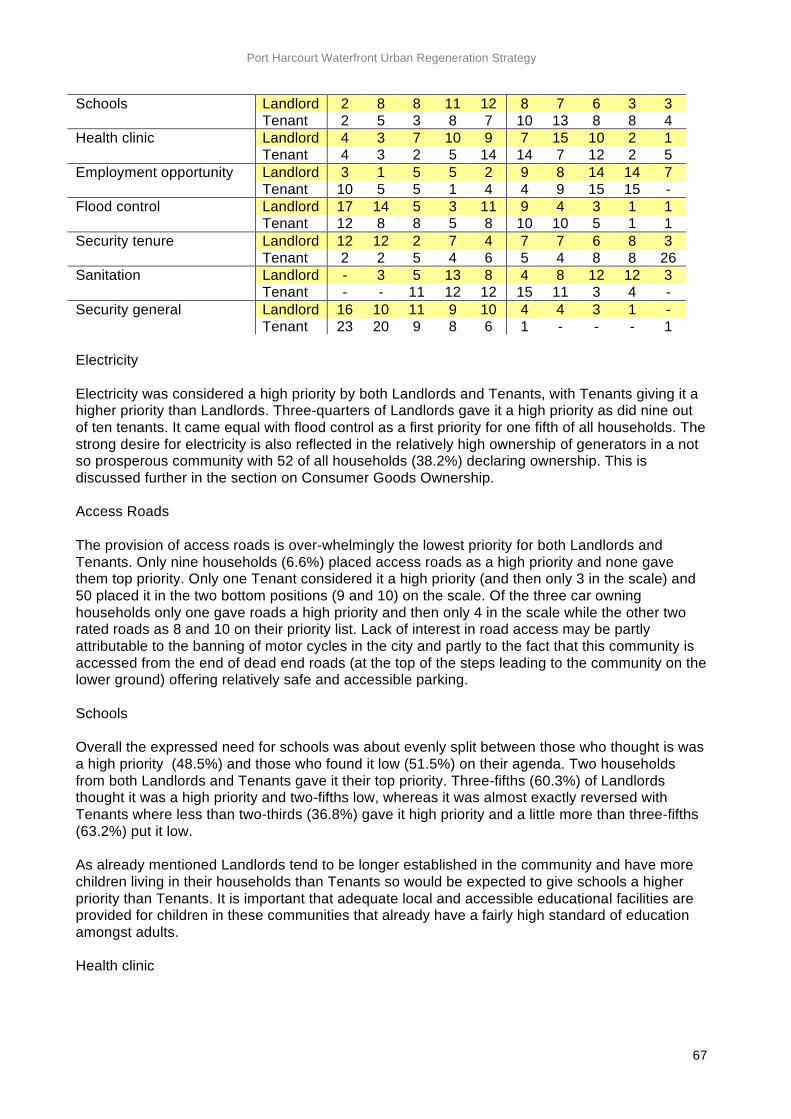
Port Harcourt Waterfront Urban Regeneration Strategy
67
Schools Landlord 2 8 8 11 12 8 7 6 3 3 Tenant 2 5 3 8 7 10 13 8 8 4 Health clinic Landlord 4 3 7 10 9 7 15 10 2 1 Tenant 4 3 2 5 14 14 7 12 2 5 Employment opportunity Landlord 3 1 5 5 2 9 8 14 14 7 Tenant 10 5 5 1 4 4 9 15 15 - Flood control Landlord 17 14 5 3 11 9 4 3 1 1 Tenant 12 8 8 5 8 10 10 5 1 1 Security tenure Landlord 12 12 2 7 4 7 7 6 8 3 Tenant 2 2 5 4 6 5 4 8 8 26 Sanitation Landlord - 3 5 13 8 4 8 12 12 3 Tenant - - 11 12 12 15 11 3 4 - Security general Landlord 16 10 11 9 10 4 4 3 1 - Tenant 23 20 9 8 6 1 - - - 1 Electricity Electricity was considered a high priority by both Landlords and Tenants, with Tenants giving it a higher priority than Landlords. Three-quarters of Landlords gave it a high priority as did nine out of ten tenants. It came equal with flood control as a first priority for one fifth of all households. The strong desire for electricity is also reflected in the relatively high ownership of generators in a not so prosperous community with 52 of all households (38.2%) declaring ownership. This is discussed further in the section on Consumer Goods Ownership. Access Roads The provision of access roads is over-whelmingly the lowest priority for both Landlords and Tenants. Only nine households (6.6%) placed access roads as a high priority and none gave them top priority. Only one Tenant considered it a high priority (and then only 3 in the scale) and 50 placed it in the two bottom positions (9 and 10) on the scale. Of the three car owning households only one gave roads a high priority and then only 4 in the scale while the other two rated roads as 8 and 10 on their priority list. Lack of interest in road access may be partly attributable to the banning of motor cycles in the city and partly to the fact that this community is accessed from the end of dead end roads (at the top of the steps leading to the community on the lower ground) offering relatively safe and accessible parking. Schools Overall the expressed need for schools was about evenly split between those who thought is was a high priority (48.5%) and those who found it low (51.5%) on their agenda. Two households from both Landlords and Tenants gave it their top priority. Three-fifths (60.3%) of Landlords thought it was a high priority and two-fifths low, whereas it was almost exactly reversed with Tenants where less than two-thirds (36.8%) gave it high priority and a little more than three-fifths (63.2%) put it low. As already mentioned Landlords tend to be longer established in the community and have more children living in their households than Tenants so would be expected to give schools a higher priority than Tenants. It is important that adequate local and accessible educational facilities are provided for children in these communities that already have a fairly high standard of education amongst adults. Health clinic
Port Harcourt Waterfront Urban Regeneration Strategy
68
As with schools there was a fairly even spread throughout the ten priority scale, with 14 more households giving it a low priority (55.1%) than a high priority (44.9%). Eight households gave it their top priority, but most choices (81 households 59.6%) fell in the middle of the scale (4, 5, 6 and 7). Landlords were evenly divided between giving it a high priority (48.5%) and a low (51.5%) Tenants more decisively gave it a low priority (58.8%). However, only 10 households (7.4%) gave it their lowest priority (scales 9 and 10). The provision of a health clinic seems to be something that would generally be beneficial but few seemed to feel strongly about it one way or the other. We have not inquired how close or adequate are any existing health facilities to this community. This is something that would come in the next stage of the Study, but it is something that many feel needs to be addressed. Employment opportunity It is uncertain how this question was presented or how it was interpreted. It was intended to try and establish the relative importance respondents gave to their location being close to the potential a city centre gave them to accessible casual and more permanent employers who could offer them employment opportunities. On the whole it received a fairly negative response with more than twice as many households giving it a low (69.9%) as against a high (30.1%) priority. However, 13 households gave it as their top priority and as would be expected the clear majority (10 households) were Tenants. It could be that these would be recent newcomers seeking work, and this will need closer examination in the next stage of the Study. In all our previous studies both in Nigeria and elsewhere we have found a close relationship between the location of suitable (i.e. inexpensive) accommodation and formal and informal city centre employment opportunities. There is a positive need for this informal relationship to be nurtured from both the job-seekers point of view and that of private sector employers who need a local and reliable source of casual and more permanent workers. Nearby residence without long commuting is a strong point among employers supporting reliability and building up trusting working practices. In the next stage of the Study we would give high priority to this aspect both from the community and employers viewpoint. Flood Control Flood control was considered a high priority (66.9%) by all households, in fact, the third highest priority following electricity and general security. More Landlords (73.5%) gave it high priority than Tenants (60.3%), which would be expected since Landlords are the property owning class. It will be important at the next stage of the Study to establish the extent, seriousness, type and frequency of flooding. Twenty-nine households (21.3%) said it was their top priority and a further 22 (16.2%) gave it second priority, whereas only four households put it in their two lowest priorities (9 and 10). Security of Tenure This was not given a particularly high priority by either Landlords or Tenants. There could have been some confusion between this question and the last question, which concerned general security. It would seem that there was a relatively good relationship between Landlords and Tenants since only just over a quarter of Tenants gave it as a high (27.9%) priority, and only 2 tenants gave it as their top priority whereas 26 gave it their lowest priority. At this stage we do not know if any general concern about tenure or title security is about Landlord/Tenant relationships or more general due to the constant threat of clearance and eviction under which this community lives. This whole issue will need much closer examination in the next stage of the Study, with particular reference to Tenants who in any case receive no
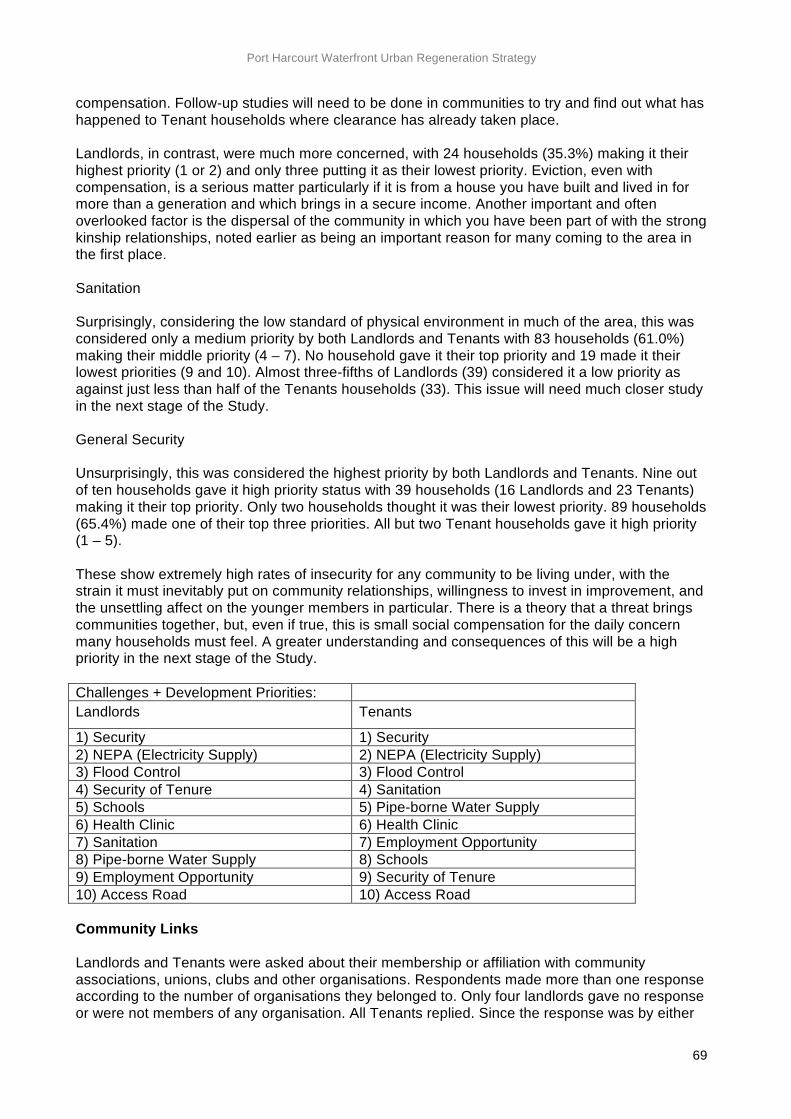
Port Harcourt Waterfront Urban Regeneration Strategy
69
compensation. Follow-up studies will need to be done in communities to try and find out what has happened to Tenant households where clearance has already taken place. Landlords, in contrast, were much more concerned, with 24 households (35.3%) making it their highest priority (1 or 2) and only three putting it as their lowest priority. Eviction, even with compensation, is a serious matter particularly if it is from a house you have built and lived in for more than a generation and which brings in a secure income. Another important and often overlooked factor is the dispersal of the community in which you have been part of with the strong kinship relationships, noted earlier as being an important reason for many coming to the area in the first place. Sanitation Surprisingly, considering the low standard of physical environment in much of the area, this was considered only a medium priority by both Landlords and Tenants with 83 households (61.0%) making their middle priority (4 – 7). No household gave it their top priority and 19 made it their lowest priorities (9 and 10). Almost three-fifths of Landlords (39) considered it a low priority as against just less than half of the Tenants households (33). This issue will need much closer study in the next stage of the Study. General Security Unsurprisingly, this was considered the highest priority by both Landlords and Tenants. Nine out of ten households gave it high priority status with 39 households (16 Landlords and 23 Tenants) making it their top priority. Only two households thought it was their lowest priority. 89 households (65.4%) made one of their top three priorities. All but two Tenant households gave it high priority (1 – 5). These show extremely high rates of insecurity for any community to be living under, with the strain it must inevitably put on community relationships, willingness to invest in improvement, and the unsettling affect on the younger members in particular. There is a theory that a threat brings communities together, but, even if true, this is small social compensation for the daily concern many households must feel. A greater understanding and consequences of this will be a high priority in the next stage of the Study. Challenges + Development Priorities: Landlords Tenants
1) Security 1) Security 2) NEPA (Electricity Supply) 2) NEPA (Electricity Supply) 3) Flood Control 3) Flood Control 4) Security of Tenure 4) Sanitation 5) Schools 5) Pipe-borne Water Supply 6) Health Clinic 6) Health Clinic 7) Sanitation 7) Employment Opportunity 8) Pipe-borne Water Supply 8) Schools 9) Employment Opportunity 9) Security of Tenure 10) Access Road 10) Access Road Community Links Landlords and Tenants were asked about their membership or affiliation with community associations, unions, clubs and other organisations. Respondents made more than one response according to the number of organisations they belonged to. Only four landlords gave no response or were not members of any organisation. All Tenants replied. Since the response was by either
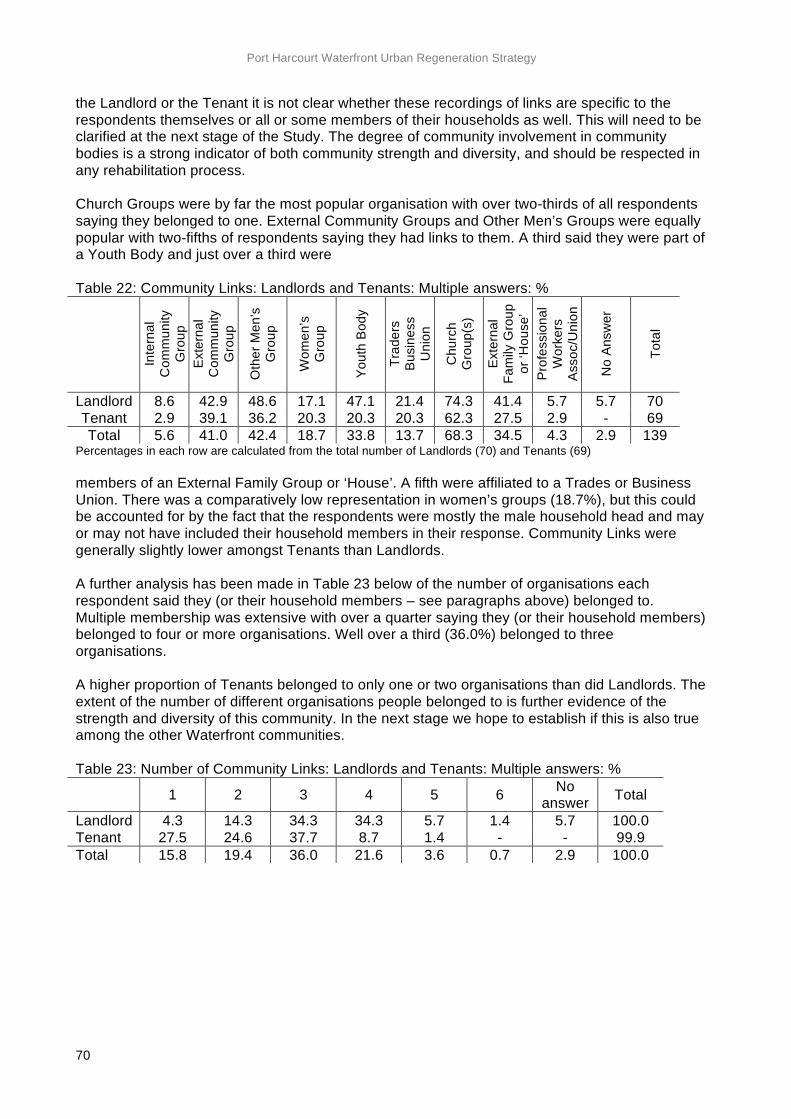
Port Harcourt Waterfront Urban Regeneration Strategy
70
the Landlord or the Tenant it is not clear whether these recordings of links are specific to the respondents themselves or all or some members of their households as well. This will need to be clarified at the next stage of the Study. The degree of community involvement in community bodies is a strong indicator of both community strength and diversity, and should be respected in any rehabilitation process. Church Groups were by far the most popular organisation with over two-thirds of all respondents saying they belonged to one. External Community Groups and Other Men’s Groups were equally popular with two-fifths of respondents saying they had links to them. A third said they were part of a Youth Body and just over a third were Table 22: Community Links: Landlords and Tenants: Multiple answers: %
Inte
rnal
C
omm
unity
G
roup
E
xter
nal
Com
mun
ity
Gro
up
Oth
er M
en’s
G
roup
Wom
en’s
G
roup
You
th B
ody
Trad
ers
Bus
ines
s U
nion
Chu
rch
Gro
up(s
)
Ext
erna
l Fa
mily
Gro
up
or ‘H
ouse
’ P
rofe
ssio
nal
Wor
kers
A
ssoc
/Uni
on
No
Ans
wer
Tota
l
Landlord 8.6 42.9 48.6 17.1 47.1 21.4 74.3 41.4 5.7 5.7 70 Tenant 2.9 39.1 36.2 20.3 20.3 20.3 62.3 27.5 2.9 - 69 Total 5.6 41.0 42.4 18.7 33.8 13.7 68.3 34.5 4.3 2.9 139
Percentages in each row are calculated from the total number of Landlords (70) and Tenants (69) members of an External Family Group or ‘House’. A fifth were affiliated to a Trades or Business Union. There was a comparatively low representation in women’s groups (18.7%), but this could be accounted for by the fact that the respondents were mostly the male household head and may or may not have included their household members in their response. Community Links were generally slightly lower amongst Tenants than Landlords. A further analysis has been made in Table 23 below of the number of organisations each respondent said they (or their household members – see paragraphs above) belonged to. Multiple membership was extensive with over a quarter saying they (or their household members) belonged to four or more organisations. Well over a third (36.0%) belonged to three organisations. A higher proportion of Tenants belonged to only one or two organisations than did Landlords. The extent of the number of different organisations people belonged to is further evidence of the strength and diversity of this community. In the next stage we hope to establish if this is also true among the other Waterfront communities. Table 23: Number of Community Links: Landlords and Tenants: Multiple answers: % 1 2 3 4 5 6 No
answer Total
Landlord 4.3 14.3 34.3 34.3 5.7 1.4 5.7 100.0 Tenant 27.5 24.6 37.7 8.7 1.4 - - 99.9 Total 15.8 19.4 36.0 21.6 3.6 0.7 2.9 100.0
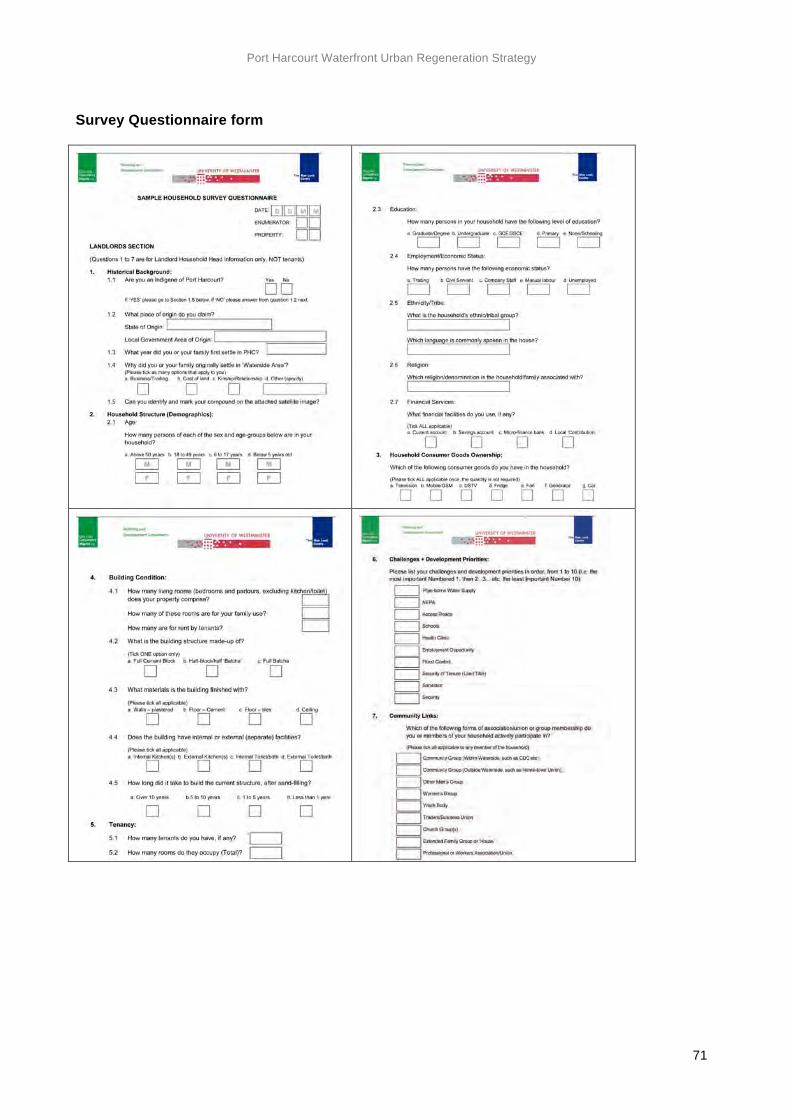
Port Harcourt Waterfront Urban Regeneration Strategy
71
Survey Questionnaire form
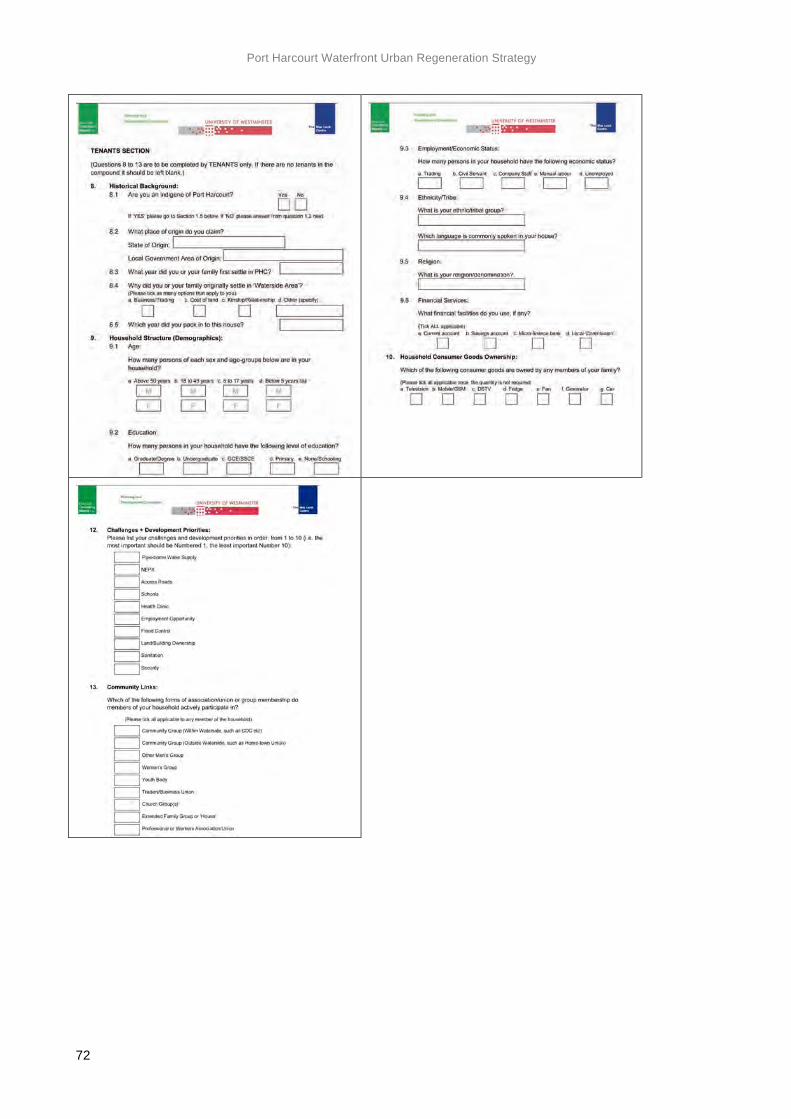
Port Harcourt Waterfront Urban Regeneration Strategy
72
Port Harcourt Waterfront Urban Regeneration Strategy
73
Mangrove Action Project
MAP and Partner CCRCs (Coastal Community Resource Centres) http://mangroveactionproject.org/map-programs/resource-centers/map-and-partner-ccrcs#nigeria Nigeria: Name: Mangrove Resource Center Location: Cross Rivers State Managing organization/partner: Mangrove Forest Conservation Society of Nigeria AKIE HART e-mail: [email protected] Date of establishment: 2002 Focus/Highlights: Established a mangrove nursery to provide seedlings for planting degraded areas; freshwater aquaculture ponds for tilapia or carp.

Port Harcourt Waterfront Urban Regeneration Strategy
74
Appendix C Interview transcript Transcript of interview with G.G. Peters (GG), b. 1922, and other members of Okwuzu Waterside Community (OW), Diobu, PHC, by Dr. Mike Theis, Sam Adenekan and Simon Gusah of Max Lock Consultancy Nigeria (ML), at Dannic Extended Stay Hotel, Elekahia, PHC.
The interview was an informal discussion between MT and GG, others present chipping in questions and answers. Before audio recording started GG had mentioned having settled in PHC during the Nigerian civil war.
He lived at the waterside near a fishing market and a Nigerian army camp, which demobilized at ‘Fire Quench’ (the ‘cease fire marking end of hostilities in 1970). He describes himself as a ‘jobman’ to the soldiers, making supplies and doing odd-jobs.
GG Peters initially came to PHC to supply periwinkle and firewood by canoe from Bonny/Kalabari, eventually founding the waterside community in 1968.
Transcript begins a few minutes into interview with GG naming the founding members of the community (estb. 1968) of which he is the only one still alive.
ML : OK sir just give us the list of the first people that were with you in the waterside.
GG : Amachree Cotren, Jacobi Yala, I am GG Peters, Jadimson Abbe, Igbidisin Sokari-George, Welsley B. Igoni, Elele, Violet Alabraba, Dan Sunday Amachree, Clifford Harry, Victoria Douglas…..and others!
ML : So that first community at ‘fire quench’ 1970, how many people?
GG : That time, maybe, they are pass twenty.
ML : Twenty people or twenty families?
GG : Twenty families!
ML : There’s more than 20 families today. How did they come, did they invite others, did they select people, did they say some people could not come…..?
GG : Another people come to join me. They bring periwinkle, to sell it to the market. They bring firewood, to sell it. They come to kill to the fish (fishing). Thatches (thatched) house, we make it. Then the slope area we go to cut the mud, poto-poto, na me do am.
ML : So the people were coming for business?
GG : Yes!
OW : When they come to the market, they would stay and he would apportion land to them.
ML : What do most of the people do, what is their work?
GG : Some now selling firewood now, some working (in offices), some killing fish. As for me I kill fish, I go to Bonny. I am from Ifoko (Abonnemma).
OW : What he is saying is that today some of us are workers, we are civil servants, some are fishermen, traders, wholesalers, some sell firewood, all kinds of life. He himself was a fisherman but he cannot fish again, he now mends nets. He used to fish at our old settlement called Fushe, close to Bonny. That is where we settled first.
ML : I can understand that place being important for fishermen or firewood traders, the location is important. If there are government staff or other people, how important is that location?
OW : Right now we are working ‘upland’. Why some of us are living there, civil servants and so on, 1. Is the cost of houses upland. Like today in PH if you see one room it is about N5,000 (per month). There (waterside) the (cement) ‘block’ room is about N2,000 or N1,500, depending on the size. Maximum N2,000, so you see the difference!
Port Harcourt Waterfront Urban Regeneration Strategy
75
We came to this place from there now (for interview). We trek up and take bus or taxi.
ML : What is the general price of a plot in that place?
GG : The measurement of the house….well…they de come meet me, I get up, put the stick, some two-three rooms.
OW : Normally it is just water. It is not the way they do upland, 50 by 50 or 50 by 100. It is not by measurement, if I have the strength to develop the water, maybe 20 rooms, it is my strength that determines. As I am building, if another person comes they say OK, you take from here. [It was previously noted during visit to community that the average ‘room’ was about 3x3m or 10’x10’].
If people are not building the water will still come and disturb us, so it is advisable that anybody that has strength should build.
ML : So these people that come, it doesn’t matter from where they come?
OW : No.
ML : Do they have to pay for the land?
OW : It is not necessary to pay for it. (GG confirms). When they come to him as a Kalabari man they drop drink for him…. Aaah you are my brother, let’s go let me give you land!
ML : It’s like the way it used to be in those days, you just bring Schnapps for the Chief. Chief will carry stone from where he is, anywhere where e throw, na there be the boundary. (General laughter).
ML : The filling method we saw there that day, is that how it has always been, starting with rubbish, then later adding the mud?
OW : The first people who started used mud, they will go to the mangrove.
ML : Is that the mud they call ‘Chicoco’, the black one?
OW : Yes! We that just come newly, we are the one’s that introduced (filling with) rubbish. We now fence the place, throw some mud, when it gets to a certain level, we now tell the refuse throwers to come down and pour it for us. That is why you see the rubbish there.
After some time we burn them, then they become land. In my place now, if you come you will see grasses, because of the rubbish, there is manure. I think you saw paw-paw in my place?
ML : What about the building itself, how do you make your foundation, so that it would not break, it would not sink? Do you put iron (rods) inside the foundation?
OW : Like my building, as at when I was erecting my personal building, people told me ‘don’t do it. It will fall’, but somebody advised me to use rod in the basement, it’s not easy, it’s expensive.
ML : Did you put a whole raft, or just the foundation strip?
OW : Just by the edges (of the blockwork – i.e. strip foundation).
Let us mention again, he made mention of this ‘chicoco’. To get a canoe of that mud is quite expensive. You pay people to go and bring it.
ML : Averagely, how much does a canoe of chicoco mud cost?
OW : About N5,000. Each boat. [Local canoes approx. 6m length] It is expensive to build there but the idea we have is that in PH the cost of land is high. Here the land is free and we have a place of our own, no matter how we make it.
For about 3 years I could not start my building, at that time this idea of rubbish was not even there, we were using the chicoco mud. Some canoe men, when you pay them they run away with

Port Harcourt Waterfront Urban Regeneration Strategy
76
your money. By the time they bring 2/3 boats then we will not see them again. That’s what happens, everybody knows it.
It is expensive but it is because I cannot have N1m or N1.something to buy land in PH. The small-small 10 kobo that comes in, I put it there. At the end of the day I have a place.
ML : What about building collapse, have there been cases of that?
OW : No….only fire incident. Fire is a problem.
ML : What do your children do for primary school?
OW : They go to school ‘up’. Somebody had tried to open school ‘down’ (waterside) before, but we were not encouraging the person, because some of our children are already going to school up. But around us there, there are schools.
ML : And the same thing for health clinics?
OW : Clinic up, police station up, everything is up.
ML : When we met outside the bar, there was a space outside, why is that space empty?
OW : Fire problem. Two buildings caught fire in June this year. The house behind was just built newly.
ML : Do your children want to continue to live in that place?
OW : When things get better people move and sometime rent out their buildings.
ML : When people move away do they easily sell their land?
OW : Yes, some people sell.
ML : When they sell do they have to make reference to Papa or the community, or they just sell to anybody they like?
OW : It is an individual thing. It is they buyer that may notify the community that he is coming in.
ML : In terms of sanitation, everything just moves straight into the water (the creek)?
OW : Yes. The toilets are the ones over the water.
ML : You buy water with containers?
OW : No, we have boreholes there. There is better borehole. Some people come down (from upland) to fetch.
ML : How much do you pay for sinking a borehole?
OW : About N200,000.
ML : They just bore down through the sand….
OW : Yes, the water there is somehow better than up. Good drinking water.
ML : There may be issues of salinity – do you have problem with salt (in the water)?
OW : No. They bore until they reach the small-small gravels. We’ve spent a lot of money, no matter the place looks ‘somehow’.
ML : If you are given a choice of moving….if somebody says, ‘Papa, we want to give you land’, will you accept?
OW : Is it for all of us, or for him (GG)?
ML : Generally (all of you). If the government says they are ready to sand-fill land for people to move, how will they feel?

Port Harcourt Waterfront Urban Regeneration Strategy
77
OW : If the condition is good, everybody likes better thing. We are not happy with present condition. People will be very happy to move to a better place.
ML : What about moving away from PH?
OW : Anywhere is better for us……
(Second person interjects)…it is not ‘anywhere’ and ‘everybody’. As I am today if you give me land here (Elekahia) I can stay. But if someone is a fisherman, he cannot stay here (away from water), even if you build a mansion for him. He will need to find something to eat.
So if you now come and say ‘everybody, move to Aba…’, not all of us will be happy to move. Some of us will go but others will not go; the firewood sellers, the periwinkle sellers, the fishermen.
If they sand-fill the island opposite (Okwuzu), those kinds of people will be happy to go there, whilst we would prefer upland.
ML : Some people have built with blocks, others ‘batcha’ (shanty), how willing will those with batcha be to improve it (to cement).
OW : The ‘willingness’ is a matter of cash. The whole place was batcha before, but people have gradually changed to block.
ML : So, there is a level of improvement?
OW : Yes.
ML : So they started initially with batcha and gradually upgraded to block?
OW : Yes. Some buildings are half block, it means that the man was not able to complete it with block again.
ML : How readily will people be ready to give up land for roads, so that a road that will be motorable will pass through? What is the willingness of people to give up part of their land for upgrading.
OW : This forms part of our argument this morning [they had said there were heated debates in the community over whether or not they should attend the interview meeting]. And it made us to be more doubtful of our involvement with you people, because we saw from your name that you are planners and developers.
We know at the end of the day if you ‘plan’ that area, if we are 100 landlords, 50 may not come back. Because, we have a compacted structure….
If you are to make a motorable road, it is not 3 feet that will be taken from my land – my entire house may go. (General laughter).
ML : Along that line, let us assume that there is some kind of reclamation, the density of that place is very high, if the island opposite is sand-filled and developed and government gives people loans, payable over say 20 years. In terms of the economy there, how much can the average household afford to pay every month? Can they afford up to N10,000 in a month? If proper block buildings are built, can people afford to squeeze out up to N20,000 in a month?
OW : It depends on individual, but yes we will be willing to pay, because most of the houses there are commercial houses. It is tenants that are living inside the houses. If houses are built in a better way then more better people will come and pay higher rent.
It may not work assuming government will build an estate of 2 bedroom flats, then there will be no space for a tenant.
ML : Are you saying that even if something is being built, it has to be in a ‘commercial’ way, not an ‘individual’ way?

Port Harcourt Waterfront Urban Regeneration Strategy
78
OW : Yes, but we know that government will not build that way. They will build flats and allocate to one person.
ML : Government will not normally do it but if someone can propose it, it may be possible. Part of our job is to find a way.
OW : If government can take a census first, then after completion they should ballot it for us. If we can afford to buy, we buy.
ML : But will that not still displace the poor?
OW : If it is built commercially, then our tenants will be giving us money and we will be re-paying the loan.
ML : How many houses are owner-occupied, do landlords rent out rooms whilst still living with their families? What percentage of landlords live alone with their families and what percentage rent exclusively?
OW : Most landlords live in their houses with tenants. Out of 20 houses, maybe only 2 landlords are not living there. Up to 90 percent of landlords live in the community, with tenants. 5% are not living in the community and 5% live without tenants.
ML : What is the ethnic composition of the community, amongst both landlords and tenants?
OW : Most of the landlords are Kalabari, tenants are Akwa Ibom, Ibo’s. The place is vastly populated by Kalabari and Akwa Ibom people, but all of the Akwa Ibom people are tenants. There are some Bayelsa people, Ijaw, Okrika. We have two or three Okrika landlords.
ML : Coming back again to a bit of history, when were the concrete steps going down to the community built?
OW : When they started they fenced it with sticks and poured mud, this is how they used to come down. Then in the ‘90’s all these politicians will come to say ‘vote me I will do this for you. They now built the concrete steps.
ML : But after voting, what happened?
OW : That is the end, we didn’t see them again.
ML : Who set up that market? The market at the top.
OW : That is the place they started doing business (in the 1960’s). Most of us don’t go to Mile One (market) for small things.
ML : Is the market important to people living down?
OW : Very, very important for us.
ML : As employment?
OW : As employment and for commerce. It’s very important because we buy things easily there. Our wives, most of the people living there (community) sell there (market) too.
ML : Most of the women selling in the market, do they come from your community?
OW : Yes, like the fish-mongers they have their area there. Most of those selling pepper, salt, are our mothers, wives and sisters.
ML : The market land is owned by one person?
OW : The market has been there for people living there. Somebody came to claim the market land and collect rent from the traders, so they made case and won the man. There is no landlord there.
ML : What of Local Government, do they collect revenue there?
OW : Nobody pays to government.
Port Harcourt Waterfront Urban Regeneration Strategy
79
ML : Does the market have a committee?
OW : Yes. The unions make monthly meeting. We have a body called CDC (Community Development Committee), they registered with the government and he (GG Peters) is the Patron, there is also a youth body too.
ML : so what is the organizational structure, you have Patron, Chairman…?
OW : For now they have dissolved the Exco, very soon they will re-organise them. It’s over 10 years (they have been stagnant).
Also in the waterfront there are some traditional chiefs, even him (GG Peters) is an installed chief and there are other notable chiefs around there, residing there with us.
When there are important issues, we still make consultation.
ML : What is your relationship with the local government?
OW : There is no formidable relationship now. But it has been registered as a community and if they want to do election they must come down, we are in a Ward.
ML : Apart from the threat of ejection from government, what other major problems do you have? What would be your top priorities?
OW : We have sanitation problem, we have drainage problem, we have electricity problem. Recently NDDC (Niger Delta Development Commission) gave us two transformers, but it was only one that came down. The one that is there now is not the one used around that area, they cannot even install it.
ML : NDDC gave this transformer for the waterfront community, or for the upland?
OW : Waterfront. The youths moved and they gave us. But along the line one ‘missed’, Nigerian situation, and the other one we cannot use it because it is not the same grade (compatible) with NEPA in that area.
Apart from giving us the transformer there was no provision for installation. We have boreholes, but the government if they are sincere, if they know we are part of them should give us pipe-borne water.
Most commonly is security (problem), we living there we have been termed as rogues and militants and criminals, but actually we are not the criminals there. Its people that lives upstairs there that commit one crime and run down and government will stay somewhere and say we are criminals, but the criminals does not reside there with us.
They will commit up and when they chase them they will run down and escape through water. Last month they kidnapped somebody at Elabushi, they kidnapped the man and find their way through the waterside. After ten minutes the police came and arrested the boys in the community. So that is how they brutalise us now.
Sometimes police will just come, knock your door and arrest you. You will spend money N10, 000 to release yourself. These are our problems.
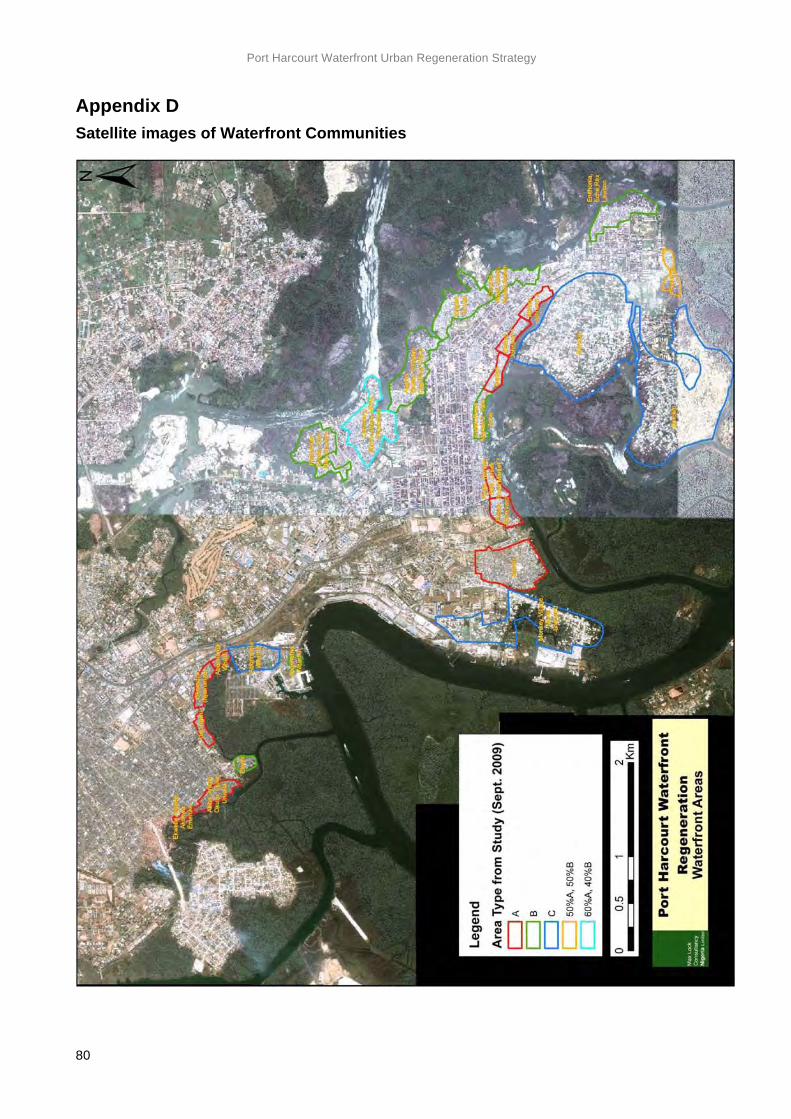
Port Harcourt Waterfront Urban Regeneration Strategy
80
Appendix D Satellite images of Waterfront Communities
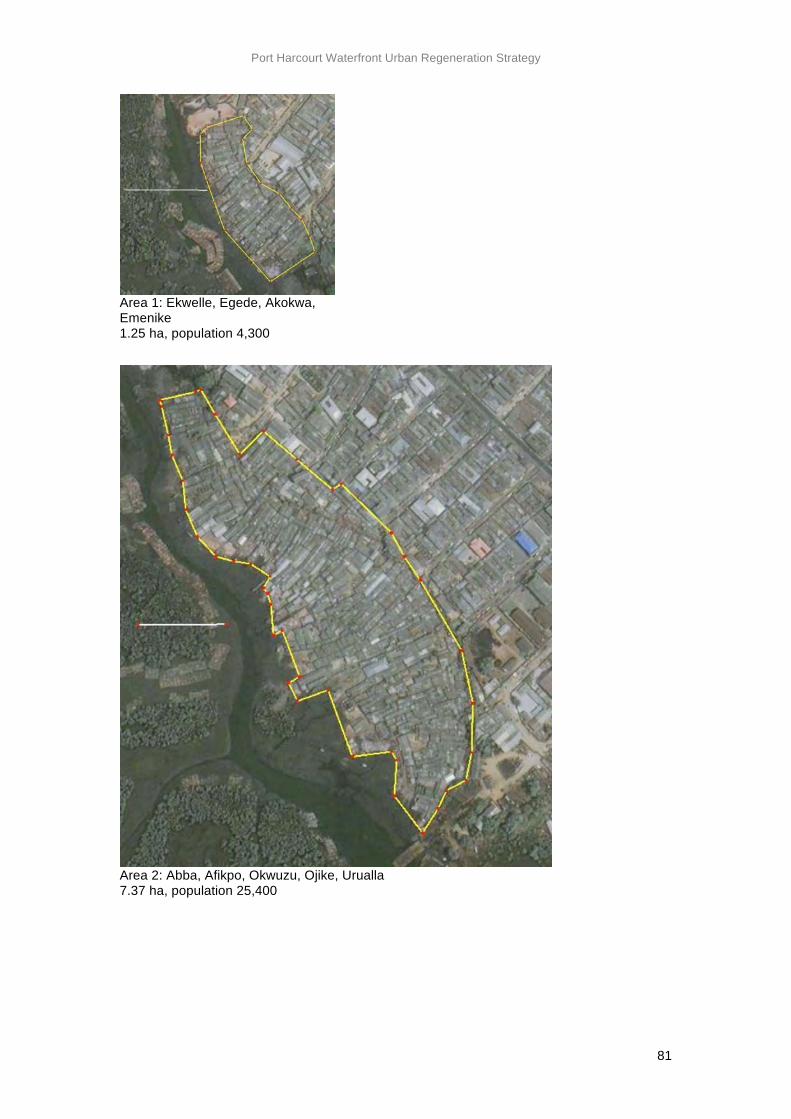
Port Harcourt Waterfront Urban Regeneration Strategy
81
Area 1: Ekwelle, Egede, Akokwa, Emenike 1.25 ha, population 4,300
Area 2: Abba, Afikpo, Okwuzu, Ojike, Urualla 7.37 ha, population 25,400
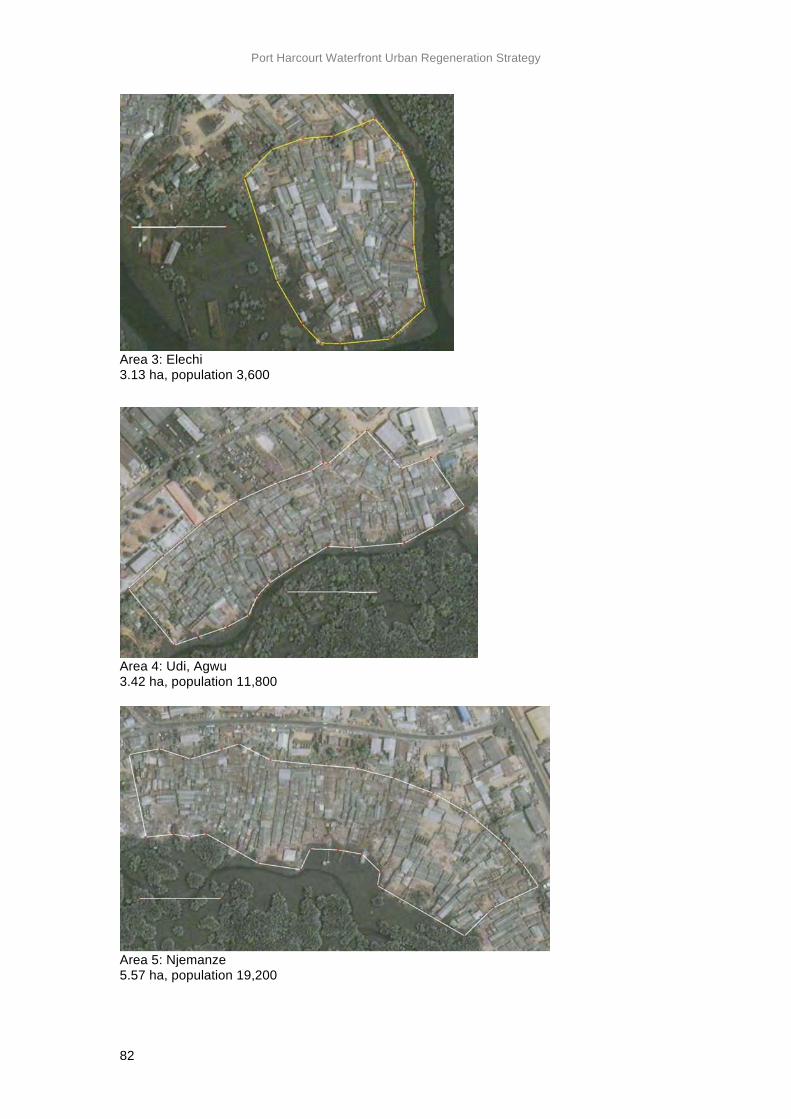
Port Harcourt Waterfront Urban Regeneration Strategy
82
Area 3: Elechi 3.13 ha, population 3,600
Area 4: Udi, Agwu 3.42 ha, population 11,800
Area 5: Njemanze 5.57 ha, population 19,200
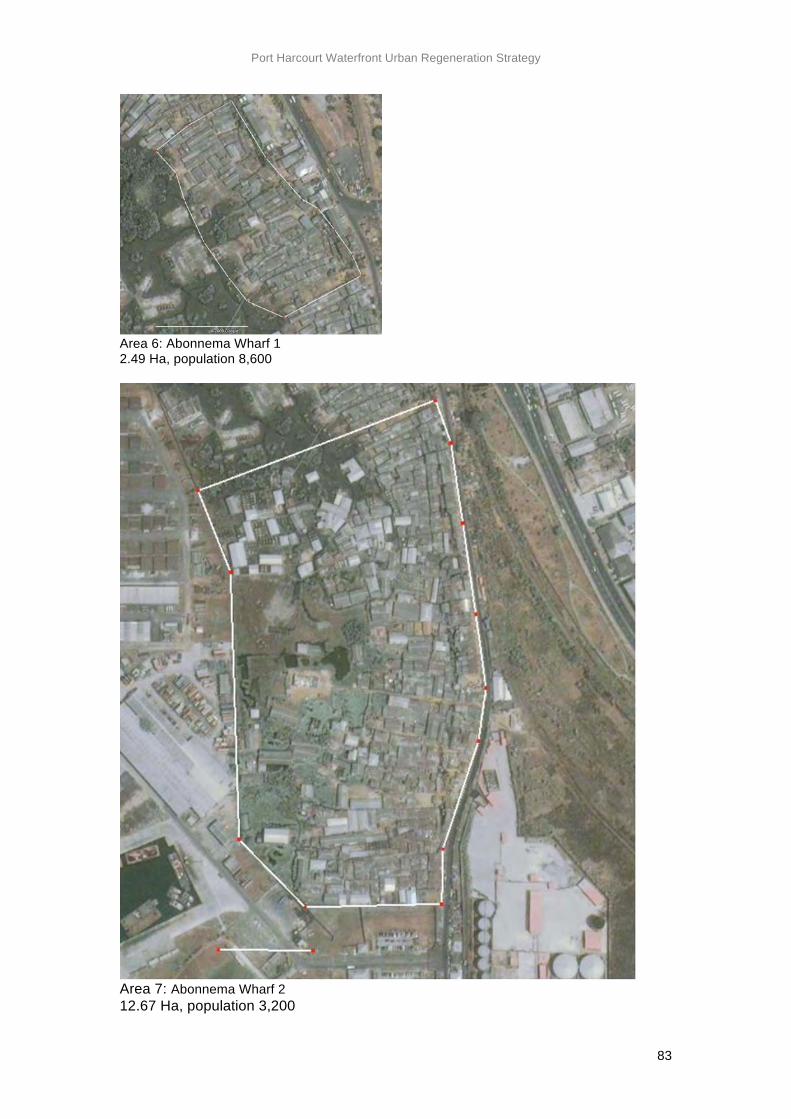
Port Harcourt Waterfront Urban Regeneration Strategy
83
Area 6: Abonnema Wharf 1 2.49 Ha, population 8,600
Area 7: Abonnema Wharf 2 12.67 Ha, population 3,200
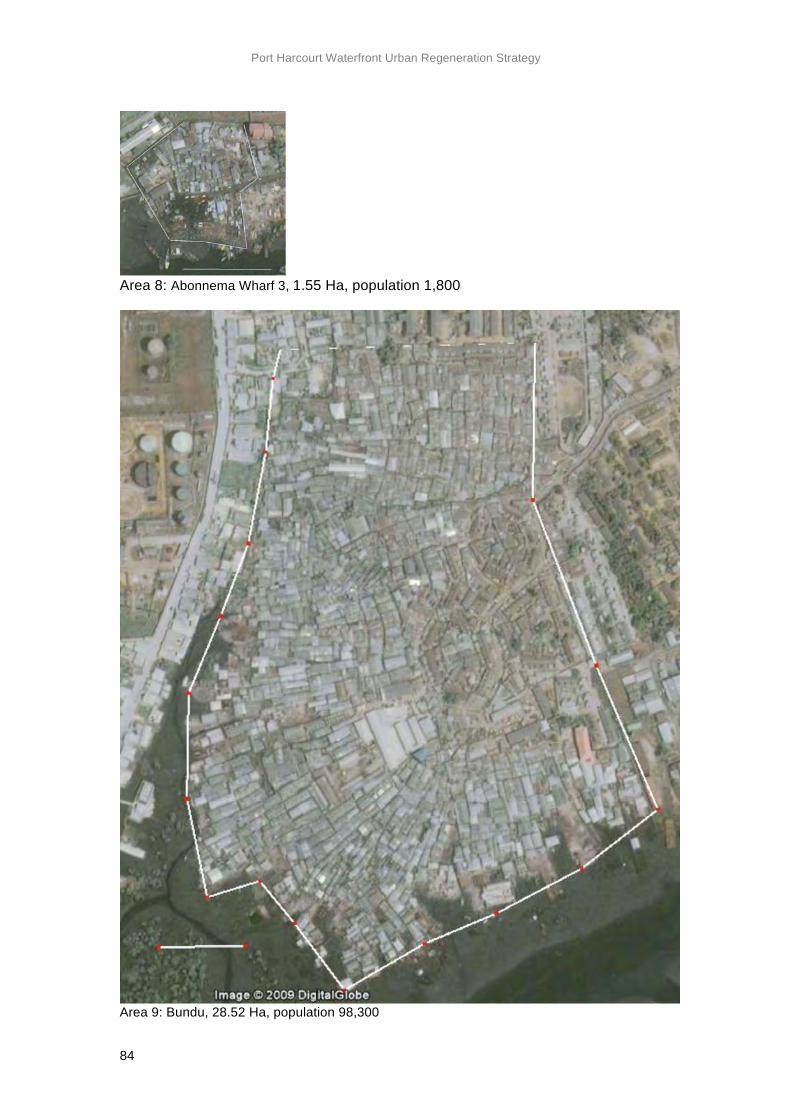
Port Harcourt Waterfront Urban Regeneration Strategy
84
Area 8: Abonnema Wharf 3, 1.55 Ha, population 1,800
Area 9: Bundu, 28.52 Ha, population 98,300
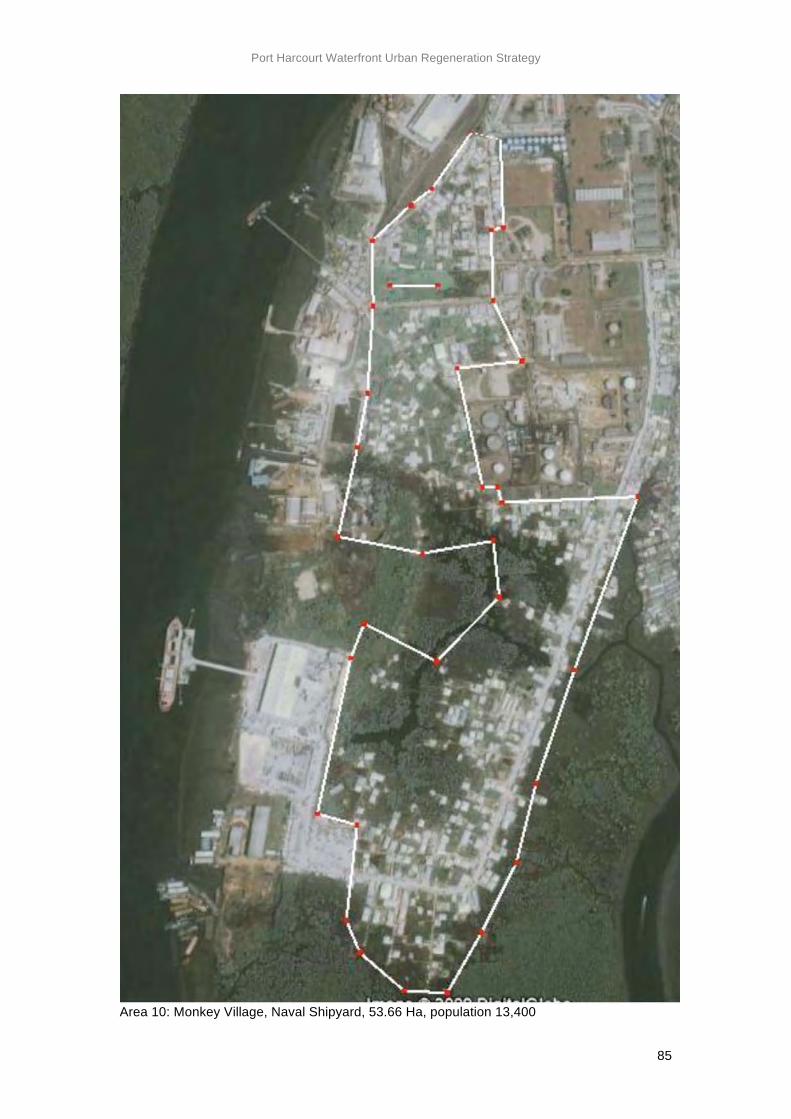
Port Harcourt Waterfront Urban Regeneration Strategy
85
Area 10: Monkey Village, Naval Shipyard, 53.66 Ha, population 13,400
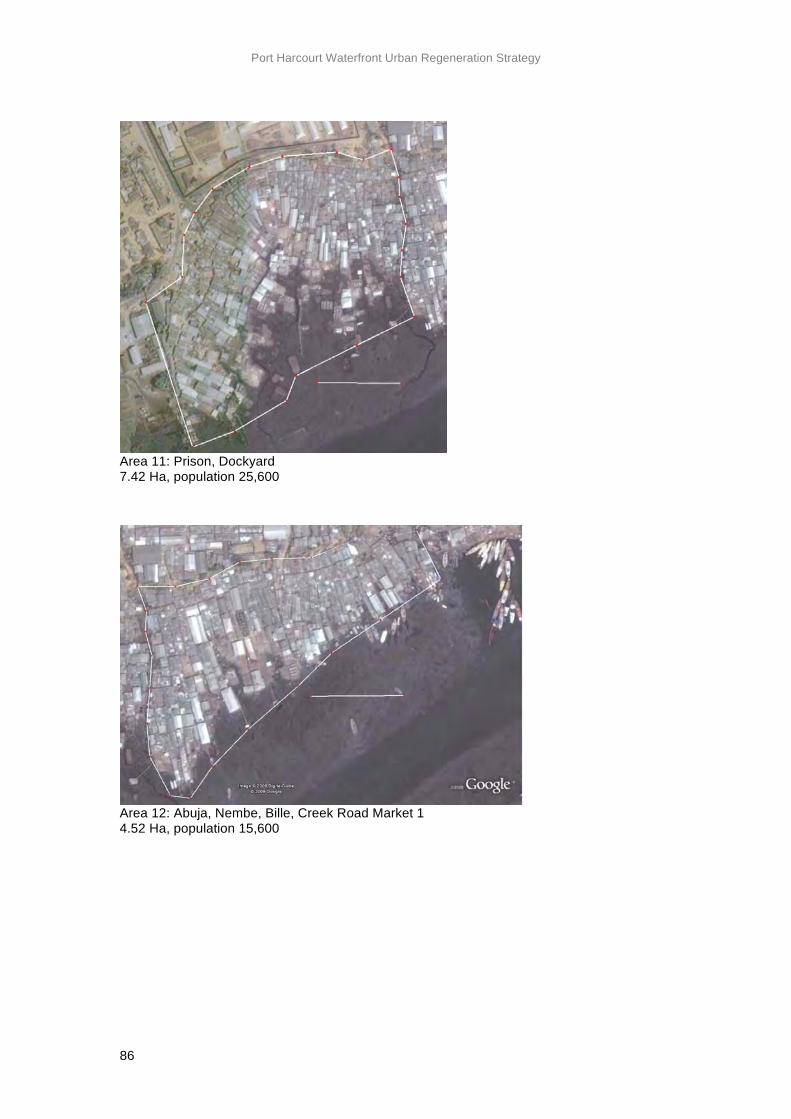
Port Harcourt Waterfront Urban Regeneration Strategy
86
Area 11: Prison, Dockyard 7.42 Ha, population 25,600
Area 12: Abuja, Nembe, Bille, Creek Road Market 1 4.52 Ha, population 15,600
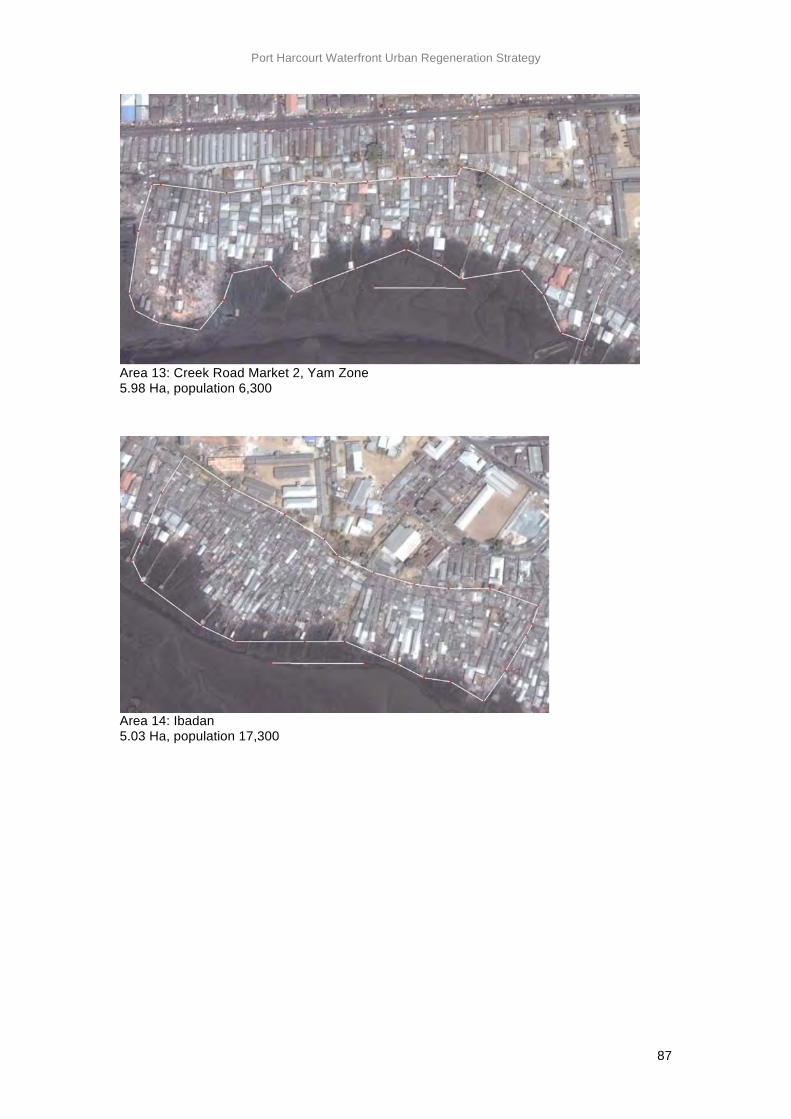
Port Harcourt Waterfront Urban Regeneration Strategy
87
Area 13: Creek Road Market 2, Yam Zone 5.98 Ha, population 6,300
Area 14: Ibadan 5.03 Ha, population 17,300
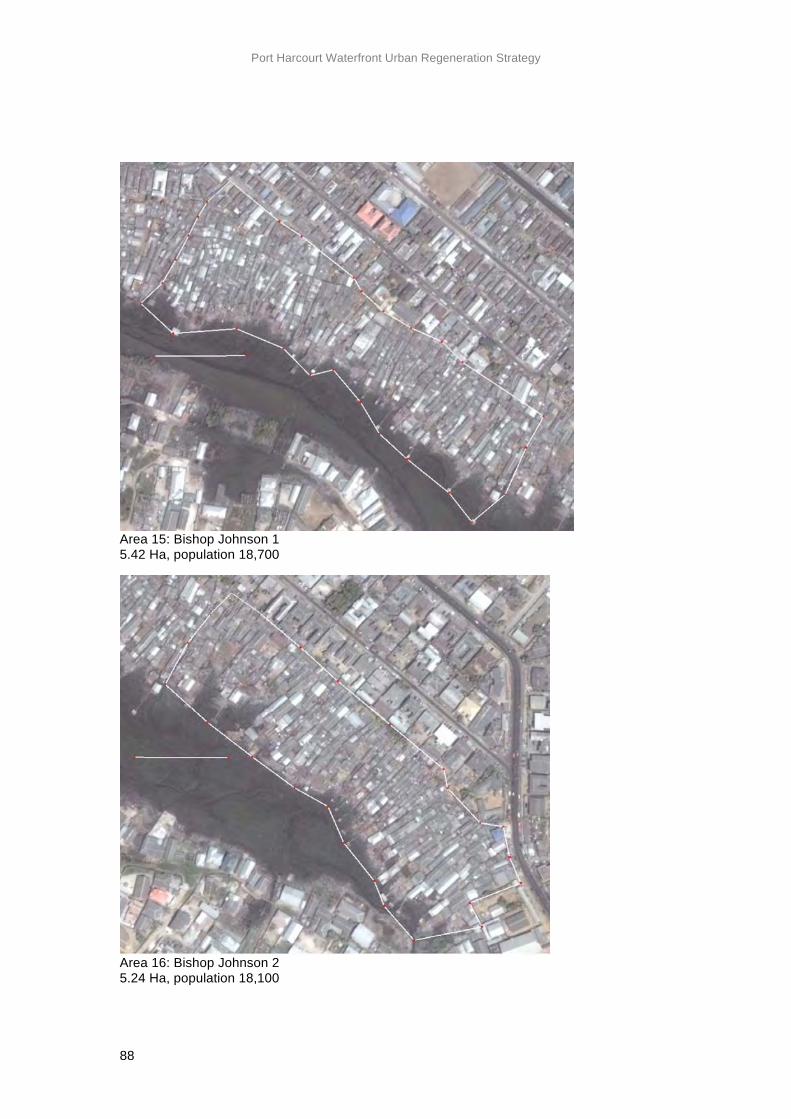
Port Harcourt Waterfront Urban Regeneration Strategy
88
Area 15: Bishop Johnson 1 5.42 Ha, population 18,700
Area 16: Bishop Johnson 2 5.24 Ha, population 18,100
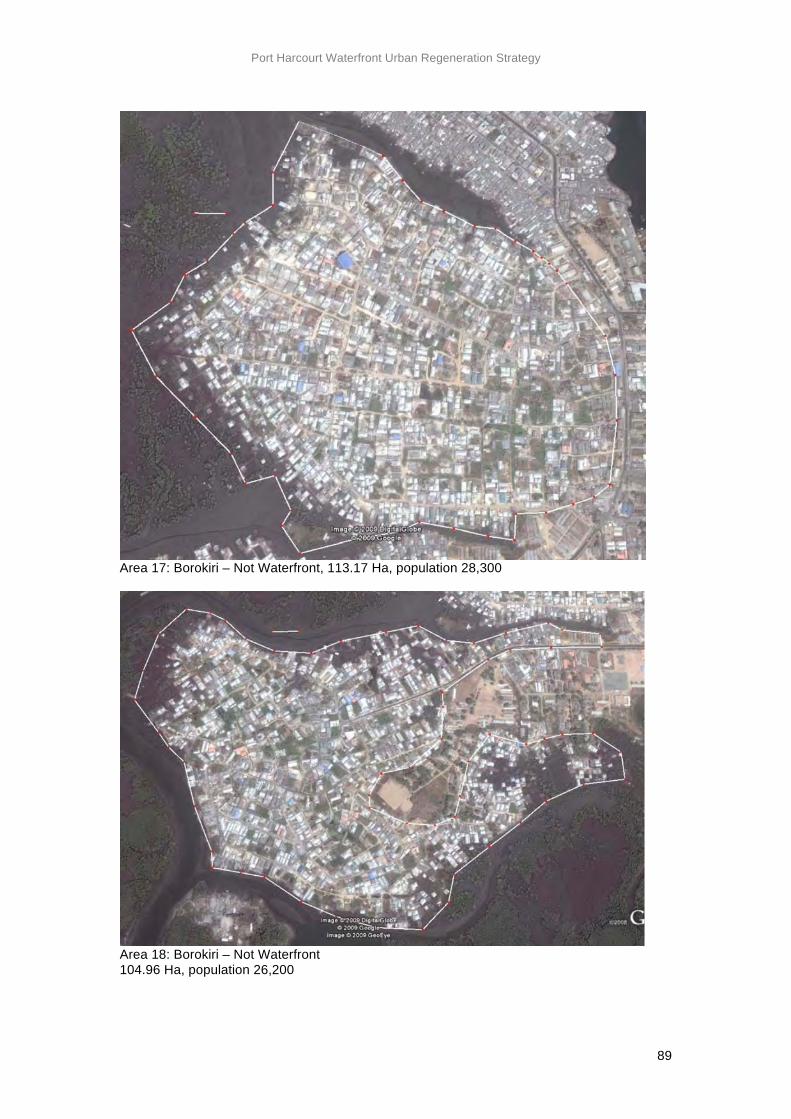
Port Harcourt Waterfront Urban Regeneration Strategy
89
Area 17: Borokiri – Not Waterfront, 113.17 Ha, population 28,300
Area 18: Borokiri – Not Waterfront 104.96 Ha, population 26,200
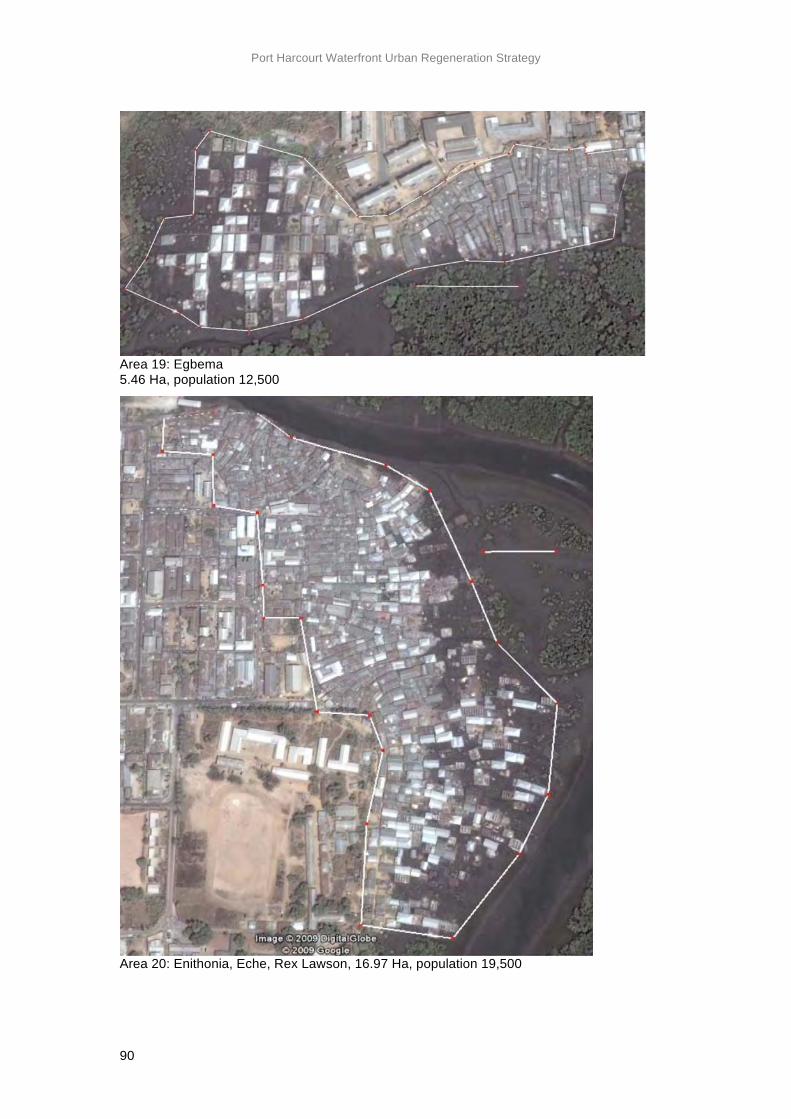
Port Harcourt Waterfront Urban Regeneration Strategy
90
Area 19: Egbema 5.46 Ha, population 12,500
Area 20: Enithonia, Eche, Rex Lawson, 16.97 Ha, population 19,500
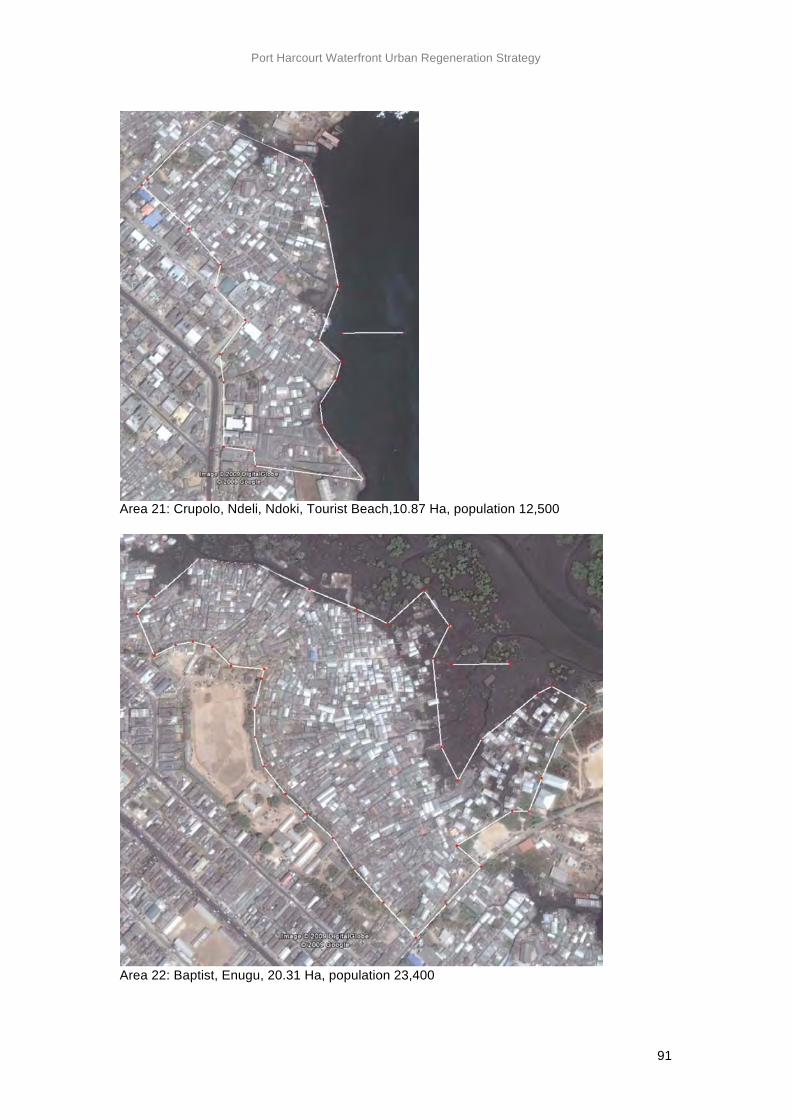
Port Harcourt Waterfront Urban Regeneration Strategy
91
Area 21: Crupolo, Ndeli, Ndoki, Tourist Beach,10.87 Ha, population 12,500
Area 22: Baptist, Enugu, 20.31 Ha, population 23,400
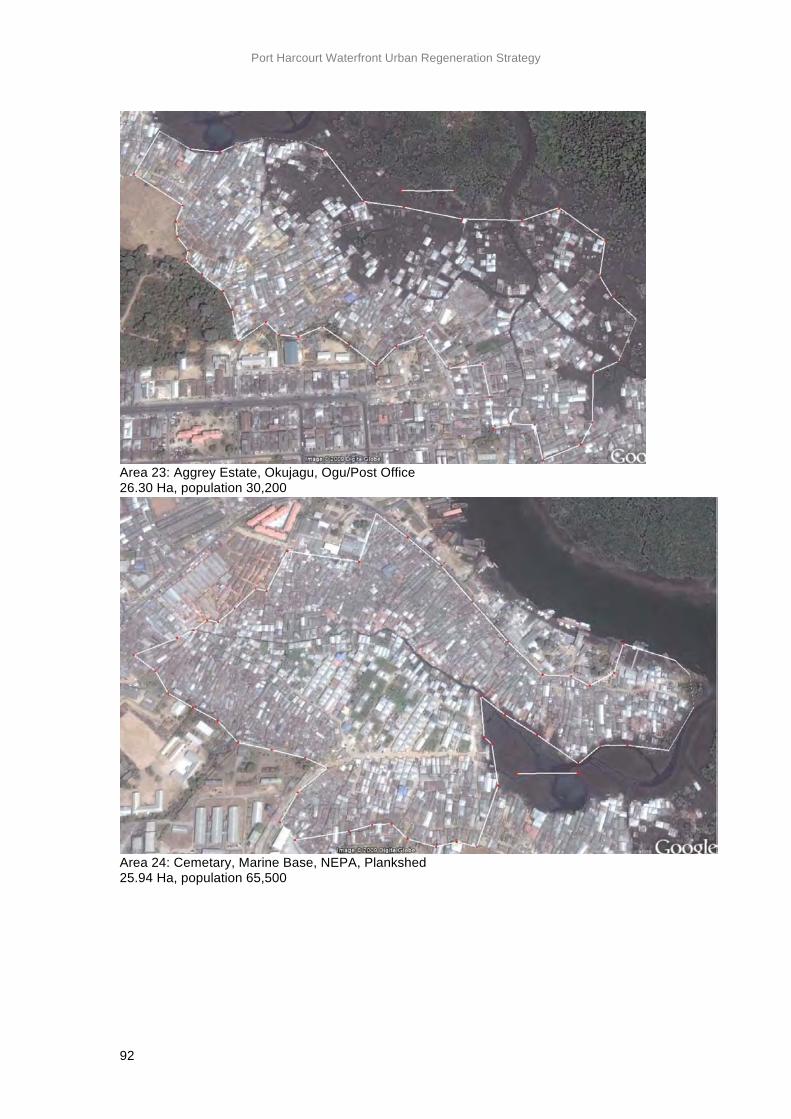
Port Harcourt Waterfront Urban Regeneration Strategy
92
Area 23: Aggrey Estate, Okujagu, Ogu/Post Office 26.30 Ha, population 30,200
Area 24: Cemetary, Marine Base, NEPA, Plankshed 25.94 Ha, population 65,500
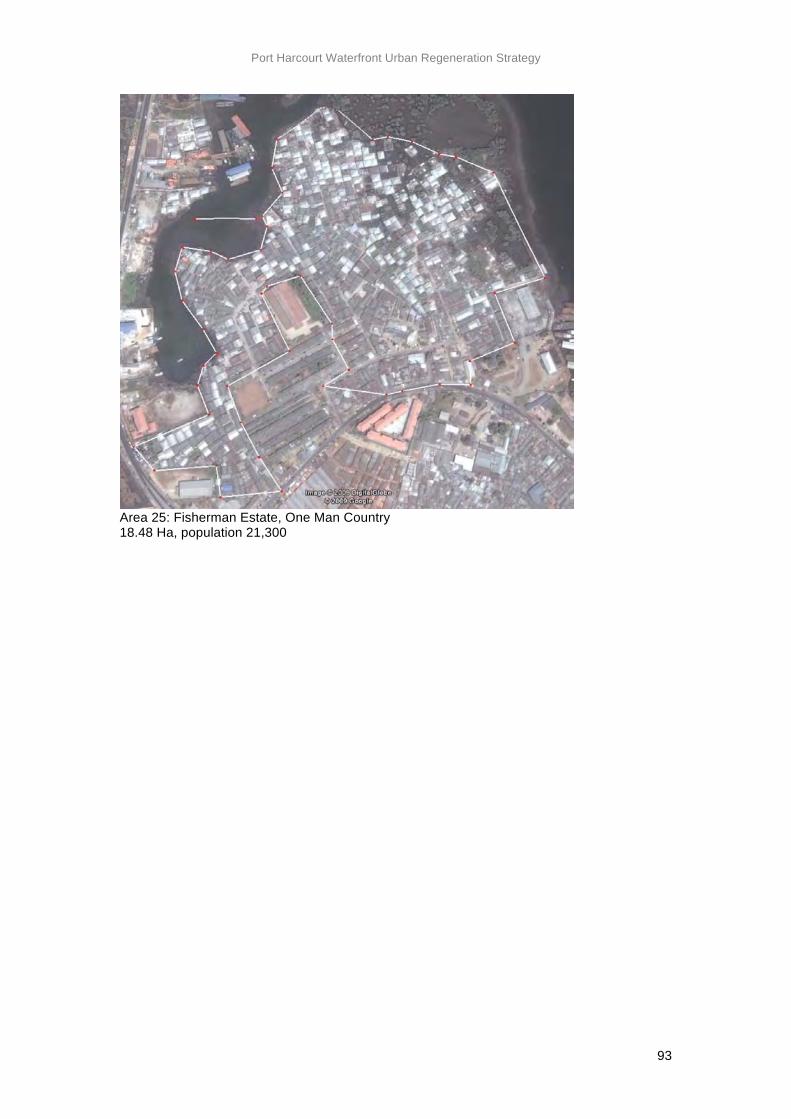
Port Harcourt Waterfront Urban Regeneration Strategy
93
Area 25: Fisherman Estate, One Man Country 18.48 Ha, population 21,300
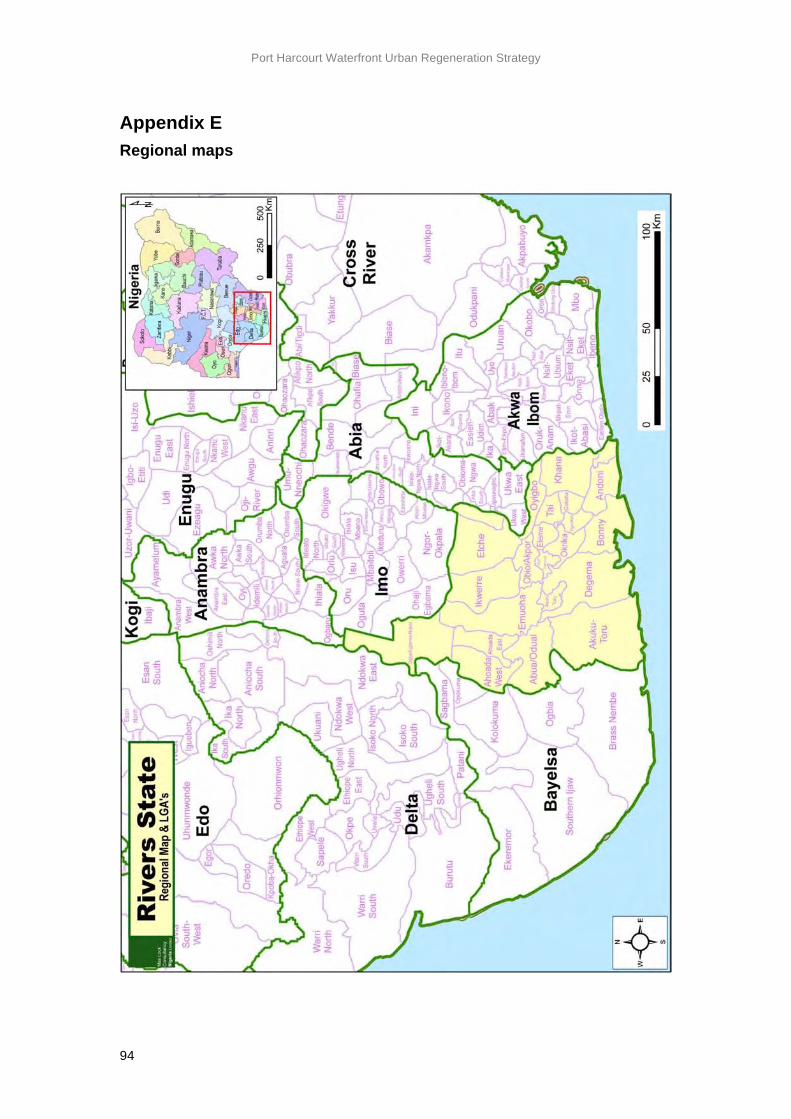
Port Harcourt Waterfront Urban Regeneration Strategy
94
Appendix E Regional maps
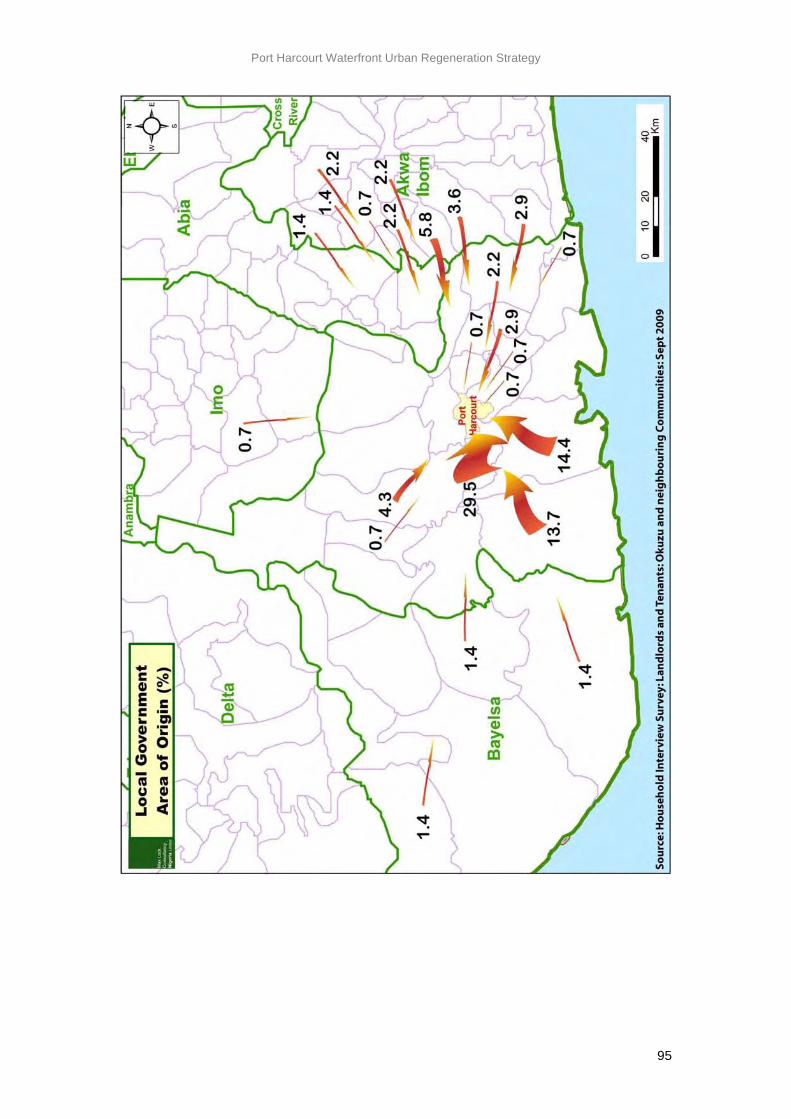
Port Harcourt Waterfront Urban Regeneration Strategy
95
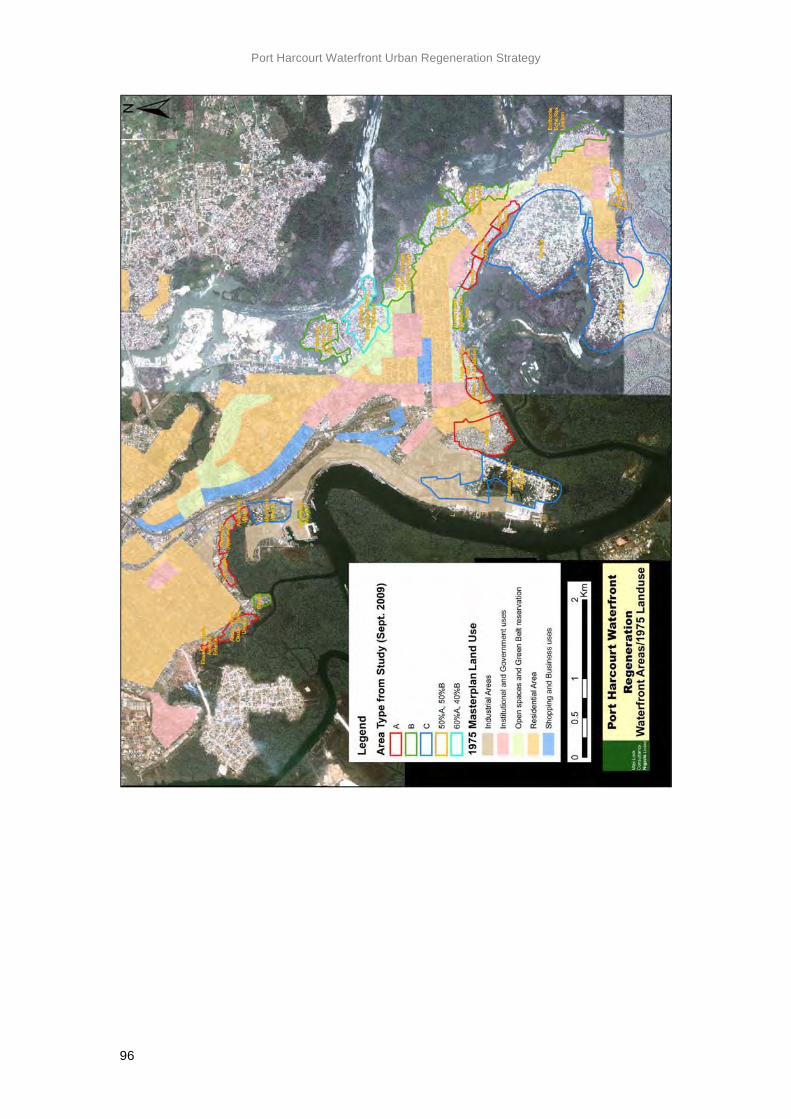
Port Harcourt Waterfront Urban Regeneration Strategy
96
Port Harcourt Waterfront Urban Regeneration Strategy
97
Appendix F Brief for the Main Study Following on from the Scoping Study the Main Study will include the following:
1. Preliminary surveys by technical specialist/engineering consultants
• Geotechnical survey: ground exploration/geology • Water supply and drainage; sanitation and waste management • Environmental/ecological survey • Transportation study
2. Urban planning surveys and survey analysis: • Satellite image survey and mapping of study sites • Household surveys • Stakeholder consultation • Database entry/Geospatial-Data Infrastructure development
3. Preliminary urban planning/technical studies • Livelihoods and local economic development potential • Social and community development needs analysis • Housing needs analysis – demographic trends and population projections • Land and housing market study • Housing/building typology studies • Infrastructure and engineering performance standards
4. Feasibility study: development and evaluation of urban planning proposals • Development of options and options appraisal • Phasing and strategic planning • Planning policy framework and relationship to Greater Port Harcourt Master
Plan; planning standards • Detailed urban and landscaping design • Financial appraisal of development options
5. Implementation plan • Action planning • Outline planning briefs and urban design guidelines • Development finance options • Urban Regeneration Partnership framework • Consultation with key stakeholders
Key outputs: • Interim and final technical reports and recommendations including technical
appendices. • User-friendly audio-visual presentation/video • Partnership-based development framework and action plans for implementing
the Strategic Urban Regeneration strategy for the Port Harcourt Waterfront • Geospatial-data infrastructure as a development management tool for the
Waterfront Area.
Timing: The Main Study will take 4-6 months to complete depending on mobilisation of engineers/technical specialists timely availability of technical survey results and rate of progress on consultation with stakeholders.
Port Harcourt Waterfront Urban Regeneration Strategy
98
Appendix G UN-HABITAT Mission report recommendations Based on its assessment of the situation in Port Harcourt, the Mission recommends that the Rivers State Government declares an immediate moratorium on demolitions and forced evictions which should have effect until the following recommendations are fully implemented. In brackets are the actors that are suggested to take the lead and support each of the recommended actions, respectively.
1. The RSG to call for a multi-stakeholder consultation forum involving Government, NGOs, community groups, private sector, developers, academic and research institutions, associations, trade unions, etc to discuss the Port Harcourt city development strategy with the aim of setting up a task force and advisory council on the further steps of the urban renewal strategy, including prevention of forced evictions and demolitions, amongst other things. This can be associated with the Urban Renewal Board. (RSG)
2. Adequately compensate all those that were forcefully evicted from their homes and commercially/socially used accommodations such as business places, NGO offices, churches, etc. in Port Harcourt since the beginning of all urban renewal activities (2000), including the tenants, and/or provide resettlement sites with basic services/infrastructure (in consultation with affected communities and their representative organisations). (RSG)
3. Carry out review of the institutional framework against the existing legislation. Streamline the 2003 Rivers State Planning Law with the new Law for the creation of the Greater Port Harcourt City Development Authority. (RSG, with UN-
HABITAT and SERAC.
4. Establish the Urban Renewal Board, either at State level, or under the new Greater Port Harcourt City Development Authority. (RSG)
5. Complement the new Greater Port Harcourt Development Plan which was designed in a non-participatory way, with a City Development Strategy, in view of slum prevention and sustainable urbanisation, including provision of dedicated areas for income-generation activities for small businesses. (RSG, with Cities Alliance and UN-HABITAT)
6. Undertake participatory social and settlement mapping, including enumeration, followed by a feasibility study to determine how waterfront settlement can be upgraded; pursue consultation and participation of all stakeholders in the areas, for example the Abonnema Wharf Community House Owners Association, traders association, government agencies, etc. (RSG, with support from WEP, SERAC and/or other organizations that have this type of experience)
7. Verify, through a study, to what extent the Rivers State Physical Planning and Development Law of 2003 actually applies to the waterfronts, and which parts of them fall under the jurisdiction of the National Inland Waterways Authority (NIWA) that has the right to all land within the right-of-way of such waterways. According to the National Inland Waterways Act of 1997 no person including a State has the right to erect permanent structures; reclaim land; undertake acquisition or lease/hire of properties within the right-of-way without the written consent, approval
Port Harcourt Waterfront Urban Regeneration Strategy
99
or permission of the Authority. The Authority has exclusive right to acquire, develop and use any landed property. It is important to establish to what degree these provisions affect the RSG’s authority over any improvement intervention in the waterfront settlements with a view of ensuring these are authorised by Federal Government. (RSG, with Federal Government/NIWA and affected waterfront communities)
8. Implement pilot projects for in situ upgrading and rehabilitation of Abonnema Wharf and Njemanze waterfronts to test and demonstrate an alternative approach to urban renewal that is not based on demolition and redevelopment. These two settlements are located within the 2 km radius around the Silverbird project site, where – according to the MoU - urban renewal is required. Since the MoU does not specify which form of urban renewal should be chosen, it gives the RSG the opportunity to implement in situ upgrading. Engage Silverbird Group Ltd. as lead private sector partner in this human settlement upgrading exercise. This is to be premised on Silverbird’s corporate social responsibility that the company expresses in its commitment to the attainment of the 'African Dream' embodied by the values of NEPAD.
The RSG and Silverbird have the unique opportunity to create a global model for inclusive, pro-poor public-private partnership-driven slum upgrading. A large-scale entertainment project that is built within a participating, supportive community rather than on the rubble of the homes and livelihoods of over a hundred thousand people can create a win-win situation for all stakeholders. In situ vertical densification should be explored as a possibility to create open space for recreation while improving the living conditions of existing communities. Other important private companies like Sigmund and Shell (oil business) should be invited by the RSG to contribute to this urban renewal drive by providing basic services, such as water supply and access roads. (RSG, Silverbird – explore possibility of technical collaboration with UN-HABITAT)
9. Create the “safe neighbourhood buffer zone” required by the Silverbird MoU. Develop, through a comprehensive, community-based crime prevention strategy, with community policing and other innovative instruments. Expand this approach to all waterfront settlements. (RSG - explore possibility of collaboration with Safer Cities Programme – UN-HABITAT)
10. Establish rotating funds for housing improvement loans to be given to waterfront and other low-income landlords and structure owners. (RSG – explore possibility of collaboration with UN-HABITAT – Experimental Reimbursable Seeding Operation-ERSO)
11. Provide affordable housing and resettlement options for those who have to make way for essential infrastructure provision of upgraded settlements through reinforcing and accelerating the implementation of the Government Housing Programme. (RSG)
12. Facilitate “legal development” through review and simplification of the legal and regulatory framework for access to land and housing. This should include the building regulations, land tenure (easier access to Certificate of Occupancy and phasing out of Temporary Occupation Licenses); and the application and approval process for development/building permits. (RSG)
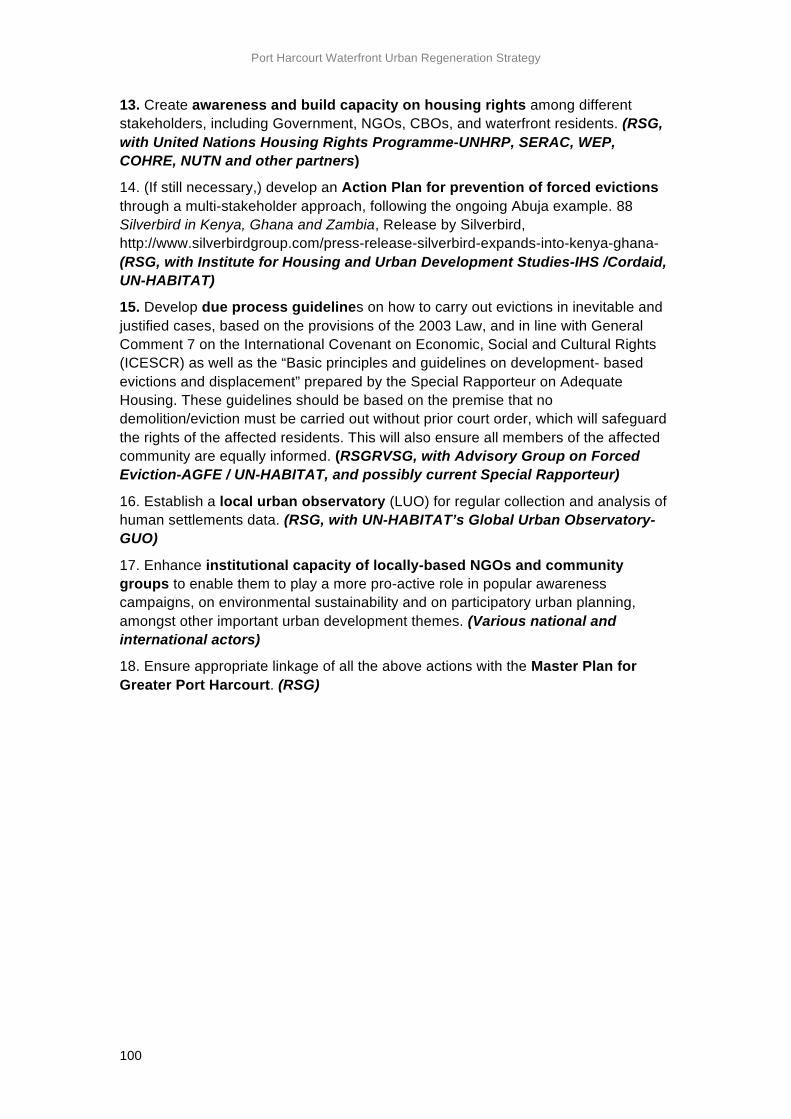
Port Harcourt Waterfront Urban Regeneration Strategy
100
13. Create awareness and build capacity on housing rights among different stakeholders, including Government, NGOs, CBOs, and waterfront residents. (RSG, with United Nations Housing Rights Programme-UNHRP, SERAC, WEP, COHRE, NUTN and other partners)
14. (If still necessary,) develop an Action Plan for prevention of forced evictions through a multi-stakeholder approach, following the ongoing Abuja example. 88 Silverbird in Kenya, Ghana and Zambia, Release by Silverbird, http://www.silverbirdgroup.com/press-release-silverbird-expands-into-kenya-ghana- (RSG, with Institute for Housing and Urban Development Studies-IHS /Cordaid, UN-HABITAT)
15. Develop due process guidelines on how to carry out evictions in inevitable and justified cases, based on the provisions of the 2003 Law, and in line with General Comment 7 on the International Covenant on Economic, Social and Cultural Rights (ICESCR) as well as the “Basic principles and guidelines on development- based evictions and displacement” prepared by the Special Rapporteur on Adequate Housing. These guidelines should be based on the premise that no demolition/eviction must be carried out without prior court order, which will safeguard the rights of the affected residents. This will also ensure all members of the affected community are equally informed. (RSGRVSG, with Advisory Group on Forced Eviction-AGFE / UN-HABITAT, and possibly current Special Rapporteur)
16. Establish a local urban observatory (LUO) for regular collection and analysis of human settlements data. (RSG, with UN-HABITAT’s Global Urban Observatory-GUO)
17. Enhance institutional capacity of locally-based NGOs and community groups to enable them to play a more pro-active role in popular awareness campaigns, on environmental sustainability and on participatory urban planning, amongst other important urban development themes. (Various national and international actors)
18. Ensure appropriate linkage of all the above actions with the Master Plan for Greater Port Harcourt. (RSG)

Port Harcourt
Waterfront Urban Regeneration Scoping Study
The Port Harcourt Waterfront Urban Regeneration Scoping study outlines a long term, sustainable, urban plan-based solution to the current conflict of interest involving the Rivers State Government and residents of the Port Harcourt Waterfront communities whose neighbourhoods are under threat of demolition. It is intended to be the preliminary, scoping phase of a more extensive, in-depth main study to be undertaken in 2010, aimed at meeting needs both of the government and the existing population
View over Enithonia, Eche and Rex Lawson communities