Embed Size (px)
Citation preview

2 0 1 5 Y E A R I N R E V I E W
PORT OF ALBANY

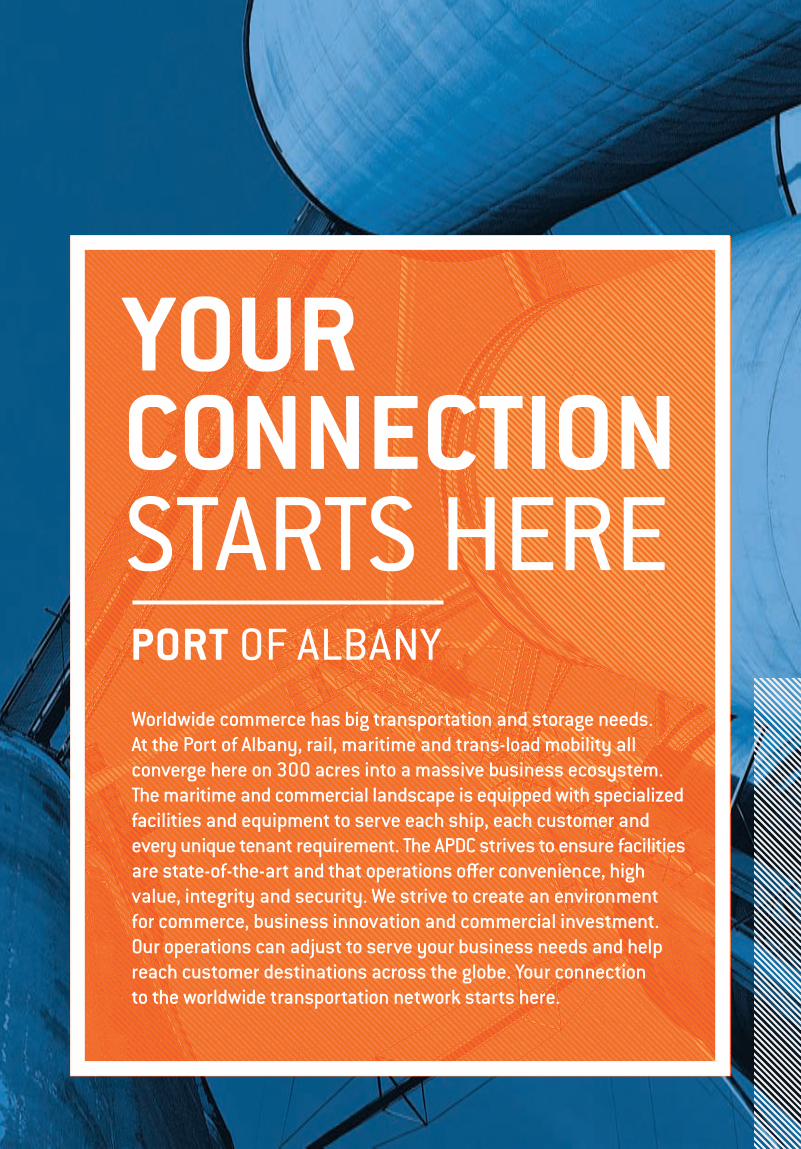
YOUR CONNECTION STARTS HERE PORT OF ALBANY
Worldwide commerce has big transportation and storage needs. At the Port of Albany, rail, maritime and trans-load mobility all converge here on 300 acres into a massive business ecosystem. The maritime and commercial landscape is equipped with specialized facilities and equipment to serve each ship, each customer and every unique tenant requirement. The APDC strives to ensure facilities are state-of-the-art and that operations offer convenience, high value, integrity and security. We strive to create an environment for commerce, business innovation and commercial investment. Our operations can adjust to serve your business needs and help reach customer destinations across the globe. Your connection to the worldwide transportation network starts here.

PG08 ALBANY PORT DISTRICT COMMISSION
The Port of Albany has one of the finest security systems in place for the maritime industry, a huge value for businesses that rely on safe handling and transport of their products. These security measures encompass the entire facility, offering a safe and secure environment for tenants. The Maritime Transportation Security Act of 2002 (MTSA) established certain requirements related to terminal access and vessel security for U.S. ports. The majority of security features in place at the Port of Albany are based upon practices and protocols required under the APDC’s Facility Security Plan, which was designed and implemented under the MTSA and regulated by the U.S. Coast Guard. The Port’s security team is so well regarded that they provide security services to neighboring private businesses along the Hudson River that are also under the jurisdiction of the U.S. Coast Guard.
The Port’s security team is comprised of highly qualified professionals with many years of law en-forcement experience. Safety, security and prevent-ing events is what the team does on a daily basis.
$5M INVESTMENT IN SECURITY
UPGRADES between 2010
and 2015, including
cybersecurity enhancements
SAFETY & SECURITY2015
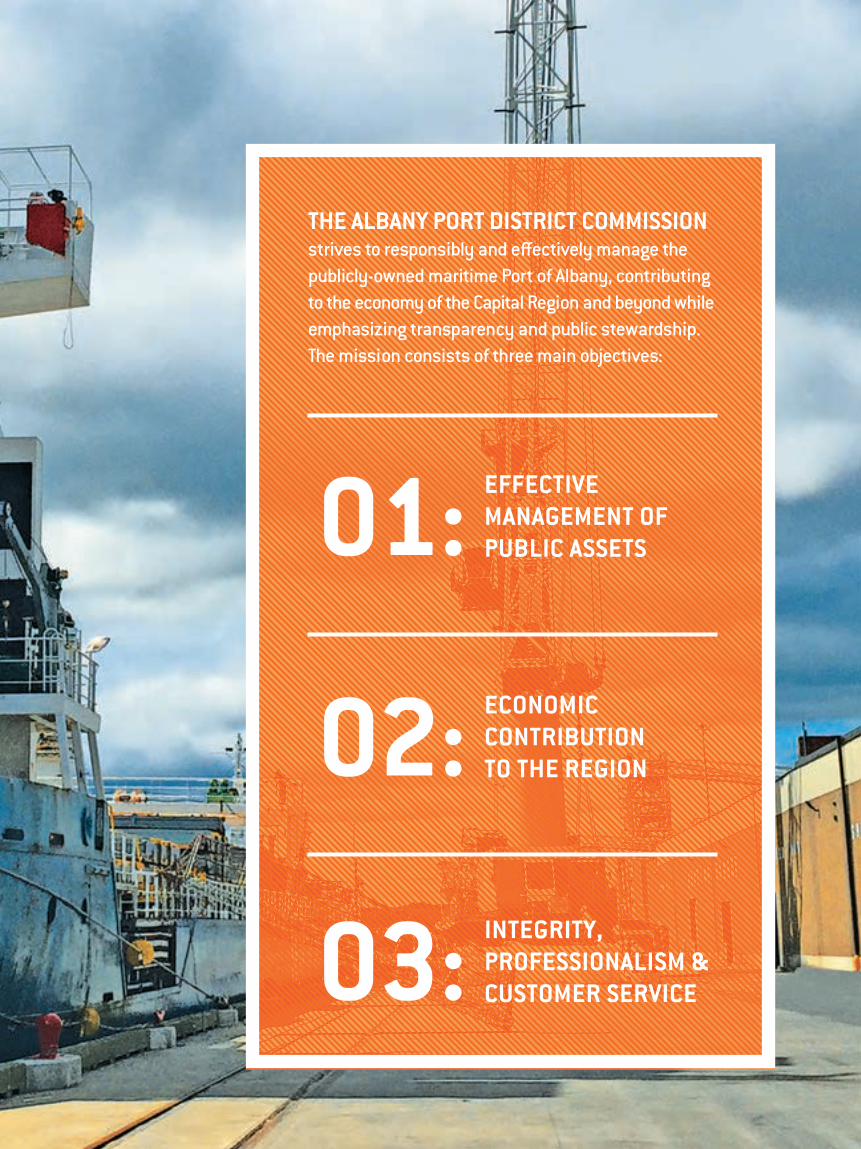
EFFECTIVE MANAGEMENT OF PUBLIC ASSETS
ECONOMIC CONTRIBUTION TO THE REGION
THE ALBANY PORT DISTRICT COMMISSION strives to responsibly and effectively manage the publicly-owned maritime Port of Albany, contributing to the economy of the Capital Regi on and beyond whi le emphasizing transparency and public stewardship. The missi on consists of three main objectives:
03:
02:
01:
INTEGRITY, PROFESSIONALISM & CUSTOMER SERVICE
WORLDWIDE TRANSPORTATION
NETWORK

WORLDWIDE TRANSPORTATION
NETWORK

PORT OPERATIONSThe Port of Albany is a year-round, 24-hour facility spanning 300 acres on the Albany and Rensselaer sides of the Hudson River. The Port generates an average of $800 million in regional and state-wide economic output annually and provides 1,400 jobs locally, and 4,500 jobs statewide, making it a significant component of the economic development in New York State. Operations include a range of tenant functions supported by critical multi-modal transportation resources. The Albany Port District Commission continually invests in infra-structure upgrades to ensure the Port remains a vital state-of-the-art resource, providing maximum value for customers who establish and grow their businesses here.
32 FT FRESHWATER DRAFT
2HEAVY LIFT mobile harbor cranes
MARITIME
51%JOB GROWTH from 2010-15 in maritime longshore labor hours worked
124NAUTICAL MILES north of New York Harbor, on the Hudson River
The marine terminal is the pivotal asset of the Port of Albany, with 5,400 linear feet of wharf on both sides of the Hudson River. This is an international port of entry with deep water facilities.
RAIL
20 MISTANDARD-GAUGE SWITCHING RAILROAD
3NORTH AMERICAN CLASS-ONE RAILROADS serviced by Albany Port Railroad
882,000 LB
12,000RAIL CAR MOVES inside the Port in 2015
The Port of Albany has accessible rail service throughout the facility, including excellent rail clearance which makes it a desirable destination for moving large dimensional and heavy lift cargo.
TRANS-LOAD
300K SQ FT
ON-SITEUS CUSTOMS & BORDER PROTECTION office expe-dites cargo clearance
105 MGALLON capacity bulk liquid storage
13.5 MBUSHEL capacity grain elevator, the largest in the Northeast US
Port facilities offer capacity to transfer a shipment from one mode of transportation to another in order to make the entire trip to its ultimate destination, often a necessity when goods are shipped internationally or in very high volume.
LAND USAGE
20ACRES of open maritime storage space
97%OCCUPATION of available space
300ACRES on the Albany and Rensselar shores of the Hudson River
23BUSINESS TENANTS
Approximately 85% of the APDC owned land is non-maritime and leased for business purposes. The APDC manages 21 non maritime tenant buildings and sustains a five-person, 40 piece equipment maintenance operation to serve the facility.
HEAVY LIFT rail capacity
of indoor maritime, sprinklered storage
2015
TH
E H
UD
SO
N R
I VE
R
CI T
Y O
F A
LB
AN
Y
CI T
Y O
F R
EN
SS
EL
AE
R
2
1
6
9
8
5
7
11
12
13
14
15
4
4
16
17
18
19
10
4
10
2
3 2022
23
21
PORT OF ALBANY PROPERTY
TENANT LOCATION
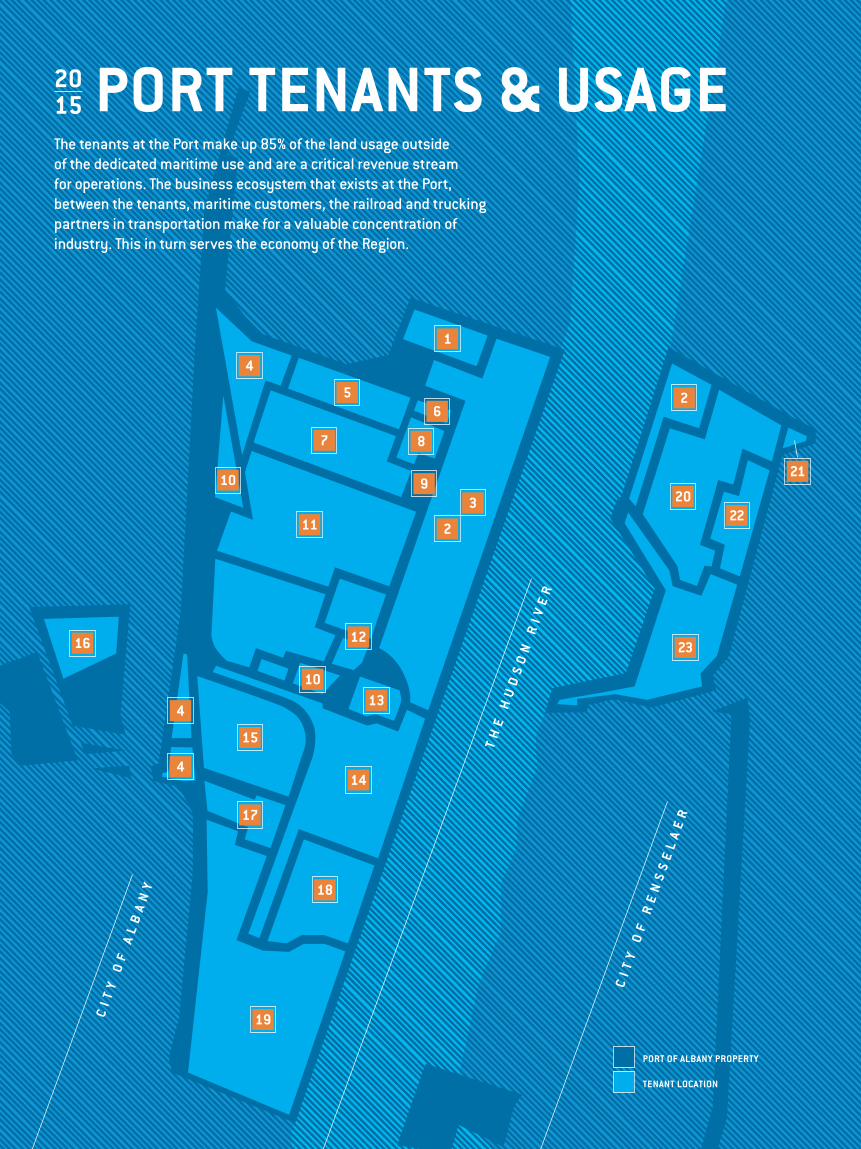
PORT TENANTS & USAGEThe tenants at the Port make up 85% of the land usage outside of the dedicated maritime use and are a critical revenue stream for operations. The business ecosystem that exists at the Port, between the tenants, maritime customers, the railroad and trucking partners in transportation make for a valuable concentration of industry. This in turn serves the economy of the Region.
2015
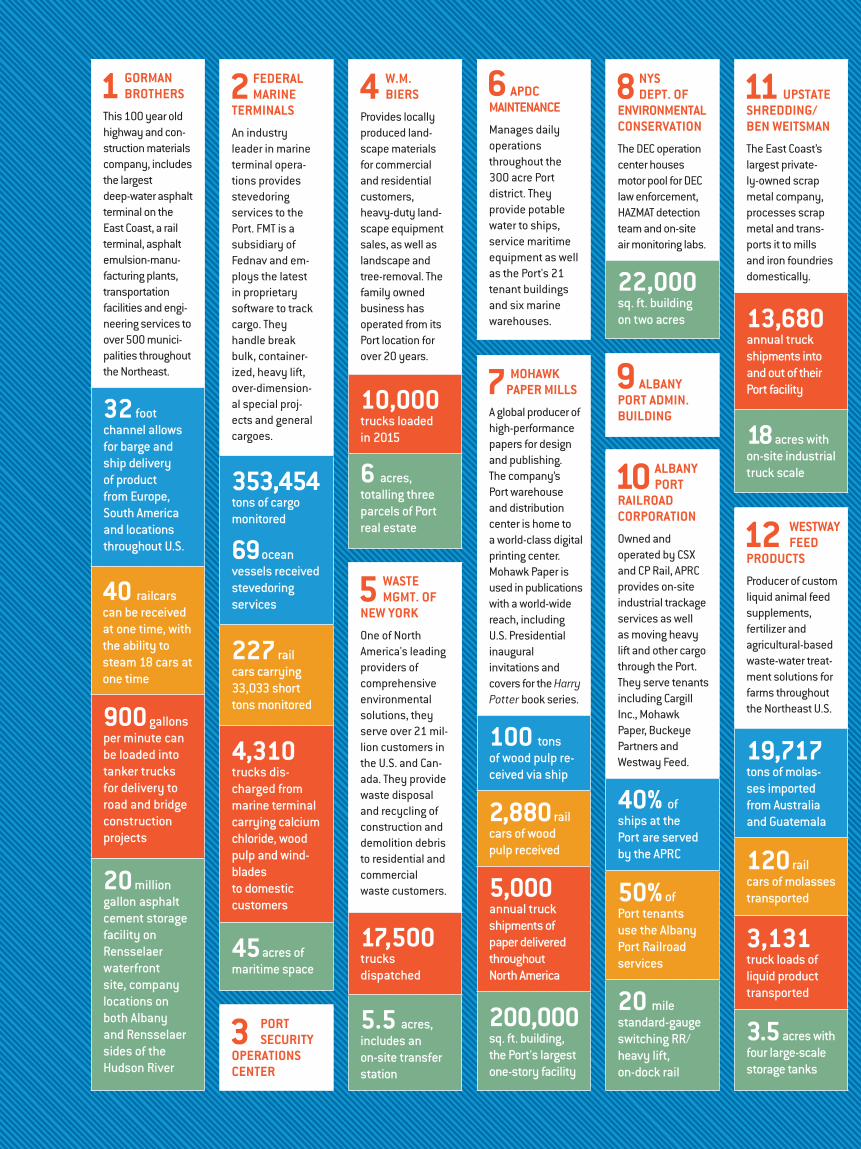
4 W.M. BIERS
Provides locally produced land-scape materials for commercial and residential customers, heavy-duty land-scape equipment sales, as well as landscape and tree-removal. The family owned business has operated from its Port location for over 20 years.
10,000 trucks loaded in 2015
6 acres, totalling three parcels of Port real estate
10 ALBANY PORT
RAILROAD CORPORATION
Owned and operated by CSX and CP Rail, APRC provides on-site industrial trackage services as well as moving heavy lift and other cargo through the Port. They serve tenants including Cargill Inc., Mohawk Paper, Buckeye Partners and Westway Feed.
40% of ships at the Port are served by the APRC
50% of Port tenants use the Albany Port Railroad services
20 mile standard-gauge switching RR/heavy lift, on-dock rail
5 WASTE MGMT. OF
NEW YORK
One of North America's leading providers of comprehensive environmental solutions, they serve over 21 mil-lion customers in the U.S. and Can-ada. They provide waste disposal and recycling of construction and demolition debris to residential and commercial waste customers.
17,500 trucks dispatched
5.5 acres, includes an on-site transfer station
1 GORMAN BROTHERS
This 100 year old highway and con-struction materials company, includes the largest deep-water asphalt terminal on the East Coast, a rail terminal, asphalt emulsion-manu-facturing plants, transportation facilities and engi-neering services to over 500 munici-palities throughout the Northeast.
32 foot channel allows for barge and ship delivery of product from Europe, South America and locations throughout U.S.
40 railcars can be received at one time, with the ability to steam 18 cars at one time
900 gallons per minute can be loaded into tanker trucks for delivery to road and bridge construction projects
20 million gallon asphalt cement storage facility on Rensselaer waterfront site, company locations on both Albany and Rensselaer sides of the Hudson River
12 WESTWAY FEED
PRODUCTS
Producer of custom liquid animal feed supplements, fertilizer and agricultural-based waste-water treat-ment solutions for farms throughout the Northeast U.S.
19,717 tons of molas-ses imported from Australia and Guatemala
120 rail cars of molasses transported
3,131 truck loads of liquid product transported
3.5 acres with four large-scale storage tanks
2 FEDERAL MARINE
TERMINALS
An industry leader in marine terminal opera-tions provides stevedoring services to the Port. FMT is a subsidiary of Fednav and em-ploys the latest in proprietary software to track cargo. They handle break bulk, container-ized, heavy lift, over-dimension-al special proj-ects and general cargoes.
353,454 tons of cargo monitored
69 ocean vessels received stevedoring services
227 rail cars carrying 33,033 short tons monitored
4,310 trucks dis-charged from marine terminal carrying calcium chloride, wood pulp and wind-blades to domestic customers
45 acres of maritime space
8 NYS DEPT. OF
ENVIRONMENTAL CONSERVATION
The DEC operation center houses motor pool for DEC law enforcement, HAZMAT detection team and on-site air monitoring labs.
22,000 sq. ft. building on two acres
3 PORT SECURITY
OPERATIONS CENTER
6 APDC MAINTENANCE
Manages daily operations throughout the 300 acre Port district. They provide potable water to ships, service maritime equipment as well as the Port's 21 tenant buildings and six marine warehouses.
9 ALBANY PORT ADMIN. BUILDING
7 MOHAWK PAPER MILLS
A global producer of high-performance papers for design and publishing. The company’s Port warehouse and distribution center is home to a world-class digital printing center. Mohawk Paper is used in publications with a world-wide reach, including U.S. Presidential inaugural invitations and covers for the Harry Potter book series.
100 tons of wood pulp re-ceived via ship
2,880 rail cars of wood pulp received
5,000 annual truck shipments of paper delivered throughout North America
200,000 sq. ft. building, the Port's largest one-story facility
11 UPSTATE SHREDDING/ BEN WEITSMAN
The East Coast’s largest private-ly-owned scrap metal company, processes scrap metal and trans-ports it to mills and iron foundries domestically.
13,680 annual truck shipments into and out of their Port facility
18 acres with on-site industrial truck scale

13 SAM GRECO
CONSTRUCTION
General contractor specializing in commercial construction, design and build management. Greco Construc-tion's woodwork-ing division, MMC Millwork, are master craftsmen specializing in architectural and custom woodworking.
20,000 sq. ft. building on two acres
14 CARGILL GRAIN
The Port's longest residing tenant, operates a 13.5 million bushel grain elevator at the Port, handles 26.5 million bushels of grain annually.
701,736 metric tons of grain to international ports
7,153 rail cars of grain and corn received
5,778 truck loads of grain shipped to Northeast farms
10+ acres with dedicated wharf access for grain ships
15 ARDENT MILLS
Using raw product provided by Port tenant Cargill Grain, Ardent Mills converts grain and corn into a broad range of flours, mixes and specialty food products. The finished milled goods are distributed to bakeries, retail grocery, restaurants, and pizza shops throughout New York State.
15,600 truck loads of flour shipped annually
12 acres with food-grade grain conversion facility
16 DURHAM SCHOOL
SERVICES
Repair and dispatch oper-ation of school bus services for the City School District of Albany.
130 school bus fleet dispatched daily to transport 4,000–4,500 public and private school students
6 acres with garage and on-site bus repair facility
17 CARGILL NUTRENA
A worldwide provider of animal nutrition, the ware-house and distri-bution center at the Port converts grain product from Cargill Grain into high-quality live-stock feed serving farms throughout the Northeast.
2,880 truck loads of processed feed shipped to Northeast farms
3.75 acres adjacent to Cargill Grain and Ardent Mills includes an underground conveyor system which transports grain to be converted into livestock feed
19 BUCKEYE PARTNERS
One of the larg-est independent liquid petroleum products pipe-line operators in the United States. The marine crude oil and refined petroleum products storage facility in the Port of Albany provides storage and transport of crude oil and re-fined petroleum products to East Coast refineries, where they are blended with fuel for American auto consumers.
21 million gallons of ethanol transported by barge
160 average number of rail cars of ethanol transported per month
7,280 ttruckloads of ethanol transported to East Coast refineries
30+ acres, includes 40+ on-site liquid storage tanks, the Port's largest land user
20
RENSSELAER IRON & STEEL
One of three port locations on the Eastern Seaboard, this family owned scrap metal recycling facility, exports scrap metal from Capital Region retail customers via ship to international ports including Turkey and Mexico. There it is recycled into re-bar steel for construction and metal for vehicle manufacturing.
174,835 tons of scrap shipped to ports worldwide
17 acres of waterfront with direct wharf access in the Port's Rensselaer district
22
CCI RENSSELAER
104 megawatt capacity electric power generation facility. The op-eration uses a Westinghouse combustion turbine, heat recovery steam generator, and steam turbine, and has dual-fuel capability using natural gas or fuel oil and interconnects into the New York Indepen-dent System Operator.
5 acres in the Port's Rensselaer district
21
NORMAL TRUCK & TRAILER
Provides inspection and repair services for petroleum tankers and other heavy-load tractor trailer trucks.
13,000 sq. ft. facility in the Port's Rensselaer district
23
NEW CASTLE ASPHALT
Provider of state-of-the-art asphalt pro-duction for use by commercial construction contractors.
10,500 trucks loaded in 2015
9 acres of waterfront in the Port's Rensselaer district, with on-site aggre-gate silos and asphalt mixer providing direct truck loading
18 CALLANAN
INDUSTRIES
The Port's newest tenant, Callanan Industries provides aggregate and construction ser-vices to regional and statewide commercial contractors specializing in bridge and road construction projects.
8.5 waterfront acres includes an aggregate silo and asphalt mixer to directly load dump trucks

ALBANY PORT DISTRICT COMMISSION PG09
The Port Security team regularly conducts safety drills and invites law enforcement leaders from the capital region as well as Port tenants and stakehold-ers to participate. Drills include representatives from the U.S. Coast Guard, CSX, CP Rail, City of Albany Fire and Police, Albany County Hazmat response team based at the Watervliet Arsenal and representatives from Port businesses. The team meets to discuss safety set ups and even mock safety events to run practice drills. In 2015, at a minimum, this team held quarterly region-wide safety preparedness drills. They also regularly host a training “train class-room” which takes place on the docks of the Port. Five rail cars with hazardous product are staged
35NYS LICENSED SECURITY FORCE oversees and enforces security operations
24/7 VIDEO SURVEILLANCE monitoring throughout the Port District
for safety drills and all representatives—including every shift from the Albany Fire Department— participates. This allows every member of the district a real life opportunity to experience what is required in the event of an emergency.
The Security Port team has won awards and received recognition for the highest standards in safety on a number of occasions. Perhaps the most prestigious award was from the United States Coast Guard’s Area Maritime Security Committee, where the Port of Albany was recognized together with the Port of New York and New Jersey for outstand-ing achievements in safeguarding the Marine Transportation System.
100%COMPLIANCE with the U.S. Maritime Transportation Security Act of 2002
The award-winning Albany Port Security team is comprised of professionals with the highest qualifications and years of experience in law enforcement. Safety, security and preventing events are what the team does on a daily basis.
Port Security regularly interfaces with all local and regional law en-forcement officers for safety drills and security measures.
31356 Port of Albany_TEXT.indd 9 4/22/16 10:32 AM

PG10 ALBANY PORT DISTRICT COMMISSION
RICHARD J. HENDRICK, SR. GENERAL MANAGER of the Albany Port District Commission, serves on the Board of Commissioners of Pilots of the State of New York. In 2015, Hendrick was elected to the Board of Directors of the American Association of Port Authorities (AAPA) United States—North Atlantic Ports.
31356 Port of Albany_TEXT.indd 10 4/22/16 10:32 AM

ALBANY PORT DISTRICT COMMISSION PG11
YEAR IN REVIEW2015
31356 Port of Albany_TEXT.indd 11 4/22/16 10:32 AM
PG12 ALBANY PORT DISTRICT COMMISSION
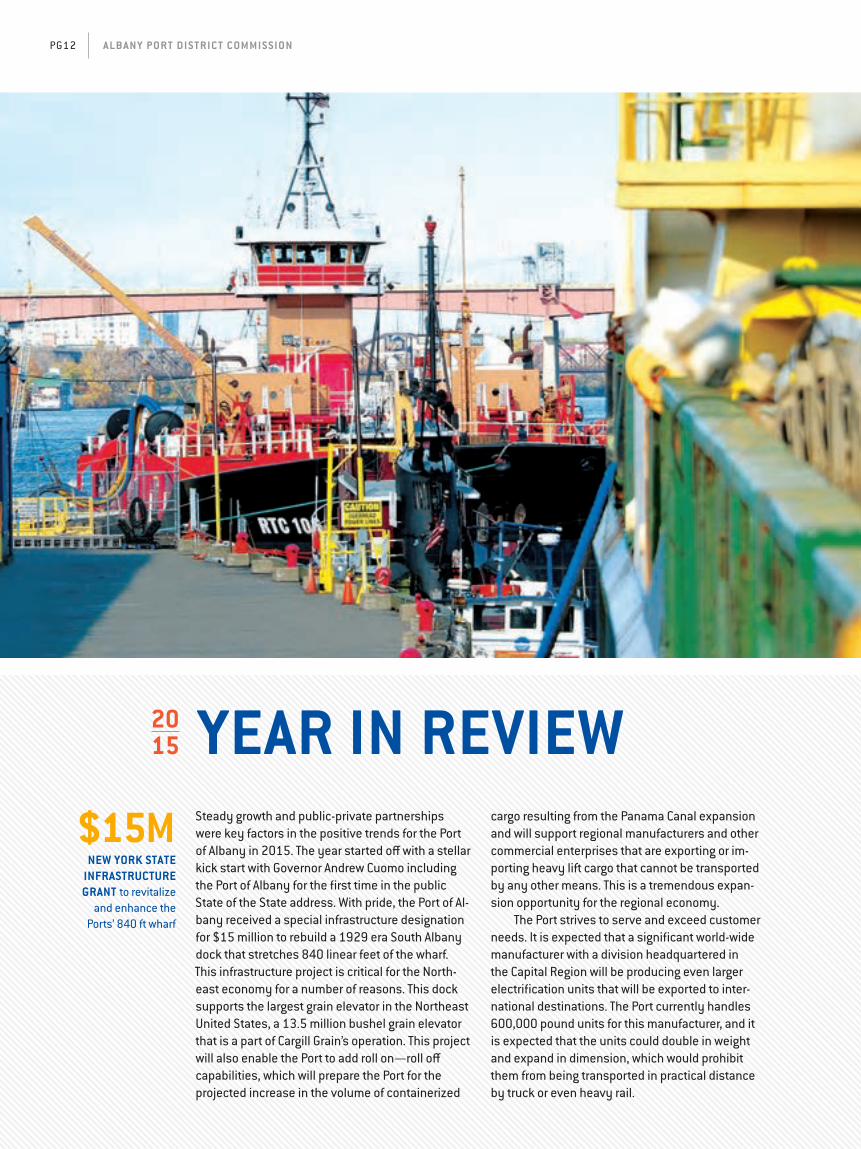
Steady growth and public-private partnerships were key factors in the positive trends for the Port of Albany in 2015. The year started off with a stellar kick start with Governor Andrew Cuomo including the Port of Albany for the first time in the public State of the State address. With pride, the Port of Al-bany received a special infrastructure designation for $15 million to rebuild a 1929 era South Albany dock that stretches 840 linear feet of the wharf. This infrastructure project is critical for the North-east economy for a number of reasons. This dock supports the largest grain elevator in the Northeast United States, a 13.5 million bushel grain elevator that is a part of Cargill Grain’s operation. This project will also enable the Port to add roll on—roll off capabilities, which will prepare the Port for the projected increase in the volume of containerized
cargo resulting from the Panama Canal expansion and will support regional manufacturers and other commercial enterprises that are exporting or im-porting heavy lift cargo that cannot be transported by any other means. This is a tremendous expan-sion opportunity for the regional economy.
The Port strives to serve and exceed customer needs. It is expected that a significant world-wide manufacturer with a division headquartered in the Capital Region will be producing even larger electrification units that will be exported to inter-national destinations. The Port currently handles 600,000 pound units for this manufacturer, and it is expected that the units could double in weight and expand in dimension, which would prohibit them from being transported in practical distance by truck or even heavy rail.
$15M NEW YORK STATE
INFRASTRUCTURE GRANT to revitalize
and enhance the Ports’ 840 ft wharf
YEAR IN REVIEW2015
31356 Port of Albany_TEXT.indd 12 4/22/16 10:32 AM

ALBANY PORT DISTRICT COMMISSION PG13
[New York State] will invest in our port infrastructure and waterways, and support our fast-growing distribution and logistics cluster, to make sure that our companies and entrepreneurs are able to respond to external opportunities and have better access to critical inputs. Upon implementation, this strategy will have created between 11,500–13,100 jobs and approximately $1.6B in GDP over its first five years.
–GOVERNOR ANDREW CUOMO, FROM THE 2015 STATE OF THE STATE ADDRESS
“
”31356 Port of Albany_TEXT.indd 13 4/22/16 10:32 AM

PG14 ALBANY PORT DISTRICT COMMISSION
With roll-on roll-off capabilities (also known as ro-ro) the larger dimension and heavy lift units can be transferred right from barge to dock and from dock to ship. The Port leaders are excited to offer regional manufacturers the ability to innovate their production and still have their international trans-portation needs served. By keeping up with these needs, it is understood that the regional division headquarters will retain the production in the Capi-tal Region, versus it being transferred to a southern United States location. The Port is committed to be-ing a leader in the Upstate economy, and this is a testament to the partnership that makes it possible.
In terms of public-private partnerships, an exciting and potentially historic one for the Port to be a part of in 2015, was the Capital Region Eco-nomic Development Council’s (CREDC) submission for the Governor’s Upstate Revitalization Initiative (URI) competition. The URI competition encouraged regions to develop a strategy that would promote
decisive and innovative growth in their economy that would compound for years to come. Seven of the ten Regional Economic Development Councils were eligible to compete for three winning awards of $500 million to aid in implementing their winning strategic plans.
The Port was a prominent component of the Capital Region’s plan; representing potential growth in one of the five major strategies of the plan. Strat-egy 2: Gateway: Connecting Markets and Business-es identified the geography of the Capital Region, a position that has empowered us to become a distribution and logistics hub.
As described in the plan, this strategy “…will invest in our port infrastructure and waterways, and support our fast-growing distribution and logistics cluster, to make sure that our companies and entrepreneurs are able to respond to external opportunities and have better access to critical inputs. Upon implementation, this strategy will have created between 11,500-13,100 jobs and approximately $1.6B in GDP over its first five years.”
$4M AWARDED BY
NEW YORK STATE to assist the Port of
Albany in construction of $8M “Big Lift”
maritime operations warehouse facility.
When completed, the specialized warehouse
will service regional manufacturers with
their international transport operations
requirements
Year in Review (CONTINUED)
31356 Port of Albany_TEXT.indd 14 4/22/16 10:32 AM

ALBANY PORT DISTRICT COMMISSION PG15
Modernizing and expanding the Port of Albany is key to this strategy. Recognizing the Port of Albany’s contribution to the regional economy, and connection to the global economy recognizes the Port’s capacity to offset the Port of New York and New Jersey’s potential congestion with the expansion of the Panama Canal to bring business to Upstate New York.
Utilizing more than 95% of its available land, the APDC leadership has identified the need to modernize and expand the Port of Albany to achieve its future growth potential. By joining the CREDC regional plan, the Port compounded its potential benefits by interlinking with the regional business community.
While the CREDC’s strategy was not awarded the winning URI, the Port and many other Capital Region projects were selected for project awards that will advance the plan's overall strategy. The APDC was awarded $4 million to assist in the cost of constructing an $8 million Big Lift maritime operations warehouse facility to service an
international manufacturing concern. In addition, the APDC Board has taken steps to further its expansion plan and expects investments toward this path over the next several years.
840 FTOF DEEP WATER WHARF accommodates ships and barges up to 750ft, providing support to Cargill’s grain elevator facility as well as to a number of tenants who utilize the Port’s deep water marine facilities for importing and exporting goods and materials
31356 Port of Albany_TEXT.indd 15 4/22/16 10:32 AM

PG16 ALBANY PORT DISTRICT COMMISSION
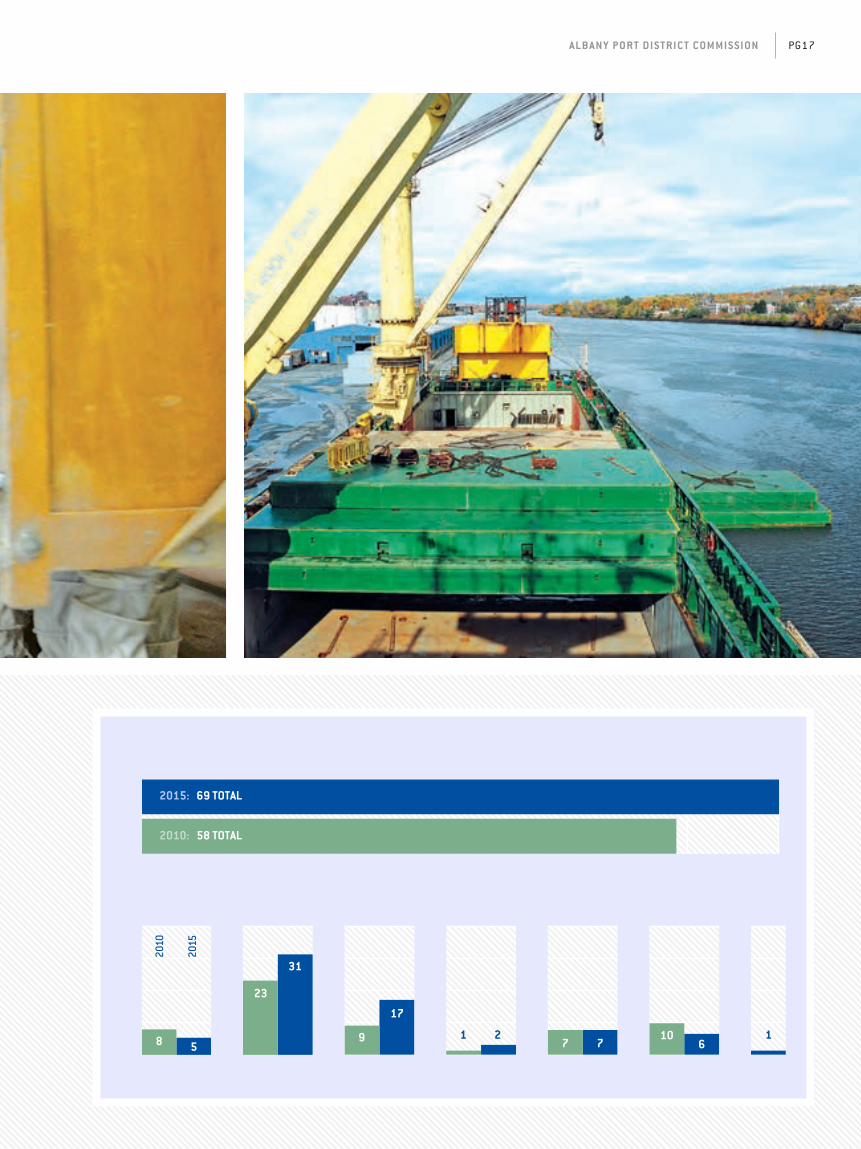
Business growth, commerce activity and customer or partner relationships have all been heading in the right direction at the Port of Albany. In the past five years, the economic indicators that the APDC tracks for maritime operations show stability and steady increases. Specifically, the Port operations have supported steady ship activity, tonnage crossing the wharf and longshore labor hours. Over a five year period (2010-2015), the Port achieved a 15% increase in vessel calls at the Port, and a 50% increase in longshore hours worked. This third indicator is perhaps the most exciting, doubling longshore labor hours worked. This means more people working more hours, to accomplish the work at the Port. This also means more employment opportunities for the region.
Other measures show business is trending successfully at the Port as well. In 2015, APDC’s net position grew by nearly $540,000 as a result of op-erating income for 2015 and capital project funding. Another important indicator; maritime equipment utilization was up as well. Revenue derived from crane and equipment rentals increased by almost
100% MANAGEMENT PRACTICE COMPLIANCE of public authority laws and regulations as determined by the New York State Office of the State Comptroller
$540K 2015 GAIN IN NET
POSITION over 2014 fiscal year due to
increased operating income and capital
project funding
BUSINESS GROWTH20102015
31356 Port of Albany_TEXT.indd 16 4/22/16 10:32 AM
ALBANY PORT DISTRICT COMMISSION PG17
Ship and Barge Traffic: 2010 & 2015
GRAIN HEAVY LIFT /PROJECT
HEAVY LIFT/ BARGES
MOLASSES/ FERTILIZERS
SCRAP IRON WOODPULP OTHER
40
30
20
10
05
9
23
31
17
8 7101 1
7 62
2015
2010
0 10 20 30 40 50 60 70
2010: 58 TOTAL
2015: 69 TOTAL
31356 Port of Albany_TEXT.indd 17 4/22/16 10:32 AM

PG18 ALBANY PORT DISTRICT COMMISSION
double in 2015, another reflection of a healthy year on the docks. The Port has been adding new cus-tomers and new commodities as well. Shipments of wind blades and calcium chloride increased longshore labor and filled the maritime yard for several months of the year. Over 5,500 tons of calcium chloride came in by ship and was then trucked out to various locations in the northeast. In addition, FMT moved 12 rail cars and 1,710 short tons of wind blades out of the Port to des-tinations in Upstate NY. These new and growing commodity movements are the result of persistent business development work and building strong customer relationships.
Outside of the maritime operations, the Port welcomed another new tenant and also tracked all around increases in tenant investments in facilities and operations. The APDC tracked combined invest-ments of over $106 million by the Commission and Port tenants over the past five years. These
Business Growth (CONTINUED)+50%LONGSHORE HOURS increased from 2010
to 2015, fulfilling vital Port services
and providing critical jobs in 2015
+15% INCREASE IN
VESSEL CALLS from 2010 to 2015
Longshore Hours Worked: 2010 & 2015The amount of longshore hours is a vital business indicator for the Port and its' partners measuring the amount of work performed on the site each year.
70,000
60,000
50,000
40,000
30,000
20,000
10,00
0
60,803
2015
29,587
2010
31356 Port of Albany_TEXT.indd 18 4/22/16 10:32 AM

ALBANY PORT DISTRICT COMMISSION PG19
measures are an extremely positive sign of the healthy environment and center of commerce that exists in the Port district.
The APDC team is proud of this healthy business environment that has been fostered in the district, and is especially proud of the integrity and good business practice recognition the APDC is also achieving. A key demonstration of this is during 2015, certain financial manage-ment practices of the APDC were audited by the New York State Office of the State Comptroller (OSC). After a rigorous review and extensive on-site field work, OSC found that the reviewed practices complied with APDC procedures and related laws and regulations. While this may sound like a modest result, this is remarkable in the world of public authorities and audit re-views. This is a testament to the level of professionalism and integrity that the APDC team strives for and is achieving.
200%INCREASE IN REVENUE FROM CRANE AND EQUIPMENT RENTAL in 2015 over rental revenue in 2014
31356 Port of Albany_TEXT.indd 19 4/22/16 10:32 AM

PG20 ALBANY PORT DISTRICT COMMISSION
The APDC regularly maintains and upgrades infrastructure systems in the maritime terminal as well as all other areas of the facility in order to provide quality and sustainable operations. This is a mighty task, with the size and depth of infrastruc-ture systems necessary throughout the 300 acre district. However, it has proven to be an effective way to attract and increase commerce at the Port. For example, the APDC invested in a second mobile harbor crane in 2014. That new crane quickly be-came integral to operations, and overall crane use more than doubled in 2015; a testament to both the active business on the docks in 2015 and the value of investing in infrastructure.
In other maritime investments, in 2015, the APDC undertook a $2.4 million dredging project to remove approximately 5,000 cubic yards of material adjacent to the Rensselaer Wharf that was reconstructed in 2014. The project was critical to achieve a draft of 32 feet in the area, enough to safely berth commercial vessels that would load and unload substantial product.
In general facility investments, the APDC began remediation work on an approximately 12 acre site in southern portion of the Albany side of the facility. The APDC is working in cooperation with a previous com-mercial tenant that was located at the site and with state and federal agencies in anticipation of a future
INFRASTRUCTURE INVESTMENTS
$106M INFRASTRUCTURE
INVESTMENTS made by Port Commis-
sion and tenants to improve and expand
operations throughout the Port District
2015
31356 Port of Albany_TEXT.indd 20 4/22/16 10:32 AM

ALBANY PORT DISTRICT COMMISSION PG21
reuse of the site. The goal is to reach a new long-term lease for the site during the second half of 2016.
In order to manage daily operations throughout the 300 acre Port district, the APDC has an on-site ful-ly equipped maintenance shop and team. The crew of five, including an experienced and dependable foreman, are responsible for overseeing and main-taining 21 tenant buildings, six marine warehouses and 300,000 square feet of covered storage facilities. Maintenance provides potable water for ships and services all maritime equipment and terminal needs. The APDC maintenance operation includes over 40 pieces of heavy equipment necessary for maritime operations as well as general industrial facility usage for district-wide utilization. In 2015, the APDC invest-ed in a new loader, critical to operations on the docks.
Finally, during 2015, the APDC executed agree-ments with the cities of Albany and Rensselaer to provide fire and related emergency services to the APDC. In terms of infrastructure, bolstering protection of the overall Port District by partnering with the host cities was a huge investment by the Port Operations.
144 TLIEBHERR HEAVY-LIFT MOBILE CRANE addition to operations, positions the Port of Albany as a leader among in-land ports in the United States for heavy lift and project cargo handling
31356 Port of Albany_TEXT.indd 21 4/22/16 10:32 AM

PG22 ALBANY PORT DISTRICT COMMISSION
ALBANY PORT RAILROAD CORPORATIONThe Albany Port Railroad operates a responsive and efficient switching service to CSX and Cana-dian Pacific Railroads and is owned jointly by CSX and CP Railroads. The service is critical for most of the tenants of the Port of Albany, either moving cargo into the terminal or moving it within the terminal between tenants. The APRC also provides service to a large portion of the ships that come to the Port of Albany, and is capable of moving heavy
lift and large cargo movements. The service they provide opens the door for moving a lot of goods that otherwise could not be moved by other means of transport. This is key for the multi-modal service that makes the Port a destination for commerce. The APRC is comprised of a small, but mighty team of six men and women. In 2015 the team got a new leader that has been a breath of fresh air for the company and the tenant relationships.
TENANT HIGHLIGHTS2015
THE ALBANY PORT RAILROAD TEAM: Paul Yakel, Clerk; Tommy Vogt, Foreman; Stephen Cassick, Conductor; Paul Hayes Sr., Engineer (top); Dave Campbell, Foreman; Lorraine LaCorte, Manager; and John Gaylord, General Manager
ALBANY PORT RAILROAD WELCOMES NEW GENERAL MANAGER
John Gaylord joined Albany Port Railroad as General Manager in 2015. Gaylord has over
23 years of service in the railroad industry. He most recently came from CSX in Jackson-ville, FL where he was for nearly two years. Before that he was Albany Division Manag-er at CSX Transportation, overseeing regional operations for a critical part of the CSX network. There, he managed a 60 person team. Throughout his CSX career, Gaylord has been in locations throughout the U.S., including Albany, NY; Jacksonville, FL; Louisville KY and Cincinnati OH. Gaylord has been a leader in CSX and the Port is thrilled to have his ex-perience and integrity at the Port of Albany.
31356 Port of Albany_TEXT.indd 22 4/22/16 10:32 AM

ALBANY PORT DISTRICT COMMISSION PG23
5,900JOBS provided in 2015 by tenants in their Port and statewide locations
$80MWAGES & BENEFITS paid annually by port tenants to their employees
$3MREVENUE generated annually from tenant leases
255 ACRES of dedicated real estate utilized by Port tenants and related support services
SAM GRECO CONSTRUCTIONSam Greco Construction has been located in the Port of Albany for nearly 40 years. Since the business first started they have tripled the size of their foot-print in the Port and added a second business line to their operation. The company is a general contractor specializing in commercial construction, design/build, construction management and architectural millwork. They provide quality building services whether it is building maintenance, renovations, large or small construction or a new building. Greco Construction’s woodworking division, MMC Millwork,
had a tryout with New York Yankees and made it to the final cut of 25 players from 350.
Greco leads the nearly 40-year-old company, overseeing all employees, management and job progress. Greco has a reputation within the Port for his involvement in all meetings and events, bringing a positive attitude and willingness to con-tribute in any way to help the greater community.
CALLANAN INDUSTRIESIn 2015, Callanan Industries, Inc. became the Port of Albany’s newest tenant. The company acquired Albany Asphalt, a longstanding tenant of the Port along the Albany docks of the Hudson River. During the business acquisition, Callanan was approved by the Albany Port Dis-trict Commission to take over the nearly 10-acre lease to operate the site in the southern portion of the Port district in Albany. The lease with APDC expires on December 31, 2031.
Callanan, one of the region's oldest— and largest—suppliers of aggregate, asphalt and concrete products and construction ser-vices, is best known for major road building proj-ects and for supplying concrete for such super projects as Empire State Plaza, Crossgates Mall and GlobalFoundries. During the peak road-build-ing season in the summer, the company employs 600 people. With the addition of the Port facility, Callanan Industries and its affiliated companies operate approximately 40 locations, supplying quality New York State-approved aggregate, hot mix asphalt and readymix concrete for infrastruc-ture, building and home projects throughout an operational area that extends from the Orange/Sullivan County region in the south, northward to the Glens Falls/Warren County area and westward from the Capital District to the Utica/Syracuse region of the Empire State. In addition, the company extended its service area through-out the Berkshires in Western Massachusetts.
Since the acquisition of the business and take-over of the site at the Port, Callanan has already invested $500,000 in the facility. This has included operational upgrades, as well as great improvements to the appearance of the site. While the facility does not currently use water access, the company has said it would look at using the river to move its products in the future. Approximately 20 dedicated staff are on site. The company has already become a great addition to the Port’s business community.
are master craftsmen specializing in architectural and custom woodworking. The company start up goal was simple: “to provide our clients with a quality product at a fair price and to give assurance of a per-sonal guarantee that would become our trademark for our success.” Greco has gained a reputation for delivering the most demanding contracts on time and within budget. Greco has been involved in hun-dreds of regionally notable projects, including the first Hilton Garden Inn in the revitalized Park South adjacent to the Albany Medical Campus.
Sam Greco Construction is a family-owned small business with a big presence in the Capital Region business community. Their client list extends throughout New York State and the tri-state area.
The company and their leadership, are also integral to the civic community in the region. In 2015, Sam Greco, Jr. was inducted in Sage Colleges, Athletic Hall of Fame. During his '62–'64 seasons playing on the men’s basketball team at Sage Ju-nior College of Albany, Greco distinguished himself with his speed and tenacity. He was a team MVP, a leading scorer and also shot a record setting 91% from the free throw line. Following his time at Sage Junior College of Albany, Greco signed an offer to play baseball with the San Francisco Giants and
SAM GRECO, JR. President of the family-owned busi-ness, was inducted in January 2016 into the Sage College Athletics Hall of Fame for basketball and baseball achievements in the 1962-64 seasons.
31356 Port of Albany_TEXT.indd 23 4/22/16 10:32 AM

PG24 ALBANY PORT DISTRICT COMMISSION
honored to be a part of this collaborative project. The APDC is proud to participate in the annual
Waterford Tugboat Roundup, which is known as the place “where maritime history comes alive”. The APDC sends the Port’s vessel “Spirit of Albany” and is a sponsor of the weekend long event. Waterford’s historic waterfront is transformed back into a ren-
The APDC is commit-ted to increasing commerce, and is dedicated to being a good community partner. The Port of
Albany often hosts community tours, including stu-dent visits, leadership tours and visiting dignitaries. The Port also participates in external regional meet-ings, civic endeavors and Chamber of Commerce events. Together, these are excellent opportunities to promote Port activities and inform the public about what takes place at the Port, and the role it plays in the economy and the consumer ecosystem.
In 2015, the Port was honored to be included in Capital Region in 50 Objects, an exhibit at the Albany Institute of History and Art which tells the story of the Capital Region and the origin of its identity through the portrayal of 50 objects. The Port of Albany contributed an artifact and historical images to the exhibit which highlights the history and early prominence the Port played in the development of the modern world. The Port team is
COMMUNITY PARTNERS2015
The Port of Albany is a proud sponsor of the “Head of the Hudson,” Albany Rowing Center's annual regatta.
Swedish ship unloading wood pulp, 1932 from Capital Region in 50 Objects exhibit at the Albany Institute of History and Art
31356 Port of Albany_TEXT.indd 24 4/22/16 10:32 AM

ALBANY PORT DISTRICT COMMISSION PG25
dering of its commercial heyday where tugs new and old moor stem to stern. In addition to tours of the vessels and other displays, there is an ample supply of music, food, children’s activities, vendors, boat rides, fireworks, and family fun. The festival attracts thousands of people to New York’s Capital Region. The Port provides children’s programming in part-nership with Historic Cherry Hill and the Albany Visitors Center. The “Hudson River Trading Game and Navigating the Seas,” invites fifth grade students from the City School District of Albany to discover 18th century trade and travel experiences on a 34-foot game board and a planetarium show which explains how 18th century sailors navigated the seas using the stars and constellations as their guide. The program received an “Award of Merit for Excellence and Innovation" from the Museum Association of New York.
ALBANY MARITIME MINISTRY is an ecumenical group of volunteers who provide for the spiritual, personal and practical needs of mariners arriving in and around the Port of Albany through acts of hospitality and welcome. Founded in 1995, the Ministry provides a vital link to essential services for visiting seafarers from around the world. Albany Maritime Ministry is incorporated under the laws of NYS, is a Federal 501c3 organization working closely with a variety of congregations, businesses and city, state and federal agencies throughout the Capital Region. Reverend William G. Hempel, pastor emeritus of St. Paul's Evangelical Lutheran Church in the City of Albany, serves as chaplain and director of the ministry.
31356 Port of Albany_TEXT.indd 25 4/22/16 10:32 AM

PG26 ALBANY PORT DISTRICT COMMISSION
360,000 SQ FT
TOTAL PORT MARITIME WAREHOUSE SPACE BY 2017
The Port’s maritime warehouse capabilities include 1,200 psf
floor capacities, high bays, rail siding access, climate
controlled, security surveillance and alarmed,
and overhead lift ability.
31356 Port of Albany_TEXT.indd 26 4/22/16 10:32 AM

ALBANY PORT DISTRICT COMMISSION PG27
LOOKING AHEAD2016
As the Port district continues to grow and change, the APDC must grow and change too. The Port of Albany has distinguished itself as a premier partner in the Upstate NY economy and connection to the worldwide transportation network. The Port Administration has proven over time the ability to evolve to serve the needs of the regional and global economies and consumers. Over the past few years, the Port has achieved many advancements in performance, infrastructure upgrades, customer relations and prominence.
The APDC is yet again at a point of evolving to the next level. With that in mind, 2016 is a year of action. An exciting initiative the Port is undertaking in 2016 is a Strategic Assessment & Growth Strat-egy Development plan utilizing a world-class team of port planners, engineers and economic analysts. The goal is to understand market opportunities while identifying the best potential growth trajec-tories. This may include identifying the best way to poise the Port of Albany to support a container on barge service with the Port of New York & New Jer-sey to offset the congestive effects of the Panama Canal Expansion and new large scale vessels. The Port of New York & New Jersey serves as the gate-way to one of the most concentrated and affluent consumer markets in the world. It is the largest port
on the East Coast and the third largest in the nation. The Port of Albany is a steady and capable partner to assist in the expected growth that would bring business Upstate. As the Port of Albany is investing and growing, it is imperative to take prudent steps, justify use of resources and make bold, yet smart moves that create economic and employment opportunities for the Capital Region and beyond.
In 2016, the Port will begin the construction phase of a $15 million south wharf reconstruction project. This project is currently in the pre-develop-ment phase. It is expected that the public request
60,000 SQ FT
NEW BIG LIFT MARITIME
OPERATIONS WAREHOUSE
(below) 60,000 sq ft with capacity to
handle twelve 1.2 M cargo units, will begin construction in 2016.
255’200’
27’
27’
for bids will occur in the summer and construction could begin before the end of the calendar year. This project will be completed in 2018, if not before and will be a tremendous value for additional busi-ness transportation service.
The Port will also begin development of an $8 million BIG LIFT Maritime Operations warehouse in 2016. This building will be close to 60,000 square feet in size and have the capacity to handle up to twelve (12) 1.2 million pound cargo units. This will be a dedicated maritime warehouse for heavy lift and large dimensional customers.
Other expected outcomes from 2016 will be the repositioning of a critical parcel of land for re-use. Before the end of the year, nearly 11 acres at 700 Smith Boulevard in the Port is expected to come back on line after an 18 month environmental
BIG LIFT MARITIME WAREHOUSE 2017: COMPLETION
31356 Port of Albany_TEXT.indd 27 4/22/16 10:32 AM
PG28 ALBANY PORT DISTRICT COMMISSION
Looking Ahead (CONTINUED)
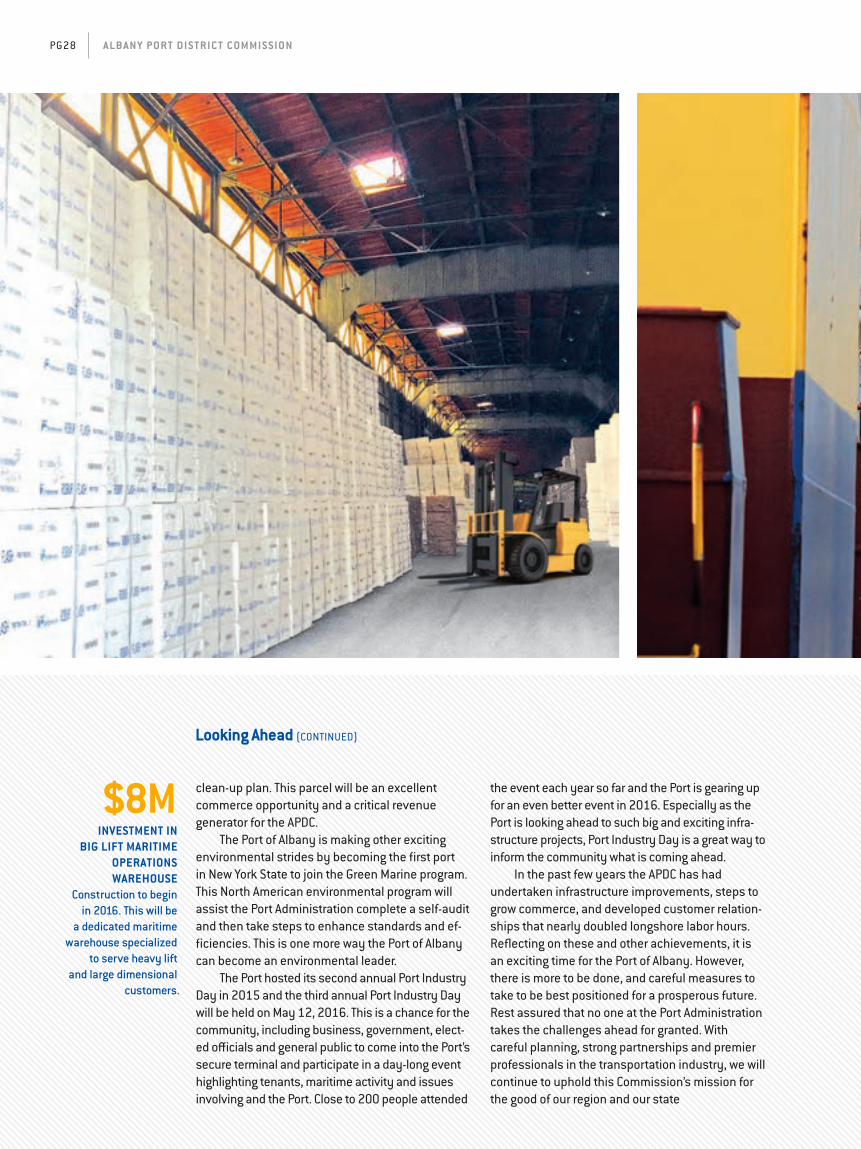
clean-up plan. This parcel will be an excellent commerce opportunity and a critical revenue generator for the APDC.
The Port of Albany is making other exciting environmental strides by becoming the first port in New York State to join the Green Marine program. This North American environmental program will assist the Port Administration complete a self-audit and then take steps to enhance standards and ef-ficiencies. This is one more way the Port of Albany can become an environmental leader.
The Port hosted its second annual Port Industry Day in 2015 and the third annual Port Industry Day will be held on May 12, 2016. This is a chance for the community, including business, government, elect-ed officials and general public to come into the Port’s secure terminal and participate in a day-long event highlighting tenants, maritime activity and issues involving and the Port. Close to 200 people attended
the event each year so far and the Port is gearing up for an even better event in 2016. Especially as the Port is looking ahead to such big and exciting infra-structure projects, Port Industry Day is a great way to inform the community what is coming ahead.
In the past few years the APDC has had undertaken infrastructure improvements, steps to grow commerce, and developed customer relation-ships that nearly doubled longshore labor hours. Reflecting on these and other achievements, it is an exciting time for the Port of Albany. However, there is more to be done, and careful measures to take to be best positioned for a prosperous future. Rest assured that no one at the Port Administration takes the challenges ahead for granted. With careful planning, strong partnerships and premier professionals in the transportation industry, we will continue to uphold this Commission’s mission for the good of our region and our state
$8MINVESTMENT IN
BIG LIFT MARITIME OPERATIONS WAREHOUSE
Construction to begin in 2016. This will be
a dedicated maritime warehouse specialized
to serve heavy lift and large dimensional
customers.
31356 Port of Albany_TEXT.indd 28 4/22/16 10:32 AM

ALBANY PORT DISTRICT COMMISSION PG29
$15MSOUTH WHARF RECONSTRUCTION (right) designed to accommodate barge service with the Port of NY and NJ, providing critical services to offset congestive effects of maritime traffic in the Panama Canal.
SOUTH WHARF RECONSTRUCTION 2018: PROJECTED COMPLETION
PHOTO, THIS PAGE: DAHL TAYLOR
31356 Port of Albany_TEXT.indd 29 4/22/16 10:32 AM

PG30 ALBANY PORT DISTRICT COMMISSION
31356 Port of Albany_TEXT.indd 30 4/22/16 10:32 AM
ALBANY PORT DISTRICT COMMISSION PG31
2015 ALBANY PORT DISTRICT COMMISSION
31356 Port of Albany_TEXT.indd 31 4/22/16 10:32 AM

PG32 ALBANY PORT DISTRICT COMMISSION
Georgette Steffens, Chairwoman Georgette was first appointed to the Port Commission in 2005 and served until 2007 when she moved to Boston. She was reappointed to the Board in 2011 after moving back to Albany, and was elected to Chairwoman in 2015. Georgette is the Executive Director of the Downtown Albany Business Improvement District, a nonprofit organization dedicated to the vitality and vibrancy of New York’s Capital City. Prior to this, Georgette served as the Director of Operations for a private consulting firm in Cambridge, MA. Previously, she worked for the City of Albany, as Director of the Albany HomeStore and as an Economic Developer working on Downtown and waterfront redevelopment. Georgette is also a Board member of the NYS Urban Council, the Albany Roundtable and the Steffens Scleroderma Center Advisory Board.
Joseph E. Coffey, Jr., P.E. , Treasurer Joe was appointed to the Commission in 2014. He is the Commissioner of the City of Albany Department of Wa-ter and Water Supply, responsible for the leadership, management, operation and maintenance of the City of Albany’s water source, treatment and distribution system; the combined sewer system; and administration of the Municipal Separate Storm Sewer System (MS4) permit program. A licensed NYS Professional Engineer, Joe has held Executive Leadership and Management positions for over 35 years with several Environmental and Engineering Consulting firms and was also the Executive Director of the University Heights Association, a not for profit consortium of the Albany Medical Center, the Albany Law School, the Albany College of Pharmacy and the Sage Colleges. Joe holds a BS Degree in Engineering from Boston University and a MEng Degree from RPI.
Dominick Tagliento, Secretary Dominick has been the City of Rensselaer’s appointee to the Port of Albany since 2009. Dominick was a successful small-business owner for over forty-five years, owning and operating Tagliento’s Deli in Rensse-laer. He was elected to the City of Rensselaer Common Council in 2000 and represented the City’s 5th Ward on the Council for well over a decade. Currently, Dominick serves as the Commissioner of the City of Rens-selaer’s Department of Public Works responsible for all of the City’s public works, including water and sewer projects and overseeing the administration of the daily operations and workforce that maintains the City’s critical infrastructure. Dominick is the Secretary to the Board of Commissioners.
THE BOARD OF COMMISSIONERS
The Albany Port District Commission (APDC) Board of Commissioners is comprised of five members. Four of the commissioners are appointed by the Governor of New York State on a recommenda-tion by the Mayor of the City of Albany, and one commisioner is appoint-ed on a recommenda-tion from the Mayor of the City of Rensselaer.
PORT COMMMISSION GOVERNANCEThe Albany Port District Commission (APDC) was created by authority of Chapter 192 of the laws of 1925 by the State of New York. Enabling legislation stated that APDC shall have power over the survey, development, control and operation of port facilities, with the view to the increase and efficiency of such facilities and the furtherance of commerce and industries in the district.
31356 Port of Albany_TEXT.indd 32 4/22/16 10:32 AM
ALBANY PORT DISTRICT COMMISSION PG33
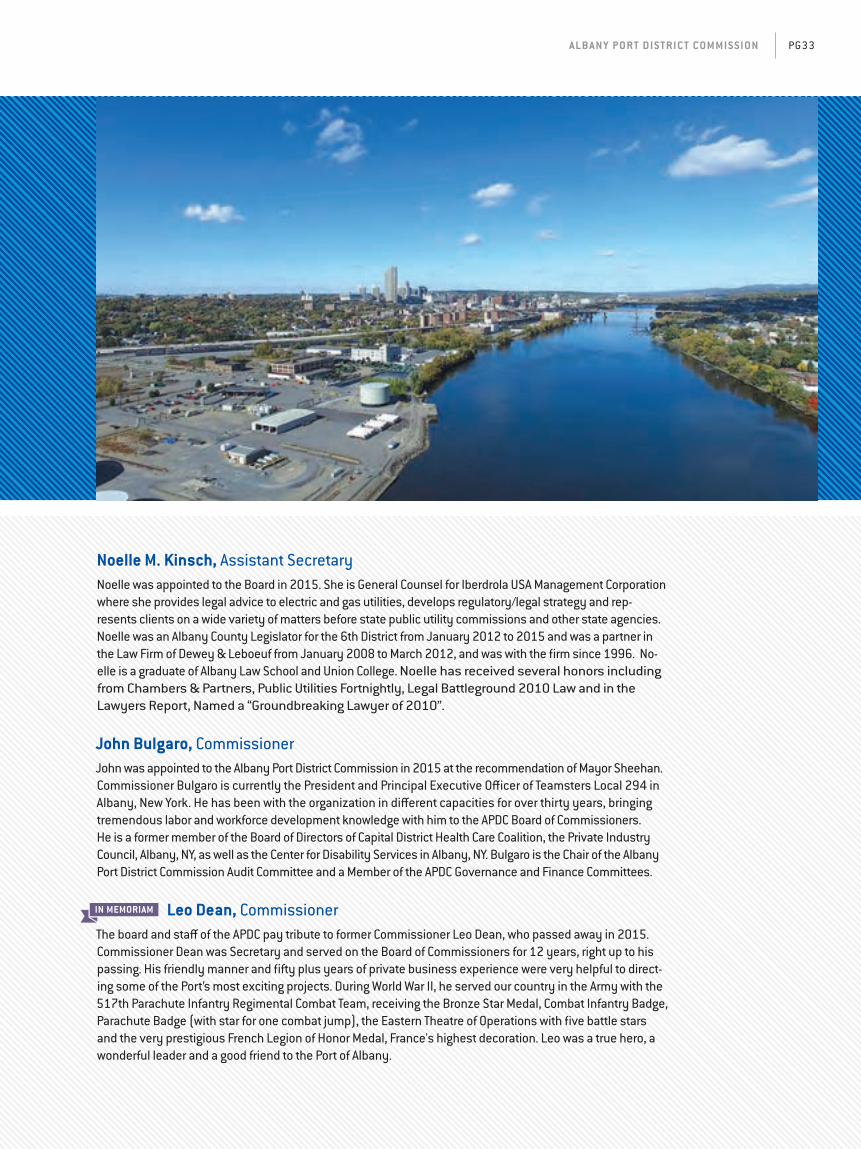
Noelle M. Kinsch, Assistant SecretaryNoelle was appointed to the Board in 2015. She is General Counsel for Iberdrola USA Management Corporation where she provides legal advice to electric and gas utilities, develops regulatory/legal strategy and rep-resents clients on a wide variety of matters before state public utility commissions and other state agencies. Noelle was an Albany County Legislator for the 6th District from January 2012 to 2015 and was a partner in the Law Firm of Dewey & Leboeuf from January 2008 to March 2012, and was with the firm since 1996. No-elle is a graduate of Albany Law School and Union College. Noelle has received several honors including from Chambers & Partners, Public Utilities Fortnightly, Legal Battleground 2010 Law and in the Lawyers Report, Named a “Groundbreaking Lawyer of 2010”.
John Bulgaro, CommissionerJohn was appointed to the Albany Port District Commission in 2015 at the recommendation of Mayor Sheehan. Commissioner Bulgaro is currently the President and Principal Executive Officer of Teamsters Local 294 in Albany, New York. He has been with the organization in different capacities for over thirty years, bringing tremendous labor and workforce development knowledge with him to the APDC Board of Commissioners. He is a former member of the Board of Directors of Capital District Health Care Coalition, the Private Industry Council, Albany, NY, as well as the Center for Disability Services in Albany, NY. Bulgaro is the Chair of the Albany Port District Commission Audit Committee and a Member of the APDC Governance and Finance Committees.
Leo Dean, CommissionerThe board and staff of the APDC pay tribute to former Commissioner Leo Dean, who passed away in 2015. Commissioner Dean was Secretary and served on the Board of Commissioners for 12 years, right up to his passing. His friendly manner and fifty plus years of private business experience were very helpful to direct-ing some of the Port’s most exciting projects. During World War II, he served our country in the Army with the 517th Parachute Infantry Regimental Combat Team, receiving the Bronze Star Medal, Combat Infantry Badge, Parachute Badge (with star for one combat jump), the Eastern Theatre of Operations with five battle stars and the very prestigious French Legion of Honor Medal, France's highest decoration. Leo was a true hero, a wonderful leader and a good friend to the Port of Albany.
IN MEMORIAM
31356 Port of Albany_TEXT.indd 33 4/22/16 10:32 AM

PG34 ALBANY PORT DISTRICT COMMISSION
ALBANY
The Port of Albany is a critical economic driver in the City of Albany and the Capital Region. With a combined local and statewide employment impact of close to 6,000 people, the Port is a major employment center that is key for our community job seekers. The Port is also exciting because it is our local connection to the world and enables our regional businesses to have export opportunities throughout the globe.
KATHY M. SHEEHAN, MAYOR, CITY OF ALBANY
“
”
31356 Port of Albany_TEXT.indd 34 4/22/16 10:32 AM
ALBANY PORT DISTRICT COMMISSION PG35
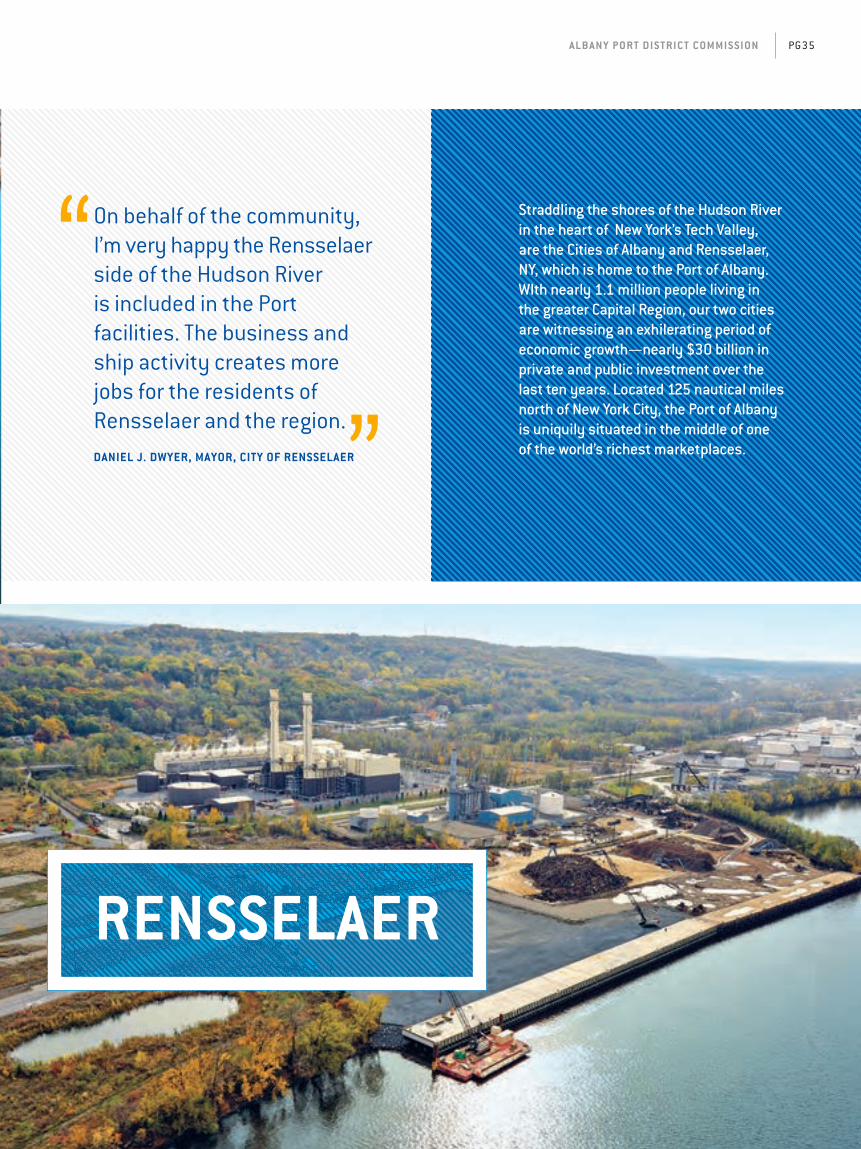
Straddling the shores of the Hudson River in the heart of New York’s Tech Valley, are the Cities of Albany and Rensselaer, NY, which is home to the Port of Albany. WIth nearly 1.1 million people living in the greater Capital Region, our two cities are witnessing an exhilerating period of economic growth—nearly $30 billion in private and public investment over the last ten years. Located 125 nautical miles north of New York City, the Port of Albany is uniquily situated in the middle of one of the world’s richest marketplaces.
RENSSELAER
On behalf of the community, I’m very happy the Rensselaer side of the Hudson River is included in the Port facilities. The business and ship activity creates more jobs for the residents of Rensselaer and the region. DANIEL J. DWYER, MAYOR, CITY OF RENSSELAER
“
”
31356 Port of Albany_TEXT.indd 35 4/22/16 10:32 AM
PG36 ALBANY PORT DISTRICT COMMISSION
CHAIRWOMAN & GENERAL MANAGER
31356 Port of Albany_TEXT.indd 36 4/22/16 10:32 AM

ALBANY PORT DISTRICT COMMISSION PG37
GEORGETTE STEFFENS Chairwoman, Albany Port District Commission
RICHARD J. HENDRICK General Manager, Albany Port District Commission
Dear Chairwoman Steffens and Members of the Board of Commissioners, Following a record setting year, I am happy to report that 2015 was a very successful year at the Port of Albany. With leadership from our Board, support from our government partners and an excellent team on staff, we have positioned the Port well for the future. Specifically, new infrastructure improvements will prepare the Port to handle our customer cargo requirements as they increase in volume and dimension. Perhaps most exciting to me is the growth in the local labor force at the Port due to all these improvements.
I would like to thank the Commissioners for giving me the ability to assemble a team of dedi-cated professionals who—like me—are always looking for the next opportunity to make this port a leader. I also want to especially thank the Port’s general counsel Tom Owens who departed at the end of 2015 for a new career opportunity. His partnership on this team helped us create the environment for these positive changes.
I am pleased to report that 2015 was a superb year and as we look ahead our horizon continues to shine bright at the Port of Albany.
Richard J. Hendrick, General Manager Albany Port District Commission
Dear Governor Cuomo, As Upstate New York’s leading inland port we continue to be an economic driver for the Capital Region and beyond. Representing an economic impact of more than $800 million annually, the Port’s 23 business tenants alone pay over $80 million in wages and benefits for 1,400+ local jobs and 4,500 jobs throughout New York State.
Our reach goes beyond the local economy with international connections; we receive cargo from as far as Australia and Sweden and ship regional products to Algeria, Turkey, Mexico and many other global destinations. These relationships have lead to a steady swell of business over the past five years. The Port has experienced a 15% increase in vessel calls and a 50% increase in longshore hours worked, all correlating with new businesses locating at the Port, millions of dollars in large scale reinvestment, and increased jobs created by the Port both directly and indirectly.
The inclusion of the Port of Albany in your Upstate infrastructure improvement plan through a $15 million grant award will enable the Port to handle larger cargo with roll-on roll-off capability and secure the wharf that supports the largest grain elevator in the Northeastern United States. The Port also received a $4 million award for a construction of a new BIG LIFT maritime warehouse. These investments reinforce the excellence that is the Port of Albany.
Governor, thank you for your continued leadership and recognition of the importance maritime commerce plays in New York State’s, and in particular Upstate’s ability to be globally competitive.
Georgette Steffens, Chairwoman Albany Port District Commission
31356 Port of Albany_TEXT.indd 37 4/22/16 10:32 AM

PG38 ALBANY PORT DISTRICT COMMISSION
31356 Port of Albany_TEXT.indd 38 4/22/16 10:32 AM

ALBANY PORT DISTRICT COMMISSION PG39
Management’s Discussion and Analysis
Independent Auditor’s Report on the Financial Statements
Statements of Net Position
Statements of Revenues, Expenses and Changes in Net Position
Statements of Cash Flows
Notes to Financial Statements
Supplementary Information
Independent Auditor’s Report on Internal Control
40
46
48
49
50
51
66
67
FINANCIAL STATEMENTS
20102015
31356 Port of Albany_TEXT.indd 39 4/22/16 10:32 AM
PG40 ALBANY PORT DISTRICT COMMISSION
MANAGEMENT’S DISCUSSION AND ANALYSISThe following discussion and analysis (MD&A) of the activities and financial performance of the Albany Port District Commission (“APDC”) is offered as an introduction and overview of the financial statements of APDC for the fiscal year ended December 31, 2015, with comparative data for the fiscal year ended December 31, 2014. Following this MD&A are the basic financial statements of APDC together with the notes thereto which are essential to a full understanding of the data contained in the financial statements. In addition to the notes, certain supplementary information is presented to assist with the understanding of the APDC’s financial operations.
APDC is governed by a five member Board of Commissioners (“Board”). All Commissioners are appointed by the Governor of New York State based upon recommendations of the Mayors of Albany and Rensselaer. The Board has adopted several policies as required under the Public Authorities Accountability Act (“PAAA”) of 2005 and the Public Authorities Reform Act (“PARA”) of 2009, enhancing transparency and embracing best governance practices.
The APDC Finance Committee meets on a quarterly basis or more frequently if necessary to provide enhanced project and transactional analysis. As necessary, the Committee makes recommendations for consideration by the Board. On a monthly basis, the Board meets to discuss infrastructure needs, project activity and prog-ress, maritime activity performance and meets quarterly to discuss the APDC’s financial position. In addition, the APDC Audit Committee, without management present, independently meets with the external auditors to discuss relevant issues and concerns.
INTRODUCTIONIn 1925, the Albany Port District Commission was established through an act of the New York State Legislature (“Enabling Legislation”). The Enabling Legislation granted broad authority to the APDC to develop, construct, and manage a maritime facility. During the succeeding decades, the APDC developed into a year-round, twenty-four hour operation encompassing nearly 300 acres within two municipalities, directly and indirectly employing hundreds of men and women and generating hundreds of millions of dollars in regional and state-wide economic output.
Stevedoring services are provided by Federal Marine Terminals, Inc. (“FMT”). Through a Terminal Operating Agreement (“TOA”) between APDC and FMT, FMT is authorized to manage a portion of APDC property for general cargo and commodity handling and to conduct various activities related to vessel servicing. Under the TOA, FMT is obligated to make monthly payments to APDC (“Base Payments”). Upon meeting and surpassing cer-tain gross revenue thresholds, under the TOA, FMT is obligated to pay a certain percentage of gross revenue to APDC (“Revenue Share Payments”).
The APDC strives to responsibly and effectively manage the publicly-owned maritime Port of Albany-Rensse-laer, contributing to the economy of Capital Region and beyond while emphasizing transparency and public stewardship. The APDC’s mission consists of three main tenets:
» Effective Management of the Public’s Asset.
» Economic Contribution to the Region.
» Integrity, Professionalism and Customer Service.
Through the execution of this mission, APDC has emerged as an award-winning, multi-faceted organization offering world-class facilities and services with an economic influence that is felt throughout New York State.
31356 Port of Albany_TEXT.indd 40 4/22/16 10:32 AM

YEARS ENDED DECEMBER 31, 2015 AND 2014 PG41
2015 HIGHLIGHTSAPDC’s net position has grown by nearly $540,000 as a result of operating income for 2015 and capital grant funding.
Following a publicly issued Request for Proposals (“RFP”), the Board approved an approximately $2.4 million project to dredge a quantity of material sufficient to achieve a draft of 30 feet in the area adjacent to the Rensselaer Wharf that was reconstructed in 2014. APDC entered into an agreement with a commercial tenant to contribute up to $700,000 of the cost of the project. Approximately $950,000 of the project’s cost is offset from grant sources.
In May 2015, a piece of equipment that was determined to no longer be needed for terminal operations was sold and the APDC realized a $217,500 gain on the sale of this asset.
During 2015, the APDC executed agreements with the cities of Albany and Rensselaer to provide fire and related emergency services (“Services”) to the APDC. The term of the agreement is for one year (September 1, 2015 through August 31, 2016) and fees remitted to Albany and Rensselaer as consideration for the Services are $500,000 and $100,000, respectively.
As of December 31, 2015, APDC has recognized approximately $250,000 of deferred outflows of resources related to the requirements under GASB 68. Further explanation of GASB 68 and the corresponding presenta-tion in the financial statements is provided in the notes to the financials.
During 2015, certain financial management practices of the APDC were audited by the New York State Office of the State Comptroller (“OSC”). Specifically, OSC focused on delinquent account receivable collection and report-ing practices and capital planning activities for the period from January 1, 2013 through September 30, 2015. OSC found that the reviewed practices complied with APDC procedures and related laws and regulations.
MARITIME ACTIVITY HIGHLIGHTSA condensed summary of APDC’s vessel traffic, cargo and commodity volume and longshore labor through December 31, 2013, 2014, and 2015 is shown below:
2013 2014 2015
Ships 55 79 52
Barges – heavy lift 5 15 17
Total 60 94 69
TONNAGE
Inbound 65,349 77,463 58,120
Outbound 325,065 495,483 295,334
Total 390,414 527,946 353,454
LONGSHOREMAN
Man hours 44,389 81,988 60,803
31356 Port of Albany_TEXT.indd 41 4/22/16 10:32 AM

PG42 ALBANY PORT DISTRICT COMMISSION
FINANCIAL OPERATIONS HIGHLIGHTSA condensed summary of revenues and expenses for the years ended December 31, 2015 and 2014 is shown below
OPERATING REVENUES 2015 2014
Property and equipment rentals $ 3,419,664 $ 3,180,112
Maritime-related 1,221,292 1,771,426
Security 583,376 639,007
Other operating revenues 237,269 362,176
Total operating revenues 5,461,601 5,952,721
OPERATING EXPENSES
Payroll and related expenses 2,521,528 2,345,174
Maintenance and material handling 211,801 291,425
Professional services 518,088 478,134
Other operating expenses 445,102 530,610
Total operating expenses 3,696,519 3,645,343
OPERATING INCOME 1,765,082 2,307,378
Depreciation and other items (2,181,417) (1,786,252)
CHANGE IN NET POSITION BEFORE CAPITAL FUNDING (416,335) 521,126
Capital grant funding 958,692 6,043,535
INCREASE IN NET POSITION 542,357 6,564,661
Total net position: beginning of year 44,510,551 37,945,890
Total net position: end of year $ 45,052,908 $ 44,510,551
Operating Revenue decreased approximately $500,000 or 8% from 2014. The decrease in 2015 operating revenues as compared to 2014 is concentrated primarily within maritime activity. Revenue derived from property rentals was stable in 2015, comprising more than one-half of APDC’s operating revenue. Revenue derived from use of APDC’s mobile harbor cranes and other equipment significantly outperformed 2014; more than doubling in 2015.
31356 Port of Albany_TEXT.indd 42 4/22/16 10:32 AM

YEARS ENDED DECEMBER 31, 2015 AND 2014 PG43
Dockage Fees are charged for vessels that are utilizing berths and are based upon either the length or net registered tonnage of the vessel. Fees for dockage decreased by approximately $200,000 or 28%. This decrease was concentrated primarily in vessel traffic related to grain shipments. Dockage revenue generated from this commodity declined nearly $148,000 or 74%. Vessels utilizing the dock while awaiting the availability of their port of call (“lay berths”) decreased from 237 vessels in 2014 to 151 vessels in 2015. This resulted in approximately $83,000 less in lay berth revenue in 2015, a decrease of 40%. The decrease in dockage fee revenue was partially offset by increased revenue related to scrap metal vessels, which increased by $44,000 (44%) over 2014.
Wharfage Fees experienced a modest decrease of $67,000 or 16%. Again, grain underperformed in 2015 as compared to 2014, generating $76,000 (76%) less wharfage revenue. This effect of this decline in activity was mitigated by increases in wharfage fees from scrap metal and woodpulp. Those commodities generated increases in wharfage revenue of $21,000 (22%) and $10,000 (37%), respectively.
Stevedore Fees declined $284,000 or 45% generating $347,000 of revenue in 2015 as compared to $630,000 in 2014. This decrease is primarily attributable to an approximately $217,000 decrease in the Revenue Share Payments received from FMT. Although not captured in the APDC’s financial performance, a corollary to this decrease is evidenced by the number of longshore hours worked in 2015 as compared to 2014. Longshore hours worked decreased by about 20,000; from 82,400 hours in 2014 to 61,000 hours in 2015. It should be noted; however, that longshore hours worked in 2015 is the second highest amount in the previous five (5) years, exceeding the least active year in that five-year period by over 27,000 hours or 80%.
Revenue derived from crane and equipment rentals increased by $122,000 from $106,000 in 2014 to $228,000 in 2015. This is attributable to increased utili-zation of APDC’s mobile harbor cranes by FMT for maritime terminal operations. APDC charges an hourly rate for crane usage by FMT.
The Maritime Transportation Security Act of 2002 (“MTSA”) established certain requirements related to terminal access and vessel security for U.S. ports. The majority of Security Fees received by the APDC are based upon practices and pro-tocols required under the APDC’s Facility Security Plan, which was designed and implemented under the MTSA. Revenue for Security Fees was $584,000 in 2015 as compared to $639,000 in 2014; a decrease of $56,000 or 9%.
Operating expenses were essentially flat; modestly increasing by approximate-ly $50,000 or 1%.Overall, operating expenses remained flat from 2014 to 2015. While payroll and related benefits costs and professional and consulting fees increased, the majority of operating expense categories decreased from 2014.
Property rentals $3,191,709
Dockage fees $519,021
Wharfage fees $355,687
Stevedore fees $346,584
Crane & equip. rentals $227,955
Security fees $583,376
Storage & other services $237,269
58%
10%
7%
6%
4%
11%
4%
Payroll & related benefit costs $2,521,528
Other operating expenses $445,102
Professional & consulting fees $262,793
Insurance $255,295
Material handling $77,361
Maintenance expense $134,440
68%
12%
7%
7%
2%
4%
2015 OPERATING REVENUES
2015 OPERATING EXPENSES
31356 Port of Albany_TEXT.indd 43 4/22/16 10:33 AM

PG44 ALBANY PORT DISTRICT COMMISSION
FINANCIAL OPERATIONS HIGHLIGHTS (CONTINUED)
Payroll and Related Expenses increased overall by 8%. This increase; however, is partially the result of a one-time adjustment to the carrying value of certain employee benefits that was recorded in 2014 and had the effect of reducing total expenses within this category for that year. Excluding the effect of that adjust-ment and the required expenditure recognition under GASB 68, Payroll and Related Expenses decreased from 2014 to 2015 by approximately $82,000 or 3%.
Maintenance Expense decreased by $24,000 (15%) to $134,000 from $158,000 in 2014. While the expense related to service contracts increased by approximately $16,000, this was offset by decreases in the expenses associated with buildings and roads. These categories decreased by $26,000 and $7,300, respectively in 2015.
The Material Handling category decreased by $56,000 or 42%. Certain claims resulting from damage of APDC-owned equipment decreased by approximately $44,000 and non-capital expenses related to the mobile harbor cranes decreased by approximately $27,000. These decreases were offset by a modest increase of $7,000 for other non-capital equipment costs.
Professional and consulting fees increased by $51,000 (24%). This reflects increased utilization of third-party engineering firms related to APDC’s capital activities.
SUMMARY OF NET POSITIONA condensed summary of APDC’s net position at December 31, 2013, 2014 and 2015 is shown below:
ASSETS AND DEFERRED OUTFLOWS OF RESOURCES 2013 2014 2015
Current and other assets $ 5,748,603 $ 7,101,030 $ 5,535,455
Capital assets 35,647,925 42,901,668 44,766,415
Deferred outflow of resources – – 251,527
Total assets $ 41,396,528 $ 50,002,698 $ 50,553,397
LIABILITIES
Current and other liabilities $ 1,892,985 $ 1,081,319 $ 1,124,733
Long-term liabilities 1,557,653 4,410,828 4,375,756
Total liabilities $ 3,450,638 $ 5,492,147 $ 5,500,489
NET POSITION
Invested in capital assets: net related debt $ 34,646,889 $ 39,911,082 $ 42,209,673
Unrestricted 3,299,001 4,599,469 2,843,235
Total net position $ 37,945,890 $ 44,510,551 $ 45,052,908
Total net position has increased by approximately $540,000 from December 31, 2014 to December 31, 2015.
31356 Port of Albany_TEXT.indd 44 4/22/16 10:33 AM
YEARS ENDED DECEMBER 31, 2015 AND 2014 PG45
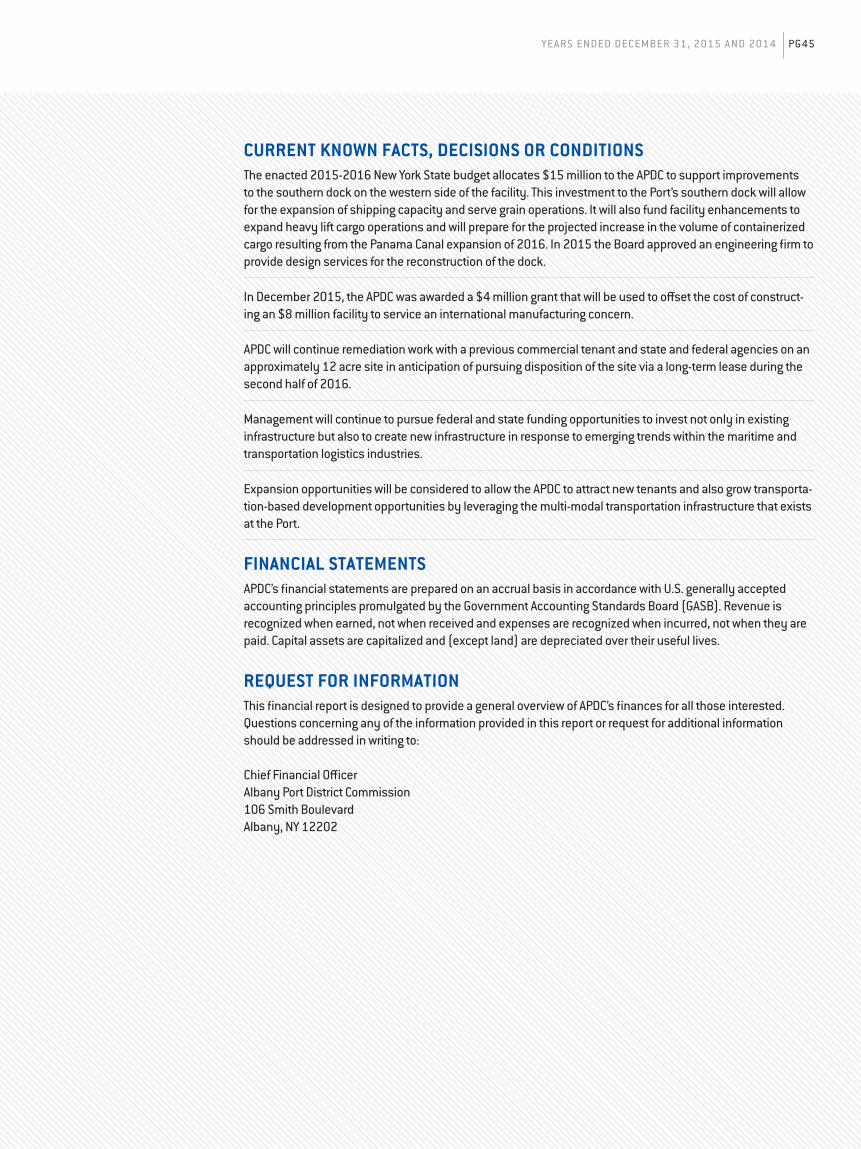
CURRENT KNOWN FACTS, DECISIONS OR CONDITIONSThe enacted 2015-2016 New York State budget allocates $15 million to the APDC to support improvements to the southern dock on the western side of the facility. This investment to the Port’s southern dock will allow for the expansion of shipping capacity and serve grain operations. It will also fund facility enhancements to expand heavy lift cargo operations and will prepare for the projected increase in the volume of containerized cargo resulting from the Panama Canal expansion of 2016. In 2015 the Board approved an engineering firm to provide design services for the reconstruction of the dock.
In December 2015, the APDC was awarded a $4 million grant that will be used to offset the cost of construct-ing an $8 million facility to service an international manufacturing concern.
APDC will continue remediation work with a previous commercial tenant and state and federal agencies on an approximately 12 acre site in anticipation of pursuing disposition of the site via a long-term lease during the second half of 2016.
Management will continue to pursue federal and state funding opportunities to invest not only in existing infrastructure but also to create new infrastructure in response to emerging trends within the maritime and transportation logistics industries.
Expansion opportunities will be considered to allow the APDC to attract new tenants and also grow transporta-tion-based development opportunities by leveraging the multi-modal transportation infrastructure that exists at the Port.
FINANCIAL STATEMENTSAPDC’s financial statements are prepared on an accrual basis in accordance with U.S. generally accepted accounting principles promulgated by the Government Accounting Standards Board (GASB). Revenue is recognized when earned, not when received and expenses are recognized when incurred, not when they are paid. Capital assets are capitalized and (except land) are depreciated over their useful lives.
REQUEST FOR INFORMATIONThis financial report is designed to provide a general overview of APDC’s finances for all those interested. Questions concerning any of the information provided in this report or request for additional information should be addressed in writing to:
Chief Financial OfficerAlbany Port District Commission106 Smith BoulevardAlbany, NY 12202
31356 Port of Albany_TEXT.indd 45 4/22/16 10:33 AM

PG46 ALBANY PORT DISTRICT COMMISSION
INDEPENDENT AUDITOR’S REPORTTo the Commissioners, Albany Port District Commission
Report on the Financial StatementsWe have audited the accompanying financial statements of Albany Port District Commission (a component reporting unit of the City of Albany) as of December 31, 2015 and 2014, and the related notes to the financial statements, which collectively comprise the Commission’s basic financial statements as listed in the table of contents.
Management’s Responsibility for the Financial StatementsManagement is responsible for the preparation and fair presentation of these financial statements in accor-dance with accounting principles generally accepted in the United States of America; this includes the design, implementation, and maintenance of internal control relevant to the preparation and fair presentation of financial statements that are free from material misstatement, whether due to fraud or error.
Auditor’s ResponsibilityOur responsibility is to express an opinion on these financial statements based on our audits. We conducted our audits in accordance with auditing standards generally accepted in the United States of America and the standards applicable to financial audits contained in Government Auditing Standards, issued by the Comptroller General of the United States. Those standards require that we plan and perform the audit to obtain reasonable assurance about whether the financial statements are free from material misstatement.
An audit involves performing procedures to obtain audit evidence about the amounts and disclosures in the financial statements. The procedures selected depend on the auditor’s judgment, including the assessment of the risks of material misstatement of the financial statements, whether due to fraud or error. In making those risk assessments, the auditor considers internal control relevant to the entity’s preparation and fair pre-sentation of the financial statements in order to design audit procedures that are appropriate in the circum-stances, but not for the purpose of expressing an opinion on the effectiveness of the entity’s internal control. Accordingly, we express no such opinion. An audit also includes evaluating the appropriateness of accounting policies used and the reasonableness of significant accounting estimates made by management, as well as evaluating the overall presentation of the financial statements.
We believe that the audit evidence we have obtained is sufficient and appropriate to provide a basis for our audit opinion.
OpinionIn our opinion, the financial statements referred to above present fairly, in all material respects, the financial position of the Albany Port District Commission, as of December 31, 2015 and 2014, and the changes in financial position and cash flows thereof for the years then ended in accordance with accounting principles generally accepted in the United States of America.
31356 Port of Albany_TEXT.indd 46 4/22/16 10:33 AM

YEARS ENDED DECEMBER 31, 2015 AND 2014 PG47
Other MattersRequired Supplementary Information: Accounting principles generally accepted in the United States of America require that the management’s discussion and analysis at the beginning of the report be presented to supplement the basic financial statements. Such information, although not a part of the basic financial statements, is required by the Governmental Accounting Standards Board who considers it to be an essential part of financial reporting for placing the basic financial statements in an appropriate operational, economic, or historical context. We have applied certain limited procedures to the required supplementary information in accordance with auditing standards generally accepted in the United States of America, which consisted of inquiries of management about the methods of preparing the information and comparing the information for consistency with management’s responses to our inquiries, the basic financial statements, and other knowl-edge we obtained during our audit of the basic financial statements. We do not express an opinion or provide any assurance on the information because the limited procedures do not provide us with sufficient evidence to express an opinion or provide any assurance.
Other Information: Our audits were conducted for the purpose of forming opinions on the financial state-ments of the Albany Port District Commission’s basic financial statements. The Schedules of Payroll and Related Costs and Other Operating Expenses are presented for purposes of additional analysis and are not a required part of the basic financial statements. The Schedules of Payroll and Related Costs and Other Operat-ing Expenses are the responsibility of management and were derived from and relate directly to the underly-ing accounting and other records used to prepare the basic financial statements. Such information has been subjected to the auditing procedures applied in the audit of the financial statements and certain additional procedures, including comparing and reconciling such information directly to the underlying accounting and other records used to prepare the basic financial statements or to the basic financial statements themselves, and other additional procedures in accordance with auditing standards generally accepted in the United States of America. In our opinion, this information is fairly stated in all material respects in relation to the financial statements as a whole.
Other Reporting Required by Government Auditing StandardsIn accordance with Government Auditing Standards, we have also issued our report dated February 24, 2016 on our consideration of the Albany Port District Commission’s internal control over financial reporting and on our tests of its compliance with certain provisions of laws, regulations, contracts, and grant agreements and other matters. The purpose of that report is to describe the scope of our testing of internal control over finan-cial reporting and compliance and the results of that testing, and not to provide an opinion on internal control over financial reporting or on compliance. That report is an integral part of an audit performed in accordance with Government Auditing Standards in considering the Albany Port District Commission’s internal control over financial reporting and compliance.
UHY LLPAlbany, New YorkFebruary 24, 2016
31356 Port of Albany_TEXT.indd 47 4/22/16 10:33 AM

PG48 ALBANY PORT DISTRICT COMMISSION
STATEMENTS OF NET POSITIONYears ended December 31, 2015 and 2014
ASSETS AND DEFERRED OUTFLOWS OF RESOURCES
CURRENT ASSETS 2015 2014
Cash and cash equivalents $ 1,257,396 $ 2,620,805
Investments 3,268,087 3,235,279
Accounts receivable 363,565 589,468
Grants receivable 10,000 411,407
Other current assets 636,407 244,071
Total current assets 5,535,455 7,101,030
NET PROPERTY AND EQUIPMENT 44,766,415 42,901,668
Total assets 50,301,870 50,002,698
DEFERRED OUTFLOWS OF RESOURCES 251,527 −
$ 50,553,397 $ 50,002,698
LIABILITIES, DEFERRED INFLOWS OF RESOURCES AND NET POSITION
CURRENT LIABILITIES 2015 2014
Current maturities of long-term debt $ 443,087 $ 433,844
Deferred revenue 19,966 41,791
Accounts payable 428,455 400,004
Accrued expenses 190,225 170,680
OPEB obligation, current portion 43,000 35,000
Total current liabilities 1,124,733 1,081,319
LONG-TERM LIABILITIES
Security deposits 127,097 127,088
OPEB obligation net of current portion 2,009,051 1,726,998
Net pension liability 125,953 −
Long-term debt, net of current maturities 2,113,655 2,556,742
Total long-term liabilities 4,375,756 4,410,828
Total liabilities 5,500,489 5,492,147
DEFERRED INFLOWS OF RESOURCES − −
NET POSITION
Net investment in capital assets 42,209,673 39,911,082
Unrestricted 2,843,235 4,599,469
Total net position 45,052,908 44,510,551
$ 50,553,397 $ 50,002,698
31356 Port of Albany_TEXT.indd 48 4/22/16 10:33 AM

YEARS ENDED DECEMBER 31, 2015 AND 2014 PG49
STATEMENTS OF REVENUES AND EXPENSES AND CHANGES IN NET POSITIONYears ended December 31, 2015 and 2014
OPERATING REVENUES 2015 2014
Property rentals $ 3,191,709 $ 3,073,712
Dockage fees 519,021 718,209
Wharfage fees 355,687 422,767
Stevedore fees 346,584 630,450
Crane/equipment rentals 227,955 106,400
Security fees 583,376 639,007
Storage and other services 237,269 362,176
Total operating revenues 5,461,601 5,952,721
OPERATING EXPENSES
Payroll and related benefit costs 2,521,528 2,345,174
Maintenance expense 134,440 158,120
Material handling 77,361 133,305
Insurance 255,295 266,748
Professional and consulting fees 262,793 211,386
Other operating expenses 445,102 530,610
Total operating expenses 3,696,519 3,645,343
OPERATING INCOME, BEFORE DEPRECIATION AND OTHER ITEMSDEPRECIATION AND OTHER ITEMS 1,765,082 2,307,378
Depreciation (1,948,358) (1,489,634)
Gain on sale of property and equipment 217,500 12,091
Waterfront development costs (223,892) (271,346)
Municipal support agreement costs (200,000) 0
Interest income 30,862 33,461
Interest expense (57,529) (70,824)
Net depreciation and other items (2,181,417) (1,786,252)
CHANGE IN NET POSITION BEFORE CAPITAL FUNDING (416,335) 521,126
Capital grant funding 958,692 6,043,535
INCREASE IN NET POSITION 542,357 6,564,661
Total net position, beginning of the year 44,510,551 37,945,890
Total net position, end of year $ 45,052,908 $ 44,510,551
31356 Port of Albany_TEXT.indd 49 4/22/16 10:33 AM

PG50 ALBANY PORT DISTRICT COMMISSION
STATEMENTS OF CASH FLOWSYears ended December 31, 2015 and 2014
CASH FLOWS FROM OPERATING ACTIVITIES 2015 2014
Cash received from rentals $ 3,393,922 $ 3,195,753
Cash received for facility usage 1,451,112 1,414,569
Cash received from other services 820,645 1,001,183
Cash payments to employees and professionals (2,600,297) (2,544,687)
Cash payments for materials and maintenance (225,648) (282,938)
Cash payments for insurance (245,172) (266,654)
Cash payments for other expenses (445,092) (530,602)
Net cash provided by operating activities 2,149,470 1,986,624
CASH FLOWS FROM NONCAPITAL FINANCING ACTIVITIES
Cash payments for municipal support agreement costs & waterfront development costs (823,892) (271,346)
Net cash used in noncapital financing activities (823,892) (271,346)
CASH FLOWS FROM CAPITAL AND RELATED FINANCING ACTIVITIES
Cash payments for capital assets (3,772,890) (8,881,647)
Cash received from sale of property and equipment 217,500 170,000
Cash received from capital grant funding 1,360,099 7,142,574
Interest expense (57,529) (70,824)
Cash proceeds from long-term debt − 3,000,000
Cash payments on long-term debt and other obligations (433,844) (1,010,450)
Net cash (used in) provided by capital and related financing activities (2,686,664) (349,653)
CASH FLOWS FROM INVESTING ACTIVITIES
Cash received from interest 30,486 23,591
Cash paid for purchase of investments (1,171,810) (2,323,213)
Cash received from sale of investments 1,139,001 2,303,531
Net cash (used in) provided by investing activities (2,323) 3,909
Net change in cash (1,363,409) 2,068,840
Cash, beginning of year 2,620,805 551,965
Cash, end of year $ 1,257,396 $ 2,620,805
RECONCILIATION OF OPERATING INCOME, BEFORE DEPRECIATION & OTHER ITEMS TO NET CASH PROVIDED BY OPERATING ACTIVITIES
Operating income, before depreciation and other items $ 1,765,082 $ 2,307,378
Adjustments to reconcile operating income to net cash provided by operating activities:
Changes in:
Accounts receivable 225,903 (356,857)
Other assets 8,040 445
Accounts payable (11,763) 8,137
Accrued expenses 19,554 (284,545)
Deferred revenue (21,825) 15,641
OPEB obligation 290,053 296,425
Net pension related accounts (125,574) −
Total adjustments 384,388 (320,754)
Net cash provided by operating activities $ 2,149,470 $ 1,986,624
31356 Port of Albany_TEXT.indd 50 4/22/16 10:33 AM

YEARS ENDED DECEMBER 31, 2015 AND 2014 PG51
NOTES TO FINANCIAL STATEMENTSDecember 31, 2015 and 2014
NOTE 1: ORGANIZATION AND STATUTORY COMMISSIONThe Albany Port District Commission (the Commission) was established in 1925 under Chapter 192 of the Laws of the State of New York. The law, as amended, grants the Commission regulatory powers over the devel-opment and operations of the facilities of the Albany Port District. The Commission, a Public Corporation with perpetual existence, has the power to construct, develop and operate Port facilities, including a terminal rail-road; to fix fees, rates, rentals and other charges for its facilities; to regulate and supervise the construction and operations of the Port facilities by private enterprise; to issue bonds and notes; and to do all other things necessary to make the Port useful and productive. The Commission also has the right of eminent domain.
The Laws of 1925 provide that the municipalities of Albany and Rensselaer be assessed for the Commis-sion's deficit, if any, which might result from operations and financing. A 1932 reapportionment deter-mination established rates for this purpose which approximate 88 percent for Albany and 12 percent for Rensselaer. Although rates are subject to change under the provisions of the law, in recent years there have been no such assessments.
The Commission is a component reporting unit of the City of Albany and, as such, is included in the City's general purpose financial statements.
NOTE 2: SIGNIFICANT ACCOUNTING POLICIESBasis of Presentation: The Commission follows the provisions of Governmental Accounting Standards Board (GASB) Statement No. 34 “Basic Financial Statements and Management’s Discussion and Analysis for State and Local Governments” and GASB Statement No. 37 “Basic Financial Statements and Management’s Discussion and Analysis for State and Local Governments: Omnibus.” Statement 34, as amended by State-ment 37 and Statement 63, establishes standards for external reporting for all state and local government entities. It also requires the classification of net position into three components – invested in capital assets, net of related debt; restricted; and unrestricted. These classifications are defined as follows:
Net Investment in capital assets: This component of net position consists of capital assets, net of accumulated depreciation, reduced by the outstanding balances of any borrowings that are attributable to the acquisition, construction, or improvement of those assets.
Restricted: This component of net position, when applicable, consists of restrictions placed on fund equity use through external constraints imposed by creditors (such as through debt covenants), by law or regulation, or through enabling legislation. No component of net position was classified as restricted at either December 31, 2015 and 2014.
Unrestricted: This component of net position consists of fund equity that does not meet the definition of “restricted” or “invested in capital assets, net of related debt.”
Basis of Accounting: The accompanying financial statements have been prepared in conformity with generally accepted accounting principles for governmental entities, as prescribed by GASB. In accordance with the provisions promulgated by GASB, the Commission has elected not to apply Financial Accounting Standards Board (FASB) pronouncements and interpretations issued after November 1989.
The operations of the Commission are reported as a proprietary fund and, as such, are accounted for on a flow of economic resources measurement focus under the accrual basis of accounting. Within this measurement focus, all assets and liabilities associated with operations are included on the balance sheet with revenues recorded when earned and expenses recorded at the time liabilities are incurred.
31356 Port of Albany_TEXT.indd 51 4/22/16 10:33 AM

PG52 ALBANY PORT DISTRICT COMMISSION
NOTE 2: SIGNIFICANT ACCOUNTING POLICIES (CONTINUED)
Cash and Cash Equivalents: The Commission considers all liquid investments with an original maturity of three months or less to be cash equivalents. The Commission’s financial instruments that are exposed to concentrations of credit risk consist primarily of cash, cash equivalents and investments. The Commission places cash and temporary cash investments with high quality credit institutions.
Investments: New York State statutes and guidelines, and the Commission's own investment policies, limit the investment of funds to obligations of the U.S. Government and its agencies, certificates of deposit, and obligations of the State of New York. This limitation effectively minimizes the Commission’s investment relat-ed risk. The Commission's investments are managed by an independent investment advisor and are stated in the statements of net position at market value.
Property and Equipment: The Commission’s property, equipment, and other facilities are carried at cost and include capital grant funding from federal, state and local Governmental entities utilized to acquire, construct, and improve facilities of the Commission. Such capital funding is recorded for amounts derived from capital project grants and other resources which are restricted to facility acquisition or construction. The Commission recognizes capital funding arising from capital project grants when earned (generally when the related capital expenditure is made). Depreciation is computed on the straight-line method based on estimat-ed useful lives of the related assets, including those financed by capital funding grants. A substantial portion of depreciation is attributable to assets purchased with capital funding under various Governmental grants.
The estimated useful lives used in the calculation of depreciation are generally as follows:
Port marine facilities 10 to 40 Years
Furniture and equipment 5 to 10 Years
Transportation equipment 5 to 10 Years
Accrued Employee Benefits: It is the Commission's policy to record employee benefits, including accumu-lated vacation earned, retirement benefits and post-retirement benefits, as a liability. Commission employees are granted vacation leave in varying amounts and may carry-over unused leave, subject to stated policy limitations. In the event of termination, an employee is reimbursed for such time.
Deferred Revenue: Deferred revenue consists principally of rents received in advance.
Retirement Benefits: The Commission provides retirement benefits for its employees through contribu-tions to the New York State Employees’ Retirement System (“ERS” or “System”). The System’s retirement programs provide various plans and options, some of which require employee contributions. The Commission uses GASB Statement No. 68, Accounting and Financial Reporting for Pensions (GASB 68) to recognize the net pension liability, deferred outflows and deferred inflows of resources, pension expense, and information about and changes in the fiduciary net position on the same basis as reported by the respective defined benefit pension plans.
31356 Port of Albany_TEXT.indd 52 4/22/16 10:33 AM

YEARS ENDED DECEMBER 31, 2015 AND 2014 PG53
NOTE 2: SIGNIFICANT ACCOUNTING POLICIES (CONTINUED)
Operating Revenues: The Commission’s operating revenues are principally derived from four sources: property rentals, dockage fees, wharfage fees and security fees. Rental income is earned from tenants leasing buildings and other property owned by the Commission; dockage fees are earned from ships docked at Commission owned facilities; wharfage fees, including stevedore fees, are earned from unloading ships; and security fees are earned by providing certain security related services to tenants and others. Operating revenues also include equipment rentals, storage fees, service charges and other fees.
Operating Expenses: Operating expenses consist principally of payroll and related benefit costs, main-tenance costs, material handling costs, insurance costs, professional and consulting fees, promotional expenses and utilities.
Municipal Support Agreement Costs: The Commission is a party to certain agreements which provide payments, reimbursements, and other municipal support to the cities of Albany and Rensselaer relating to the use of the Corning Preserve and Hudson River waterfront, and for certain fire protection costs and other services provided by the two municipalities (see Note 10).
Capital Funding: Capital funding represents grants, generally from federal and state funding sources, which are designated for capital asset acquisition and/or construction.
Income Taxes: The properties and income of the Commission are exempt from all Federal and State income and franchise taxes.
Estimates and Judgments: The preparation of financial statements in conformity with generally accepted accounting principles requires management to make estimates and assumptions that affect certain reported amounts and disclosures. Actual results could differ from these estimates.
Change in Accounting Principle: Effective January 1, 2015, the Commission adopted Governmental Ac-counting Standards Board Statement No. 68, Accounting and Financial Reporting for Pensions (GASB 68). This statement addresses accounting and financial reporting for pensions provided to the Commission’s employ-ees which are administered by the New York State and Local Employees’ Retirement System. The statement also requires various note disclosures and required supplementary information. The effect of this change in accounting principle on the prior period was an increase of deferred outflows of resources of $231,492 and decrease of net pension liability of $168,479. The net decrease, in the amount of $63,013, has been record-ed as a current year change to the 2015 payroll and related benefit costs in the accompanying statements of revenues and expenses and changes in net position (see Note 7).
Subsequent Events: For purposes of preparing the financial statements, the Commission has considered events through February 24, 2016, the date the financial statements were available to be issued.
Reclassifications: Certain 2014 financial statement line items have been reclassified to conform with the current year's presentation.
31356 Port of Albany_TEXT.indd 53 4/22/16 10:33 AM

PG54 ALBANY PORT DISTRICT COMMISSION
NOTE 3: CASH AND CASH EQUIVALENTS
Cash and cash equivalents consisted of the following at December 31:
2015 2014
CARRYING VALUE BANK BALANCE CARRYING VALUE BANK BALANCE
Deposit accounts $ 1,257,396 $ 1,284,173 $ 2,620,805 $ 2,982,270
At December 31, 2015 and 2014, the Commission’s cash and deposits were covered by FDIC insurance or otherwise collaterally secured.
NOTE 4: INVESTMENTS
At December 31, 2015, investments, which are stated on the statements of net position at market value, are comprised of certificates of deposit and U.S. Government agency obligations, as follows:
INVESTMENT RATE PAR AMOUNT MATURITY
MARKET(CARRYING)
VALUE COST
United States Treasury Bill (.46%) $ 75,000 6/23/2016 $ 74,834 $ 74,836
United States Treasury Note (.75%) 150,000 3/15/2017 149,783 149,295
United States Treasury Note (.875%) 290,000 5/15/2017 289,820 289,987
United States Treasury Note (2.625%) 350,000 1/31/2018 360,829 359,955
United States Treasury Note (1.5%) 100,000 12/31/2018 100,453 99,244
Ally Bank (CD; .7%) 148,000 6/13/2016 148,047 147,951
Ally Bank (CD; .95%) 62,000 2/27/2017 61,974 61,926
American Express Centurion (CD; 2.2%) 50,000 11/10/2016 50,566 50,301
American Express Centurion (CD; 1.35%) 163,000 10/4/2016 163,789 163,255
BMW Bank of North America (CD; 1.15%) 100,000 9/20/2016 100,283 100,249
Barclays Bank (CD; 2%) 95,000 12/21/2016 95,999 95,538
Barclays Bank (CD; .55%) 150,000 4/15/2016 149,994 150,000
Capital One Bank (CD; 1%) 150,000 10/31/2016 150,206 150,182
Compass Bank (CD; 1.15%) 200,000 11/30/2017 199,068 199,241
Discover Bank (CD; 1.75%) 170,000 5/2/2017 171,214 170,731
Discover Bank (CD; .75%) 75,000 5/9/2016 75,041 74,890
Synchrony Bank (CD; 2.25%) 100,000 10/11/2016 101,088 101,034
GE Capital Retail Bank (CD; 1.75%) 200,000 5/4/2017 201,690 200,889
GE Capital Retail Bank (CD; .7%) 45,000 5/31/2016 45,016 44,730
Goldman Sachs Bank USA (CD; 1.6%) 50,000 9/26/2017 50,217 50,124
Goldman Sachs Bank USA (CD; .5%) 100,000 3/7/2016 99,996 99,831
Goldman Sachs Bank USA (CD; 1%) 75,000 2/27/2017 74,969 75,000
Safra National Bank of New York (CD; .45%) 127,000 2/26/2016 126,987 126,896
Sallie Mae Bank (CD; 1.7%) 145,000 8/22/2017 146,221 145,365
Synovus Bank (CD; .65%) 80,000 6/24/2016 80,003 80,045
$ 3,250,000 $ 3,268,087 $ 3,261,495
31356 Port of Albany_TEXT.indd 54 4/22/16 10:33 AM

YEARS ENDED DECEMBER 31, 2015 AND 2014 PG55
NOTE 4: INVESTMENTS (CONTINUED)
At December 31, 2014, investments, which are stated on the statements of net position at market value, were comprised of certificates of deposit and U.S. Government agency obligations, as follows:
INVESTMENT RATE PAR AMOUNT MATURITY
MARKET(CARRYING)
VALUE COST
United States Treasury Note (.75%) $ 150,000 3/15/2017 $ 149,942 $ 149,295
United States Treasury Note (.875%) 290,000 5/15/2017 290,159 289,987
United States Treasury Note (2.625%) 350,000 1/31/2018 365,505 364,648
United States Treasury Note (1.5%) 100,000 12/31/2018 100,133 99,244
Ally Bank (CD; 2.1%) 80,000 9/3/2015 80,822 80,837
Ally Bank (CD; .7%) 148,000 6/13/2016 147,631 147,951
American Express Centurion (CD; 2.2%) 50,000 11/10/2016 50,983 50,647
American Express Centurion (CD; 1.35%) 163,000 10/4/2016 164,133 163,389
BMW Bank of North America (CD; 2%) 55,000 12/29/2015 55,912 55,317
BMW Bank of North America (CD; 2.9%) 50,000 1/22/2015 50,056 50,070
Barclays Bank (CD; 2%) 95,000 12/21/2016 96,492 96,083
Cit Bank Utah (CD; 1.95%) 50,000 12/15/2015 50,615 50,279
Cit Bank Utah (CD; 1.25%) 128,000 2/24/2015 128,137 128,147
Compass Bank (CD; 1.15%) 225,000 6/29/2015 225,698 225,403
Discover Bank (CD; 1.75%) 170,000 5/2/2017 171,219 171,269
Discover Bank (CD; .75%) 75,000 5/9/2016 75,062 74,890
GE Capital Retail Bank (CD; 2.15%) 147,000 8/27/2015 148,538 148,501
GE Capital Retail Bank (CD; 1.1%) 100,000 5/26/2015 100,243 100,266
GE Capital Bank (CD; 1.75%) 200,000 5/4/2017 201,886 201,541
GE Capital Bank Retail (CD; .7%) 45,000 5/31/2016 44,901 44,730
Goldman Sachs Bank USA (CD; .5%) 100,000 3/7/2016 99,917 99,831
Mizuho Bank USA (CD; .25%) 170,000 1/30/2015 170,010 170,010
Safra National Bank of New York (CD; .5%) 121,000 3/16/2015 121,021 121,003
Sallie Mae Bank (CD; 1.7%) 145,000 8/22/2017 146,264 145,583
$ 3,207,000 $ 3,235,279 $ 3,228,921
The Commission’s investments are categorized in accordance with criteria established by GASB to give an indication of the level of risk assumed by the Commission at year end. Category 1 includes investments that are insured or registered or for which the securities are held by the Commission or its agent in the Commission’s name. Category 2 includes uninsured and unregistered investments for which the securities are held by the counter parties trust department or agent in the Commission’s name. Category 3 includes uninsured and unregistered investments for which the securities are held by the counter parties, or by its trust department or agent, but not in the Commission’s name. All of the Commission’s investments at December 31, 2015 and 2014 are categorized as Category 1.
31356 Port of Albany_TEXT.indd 55 4/22/16 10:33 AM

PG56 ALBANY PORT DISTRICT COMMISSION
NOTE 5: PROPERTY AND EQUIPMENT
At December 31, 2015 property and equipment was comprised of the following:
DEC. 31, 2014 ADDITIONS DELETIONS DEC. 31, 2015
Port marine facilities $ 94,102,530 $ 3,460,029 $ 578,516 $ 96,984,043
Transportation, equipment and furniture 994,552 325,960 18,871 1,301,641
Construction in process 347,692 468,808 441,692 374,808
Total 95,444,774 4,254,797 1,039,079 98,660,492
Less accumulated depreciation 52,543,106 1,948,358 597,387 53,894,077
Net property and equipment $ 42,901,668 $ 2,306,439 $ 441,692 $ 44,766,415
At December 31, 2014 property and equipment was comprised of the following:
DEC. 31, 2013 ADDITIONS DELETIONS DEC. 31, 2014
Port marine facilities $ 78,874,932 $ 15,385,507 $ 157,909 $ 94,102,530
Transportation, equipment and furniture 967,651 26,901 − 994,552
Construction in process 6,861,081 347,692 6,861,081 347,692
Total 86,703,664 15,760,100 7,018,990 95,444,774
Less accumulated depreciation 51,055,739 1,487,367 − 52,543,106
Net property and equipment $ 35,647,925 $ 14,272,733 $ 7,018,990 $ 42,901,668
Depreciation expense was $1,948,358 and $1,487,367 for the years ended December 31, 2015 and 2014, respectively.
NOTE 6: LONG-TERM DEBT
Long-term debt is comprised of the following:
DEC. 31, 2014 DEBT ISSUED DEBT PAYMENTS DEC. 31, 2015
Bank of America lease obligation $ 2,990,586 $ − $ 433,844 $ 2,556,742
Less current maturities 433,844 443,087
$ 2,556,742 $ 2,113,655
The Commission is obligated under a June 2014 master lease financing agreement with Bank of America in the original amount of $3,000,000. Funds under the financing agreement were primarily utilized to retire another Commission obligation and to acquire certain Port related facility equipment. The agreement requires monthly payments, beginning in December 2014, of approximately $41,000, including interest at approximately 2.1%, with final maturity in June 2021. The obligation is collateralized by certain Commission assets.
31356 Port of Albany_TEXT.indd 56 4/22/16 10:33 AM

YEARS ENDED DECEMBER 31, 2015 AND 2014 PG57
NOTE 6: LONG-TERM DEBT (CONTINUED)
At December 31, 2015, long-term debt maturities were comprised of the following:
YEAR ENDING PRINCIPAL INTEREST TOTAL
2016 $ 443,087 $ 49,679 $ 492,766
2017 452,527 40,239 492,766
2018 462,168 30,598 492,766
2019 472,015 20,751 492,766
2020 482,071 10,695 492,766
Thereafter 244,874 1,507 246,381
$ 2,556,742 $ 153,469 $ 2,710,211
Interest expense was $57,529 and $70,824 for 2015 and 2014, respectively.
NOTE 7: RETIREMENT PLAN AND RELATED BENEFITS
Introduction
Substantially all Albany Port District Commission full-time employees participate in the New York State and Local Employees' Retirement System ("System" or “ERS”). The System is a cost-sharing multiple-employer defined benefit plan administered by the State Comptroller. Plan benefits, including retirement and disability benefits, annual cost-of-living adjustments and death benefits to plan members and beneficiaries are provid-ed under the provisions of the New York State Retirement and Social Security Law and are guaranteed under the State Constitution. In general, retirement benefits are determined based on an employee’s individual circumstances using a pension factor, an age factor, and final average salary. The benefits vary depending on the individual’s employment tier. Pension factors are determined based on tier and an employee’s years of service, among other factors. The System issues a financial report that includes financial statements and other information for the System which is available to the public. The financial report may be obtained from the New York State and Local Employees’ Retirement System at www.osc.state.ny.us/retire.
No employee contribution is required for those hired prior to July 1976. The System requires employee contributions of 3% of salary for the first 10 years of service for those employees who joined the System from July 1976 through December 2009. Participants hired on or after January 1, 2010 through March 31, 2012 are required to contribute 3% of compensation throughout their active membership in the System. Participants hired on or after April 1, 2012 are required to contribute a percentage ranging from 3% to 6% each year, based on their level of compensation. The Comptroller annually certifies the rates used, expressed as a percentage of the wages of participants, to compute the contributions required to be made by the Commission to the pension accumulation fund. For 2015, these rates ranged from 10.9% - 25.3% for the Commission’s active employees. Employee contributions are deducted from their salaries and remitted on a current basis to the System.
Net Pension Liability, Pension Expense, and Deferred Outflows/Inflows of Resources
At December 31, 2015, the Commission reported a liability of $125,953 for its proportionate share of the ERS net pension liability. The ERS net pension liability was measured as of March 31, 2015, and the total pension liability was determined by an actuarial valuation as of April 1, 2014, with updated procedures used to roll forward the total pension liability to March 31, 2015. The Commission’s proportion of the net pension liability was based on the ratio of its actuarially determined employer contribution to ERS’s total actuarially determined employer contribution for the fiscal year ended on the measurement date. At the March 31, 2015 measurement date, the Commission’s proportion was 0.0037284%.
31356 Port of Albany_TEXT.indd 57 4/22/16 10:33 AM

PG58 ALBANY PORT DISTRICT COMMISSION
NOTE 7: RETIREMENT PLAN AND RELATED BENEFITS (CONTINUED)
Net Pension Liability, Pension Expense, and Deferred Outflows/Inflows of Resources (CONTINUED)
For the year ended December 31, 2015, the Commission recognized net pension expense of $123,803 from ERS and reported deferred outflows and deferred inflows of resources as follows:
DEFERRED OUTFLOWS OF
RESOURCES
DEFERRED INFLOWS OF RESOURCES
Differences between expected and actual experience $ 4,032 $ –
Net difference between projected and actual earnings on pension plan investments
21,876 –
Changes in proportion and differences between commission contributions and proportionate share of contributions
39,255 –
Commission contributions subsequent to measurement date 186,364 –
$ 251,527 $ –
Amounts reported as deferred outflows and deferred inflows of resources related to pensions will be recognized in pension expense as follows:
YEARS ENDING JUNE 30 NET DEFERRED OUT-FLOWS OF RESOURCES
2016 $ 202,654
2017 16,291
2018 16,291
2019 16,291
2020 –Thereafter –
$ 251,527
Actuarial Assumptions
For ERS, the actuarial assumptions used in the April 1, 2014 valuation, with update procedures used to roll forward the total pension liability to March 31, 2015, were based on the results of an actuarial experience study for the period April 1, 2005 to March 31, 2010. These assumptions are:
Inflation: 2.7%Salary increases: 4.9%Investment rate of return: 7.5% compounded annually, net of investment expense, including inflationMortality: Based on ERS experience from April 1, 2005– March 31, 2010 with adjustments for mortality improvements based on the Society of Actuaries’ Scale MP-2014Discount rate: 7.5%
31356 Port of Albany_TEXT.indd 58 4/22/16 10:33 AM

YEARS ENDED DECEMBER 31, 2015 AND 2014 PG59
NOTE 7: RETIREMENT PLAN AND RELATED BENEFITS (CONTINUED)
Actuarial Assumptions (CONTINUED)
The long-term expected rate of return on the System’s pension plan investments was determined in accordance with Actuarial Standard of Practice No. 27, Selection of Economic Assumptions for Measuring Pension Obligations. Consideration was given to expected future real rates of return (expected returns, net of pension plan investment expense and inflation) for each major asset class as well as historical investment data and plan performance.
Investment Asset AllocationThe System’s best estimate of arithmetic real rates of return for each major asset class and the System’s target asset asset allocations as of the applicable valuation dates are summarized as follows:
ASSET CLASS
TARGET ALLOCATION
LONG-TERM EXPECTED REAL RATE OF RETURN
Domestic equities 38% 7.30%
International equities 13% 8.55%
Private equities 10% 11.00%
Real estate 8% 8.25%
Absolute return strategies 3% 6.75%
Opportunistic portfolio 3% 8.60%
Real assets 3% 8.65%
Bonds and mortgages 18% 4.00%
Short-term 2% 2.25%
Inflation-Indexed bonds 2% 4.00%
100%
Discount Rate
The discount rate projection of cash flows assumed that contributions from plan members will be made at the current member contribution rates and that contributions from employers will be made at statutorily required rates, actuarially determined. Based on those assumptions, the System’s fiduciary net position was projected to be available to make all projected future benefit payments of current plan members. Therefore, the long-term expected rate of return on pension plan investments was applied to all periods of projected benefit payments to determine the total pension liability.
The following table presents the Commission’s proportionate share of its net pension liability calculated using the discount rate of 7.5% and the impact of using a discount rate that is 1% higher or lower than the current rate.
1.0% DECREASE 7.5% 1.0% INCREASE
Commission's proportionate share of the ERS net pension liability (asset)
$ 839,541 $ 125,953 $ (476,490)
31356 Port of Albany_TEXT.indd 59 4/22/16 10:33 AM

PG60 ALBANY PORT DISTRICT COMMISSION
NOTE 7: RETIREMENT PLAN AND RELATED BENEFITS (CONTINUED)
Other Information
A schedule of Commission’s contributions to the System is as follows:
MARCH 31 2015 2014 2013 2012 2011 2010(B)
Contractually required contribution $ 234,306 $ 180,550 $ 151,392 $ 119,125 $ 111,408 $ 20,025
Contribution in relation to the contractually required contribution (234,306) (180,550) (151,392) (119,125) (111,408) (20,025)
Contribution deficiency (excess) $ − $ − $ − $ − $ − $ −
Commission's covered- employee payroll $ 1,018,746 $ 861,386 $ 726,234 $ 711,985 $ 739,670 $ 544,045
Contributions as a percentage of covered-employee payroll 23.00% 20.96% 20.85% 16.73% 15.06% 3.68%
(B)Actuarial data prior to 2010 is unavailable.
Other information on the Commission’s net pension liability, as of March 31, 2015(A), is as follows:
Commission's proportion of the System's net pension liability 0.003728%
Commission's proportionate share of the System's net pension liability $ 125,953
Commission's covered-employee payroll $ 1,018,746
Commission's proportionate share of the System's net pension liability as a percentage of its covered-employee payroll
12.36%
Plan fiduciary net position as a percentage of the total pension liability 97.90%
(A)Actuarial data prior to 2015 is unavailable.
NOTE 8: OTHER POST-EMPLOYMENT BENEFITSThe Commission provides certain health care benefits for retired employees and their covered dependents. Employees of the Commission become eligible for those benefits if they reach normal retirement age while working for the Commission. The Commission recognizes the cost of providing post-retirement health insur-ance benefits according to GASB Statement No. 45, Accounting and Financial Reporting by Employers for Postemployment Benefits Other Than Pensions, prospectively. This Statement establishes standards for the recognition, measurement, and display of other postemployment benefits (retiree health insurance) expenses and related liabilities and note disclosures.
31356 Port of Albany_TEXT.indd 60 4/22/16 10:33 AM
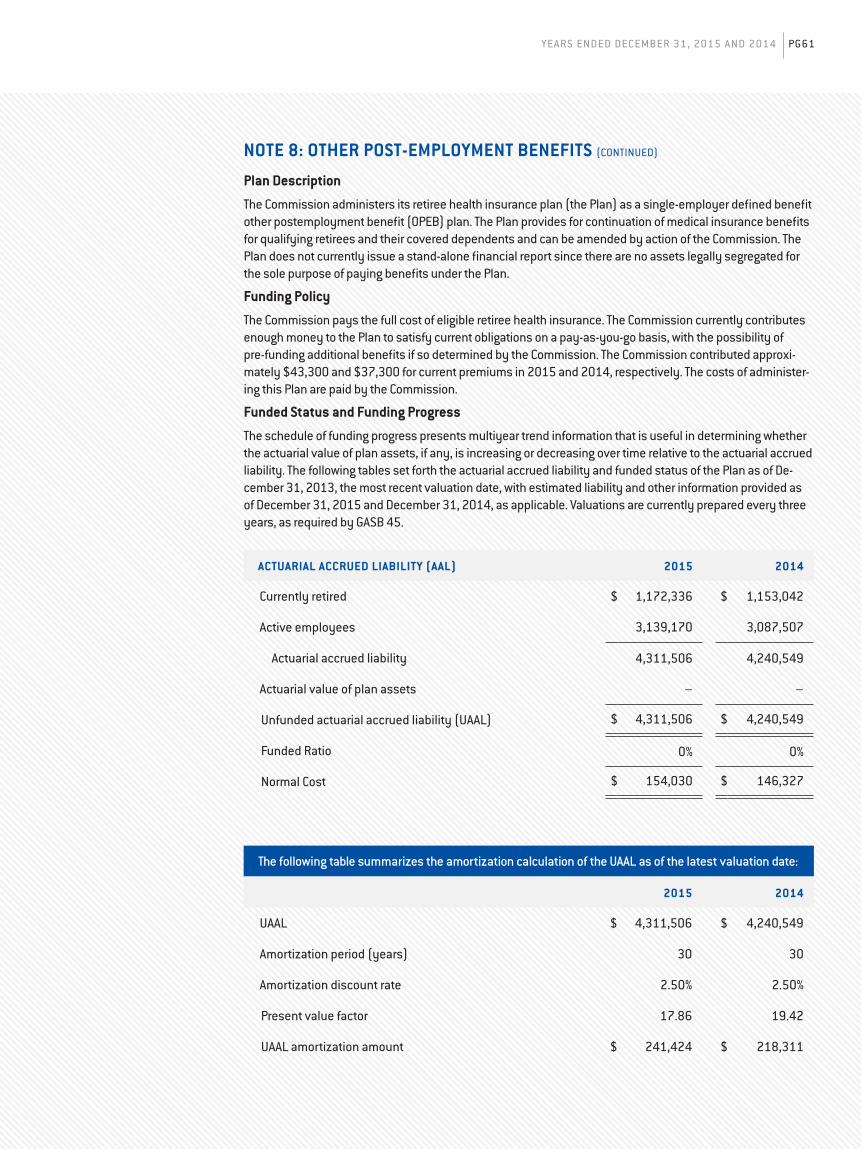
YEARS ENDED DECEMBER 31, 2015 AND 2014 PG61
NOTE 8: OTHER POST-EMPLOYMENT BENEFITS (CONTINUED)
Plan Description
The Commission administers its retiree health insurance plan (the Plan) as a single-employer defined benefit other postemployment benefit (OPEB) plan. The Plan provides for continuation of medical insurance benefits for qualifying retirees and their covered dependents and can be amended by action of the Commission. The Plan does not currently issue a stand-alone financial report since there are no assets legally segregated for the sole purpose of paying benefits under the Plan.
Funding Policy
The Commission pays the full cost of eligible retiree health insurance. The Commission currently contributes enough money to the Plan to satisfy current obligations on a pay-as-you-go basis, with the possibility of pre-funding additional benefits if so determined by the Commission. The Commission contributed approxi-mately $43,300 and $37,300 for current premiums in 2015 and 2014, respectively. The costs of administer-ing this Plan are paid by the Commission.
Funded Status and Funding Progress
The schedule of funding progress presents multiyear trend information that is useful in determining whether the actuarial value of plan assets, if any, is increasing or decreasing over time relative to the actuarial accrued liability. The following tables set forth the actuarial accrued liability and funded status of the Plan as of De-cember 31, 2013, the most recent valuation date, with estimated liability and other information provided as of December 31, 2015 and December 31, 2014, as applicable. Valuations are currently prepared every three years, as required by GASB 45.
ACTUARIAL ACCRUED LIABILITY (AAL) 2015 2014
Currently retired $ 1,172,336 $ 1,153,042
Active employees 3,139,170 3,087,507
Actuarial accrued liability 4,311,506 4,240,549
Actuarial value of plan assets – –
Unfunded actuarial accrued liability (UAAL) $ 4,311,506 $ 4,240,549
Funded Ratio 0% 0%
Normal Cost $ 154,030 $ 146,327
The following table summarizes the amortization calculation of the UAAL as of the latest valuation date:
2015 2014
UAAL $ 4,311,506 $ 4,240,549
Amortization period (years) 30 30
Amortization discount rate 2.50% 2.50%
Present value factor 17.86 19.42
UAAL amortization amount $ 241,424 $ 218,311
31356 Port of Albany_TEXT.indd 61 4/22/16 10:33 AM

PG62 ALBANY PORT DISTRICT COMMISSION
NOTE 8: OTHER POST-EMPLOYMENT BENEFITS (CONTINUED)
Annual OPEB Cost and Net OPEB Obligation
The Commission’s annual OPEB cost (expense) is calculated based on the annual required contribution of the employer (ARC), an amount actuarially determined in accordance with the parameters of GASB Statement 45. The ARC represents a level of funding that, if paid on an ongoing basis, is projected to cover normal cost each year and amortize any unfunded actuarial liabilities over a period not to exceed thirty years.
The following table shows the components of the Commission’s annual OPEB cost:
2015 2014
Normal cost $ 154,030 $ 146,327
Amortization of UAAL 241,424 218,311
ARC 395,454 364,638
Interest on OPEB obligation 51,518 29,172
Adjustment to ARC (113,650) (60,074)
OPEB expense $ 333,322 $ 333,736
The following table reconciles the Commission’s OPEB obligation at December 31:
2015 2014
Net OPEB obligation at beginning of year $ 1,761,997 $ 1,465,572
Annual OPEB expense 333,322 333,736
Annual OPEB contributions (43,268) (37,311)
Net OPEB obligation at end of year 2,052,051 1,761,997
Less: estimated current portion of OPEB obligation 43,000 35,000
Estimated long-term portion of OPEB obligation $ 2,009,051 $ 1,726,997
Percentage of expense contributed 13.0% 11.2%
Trend Information:
YEAR ENDED
BEGINNING OPEB
OBLIGATION
ANNUAL OPEB COST
ACTUAL EMPLOYER
CONTRIBUTIONPERCENTAGE
CONTRIBUTEDNET OPEB
OBLIGATION
12/31/2013 $ 1,166,893 $ 333,736 $ 35,057 10.5% $ 1,465,572
12/31/2014 1,465,572 333,736 37,311 11.2% 1,761,997
12/31/2015 1,761,997 333,322 43,268 13.0% 2,052,051
31356 Port of Albany_TEXT.indd 62 4/22/16 10:33 AM

YEARS ENDED DECEMBER 31, 2015 AND 2014 PG63
NOTE 8: OTHER POST-EMPLOYMENT BENEFITS (CONTINUED)
Actuarial Methods and Assumptions
The projected unit credit actuarial cost method was used to estimate the Commission’s OPEB obligation. Actuarial valuations of an ongoing plan involve estimates of the value of reported amounts and assumptions about the probability of occurrence of events far into the future. Examples include assumptions about future employment, mortality, and the healthcare cost trend. Amounts determined regarding the funded status of the plan and the annual required contributions of the employer are subject to continual revision as actual results are compared with past expectations and new estimates are made about the future. Projections of benefits for financial reporting purposes are based on the substantive plan and include the types of benefits provided at the time of each valuation and the historical pattern of sharing of benefit costs (if any) between the employer and plan members to that point. The actuarial methods and assumptions used include tech-niques that are designed to reduce the effects of short-term volatility in actuarial accrued liabilities and the actuarial value of assets, consistent with the long-term perspective of the calculations.
The measurement date for the calculation was December 31, 2013 and the discount rate utilized was 2.50%. No salary increases were assumed since benefits are not based on compensation. Health care costs were assumed to increase as follows:
YEAR TREND INCREASE
2014 7.37%
2015 6.90%
2016 6.43%
2017 5.96%
2018 5.93%
2019 5.91%
2020 5.89%
2025 5.78%
2030 5.81%
2040 5.19%
2050 5.00%
2060 4.83%
2070 4.35%
Thereafter 4.35%
An additional 1% increase in the health care trend rate would have a material adverse effect on the OPEB obligation.
31356 Port of Albany_TEXT.indd 63 4/22/16 10:33 AM

PG64 ALBANY PORT DISTRICT COMMISSION
NOTE 9: PROPERTY HELD FOR LEASEThe Commission has entered into various operating leases with tenants for the use of space at Port owned buildings, terminals, offices, and other facilities.
The approximate minimum future rentals scheduled to be received on operating leases in effect on December 31, 2015 were as follows:
2016 $ 2,978,000
2017 2,829,000
2018 2,099,000
2019 1,884,000
2020 1,871,000
Thereafter 10,867,000
$ 22,528,000
NOTE 10: WATERFRONT DEVELOPMENT COSTS
Lease Obligation Relating to Waterfront Development
The Commission is committed to supporting the City of Albany’s efforts in developing the Corning Preserve and Hudson River waterfront. In this regard, during 2002, the Albany Industrial Development Agency (AIDA) issued $4,390,000 in Civic Facility Revenue Bonds for the benefit of Capitalize Albany Corporation (CAC), for construction relating to the Corning Preserve/Hudson Riverfront Development Project. The majority of the net proceeds of the Revenue Bonds were utilized to fund various improvements to the project site for recreational and entertainment uses. Concurrent with the issuance of the bonds, CAC and the Commission entered into a shared use and lease agreement, under which CAC leases the project to the Commission for a 30 year lease term. At the end of the lease term, in 2033, the agreement pro-vides that the project improvements are owned by CAC. Accordingly, all current improvements made to the project by the Commission are expensed when incurred by the Commission.
Under the shared use and lease agreement, which is accounted for as an operating lease by the Commission, the Commission is obligated to fully fund CAC’s obligations relating to the project, including the funding of installment payments sufficient to cover all related bond debt ser-vice and certain other contractual improvement and operating expenses. The AIDA/CAC bonds are 25 year variable rate demand obligations, currently bearing interest at approximately .1%, with rates established weekly by a remarketing agent. As such, the Commission’s annual lease obligation will likely change on a year-to-year basis and, in an increasing interest rate environment, these changes may be material.
The bonds are secured by a letter of credit issued by Key Bank and guaranteed by the Commission. Under the letter of credit, any grant proceeds received for the project are required to reduce the outstanding bonds. The letter of credit requires future principal debt reduction pay-ments, ranging from $175,000 in 2016 to $255,000 in 2024, thus providing for the full amortization of the bonds by the 2027 maturity date.
Future debt reduction payments are expected as follows:
YEAR ENDING AMOUNT
2016 $ 175,000
2017 180,000
2018 190,000
2019 200,000
2020 210,000
Thereafter 940,000
$ 1,895,000
31356 Port of Albany_TEXT.indd 64 4/22/16 10:33 AM

YEARS ENDED DECEMBER 31, 2015 AND 2014 PG65
NOTE 10: MUNICIPAL SUPPORT AGREEMENTS (CONTINUED)
The bonds have no prepayment constraints and, as such, holders have the option to redeem bonds at any time. The letter of credit terms, as disclosed above, may also impact the Commission’s annual lease obligation.
During 2015 and 2014, the Commission’s total lease cost, project improvement cost, and other operating ex-penses related to the waterfront development project approximated $224,000 and $271,000, respectively. These costs are included in the statements of revenues and expenses.
NOTE 11: COMMITMENTS AND CONTINGENCIES
Claims and Litigation
The Commission is a defendant in various claims, lawsuits and actions arising in the normal course of oper-ations. In the opinion of the Commission's management, the ultimate amount of any liabilities which may be incurred in connection with the settlement of claims and litigation will not materially affect the Commission's financial condition.
Municipal Support Agreement Costs
The Commission has entered into Memorandums of Understanding (MoU) with the City of Albany and the City of Rensselaer under which the Commission has agreed to fund certain firefighting, emergency response, and other municipal support services provided by the two cities. The total annualized costs of these support MoU’s currently approximates $600,000. The current year expense, in the amount of $200,000, is included in the 2015 statement of revenues and expenses. In addition, approximately $400,000 of prepaid municipal service agreements costs are included in other assets in the statements of net position at December 31, 2015 (none at December 31, 2014).
Federal and State Grants
In both 2015 and 2014, the Commission’s grant funding primarily related to a wharf reconstruction project funded by the New York State Department of Transportation, which provided approximately $9,885,000 in New York State funding, representing approximately 78% of the total project costs. During the current year, the Commission completed the grant funded portion of the multi-year wharf reconstruction project. Revenue under this grant of approximately $959,000 and $5,836,000 was recognized in 2015 and 2014, respective-ly, and is included in capital grant funding in the accompanying statements of revenues and expenses and changes in net position.
The Commission’s grants are subject to audit by agencies of the Federal and State governments. Such audits may result in disallowances and a request for a return of funds to the Federal and State governments.
31356 Port of Albany_TEXT.indd 65 4/22/16 10:33 AM

PG66 ALBANY PORT DISTRICT COMMISSION
SUPPLEMENTARY INFORMATION
Schedules of Payroll and Related Costs and Other Operating Expenses Years ended December 31, 2015 and 2014
PAYROLL AND RELATED COSTS
2015 2014
Administrative $ 941,596 $ 654,939
Maintenance crews and supervisor 347,951 310,884
Security 397,306 392,292
Pension and other benefit costs 374,247 530,728
OPEB expense 333,321 333,737
Payroll taxes 127,107 122,594
Total payroll and related costs $ 2,521,528 $ 2,345,174
OTHER OPERATING EXPENSES
2015 2014
Security $ 35,487 $ 70,673
Utilities 61,518 105,695
City water 9,375 12,256
Advertising and promotion 66,105 51,878
Office supplies and expenses 63,100 82,293
Telephone 28,372 28,667
Snow removal 10,327 8,062
Equipment operating expense 96,533 112,468
Other expenses 74,284 58,615
Total other operating expenses $ 445,101 $ 530,607
31356 Port of Albany_TEXT.indd 66 4/22/16 10:33 AM

YEARS ENDED DECEMBER 31, 2015 AND 2014 PG67
Independent Auditor's Report on internal control over financial reporting and on compliance and other matters, including compliance with investment guidelines, based on an audit of financial statements performed in accordance with government auditing standards.
To the Commissioners Albany Port District Commission
We have audited, in accordance with the auditing standards generally accepted in the United States of Amer-ica and the standards applicable to financial audits contained in Government Auditing Standards, issued by the Comptroller General of the United States; and Investment Guidelines for Public Authorities issued by the Office of the State Comptroller, State of New York, the financial statements of the Albany Port District Commis-sion (the “Commission”) as of and for the year ended December 31, 2015, and have issued our report thereon dated February 24, 2016.
Internal Control Over Financial Reporting
In planning and performing our audit, we considered the Commission’s internal control over financial reporting (internal control) to determine the audit procedures that are appropriate in the circumstances for the purpose of expressing our opinion on the financial statements, but not for the purpose of expressing an opinion on the effectiveness of the Commission’s internal control. Accordingly, we do not express an opinion on the effec-tiveness of the Commission’s internal control.
A deficiency in internal control exists when the design or operation of a control does not allow management or employees, in the normal course of performing their assigned functions, to prevent or detect and correct misstatements on a timely basis. A material weakness is a deficiency, or a combination of deficiencies, in in-ternal control such that there is a reasonable possibility that a material misstatement of the entity’s financial statements will not be prevented, or detected and corrected on a timely basis. A significant deficiency is a deficiency, or a combination of deficiencies, in internal control that is less severe than a material weakness, yet important enough to merit attention by those charged with governance.
Our consideration of the internal control over financial reporting was for the limited purpose described in the first paragraph of this section and was not designed to identify all deficiencies in internal control that might be material weaknesses or significant deficiencies. Given these limitations, during our audit we did not identi-fy any deficiencies in internal control over financial reporting that we consider to be material weaknesses. However, material weaknesses may exist that have not been identified.
Compliance and Other Matters
As part of obtaining reasonable assurance about whether the Commission’s financial statements are free of material misstatement, we performed tests of its compliance with certain provisions of laws, regulations, con-tracts and grant agreements and other matters, including Investment Guidelines for Public Authorities and the Commission’s Investment Guidelines, noncompliance with which could have a direct and material effect on the determination of financial statement amounts. However, providing an opinion on compliance with those provisions was not an objective of our audit, and accordingly, we do not express such an opinion. The results of our tests disclosed no instances of noncompliance or other matters that are required to be reported under Government Auditing Standards.
Purpose of This Report
This report is intended solely for the information and use of the Commissioners and management of the Al-bany Port District Commission, others within the entity, federal awarding agencies, pass-through entities and New York State departments and agencies, and is not intended to be and should not be used by anyone other than these specified parties.
Albany, New YorkFebruary 24, 2016
31356 Port of Albany_TEXT.indd 67 4/22/16 10:33 AM

PG68 ALBANY PORT DISTRICT COMMISSION
RICHARD J. HENDRICK General Manager
PATRICK K. JORDAN General Counsel*
TERRY HURLEY CFO
DAVID B. WILLIAMS Security & Threat Assessment Director
JAMES TELLER Security & Threat Assessment Deputy Director
JOHN KOSA Director of Operations
THOMAS MCGUINNESS Director of Information Technology
ANNIE FITZGERALD Staff Accountant & Human Resources Manager
MEGAN DALY Director of Economic Development & Procurement
ANNETTE GASPARY Administrative Assistant to General Counsel
ERIK J. SMITH Director of Internal Controls & Enterprise Analysis
LINDA WILKINSON Commission Secretary
ANTHONY J. VASIL Director of Business Development & Marketing
JANE MCNALLY Administrative Assistant to Business Manager
MAINTENANCE STAFF
JAMES WILLIAMS Foreman
JOSH OSTRANDER
JASON CARROLL
PAUL EDDY
RJ HENDRICK
*As of March, 2016 Federal Marine Terminal (FMT) is the Port of Albany’s Longshore labor
PORT COMMISSION STAFF
31356 Port of Albany_TEXT.indd 68 4/22/16 10:33 AM

FAIR WINDS AND FOLLOWING SEAS
For 15 years, Thomas M. Owens, Esq. provided counsel to the Albany Port District Commis-sion, on retainer and then becoming full time General Counsel. Tom’s service was integral to the APDC fulfilling its mission and advancing the reputation and progression of the Port of Albany. Tom’s education, experience in law, engineering and 30 years in the U.S. Navy provided him a unique blend of expertise that brought the Port to another level. Integrity, professionalism and customer service de-scribes the manner in which Tom served the APDC responsibly and with distinction while
contributing to the Capital Region and beyond. His personal conduct however—his partner-ship, kindness, fairness and honesty, made the Port the best team to work with.
In 2015, Tom took a new opportunity and left the Port for a private venture. The Board of Commissioners, General Manager, and staff of the APDC thank Tom for his years of service as a trusted colleague and good friend. It is no doubt that Tom left the Albany Port District Commission a better place than when he start-ed, and for that we offer great thanks and wish him “Fair Winds and Following Seas.”

PORT OF ALBANY 106 SMITH BLVD.
ALBANY, NY 12202 518-463-8763
PORTOFALBANY.US
© 2016 ALBANY PORT DISTRICT COMMISSION. ALL RIGHTS RESERVED.