Embed Size (px)
Citation preview

Port Surface Transportation Infrastructure Survey
The State of Freight
April 21, 2015 Version 1.2
In Peter Zeihan’s acclaimed 2014 book, “The Ac-cidental Superpower,” he cites the overwhelming freight transportation advantage the United States has over other trading nations in its system of ports and waterways. He argues that America has more miles of navigable waterways than any other na-tion, together with an enviable coastal geography of naturally deep harbors, barrier islands and indenta-tions that are unmatched for seaport development anywhere in the world.
Unfortunately, due to insufficient investment in its freight transportation infrastructure, every day America is losing some of the goods movement advantage asserted in Mr. Zeihan’s book.
Seaports are the backbone of a thriving 21st century global economy. Yet, a nation’s freight transportation system is only as good as its underlying infrastruc-ture. In the American Association of Port Authorities’ (AAPA) 2015 Surface Transportation Infrastructure Survey - The State of Freight, results indicate that the nation’s unsurpassed goods movement network needs immediate and significant investment in the arteries that carry freight to and from its seaports. Without that investment, the American economy, the jobs it produces and the international competitive-ness it offers will erode and suffer, creating predict-able and oftentimes severe hardships to the individu-als who live and businesses that operate within its borders.
In 2013 alone, some 1.3 billion metric tons of im-ported and exported cargo, worth nearly $1.75 trillion, moved through America’s seaports, while an estimated 900 million metric tons of domestic cargo with a market value of over $400 billion was also handled through these international gateways.
Port-related infrastructure connects American farm-ers, manufacturers and consumers to the world marketplace and is facilitating the increase of American exports that are essential to the nation’s sustained economic growth. In 2007, Martin Associ-ates, of Lancaster, PA, reported that U.S. port activ-ity was responsible for about 13.3 million American jobs and $212.4 billion in federal, state and local tax revenue. Martin Associates’ 2015 nationwide port economic impacts update study shows the benefits
Executive Summary
1 in 3 U.S. ports need at least
$100 MILLION in intermodal upgrades to handle projected 2025 freight volumes

of America’s seaports having risen sharply over the intervening years, now responsible for 23.1 million U.S. jobs and $321.1 billion in federal, state and local tax revenue. According to the study, marine cargo activity at U.S. deep-water ports also generated $4.6 trillion in total economic activity, or roughly 26% of the nation’s economy in 2014, compared to $3.2 tril-lion in combined economic activity associated with U.S. deep-water ports in 2007, or roughly 20% of the nation’s GDP at the time.
Despite the importance to the economy, freight in-vestments are disadvantaged in the current transpor-tation planning and funding process. Freight projects face competition from non-freight projects for public funds and community support. Although passenger and freight movements must coexist on America’s transportation network, these are two distinctly dif-ferent stakeholder constituencies.
Because there’s no clear definition of what constitutes “freight projects” in the federal government lexicon, there’s been a lack of coordination among federal and state government entities and private sector stake-holders. This has resulted in a shortage of public funds to plan and invest in the nation’s freight net-work and address the key freight chokepoints that impact both passenger and freight constituencies.
Due to their significant role in driving commerce, public seaports have the experience to help grow the economy, create jobs and promote an efficient, safe and environmentally sustainable freight network. As in any other successful operation, every port has a business plan for its long-term success to identify
markets, leverage assets and prioritize and sustain its capital investments. Similarly, if America wants its transportation system to achieve long-lasting and sustainable success, it must implement a national freight plan to develop, sustain and grow its advan-tages for moving goods.
The results of AAPA’s infrastructure survey reinforce one of the industry’s key messages, “Seaports Deliver Prosperity.” The survey also illustrates the signifi-cant steps public ports are making and have made in working with the planning community in developing and investing in freight projects. This has been par-ticularly evident since passage of the 2012 Moving Ahead for Progress in the 21st Century Act (MAP-21), which laid out a clear and aggressive vision on how America plans and coordinates a national freight plan through collaboration with the individual states.
Additionally, this survey helps define the role ports are continuing to play in developing innovative Public Private Partnerships (P3s) with the nation’s business sector, and facilitating additional resources into the process.
This survey focuses on seaports – critical gateways in the U.S. freight network through which more than 99% of America’s overseas trade must pass. While there are other components of the freight network that must be addressed, the impact of vital sea-port “first and last mile” connectors on the country’s regional and national transportation infrastructure cannot be overstated. Ports are national models of effective intermodalism and are the very definition of critical infrastructure.
“Enhancing connections between highway and rail systems and port infrastructure will be a key part of ensuring the first and last mile of transportation infrastructure supports growing demand.” U.S. Senator John Thune (R-SD)
Chairman, Senate Committee on Commerce, Science and Transportation
From 2007-2014 the annual impact of America’s seaports increased:43% to $4.6 trillion
in total U.S. economic value
51% to $321.1 billion in federal, state & local tax revenue
74% to 23.1 million U.S. jobs
100% to $1.5 billion in personal wages & salaries

Survey Purpose and Participation
The purpose of AAPA’s 2015 Port Surface Freight In-frastructure Survey is to quantify the baseline need for investment in port infrastructure connecting the United States’ deep-draft seaports to the rest of the nation’s freight transportation system. The survey results reflect responses to questions asked of AAPA’s 83 U.S. member public ports in the six months leading up to the pub-lication of this report. With a 95% response rate, the survey represents nearly all of the top U.S. seaports on the Atlantic, Pacific and Gulf coasts, and along the Great Lakes.
The survey seeks to illustrate the critical nature of connection points between seaports and the national surface transportation system, including highway con-nectors and on-dock rail. It’s at these critical connec-tion and transfer points that the efficiency of moving freight through seaports and to and from the interior of the country can be maximized. These connection and transfer points for goods are the foundation of America’s freight network.
The freight network is vast and evolving. It’s a living grid that infuses an economic lifeline throughout the country; from small towns to major metropolitan regions, and farming districts to technology centers like Silicon Valley. At its heart are America’s seaports, which handle an overwhelming majority of the nearly $6 billion worth of products that move to and from overseas markets every day. For the network to work properly, it must seamlessly connect to commerce centers in every community, state and territory, as well as to an ever-growing and vibrant inland waterway system that is unparalleled worldwide.
“Every type of transportation plays an important role in our national transportation network, but maritime and waterborne transportation in particular serves as our country’s connection to the world economy.”
U.S. Representative Bill Shuster (R-PA) Chairman, House Committee on Transportation and Infrastructure
4
Analysis of Surface Transportation Connectors With PortsIt’s been two decades since the United States addressed its surface transportation connectors. In 1995, the National Highway System (NHS) Designation Act, directed the Secretary of the U.S. Department of Transpor-tation (USDOT) to develop a list of NHS intermodal connectors. With the input of state departments of trans-portation, the list was completed in 1998. In 2000, USDOT reported to Congress on the state of NHS Intermo-dal Freight Connectors. USDOT identified significant deficiencies in U.S. freight connectors and estimated the cost of them to be $2.6 billion.
Between 2000 and 2013, the volume of containers shipped through U.S. ports grew by approximately 50%, from 30.4 million to 44.6 million twenty-foot equivalent units (TEUs), adding further strain to port highway and rail connectors. The population in U.S. metropolitan areas also grew by 33 million people (14%) over the same period, which created a related increase in the demand for goods.
In the AAPA survey, respondents were asked what they anticipated the minimum cost would be over the next decade (through 2025) to upgrade the intermodal connections at their port so it could efficiently handle all of their projected inbound and outbound cargo.
Key Survey Results Included:
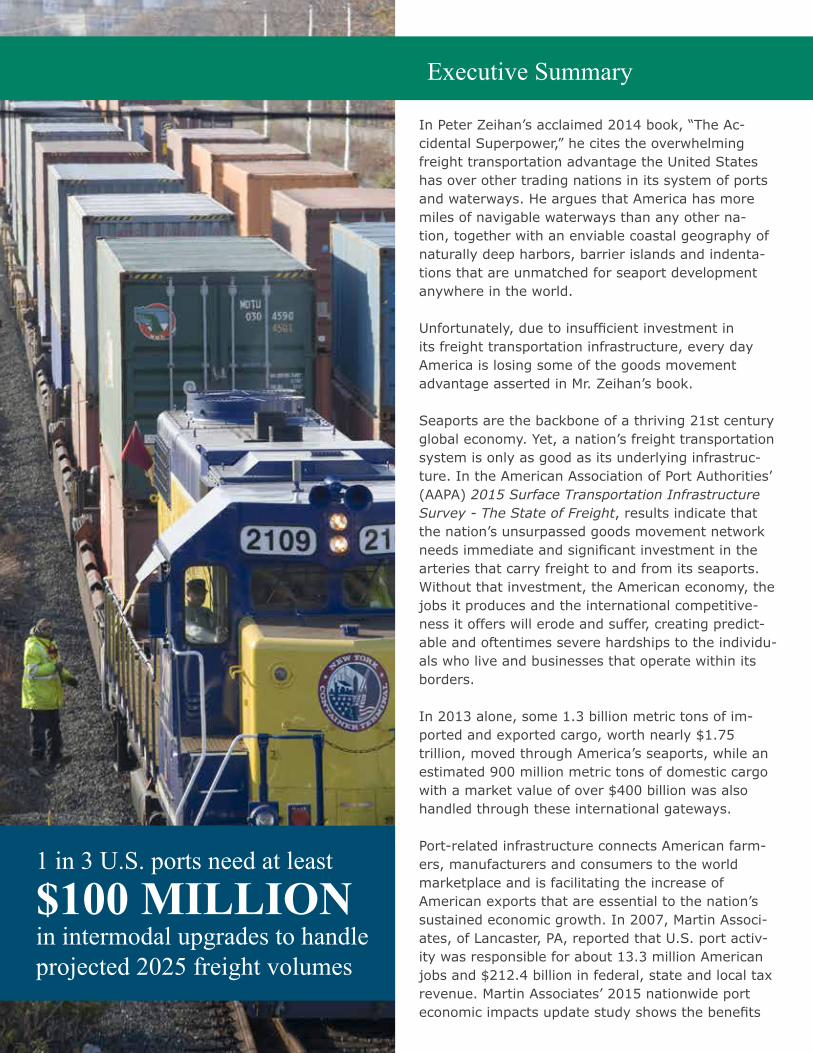
Nearly 80% of AAPA U.S. ports surveyed said they anticipate a minimum $10 mil-lion investment being needed in their port’s intermodal connectors through 2025, while 30% anticipate at least $100 million will be needed.
• These intermodal connectors, often referred to as the “first and last mile” of the freight transportation network, account for roughly 1,200 of the 57,000 miles in the national highway system. Many of these connectors are in various states of disrepair and face further deterioration, particularly as trade vol-umes continue to grow. Like links in a chain, these transportation connections with America’s seaports are critical to the overall freight network, and they are particularly vulnerable in large, congested met-ropolitan communities where commuters and freight share the same system. As the U.S. takes a closer look at planning and investing in its freight grid, intermodal access points must be prioritized.
Looking further at intermodal connectors, the AAPA survey asked respondents how much has congestion on these connectors over the past decade impacted their port’s productivity.
One-third of respondents said congestion on their port’s intermodal connectors over the past 10 years has caused port produc-tivity to decline by 25% or more.
• MAP-21 made incremental steps in providing re-sources for improving intermodal connectors. Surface Transportation Program (STP) funds are now eligible for surface transportation infrastructure improvements in port terminals for direct intermo-dal interchange, transfer and port access. However, the competition for these funds is intense, as states have 27 other eligible funding activities in which to use these federal funds.
• Among AAPA survey respondents, 33% said their port has applied for STP funds during the last two years. However, AAPA has also heard from ports that low success rates in securing funding has made it difficult for them to make long-term commitments for infrastructure projects. AAPA repeatedly hears from U.S. member ports that sustainable and reli-able funding sources need to be available in order for them to invest and leverage funding into the connecting freight network.
5
Needed and Planned Investment in the Freight Network
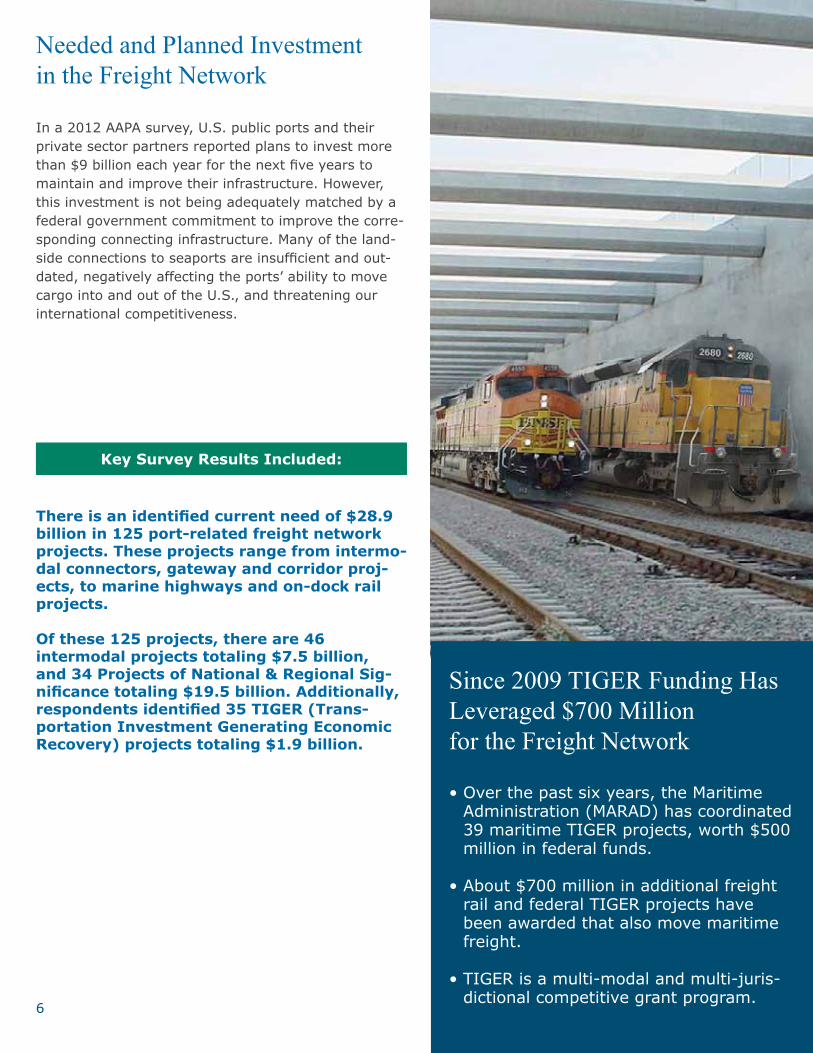
In a 2012 AAPA survey, U.S. public ports and their private sector partners reported plans to invest more than $9 billion each year for the next five years to maintain and improve their infrastructure. However, this investment is not being adequately matched by a federal government commitment to improve the corre-sponding connecting infrastructure. Many of the land-side connections to seaports are insufficient and out-dated, negatively affecting the ports’ ability to move cargo into and out of the U.S., and threatening our international competitiveness.
There is an identified current need of $28.9 billion in 125 port-related freight network projects. These projects range from intermo-dal connectors, gateway and corridor proj-ects, to marine highways and on-dock rail projects.
Of these 125 projects, there are 46 intermodal projects totaling $7.5 billion, and 34 Projects of National & Regional Sig-nificance totaling $19.5 billion. Additionally, respondents identified 35 TIGER (Trans-portation Investment Generating Economic Recovery) projects totaling $1.9 billion.
Key Survey Results Included:
Since 2009 TIGER Funding Has Leveraged $700 Million for the Freight Network
• Over the past six years, the Maritime Administration (MARAD) has coordinated 39 maritime TIGER projects, worth $500 million in federal funds.
• About $700 million in additional freight rail and federal TIGER projects have been awarded that also move maritime freight.
• TIGER is a multi-modal and multi-juris-dictional competitive grant program.
6
Building on the Planning Provisions of MAP-21The 2012 MAP-21 surface transportation legislation required the USDOT to encourage states to develop com-prehensive immediate and long-term freight planning and investment plans, and to collaborate with individual states, Metropolitan Planning Organizations (MPOs) and Freight Advisory Committees.
In addition to comprehensive freight plans, states were also encouraged to establish freight advisory commit-tees. Furthermore, MPOs were directed to set performance targets for freight and to integrate freight planning performance provisions into their overall planning process.
MAP-21 set into motion a useful process for communicating, planning and ultimately funding important freight projects. Ports are engaging in this process and in many ways have been leading the conversation. In its The State of Freight survey, AAPA asked its U.S. member ports a series of questions on how they are building off the MAP-21 planning provisions and engaging with planning the freight network.
Key Survey Results Included:
63% of survey respondents said their port is working directly with its region’s MPO or Council of Governments (COG) in the de-velopment and planning of a freight project that is either underway or has recently been completed.
• From this response, AAPA learned that not only are two-thirds of its U.S. member ports engaging in the MPO planning process and actively including freight projects in their statewide or Metropolitan Transpor-tation Improvement Program, these ports are also engaged in an ongoing dialogue with their regional planners.
• AAPA also learned from this part of the survey that the availability of TIGER funding has significantly driven U.S. public port engagement with the plan-ning community over the years. Because of port eligibility for TIGER funding and coordination and planning requirements in the submission of proj-ects, the annual TIGER process has served as a cat-alyst in bringing freight stakeholders to the table.
71% of those surveyed said their port has participated in the development of its state-wide freight plan.
• According to the Federal Highway Administration’s (FHWA) Office of Freight Management and Opera-tions, 42 states have worked with FHWA or are in various stages of development of their state freight plans. While many of these state freight plans are not yet MAP-21 compliant, the conversation on freight between states, stakeholders and the federal government is continuing.
64% of surveyed ports are members of a local freight advisory committee.
• MAP-21 encouraged the creation of local freight advisory committees to weigh in on the develop-ment of local and state freight plans. These freight advisories typically have a broad scope of mem-bership, much like the National Freight Advisory Committee that is housed in the U.S. Department of Transportation. This is a place where the private sector continues to weigh in on the freight planning and funding process, which has been described as chambers of commerce for freight.
• An offshoot of this process has been a growing
engagement and strong interest and understanding between ports, the private sector, and local and fed-eral partners, in the development of creative Public-Private Partnership (P3) projects.
7
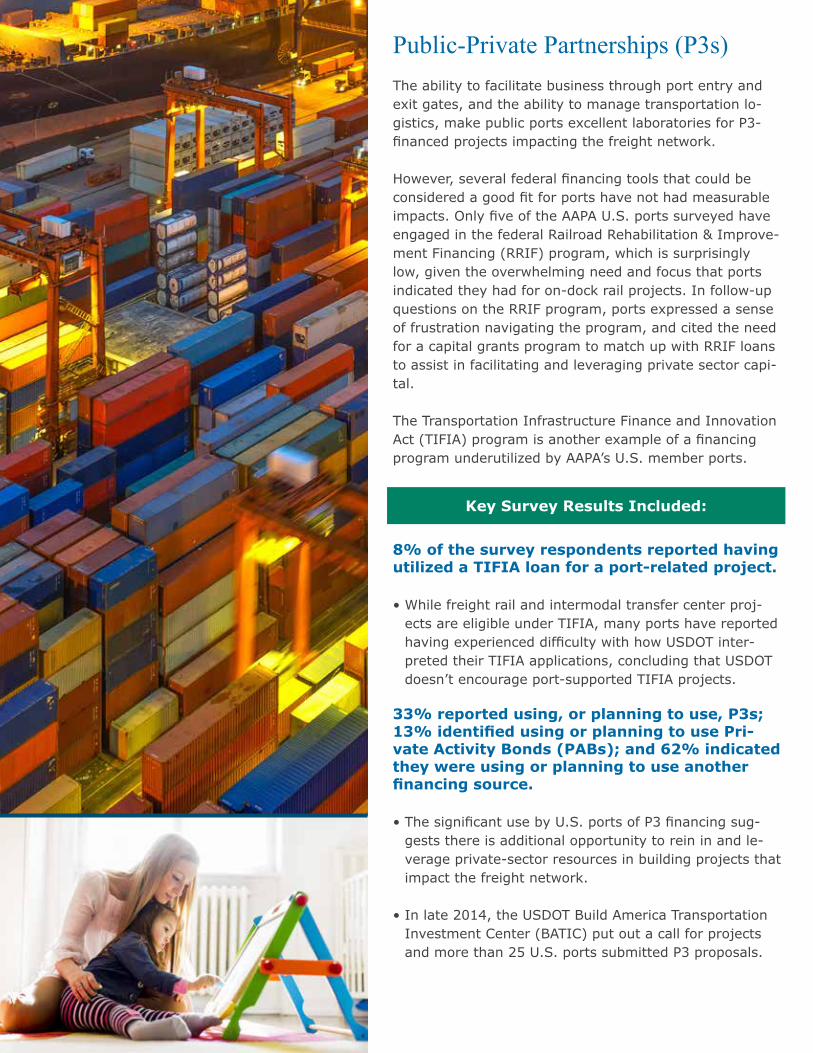
Public-Private Partnerships (P3s)The ability to facilitate business through port entry and exit gates, and the ability to manage transportation lo-gistics, make public ports excellent laboratories for P3-financed projects impacting the freight network.
However, several federal financing tools that could be considered a good fit for ports have not had measurable impacts. Only five of the AAPA U.S. ports surveyed have engaged in the federal Railroad Rehabilitation & Improve-ment Financing (RRIF) program, which is surprisingly low, given the overwhelming need and focus that ports indicated they had for on-dock rail projects. In follow-up questions on the RRIF program, ports expressed a sense of frustration navigating the program, and cited the need for a capital grants program to match up with RRIF loans to assist in facilitating and leveraging private sector capi-tal.
The Transportation Infrastructure Finance and Innovation Act (TIFIA) program is another example of a financing program underutilized by AAPA’s U.S. member ports.
8% of the survey respondents reported having utilized a TIFIA loan for a port-related project.
• While freight rail and intermodal transfer center proj-ects are eligible under TIFIA, many ports have reported having experienced difficulty with how USDOT inter-preted their TIFIA applications, concluding that USDOT doesn’t encourage port-supported TIFIA projects.
33% reported using, or planning to use, P3s; 13% identified using or planning to use Pri-vate Activity Bonds (PABs); and 62% indicated they were using or planning to use another financing source.
• The significant use by U.S. ports of P3 financing sug-gests there is additional opportunity to rein in and le-verage private-sector resources in building projects that impact the freight network.
• In late 2014, the USDOT Build America Transportation Investment Center (BATIC) put out a call for projects and more than 25 U.S. ports submitted P3 proposals.
Key Survey Results Included:

9
On-Dock Rail For many ports, on-dock rail (rail track which is located immediately next to the dock front) offers a vital link to efficiently move goods directly between ships and trains to get the goods to America’s heartland and major distri-bution centers. In referencing on-dock rail, Bill Johnson, the former port director for Florida’s PortMiami, testified on Jan. 28, 2015, before the Senate Commerce Commit-tee, saying, “Without interconnectivity, you cannot con-nect your port to America or the global economy.”
73% of AAPA U.S. member ports have on-dock rail, while most others have rail tracks within terminals near docks, which is often referred to as near-dock rail.
• However, U.S. ports’ apparent rail infrastructure strength is misleading. Many port on-dock and near-dock rail systems are out-of-date and need to be significantly enhanced and reinforced, as well as in-tegrated with new technology to accommodate rising shipping volumes.
• Having up-to-date on-dock and near-dock rail able to accommodate all the discretionary cargo that must be moved to and from a port’s hinterland is a big priority for U.S. seaports. The need is so urgent that several ports have purchased rail lines to ensure access to their existing freight network and for business devel-opment. Based on the survey responses, a majority of ports are engaged in upgrading and/or expanding their on-dock rail systems and have cited the need for federal resources in assisting with on-dock rail invest-ments.
• Even though improving port rail infrastructure is a pri-
ority for most ports, only 13% of survey respondents reported having applied for or are planning to use the RRIF program to pay for their projects. This may be due to what has been reported as a difficult application process to navigate. In the AAPA survey, respondents expressed a desire to revamp the RRIF program to make it easier to finance on-dock rail and other freight transportation infrastructure projects. They also indi-cated a desire that the RRIF program provide a capi-tal grants aspect to work in tandem with its financing program.
Key Survey Results Included:
Other Federal Options For Financing Port-Related Infrastructure DevelopmentIn addition to facilitating the movement of cargo, seaports are also stakeholders and partners in the communities in which they operate. In the U.S., public ports directly generate or influence the creation of millions of jobs, are environmental stewards and play a vibrant socio/economic role in the com-munities they serve. While the condition of the air, land and water surrounding these public ports is important to those who work and do business in the respective communities, it’s equally as important to those who work or do business at the ports themselves.
In addition to infrastructure investments, ports partner with the federal government to fund programs that reduce diesel emissions and create economic opportunities through partner-ships with the Economic Development Administration (EDA). To illustrate, the final question in AAPA’s survey asked respon-dents if their port had ever applied for or received funding from Diesel Emission Reduction Act (DERA) grants, Conges-tion Mitigation and Air Quality Improvement program grants (CMAQ), or the Surface Transportation Program (STP) or Economic Development Administration (EDA) grants.
57% of the AAPA U.S. member ports surveyed have applied through the U.S. Environmental Pro-tection Agency for DERA funding, and 43% have applied for CMAQ funding to pay for reducing emissions and congestion while improving air quality in and around their ports.
45% have applied through the U.S. Department of Commerce for EDA grants by partnering with a regional academic institution and a local government authority, while 33% have applied for federal highway STP funding to improve their port’s intermodal connections.
Key Survey Results Included:
10

11
America’s freight network is vast and evolving. It’s a living grid and economic lifeline for the country; from small towns to major metropolitan areas, from farm-ing regions to technology centers.
At its heart are America’s seaports, which handle approximately $6 billion worth of goods to and from overseas markets every day. These goods come in all shapes and sizes. Apparel and consumer electronics are shipped in standardized steel containers. Cars and trucks are driven on and off ships. Farm harvests are conveyed into the hulls of vessels. Liquids are moved by pipeline. Gaseous products are shipped in pressurized tanks. Project cargoes, like wind turbines and electrical generators, require special handling. These different cargo types require different trans-port modes to get them from shore to ship, and ship to shore. For the freight network to operate smoothly and efficiently, it must seamlessly connect commerce centers in every community, state and territory.
As indicated in AAPA’s 2015 The State of Freight survey, investment in America’s port connection in-frastructure is an urgent national priority. There is a path forward. This survey documents and illustrates the freight planning successes that resulted from
the TIGER application process. Survey results show how MAP-21 built upon TIGER’s targeted investments with the various state freight plans and with ongoing input of the individual states’ freight advisory com-mittees.
The survey also, for the first time, documents from the ports’ perspective the requisite capital invest-ments that are needed to maintain and enhance a 21st century freight network. These investments include “first and last mile” connector and gateway projects that, when viewed collectively, represent a strategic investment in the national transportation system, the national economy, as well as all of the individual enterprises and people who make the na-tion great.
This survey is a strong first step towards identifying the critical infrastructure needs of America’s sea-ports, however more must be done. AAPA will contin-ue to gather input from the industry and work with our partners to ensure that investing in our nation’s freight transportation system is a national priority. A reliable and efficient transportation system will guar-antee that seaports continue to deliver prosperity for all Americans.
U.S. PORTS NEED SUBSTANTIAL INVESTMENT TO HANDLE
PROJECTED 2025 FREIGHT VOLUMES
GULF PORTS$4,134,670,000
GREAT LAKES PORTS
$332,698,000
NORTH ATLANTICPORTS
$6,413,982,644
SOUTH ATLANTICPORTS
$4,637,500,000*
NORTH PACIFICPORTS
$6,925,300,000
SOUTH PACIFICPORTS
$6,508,102,500*
*INCLUDES THE COMMONWEALTH OF SAIPAN
*INCLUDES PUERTO RICO AND U.S. VIRGIN ISLANDS
ConclusionU.S. ports require at least $28.9 billion to handle
projected 2025 freight volumes
1010 Duke StreetAlexandria, VA 22314-3589
703.684.5700Fax: 703.684.6321 www.aapa-ports.org


![Melissa Winterod [Read-Only]aapa.files.cms-plus.com/SeminarPresentations/05_OpsIT_Winterod_Melissa.pdf… of data capture computers and wireless infrastructure products that deliver](https://img.pdfslide.net/doc/110x75/5f6e21135167ba7ca009e8e1/melissa-winterod-read-onlyaapafilescms-pluscomseminarpresentations05opsitwinterod.jpg)