Embed Size (px)
Citation preview

PORTABLE HEART ATTACK WARNING SYSTEM BY MONITORING THE ST
SEGMENT VIA SMARTPHONE ELECTROCARDIOGRAM PROCESSING
by
Joseph John Oresko II
B.S. Electrical Engineering Technology and B.S. Mechanical Engineering Technology,
University of Pittsburgh at Johnstown, 2007
Submitted to the Graduate Faculty of
Swanson School of Engineering in partial fulfillment
of the requirements for the degree of
Master of Science in Electrical Engineering
University of Pittsburgh
2010

ii
UNIVERSITY OF PITTSBURGH
SWANSON SCHOOL OF ENGINEERING
This thesis was presented
by
Joseph John Oresko II
It was defended on
June 23, 2010
and approved by
Ching-Chung Li, Ph.D., Professor, Departments of Electrical and Computer Engineering and
Computer Science
Zhi-Hong Mao, Ph.D., Assistant Professor, Departments of Electrical and Computer
Engineering and Bioengineering
Thesis Advisor: Allen C. Cheng, Ph.D., Assistant Professor, Departments of Electrical and
Computer Engineering, Bioengineering, Computer Science, and Neurological Surgery

iii
Copyright © by Joseph John Oresko II
2010
iv
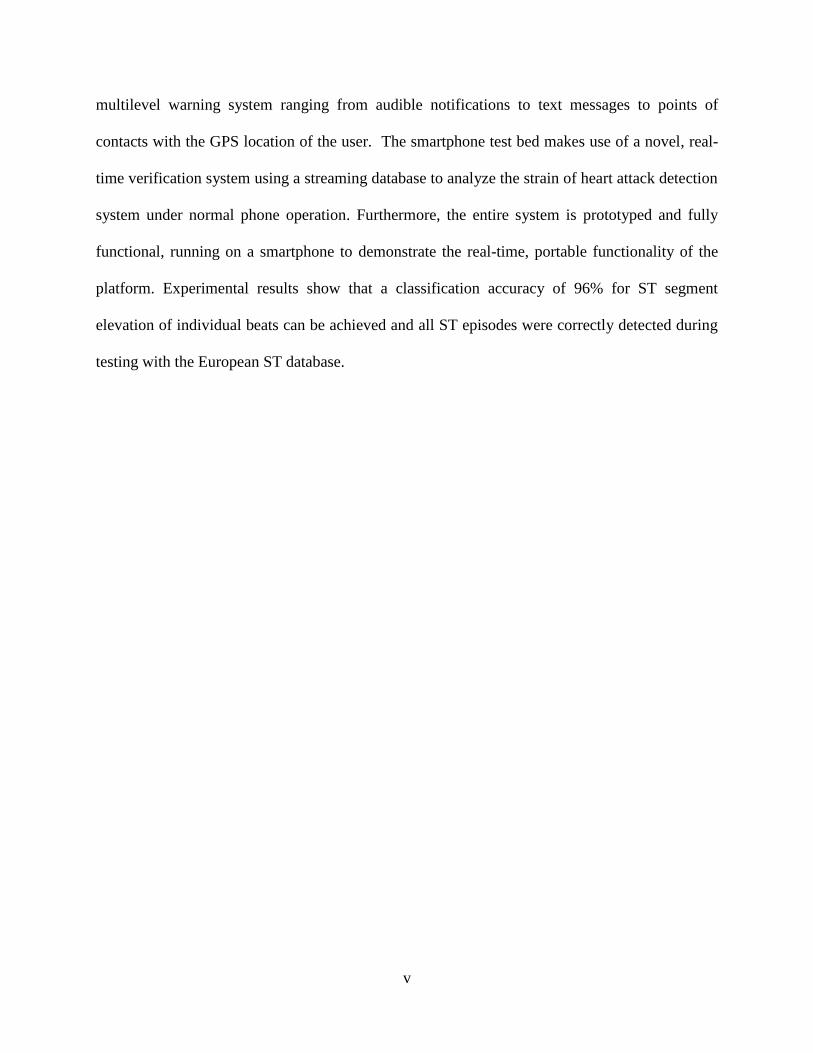
Cardiovascular disease (CVD) is the single leading cause of death in both developed and
developing countries. The most deadly CVD is heart attack, which 7,900,000 Americans suffer
each year, and 16% of cases are fatal. The Electrocardiogram (ECG) is the most widely adopted
clinical tool to diagnose and assess the risk of CVD. Early diagnosis of heart attacks, by
detecting abnormal ST segments within one hour of the onset of symptoms, is necessary for
successful treatment. In clinical settings, resting ECGs are used to monitor patients
automatically. However, given the sporadic nature of heart attacks, it is unlikely that the patient
will be in a clinical setting at the onset of a heart attack. While Holter-based portable monitoring
solutions offer 24 to 48-hour ECG recording, they lack the capability of providing any real-time
feedback for the thousands of heart beats they record, which must be tediously analyzed offline.
Processing ECG signals on a smartphone-based platform would unite the portability of
Holter monitors and the real-time processing capability of state-of-the-art resting ECG machines
to provide an assistive diagnosis for early heart attack warning. Furthermore, smartphones serve
as an ideal platform for telemedicine and alert systems and have a portable form factor. To detect
heart attacks via ECG processing, a real-time, accurate, context aware ST segment monitoring
algorithm, based on principal component analysis and a support vector machine classifier is
proposed and evaluated. Real-time feedback is provided by implementing a state-of-the-art,
PORTABLE HEART ATTACK WARNING SYSTEM BY MONITORING THE ST
SEGMENT VIA SMARTPHONE ELECTROCARDIOGRAM PROCESSING
Joseph John Oresko II, M.S.
University of Pittsburgh, 2010
v
multilevel warning system ranging from audible notifications to text messages to points of
contacts with the GPS location of the user. The smartphone test bed makes use of a novel, real-
time verification system using a streaming database to analyze the strain of heart attack detection
system under normal phone operation. Furthermore, the entire system is prototyped and fully
functional, running on a smartphone to demonstrate the real-time, portable functionality of the
platform. Experimental results show that a classification accuracy of 96% for ST segment
elevation of individual beats can be achieved and all ST episodes were correctly detected during
testing with the European ST database.
vi
TABLE OF CONTENTS
PREFACE ................................................................................................................................. XIII
1.0 INTRODUCTION ........................................................................................................ 1
1.1 MOTIVATION .................................................................................................... 2
1.2 GOALS ................................................................................................................. 3
1.3 CONTRIBUTIONS ............................................................................................. 4
1.4 SYSTEM OVERVIEW ....................................................................................... 5
1.5 THESIS ORGANIZATION ................................................................................ 6
2.0 BACKGROUND .......................................................................................................... 7
2.1 HEART ATTACK ............................................................................................... 7
2.2 ELECTROCARDIOGRAPHY .......................................................................... 8
2.2.1 Electrocardiography basics ............................................................................ 8
2.2.2 Detecting heart attacks by electrocardiography ........................................... 9
3.0 SMARTPHONES AS A PLATFORM FOR ECG PROCESSING ....................... 11
3.1 MOTIVATION .................................................................................................. 11
3.2 STATE-OF-THE-ART TEST BED ................................................................. 12
3.2.1 Data acquisition ............................................................................................. 13
3.2.2 Real-time Display ........................................................................................... 14
3.2.3 Plug-in-based ECG processing ..................................................................... 17
vii
3.2.4 Cardiac Summary Reports ........................................................................... 18
4.0 ACCURATE, REAL-TIME, CONTEXT AWARE HEART ATTACK
DETECTION ALGORITHM .................................................................................................... 19
4.1 MOTIVATION .................................................................................................. 19
4.2 RELATED WORK ............................................................................................ 20
4.3 PROPOSED HEART ATTACK DETECTION ALGORITHM .................. 22
4.3.1 Test data ......................................................................................................... 23
4.3.2 Heartbeat detection and segmentation ........................................................ 26
4.3.3 Dimensionality reduction .............................................................................. 28
4.3.3.1 Background.......................................................................................... 28
4.3.3.2 Results .................................................................................................. 30
4.3.4 Classification .................................................................................................. 32
4.3.4.1 Background.......................................................................................... 32
4.3.4.2 Results .................................................................................................. 33
4.3.5 Smoothing filter ............................................................................................. 36
4.3.6 Discussion ....................................................................................................... 39
4.4 INCORPORATION OF CONTEXT AWARENESS ..................................... 40
4.4.1 Motivation ...................................................................................................... 40
4.4.2 Implementation and testing .......................................................................... 40
4.4.3 Discussion ....................................................................................................... 42
5.0 MULTILAYERED REAL-TIME ALERT AND TELEMEDICINE SYSTEM .. 44
5.1 PROPOSED ALERT AND TELEMEDICINE WARNING SYSTEM ........ 44
5.2 IMPLEMENTATION ....................................................................................... 46
viii
5.2.1 Telemedicine service ...................................................................................... 47
5.2.2 User alerts ....................................................................................................... 47
5.2.3 Point of contact alerts .................................................................................... 48
6.0 STREAMING DATABASE VERIFICATION & WORKLOAD ANALYSIS .... 51
6.1 MOTIVATION .................................................................................................. 51
6.2 IMPLEMENTATION ....................................................................................... 52
6.3 REAL-TIME VERIFICATION ....................................................................... 53
6.4 WORKLOAD ANALYSIS ............................................................................... 54
6.4.1 Memory Usage ............................................................................................... 55
7.0 CONCLUSION ........................................................................................................... 57
7.1 THESIS SUMMARY AND CONCLUDING STATEMENTS ............ ERROR!
BOOKMARK NOT DEFINED.
7.2 FUTURE WORK ............................................................................................... 58
BIBLIOGRAPHY ....................................................................................................................... 60
ix
LIST OF TABLES
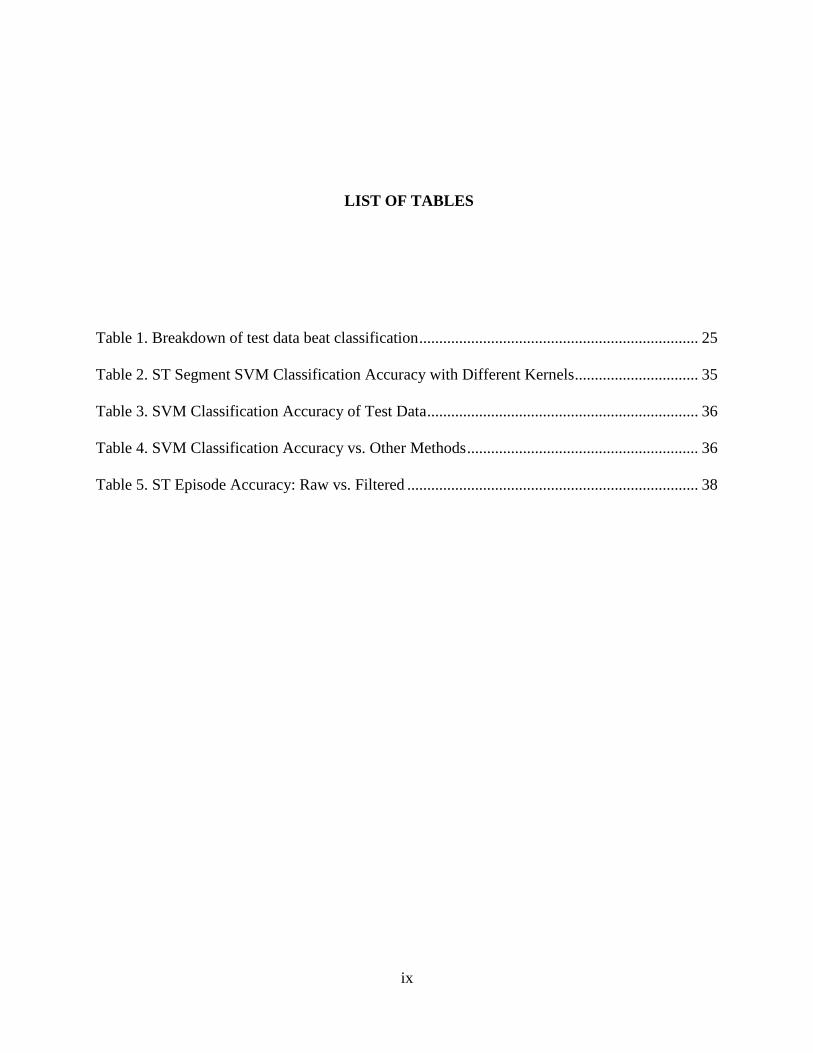
Table 1. Breakdown of test data beat classification ...................................................................... 25
Table 2. ST Segment SVM Classification Accuracy with Different Kernels ............................... 35
Table 3. SVM Classification Accuracy of Test Data .................................................................... 36
Table 4. SVM Classification Accuracy vs. Other Methods .......................................................... 36
Table 5. ST Episode Accuracy: Raw vs. Filtered ......................................................................... 38
x
LIST OF FIGURES
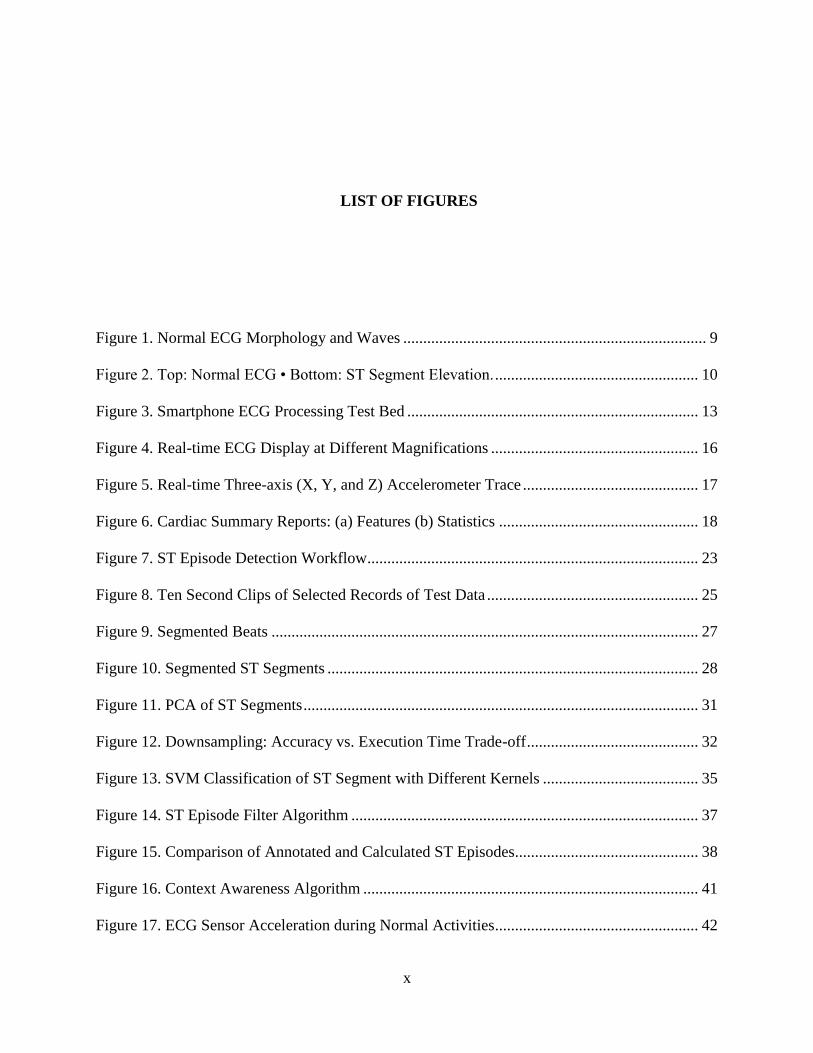
Figure 1. Normal ECG Morphology and Waves ............................................................................ 9
Figure 2. Top: Normal ECG • Bottom: ST Segment Elevation. ................................................... 10
Figure 3. Smartphone ECG Processing Test Bed ......................................................................... 13
Figure 4. Real-time ECG Display at Different Magnifications .................................................... 16
Figure 5. Real-time Three-axis (X, Y, and Z) Accelerometer Trace ............................................ 17
Figure 6. Cardiac Summary Reports: (a) Features (b) Statistics .................................................. 18
Figure 7. ST Episode Detection Workflow ................................................................................... 23
Figure 8. Ten Second Clips of Selected Records of Test Data ..................................................... 25
Figure 9. Segmented Beats ........................................................................................................... 27
Figure 10. Segmented ST Segments ............................................................................................. 28
Figure 11. PCA of ST Segments ................................................................................................... 31
Figure 12. Downsampling: Accuracy vs. Execution Time Trade-off ........................................... 32
Figure 13. SVM Classification of ST Segment with Different Kernels ....................................... 35
Figure 14. ST Episode Filter Algorithm ....................................................................................... 37
Figure 15. Comparison of Annotated and Calculated ST Episodes.............................................. 38
Figure 16. Context Awareness Algorithm .................................................................................... 41
Figure 17. ECG Sensor Acceleration during Normal Activities ................................................... 42
xi
Figure 18. Heart Attack Warning and Telemedicine Workflow ................................................... 46
Figure 19. Heart Attack Warning for the User ............................................................................. 48
Figure 20. Emailed Heart Attack Warning to the POC ................................................................ 50
Figure 21. Text Message Heart Attack Warning to the POC ....................................................... 50
Figure 22. Database Testing Workflow ........................................................................................ 53
Figure 23. Statistics for Detected ST Episodes ............................................................................. 54
Figure 24. Heart Attack Detection Memory Footprint ................................................................. 56
Figure 25. Comparison of RAM Usage for Common Smartphone Tasks .................................... 56
xii
LIST OF ACRONYMS
CHD: Coronary heart disease
CVD: Cardiovascular disease
ECG: Electrocardiogram (also EKG)
EOF: End of file
MI: Myocardial infarction (heart attack)
PCA: Principal component analysis
PCI: Percutaneous coronary intervention
POC: Point of contact
STEMI: ST elevation heart myocardial infarction
SVM: Support vector machine

xiii
PREFACE
The author would like to thank Shimeng Huang, Yuwen Sun, Zhanpeng Jin, Jun Cheng, Heather
Duschl, and Dr. Allen C. Cheng for their help in constructing the HeartToGo prototype.
1
1.0 INTRODUCTION
With the advent of computers, technology is playing an ever increasing role in society by making
jobs easier and faster, providing new medians for communications, and most importantly,
increasing quality of life with medical devices. Through the twentieth century, medical devices
have helped save lives. One example of a life-changing innovation is the electrocardiogram
(ECG), which allows physicians to monitor the heart via its electrical activity. Furthermore, there
has been an increasing trend to make medical devices smaller and more portable, to allow the
patient to use them at all times. Examples of such devices are pacemakers, portable respirators,
and automated external defibrillators. More recently, newer, more powerful smartphones, which
are becoming increasingly popular, can also serve as platforms for health-related conditions;
diabetes patients can keep track of their insulin levels, sleep quality can be monitored, and diet
and exercise statistics can be calculated all using smartphones. With a form factor that is
designed for portability, powerful computing abilities, and their built-in communication
interfaces, smartphones make an ideal platform for portable, real-time assistive medical
diagnosis.
A new direction for smartphone assistive diagnosis is monitoring the body’s internal
signals for changes in a user’s health that are life-threatening. The goal of this research is to
provide portable, real-time heart attack detection via smartphone ECG processing. For users,
such a device would serve as an additional layer of heart attack detection, aside from the
2
conventional warning signs, such as chest pain. Furthermore, acute heart attacks sometimes leave
victims with little-to-no warning signs. By continuously monitoring the heart’s ECG, heart
attacks that could be previously undetectable by users may be able to be detected before damage
occurs.
1.1 MOTIVATION
Cardiovascular disease (CVD) is the single leading cause of death in both developed and
developing countries. According to the American Heart Association, in the United States alone
80,000,000 people are estimated to have one or more forms of CVD and nearly 2,400 Americans
die of CVD each day. The most deadly CVD is heart attack, which 7,900,000 Americans suffer
each year, and 16% of cases (1,200,000) are fatal [1]. Furthermore, some 300,000 Americans a
year suffer sudden cardiac death, an event generally defined as death resulting from coronary
heart disease (CHD), which usually leads to heart attack, within an hour of the onset of
symptoms [2].
The Electrocardiogram (ECG) is the most widely adopted clinical tool to diagnose and
assess the risk of CVD. Approximately seventy percent of heart attacks are detectable in the
ECG; the remaining thirty percent are not recognizable due to various reasons such as small
infarctions, multiple infarctions, and electrocardiography is an indirect method [3]. Early
diagnosis of acute heart attacks, within one hour of the onset of symptoms [4], is necessary for
successful treatment, including percutaneous coronary intervention (PCI) and for the timely
administration of thrombolytic therapy.
3
In clinical settings, resting ECGs are used to monitor patients automatically, along with
physicians performing diagnosis by reading the ECG. However, abnormalities may not be
detected on standard resting ECG machines since the condition may not be present at that
moment in time. Furthermore, it is unlikely that the patient will be in a clinical setting at the
onset of the heart attack due to their sporadic nature. While Holter-based portable monitoring
solutions offer 24 to 48-hour ECG recording, they lack the capability of providing any real-time
feedback for the thousands of heart beats they record, which must be tediously analyzed offline.
In the case of acute MI, Holter monitors are not an effective diagnosis tool because they simply
record the heart’s activity and provide no assistive diagnosis or warnings.
Processing ECG signals on a smartphone-based platform would unite the portability of
Holter monitors and the real-time processing capability of state-of-the-art resting ECG machines
to provide an assistive diagnosis for early heart attack warning. Furthermore, smartphones serve
as an ideal platform for a telemedicine and alert system and have a portable form factor.
1.2 GOALS
Currently, there are two options for monitoring the heart though ECGs: the rest ECG machine
found in clinical settings and the portable Holter monitor. Neither platform is well-suited for
detecting heart attacks. Patients are unlikely to be connected to a resting ECG machine when
having a heart attack and Holter monitors provide recordings of the heart’s activity in time,
instead of real-time feedback and heart attack detection.
The goal of this research is to combine the powerful, accurate heart attack detection
processing features of resting ECG machines with the portability of Holter monitors by
4
processing the ECG on a smartphone. Furthermore, the communication features of the
smartphone will be used to provide a tiered level of warnings for the user and a point-of-contact
(POC), including pop-up messages, audible alerts, text messages, and GPS location, should a
heart attack be detected. Moreover, to make the system practical, it must not interfere with the
normal multitasking workloads of the smartphone, such as voice, video, and music.
1.3 CONTRIBUTIONS
As previously stated, this research proposes the smartphone as a portable platform for heart
attack alert that is capable of providing the real-time feedback of resting ECG machines and the
portability of Holter monitors. To accomplish this, a real-time, accurate, context aware ST
segment monitoring algorithm, based on PCA and a SVM classifier, for the detection of ST
elevation heart attacks was proposed and verified. Furthermore, a state-of-the-art heart attack
warning system to provide the user with a multilayered system of warnings was proposed and
implemented. Another contribution is to propose and implement a real-time verification system
for ECG processing on a smartphone using a streaming database to analyze the strain of heart
attack detection system under normal phone operation. Finally, the entire system is constructed
and demonstrates the real-time, portable functionality of the system on the target smartphone
platform.
5
1.4 SYSTEM OVERVIEW
This thesis implements a heart attack detection and warning system on a smartphone by real-time
ECG processing. To obtain the user’s ECG (and accelerometer data), a wearable sensor is used.
This sensor communicates with the smartphone using the Bluetooth protocol. The smartphone
then displays the ECG in real time and at various zoom levels using a custom-written, multi-
threaded C# application named HeartToGo. To process the ECG for heart attack detection, the
proposed accurate, real-time, context aware principal component analysis (PCA) / support vector
machine (SVM) algorithm is used. Feature extraction consists of heartbeat detection,
segmentation, down sampling, and PCA. The SVM then classifies the beat as normal or ST
elevated in real-time. This algorithm was first prototyped in MATLAB and then implemented on
the smartphone.
Should elevated ST beats occur for a duration of at least thirty seconds (to be clinically
significant) a multilevel system of warnings will begin. The user will immediately be notified via
pop-up, vibratory, and audible alerts and the abnormal ECG will begin being uploaded to a
database. If the user does not acknowledge the warning (e.g. experiencing a heart attack) a
designated POC will be notified via text message or email that the user could be experiencing a
heart attack and has not acknowledged the warning. Furthermore, the user’s GPS location will be
transmitted to the POC.
Aside from the implementation of the system, another important aspect is real-time
testing and verification. The novel test plan method of streaming an expertly annotated database
to the phone in place of the sensor is used. Not only does this method provide complete
transparency between testing and normal functionally, it allows a very difficult to test situation to
simulate, the heart attack, to be tested on the phone. Furthermore, using this testing approach the
6
strain caused by the custom ECG processing software on the phone could be analyzed to ensure
that real-time deadlines are being met and that normal phone functionality is not hindered.
1.5 THESIS ORGANIZATION
This section provides an introduction to the problem of heart attack detection on a smartphone,
thesis goals, contributions, and an overview. The remainder of this work is organized as follows:
chapter 2 will provide medical background information on heart attack, electrocardiography, and
detecting heart attack with electrocardiography. Chapter 3 will propose the smartphone as a
platform for ECG processing and demonstrate this with a state-of-the-art test bed. An accurate,
real-time, context aware heart attack detection algorithm will be proposed, implemented, and
tested in chapter 4. Next, chapter 5 will introduce the multilayered system of alerts and
telemedicine functionalities that have been proposed for heart attack detection on a smartphone.
Chapter 6 provides a novel testing and verification procedure by using an expertly annotated
database that is streamed to the phone. Chapter 7 provides comments for the system and outlines
future work. Finally, chapter 8 provides concluding statements.
7
2.0 BACKGROUND
Before discussing a heart attack detection algorithm, it is first necessary to introduce the proper
biomedical background to understand heart attacks, electrocardiograms, and how to detect a
heart attack using an electrocardiogram. Therefore, this chapter provides a brief introduction to
the clinical aspects of cardiology.
2.1 HEART ATTACK
Officially known as myocardial infarctions (MIs), heart attacks are the most deadly CVD, which
7,900,000 Americans suffer each year, and 16% of cases (1,200,000) are fatal [1]. Furthermore,
some 300,000 Americans a year suffer sudden cardiac death, an event generally defined as death
resulting from coronary heart disease (CHD), which usually leads to heart attack, within an hour
of the onset of symptoms [2]. Heart attacks occur when the supply of blood to the heart is
interrupted, commonly due to the blockage of a coronary artery, which causes heart cells to die.
When left untreated, the blockage of blood supply (ischemia) results in the infarction of heart
muscle tissue (myocardium). Classic heart attack warning signs include chest/shoulder pain,
shortness of breath, nausea, vomiting, and sweating. However, heart attacks frequently occur
without any warning signs; these heart attacks are referred to as silent.
8
There are two types of heart attacks: ST elevation myocardial infarctions (STEMIs) and
non-ST segment elevation myocardial infarctions [4]. STEMIs are larger than non STEMIs [5],
which this research will focus on. Early diagnosis of acute heart attacks is necessary for
successful treatment, including percutaneous coronary intervention (PCI) and for the timely
administration of thrombolytic therapy. For successful treatment, it is necessary to diagnose heart
attacks within one hour of the onset of symptoms [4].
2.2 ELECTROCARDIOGRAPHY
2.2.1 Electrocardiography basics
The Electrocardiogram (ECG) is the most widely adopted clinical tool to diagnose and assess the
risk of CVD. The ECG measures the electrical impulses of the heart via electrodes on the skin’s
surface. Electrical activity is present because each contraction of the heart is preceded by
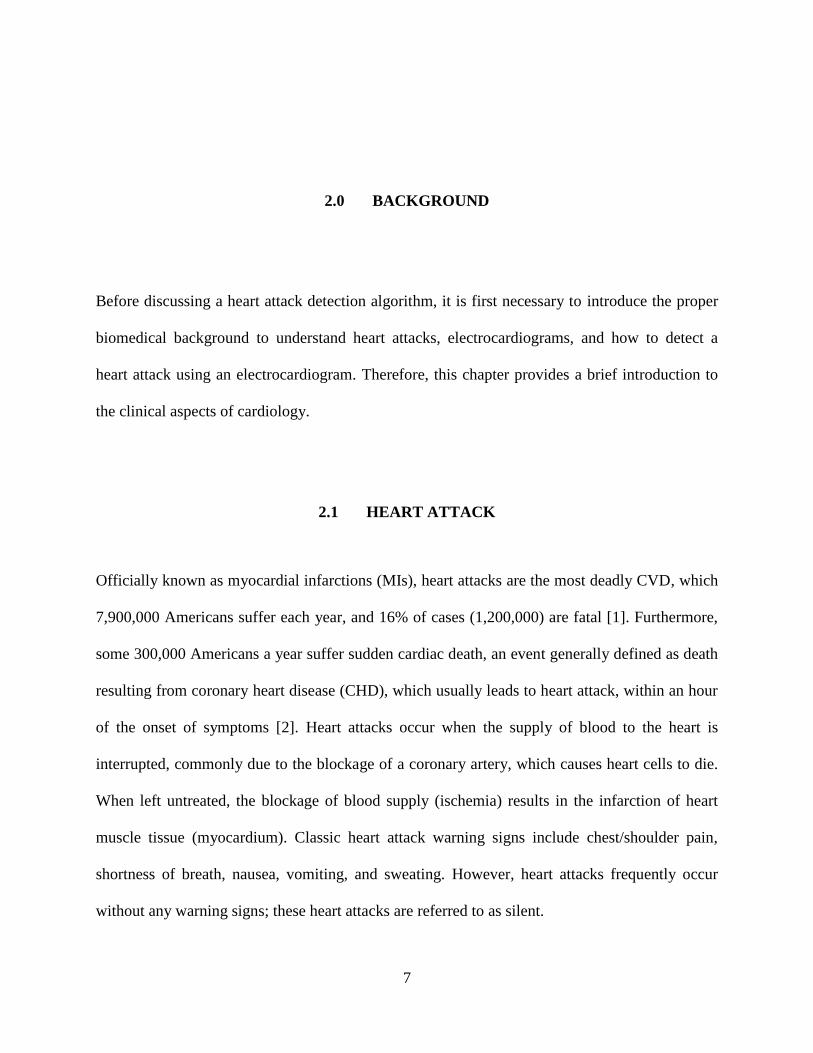
electrical excitation waves [4]. Figure 1 shows the morphology of a single heartbeat. As shown, a
normal heartbeat consists of fluctuations in voltage causing three waves: the P wave, QRS
complex, and the T wave. The P wave represents the electrical activity of the right atrium, right
atrial activation and initiation, the left atrial activation and initiation, and the left atrium. The
QRS complex is due to the electrical forces generated from ventricular depolarization.
Repolarization is represented by the T wave. Also, note that the ST segment, central to this
research, lies between the end of the QRS complex and the T wave [4]. Between waves the
voltage returns to a constant level, referred to as the isoelectric level.
9
Figure 1. Normal ECG Morphology and Waves
Resting ECG machines with twelve leads, i.e. views of the heart, are used to monitor
patients’ ECGs. However, fewer leads can be used, as is the case for Holter monitors. These
portable devices record the heart’s activity for future offline diagnosis. They are useful for
monitoring arrhythmias, whose presence is sporadic. Modern Holter monitors make use of two-
to-twelve leads. For the case of other wearable ECG sensors, only one lead may be present.
Therefore, one of the standard one-lead configurations must be used, referred to as the limb leads
I-III.
2.2.2 Detecting heart attacks by electrocardiography
Approximately seventy percent of heart attacks are detectable in the ECG; the remaining thirty
percent are not recognizable due to various reasons such as small infarctions, multiple
infarctions, and electrocardiography is an indirect method [3]. Heart attack diagnosis relies on
the analysis of the ST segment of the electrocardiogram. This research focuses on STEMIs and
as such, the detection criteria presented in this section pertains only to STEMIs.
Clinically, to diagnose a heart attack the following criterion is applied: abnormal ST
segment elevation (with respect to the isoelectric level) of greater than 0.1 mV in two or more
contiguous limb leads [3-6]. Furthermore, the location of the heart attack can be determined by
10
examining different leads. For example, elevation in leads II, III and aVF indicates an inferior
infarction, while elevation in two or more precordial leads indicates an anterior infarction.
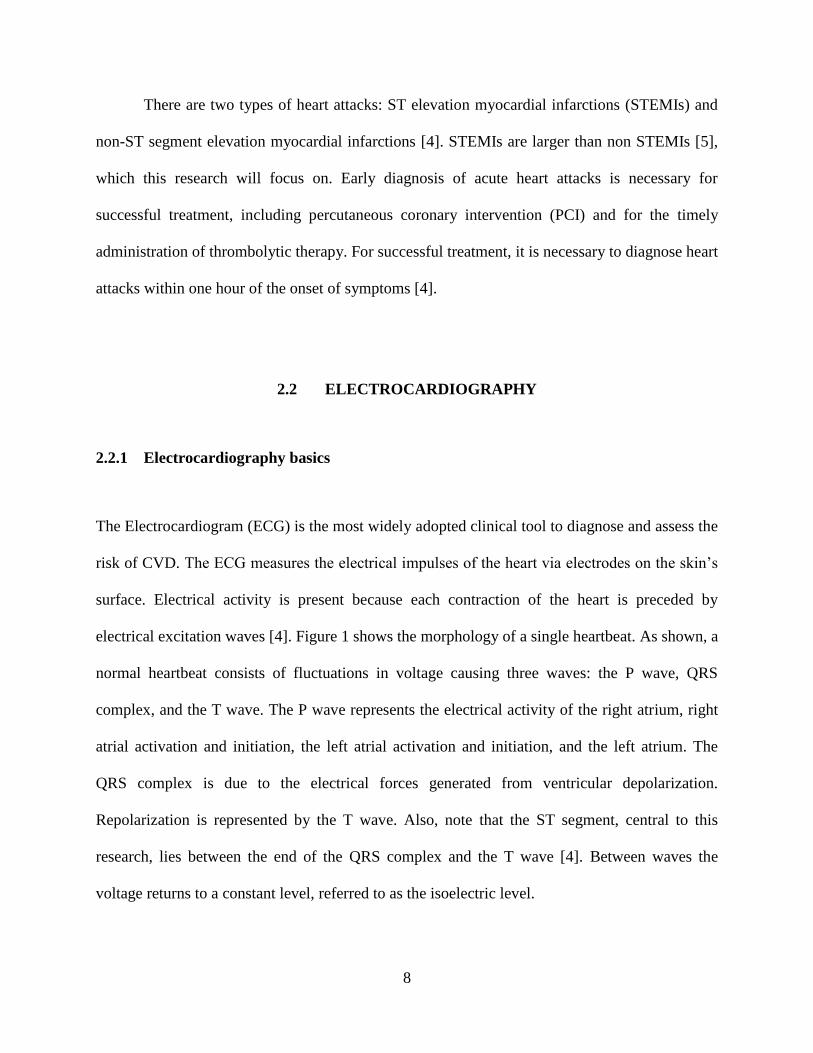
Figure 2 displays ECG traces for normal and ST segment elevation. For the normal case,
the ST segment is at approximately the same level as the isoelectric line. Therefore, the ST
segment is not elevated according to the clinical diagnosis criterion. However, for the heart
attack case, the ST segment elevation trace, the ST segments, highlighted in yellow, are clearly
elevated with respect to the isoelectric level. The elevation is about 0.6 mV (the standard ECG
scale is 1 mV per division).
Figure 2. Top: Normal ECG • Bottom: ST Segment Elevation.
(ECG waveforms were plotted using the ATM tool from Physionet)
11
3.0 SMARTPHONES AS A PLATFORM FOR ECG PROCESSING
To develop a real-time, portable, accurate heart attack detection system for smartphones, first,
the correct framework must be created. HeartToGo is the custom-developed graphical user
interface (GUI) that is the backbone for ECG processing on a smartphone. This chapter will
describe this platform [which the author created], which has been previously published in [7].
3.1 MOTIVATION
As previously stated, computationally powerful resting ECG machines lack the portability
needed for continuous CVD monitoring. Three types of ECG solutions are possible: 1) those that
store information to be diagnosed off-line after data collection is complete; 2) those that use
remote connections to provide real-time diagnosis via a separate server; 3) those that perform
real-time diagnosis within the device itself. Among the first type of systems, Holter monitors and
event recorders stand out, such as GE’s SEER (GE Healthcare, Waukesha, WI 53188), Philips’s
DigiTrack (Philips Healthcare, Andover, MA 01810), and Midmark’s IQmark (Midmark
Corporation, Versailles, OH 45380), among others. These devices only provide recording and
monitoring capabilities and no real-time classification of ECGs because the classification is
performed off-line. The second type utilizes telemedicine functionalities via a remote real-time
monitoring system [8-10]. Most of them make use of mobile phones/PDAs to collect the ECG
12
data and send them to a monitoring center where the analysis and classification is performed,
thus depriving the user of real-time feedback. For the third type of systems, researchers have
proposed some intermediate level of local real-time classification, such as the classification of
heart beats, by using up-to-date smartphones or PDAs [11-14], but these do not provide a
complete CVD diagnosis solution.
One contribution of this research is to provide a solution to bridging the gap between
portable smartphone ECG monitors and resting ECG machines by providing the user with real-
time ECG acquisition and display, beat classification, and the same statistical summaries
available on resting ECG machines, which include: RR, P, and QRS durations; PR, QT, and QTc
intervals; and average, high and low heart rates.
3.2 STATE-OF-THE-ART TEST BED
A state-of-the-art test bed for smartphone ECG processing was constructed on an HTC Ty TN II
Windows Mobile 6 smartphone, as shown in Figure 3. The smartphone has a 400 MHz arm
processor and 128 MB of ram. The phone processes ECG data provided by the Alive ECG
sensor, also shown in Figure 3. The core components of the system are data acquisition, real-time
ECG display, plug-in-based ECG processing, and cardiac summary reports, which are described
in the following subsections.
13
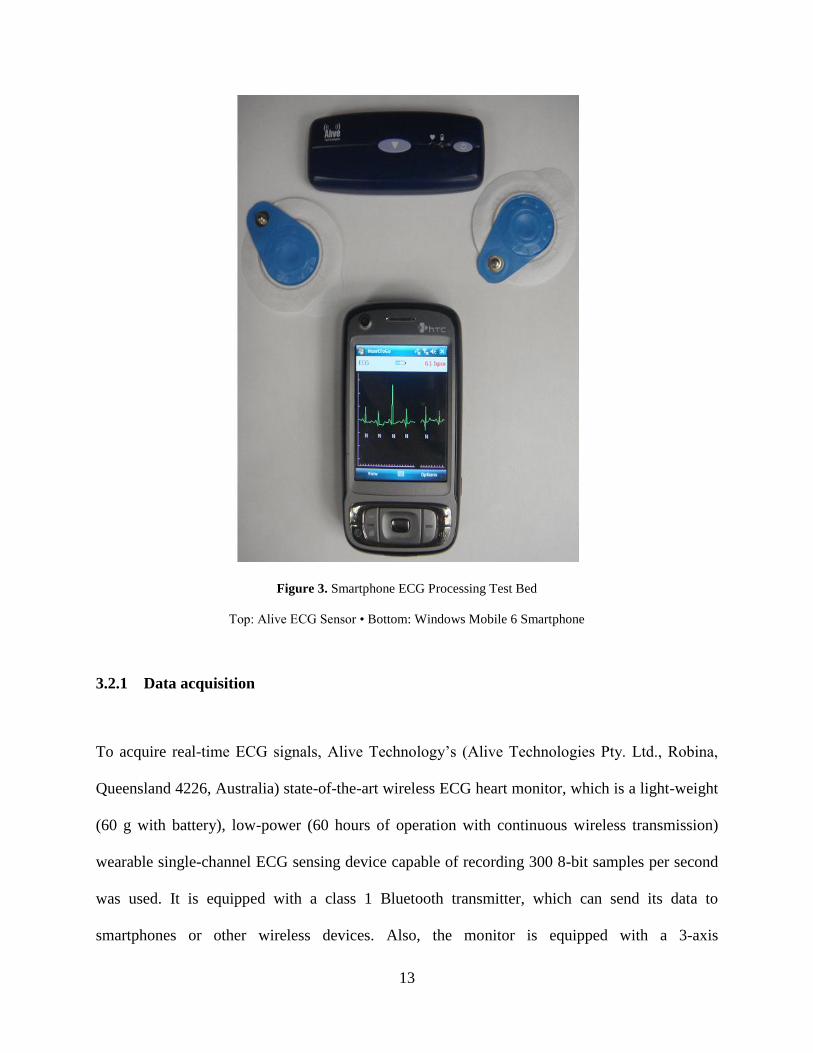
Figure 3. Smartphone ECG Processing Test Bed
Top: Alive ECG Sensor • Bottom: Windows Mobile 6 Smartphone
3.2.1 Data acquisition
To acquire real-time ECG signals, Alive Technology’s (Alive Technologies Pty. Ltd., Robina,
Queensland 4226, Australia) state-of-the-art wireless ECG heart monitor, which is a light-weight
(60 g with battery), low-power (60 hours of operation with continuous wireless transmission)
wearable single-channel ECG sensing device capable of recording 300 8-bit samples per second
was used. It is equipped with a class 1 Bluetooth transmitter, which can send its data to
smartphones or other wireless devices. Also, the monitor is equipped with a 3-axis
14
accelerometer. Furthermore, the ECG signal from the monitoring session can be recorded to a
secure digital (SD) card that plugs into the sensor, allowing for optional offline analysis by a
physician similar to that of a Holter monitor. Note that the recording length varies with the size
of the SD card used (e.g. a 1 GB card could store 40 days worth of continuous ECG data).
HeartToGo, the multi-threaded C# application we developed for the real-time ECG
display, processing, and cardiac summary reports, runs on Windows Mobile Smartphones. The
Alive heart monitor communicates with HeartToGo using a Bluetooth serial port profile (SPP)
connection. HeartToGo uses a dedicated thread to process the incoming Bluetooth data stream,
which is made up of variable length packets containing both ECG data samples and acceleration
data samples. Once the input data is read, parsed, and verified, thread delegates manage the
sharing of the new ECG samples between the display and feature extraction threads in order to
avoid cross-threading errors.
3.2.2 Real-time Display
As real-time ECG data arrives at the phone, the Bluetooth communication thread passes the data
to the display thread for plotting on the screen. Different threads are used for display and data
acquisition to obtain a responsive GUI and increase thread-level parallelism.
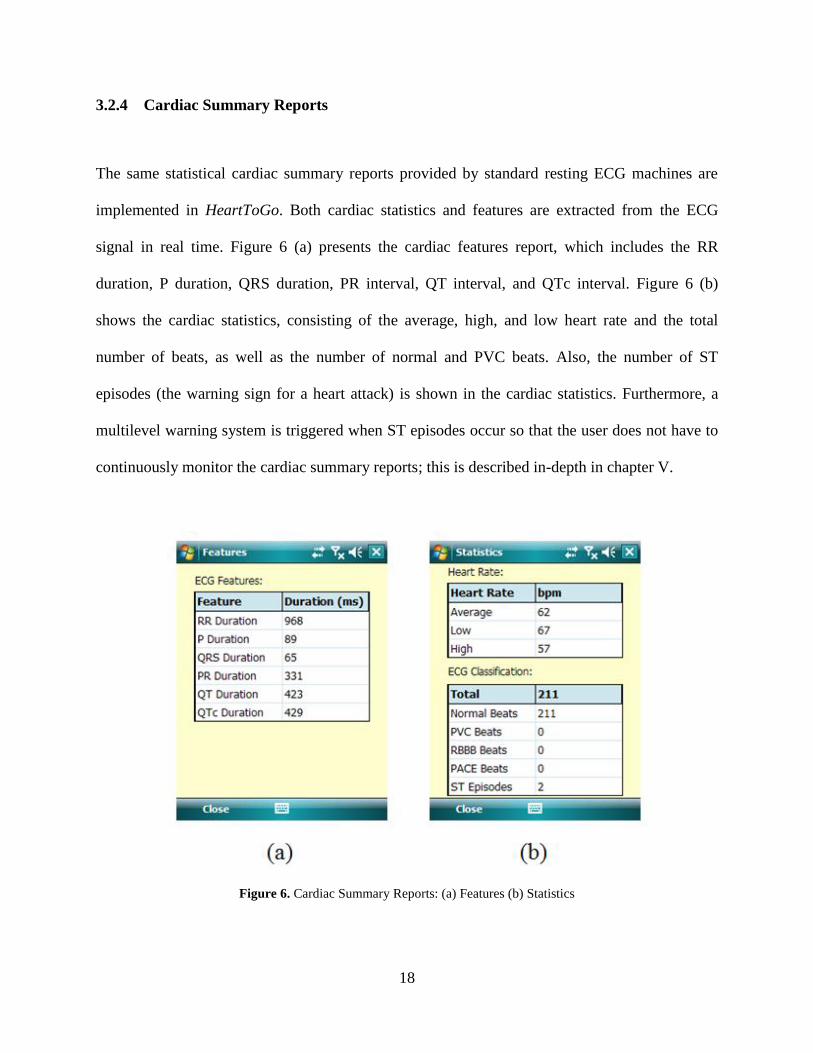
The ECG signal is plotted on the fly on the phone as data arrives at a sampling rate of
300 Hz, shown in Figure 4. Four different levels of magnification (1x, 2x, 4x, and 8x) were
implemented to allow for a close-up examination of the ECG signal and are shown in Figure 4.
The axis for the ECG plot conforms to the clinical standard of a resting ECG machine: the scale
for the vertical voltage axis is 0.5 mV per tick, and the scale of the horizontal time axis is 200 ms
per tick. Moreover, each beat is classified and an annotation is shown below each QRS complex;
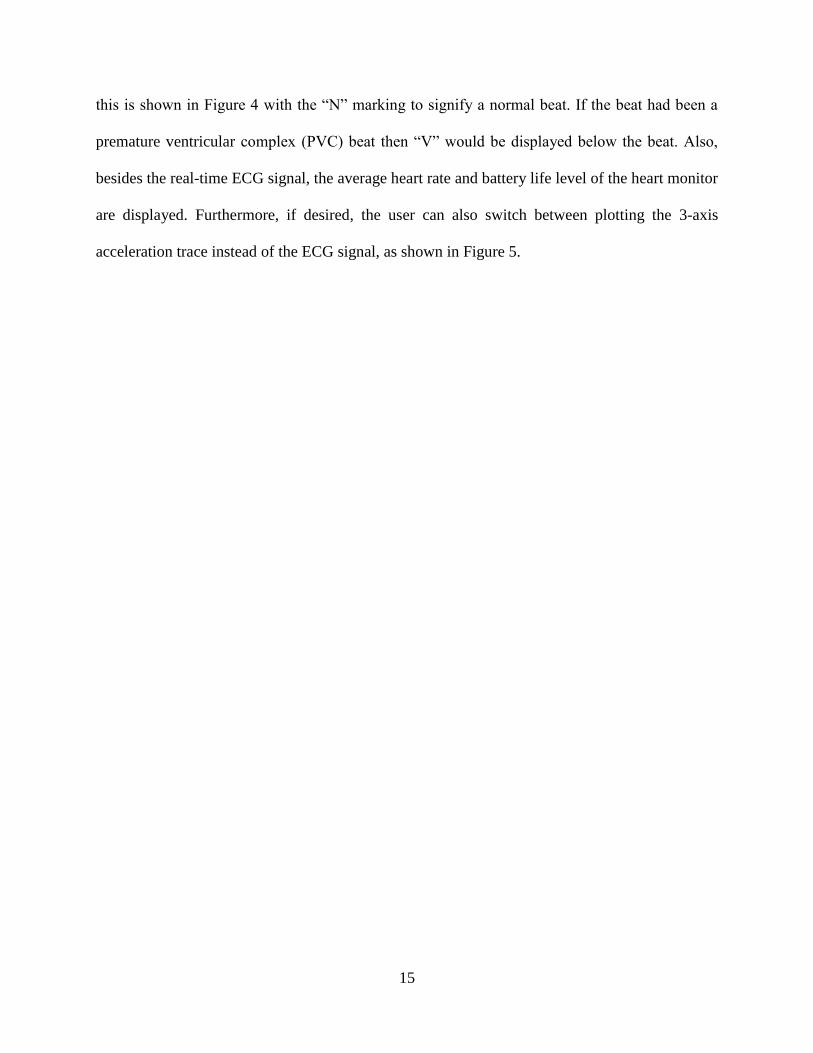
15
this is shown in Figure 4 with the “N” marking to signify a normal beat. If the beat had been a
premature ventricular complex (PVC) beat then “V” would be displayed below the beat. Also,
besides the real-time ECG signal, the average heart rate and battery life level of the heart monitor
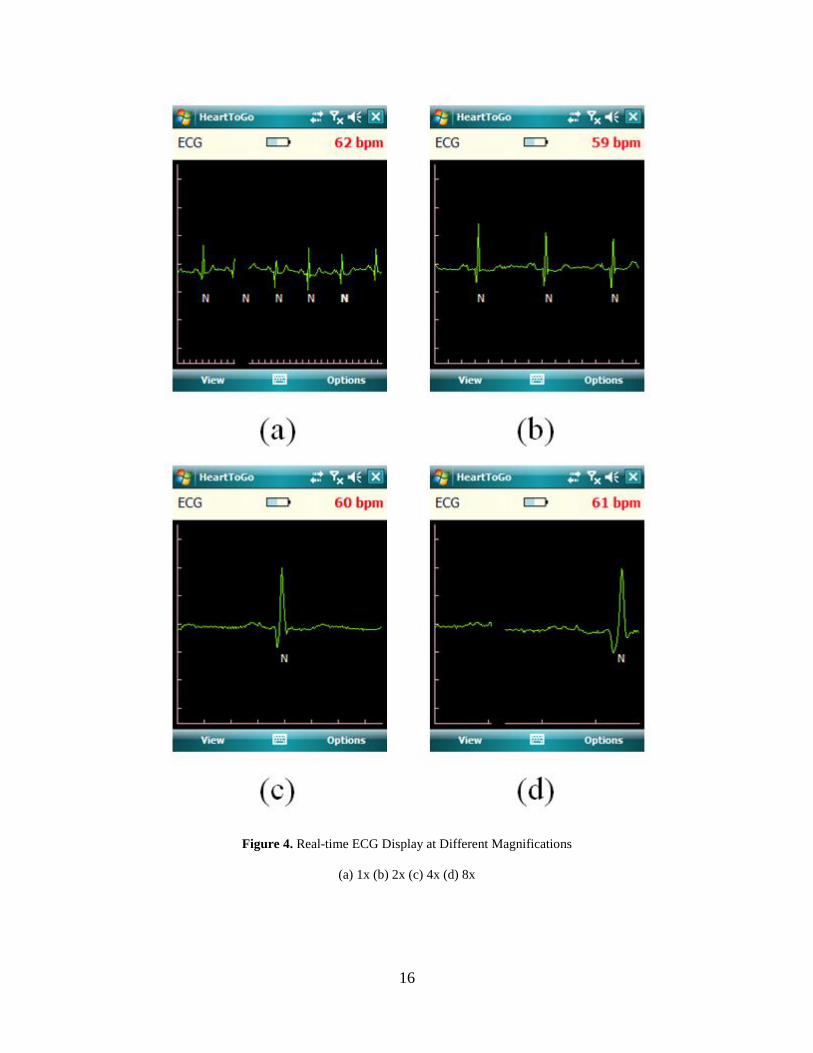
are displayed. Furthermore, if desired, the user can also switch between plotting the 3-axis
acceleration trace instead of the ECG signal, as shown in Figure 5.
16
Figure 4. Real-time ECG Display at Different Magnifications
(a) 1x (b) 2x (c) 4x (d) 8x
17
Figure 5. Real-time Three-axis (X, Y, and Z) Accelerometer Trace
3.2.3 Plug-in-based ECG processing
Feature extraction and classification is implemented on the smartphone as a separate dynamic
linked library (dll) from the main HeartToGo application and runs on its own thread. There are
two advantages to this approach. First, due to the computationally intensive math required, the
plug-ins can be written in C++ to improve execution speed as opposed to C#. This language
which was used for the GUI since it has a streamlined implementation in Windows Mobile using
the .NET Framework, but runs slower than C++ code. Second, by using this approach, different
dll plug-ins can be created for different CVDs without changing the main program, which is
responsible for data acquisition and display. This makes the process of detecting different cardiac
conditions, e.g. PVC beats vs. heart attacks, much easier from the perspective of the programmer
writing the algorithms. Furthermore, it simplifies debugging and validating the algorithm code
since it is a library and therefore platform independent and separate from the GUI.
18
3.2.4 Cardiac Summary Reports
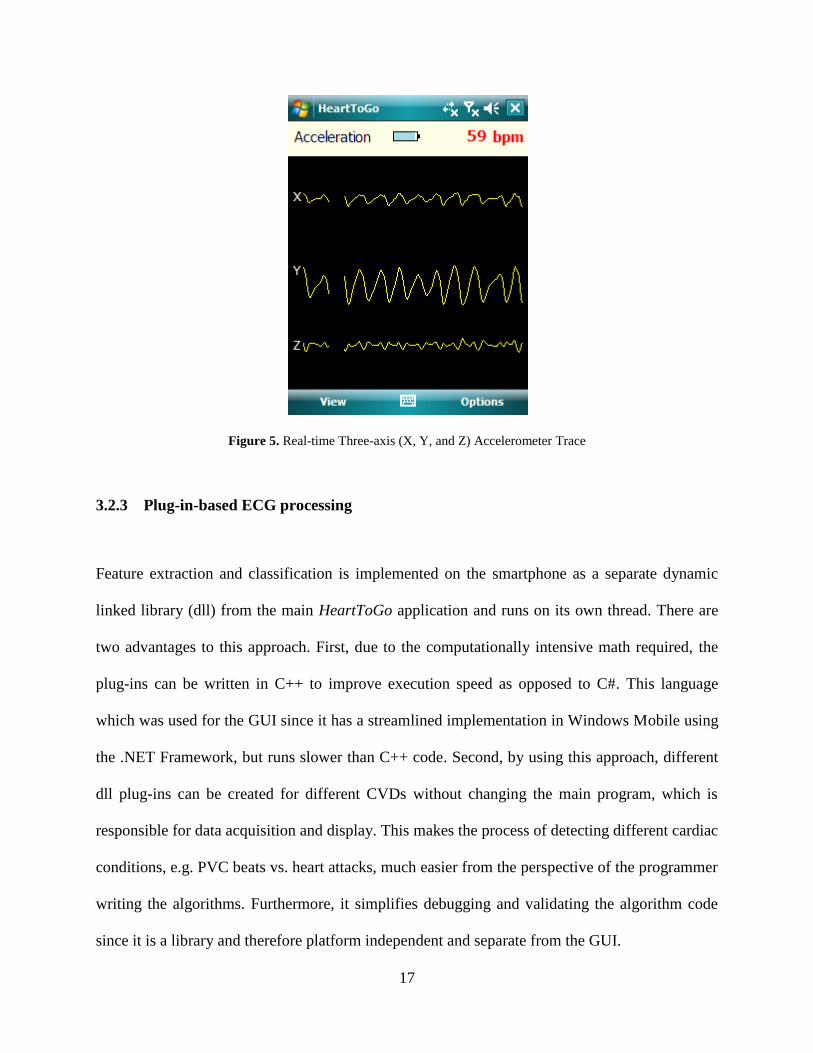
The same statistical cardiac summary reports provided by standard resting ECG machines are
implemented in HeartToGo. Both cardiac statistics and features are extracted from the ECG
signal in real time. Figure 6 (a) presents the cardiac features report, which includes the RR
duration, P duration, QRS duration, PR interval, QT interval, and QTc interval. Figure 6 (b)
shows the cardiac statistics, consisting of the average, high, and low heart rate and the total
number of beats, as well as the number of normal and PVC beats. Also, the number of ST
episodes (the warning sign for a heart attack) is shown in the cardiac statistics. Furthermore, a
multilevel warning system is triggered when ST episodes occur so that the user does not have to
continuously monitor the cardiac summary reports; this is described in-depth in chapter V.
Figure 6. Cardiac Summary Reports: (a) Features (b) Statistics
19
4.0 ACCURATE, REAL-TIME, CONTEXT AWARE HEART ATTACK
DETECTION ALGORITHM
The most important component of heart attack detection on a smartphone is choosing the correct
algorithm to detect heart attacks. This chapter will propose an accurate, real-time, context aware
heart attack detection algorithm for use on the target smartphone platform.
4.1 MOTIVATION
STEMIs start to occur when there is an abnormal ST segment. When viewing the ECG on the
monitor of a resting ECG machine, a physician can easily determine the ST segment location and
its level. Furthermore, resting ECG machines can automatically classify ST segments by
comparing the ST level at a predefined distance from the R-peak to the isoelectric level [15].
However, this segment is not easily recognized by a computer due to the complex morphology
(small magnitude waves that are easily obscured by larger, sharper waves) of the body’s ECG
signal. Many algorithms exist for offline ST segment analysis. The most popular methods are
wavelet [16], rule-based [17], artificial neural networks [18], time domain-based methods [19],
use of a predetermined location of the ST segment by a cardiologist [20], and reference sets from
an ST database [21]. While wavelets and neural networks are powerful solutions for offline
analysis, they are not suitable for a smartphone based solution because they are extremely
20
computationally intensive. The formula based and cardiologist based methods for determining
the ST segment are very computationally inexpensive, but only measure the ST segment’s level
at a predefined distance from the R-peak and do not consider the morphology of the segment.
Therefore, there exists a need for an algorithm capable of providing both reliable beat
classification and being lightweight and accurate enough to run on a smartphone based platform.
Clinically, ST elevation occurs when the ST segment is elevated greater than 0.1 mV [3-6]. This
linear decision leads to a hypothesis of linear classification. Therefore, the support vector
machine (SVM) will be proposed and evaluated as a heart attack classifier in this research.
Furthermore, a portable smartphone platform allows the users to move freely. In a clinical
setting, the patient would be confined to a bed and muscle and motion artifacts would not be a
problem. However, with the wearable ECG sensor the algorithm would need to be aware of these
artifacts since ST segment elevation detection is very sensitive to noise [22]. Moreover, these
artifacts are very difficult to remove from the signal by standard methods such as filtering
because their frequency components are in the same range as the ECG’s frequency spectrum
[23].
4.2 RELATED WORK
As with most ECG topics, computer-detectable ST segment elevation has been previously
studied. This section will survey existing algorithms which make use of wavelet, rule-based,
artificial neural networks, time domain-based methods, use of a predetermined location of the ST
segment by a cardiologist, and reference sets from an ST database.
21
In [16] X. Li, et al. present ST-T complex automatic analysis using the wavelet
transform. Their work focused on locating the fiducial points S, J (the start of the ST segment),
and T. The wavelet transform was used at different scales to detect the different fiducial points.
Although the ST fiducial points were identified in this work, the ST segments were not classified
as normal or elevated.
In [17] C. Papaloukas, et al. apply a rule-based method to ST segment classification.
First, they locate the QRS complex and identify fiducial points based on empirical formulas.
Next a rule-based method is applied to classify the ST segments. The rules are based on the value
of the ST segment after a predefined time from the R peak and the slope of the segment. The
European ST database was used for testing.
In [18] T. Stamkopoulos, et al. detect ischemia using nonlinear PCA neural networks.
The ST segment is classified into two groups: normal and abnormal. Abnormal groups are
actually comprised of artifacts, ST elevations, and ST depressions. The radial basis function
neural network is used and the algorithm is tested using the European ST database. A
classification accuracy of 80% for normal beats and 90% for ischemic beats is reported.
F. Badilini, et al. detect ischemia from Holter monitor recordings in [19]. Empirical
formulas are provided to create a window for locating the ST segment based on heart rate, i.e. the
RR interval. Next, the resulting windowed ST segment is classified.
D. Fischell, et al. patent a system for the detection of cardiac events in [20]. Their system
requires that a physician assess the location of the patient’s ST segment with respect to the QRS
complex. Based on this fixed location, an algorithm then monitors the ST segment for changes in
elevation. Should a change in elevation occur a warning system is triggered.
22
In [21] G. Jeong and K. Yu use reference sets to classify ST segments. A polynomial
approximation of the ST segment is used. First, QRS detection is performed, followed by the
polynomial approximation to classify the ST shape. ST type is determined by comparing with the
slope of the reference ST type. ST type by comparing The European ST database is used for
testing data.
4.3 PROPOSED HEART ATTACK DETECTION ALGORITHM
A real-time, accurate, context aware ST segment classification algorithm using PCA for feature
extraction and an SVM for normal or abnormal (heart attack) classification is proposed for heart
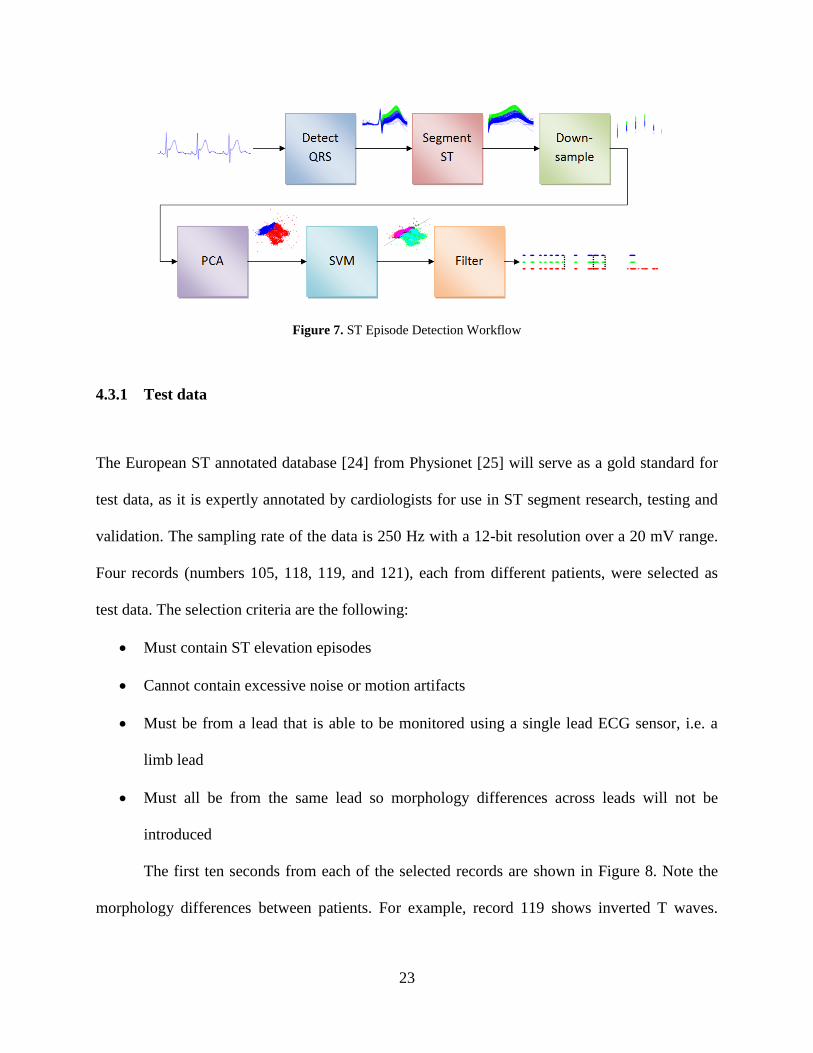
attack detection. The detection workflow is shown in Figure 7. First, real-time ECG data is
segmented beat-by-beat using a QRS detector. Next, ST segments are extracted from the
individual heartbeats and then downsampled to eliminate redundancy and speed computation
time. PCA is further used for dimensionality reduction and provides two principal components
for the classifier. An SVM is used to classify the ST segments into two categories: normal or ST
elevated. Finally, a filtering operation is performed to detect ST episodes, which are clinically
significant signs of heart attack [24].
First, the algorithm was prototyped in MATLAB due to its ease in implementing
algorithms and predefined functions, including PCA and SVM. Next, the code was translated to
C for use with the smartphone application HeartToGo. The algorithms were validated throughout
each stage of the design, but the most extensive testing will be discussed in chapter VI. The
following subsections will provide a greater explanation of the individual components to the
heart attack detection algorithm.
23
Figure 7. ST Episode Detection Workflow
4.3.1 Test data
The European ST annotated database [24] from Physionet [25] will serve as a gold standard for
test data, as it is expertly annotated by cardiologists for use in ST segment research, testing and
validation. The sampling rate of the data is 250 Hz with a 12-bit resolution over a 20 mV range.
Four records (numbers 105, 118, 119, and 121), each from different patients, were selected as
test data. The selection criteria are the following:
Must contain ST elevation episodes
Cannot contain excessive noise or motion artifacts
Must be from a lead that is able to be monitored using a single lead ECG sensor, i.e. a
limb lead
Must all be from the same lead so morphology differences across leads will not be
introduced
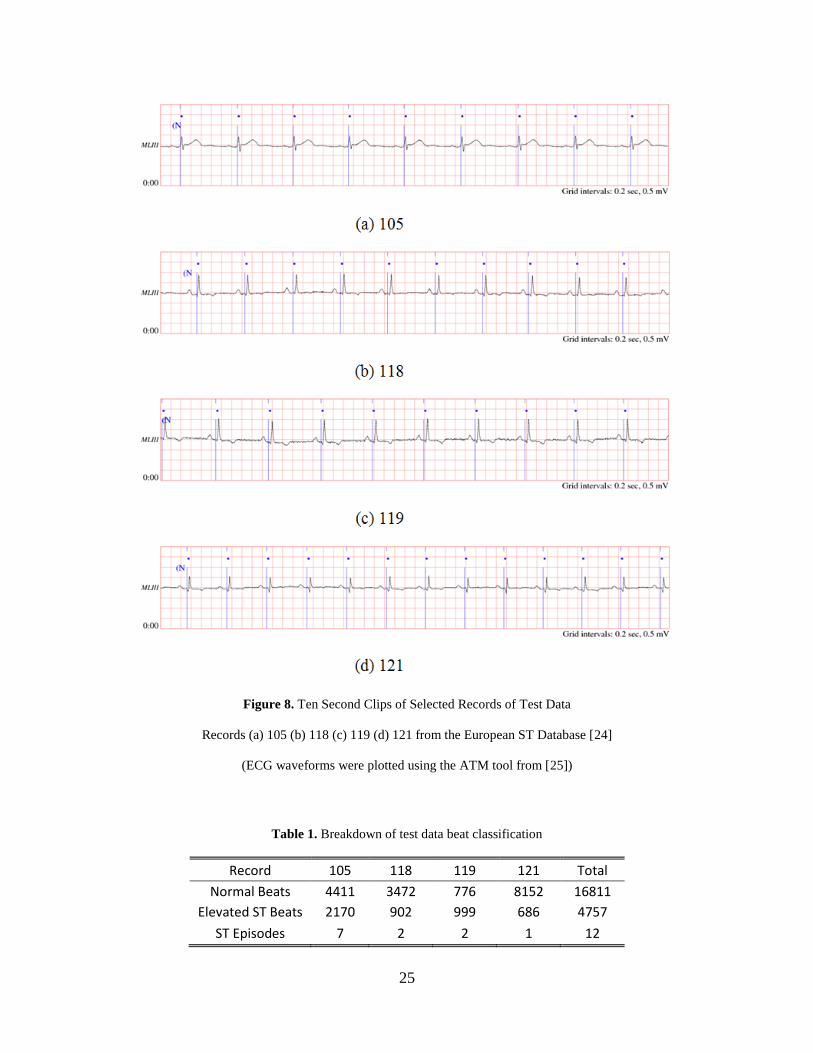
The first ten seconds from each of the selected records are shown in Figure 8. Note the
morphology differences between patients. For example, record 119 shows inverted T waves.

24
Also, the data were recorded using limb lead III. This lead was chosen because 1) no limb lead II
data were available and 2) limb lead I data did not meet any of the criteria above.
With this data set, 21,568 heartbeats are available, roughly 1/4th
of which are ST segment
elevated. Furthermore, 12 cases of ST episodes are observed in the test data, which will serve as
the heart attack warning. These episodes consist of at least thirty seconds of ST elevated beats in
order to be clinically relevant [24]. Table 1 provides a breakdown of the number of normal beats,
number of ST elevated beats, and the number of ST episodes for each record.
25
Figure 8. Ten Second Clips of Selected Records of Test Data
Records (a) 105 (b) 118 (c) 119 (d) 121 from the European ST Database [24]
(ECG waveforms were plotted using the ATM tool from [25])
Table 1. Breakdown of test data beat classification
Record 105 118 119 121 Total
Normal Beats 4411 3472 776 8152 16811
Elevated ST Beats 2170 902 999 686 4757
ST Episodes 7 2 2 1 12

26
4.3.2 Heartbeat detection and segmentation
Heartbeat detection is an extremely important stage in the overall heart attack detection
algorithm. Without a properly functioning beat detector, ST segments would not be able to be
located. Since this research focuses on detecting ST segment episodes, and since beat detection is
a very well solved problem, beat detection will be performed by the classic Pans-Tompkins beat
detector [26-28], which has a sensitivity of 99.69% and positive prediction of 99.77% when
evaluated with the MIT-BIH arrhythmia database from Physionet [25].
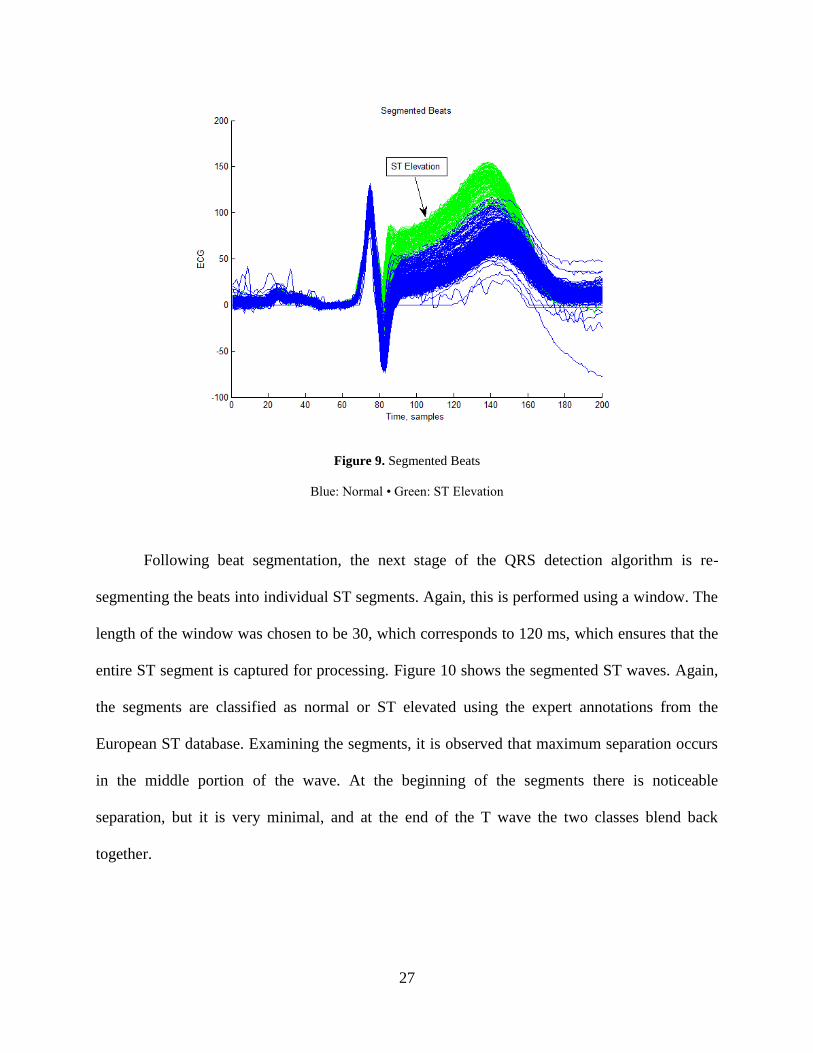
After performing on-the-fly beat detection, the heartbeats are segmented, as shown in
Figure 9. To ensure that the entire beat is captured, a window length of 201 is used, which
corresponds to 0.8 seconds. Figure 9 clearly shows the difference between normal beats, and ST
elevated beats. As the ST segment continues to rise above the isoelectric level the beat remains
normal, but when the level crosses the 0.1 mV threshold the beat is then classified as ST
elevated. Note that in the Figure 9 the two classes: normal and ST elevated came from the expert
annotations of the European ST database.
27
Figure 9. Segmented Beats
Blue: Normal • Green: ST Elevation
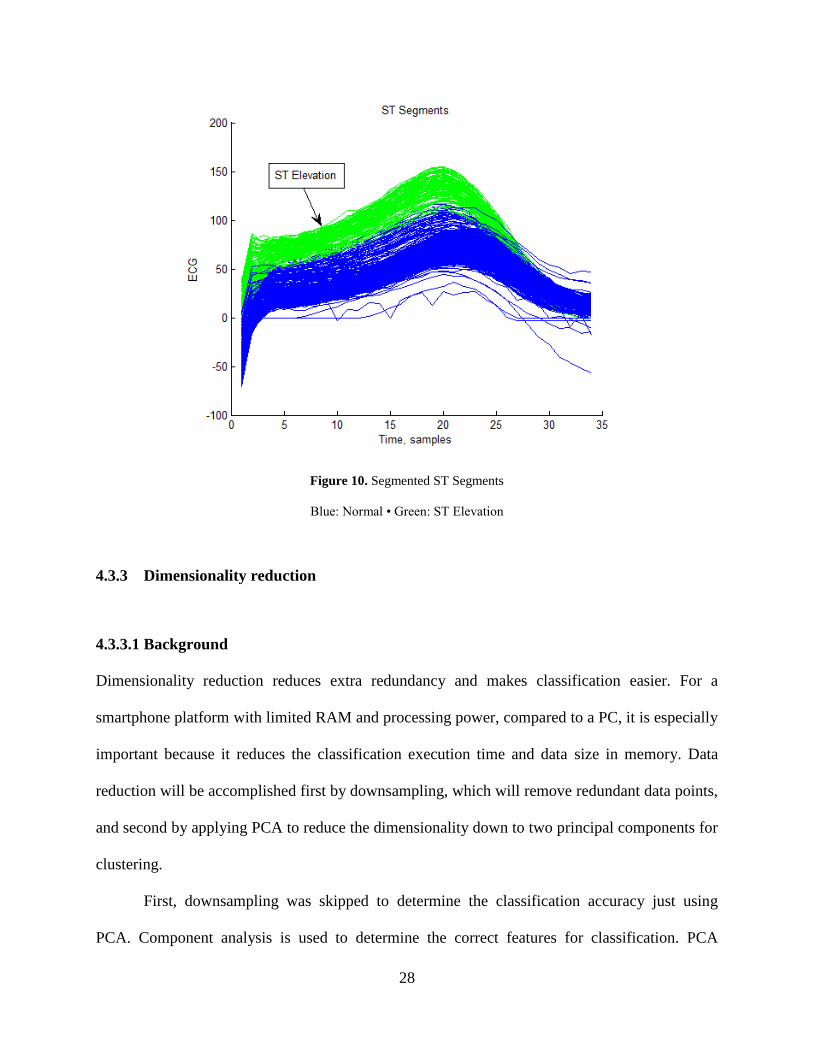
Following beat segmentation, the next stage of the QRS detection algorithm is re-
segmenting the beats into individual ST segments. Again, this is performed using a window. The
length of the window was chosen to be 30, which corresponds to 120 ms, which ensures that the
entire ST segment is captured for processing. Figure 10 shows the segmented ST waves. Again,
the segments are classified as normal or ST elevated using the expert annotations from the
European ST database. Examining the segments, it is observed that maximum separation occurs
in the middle portion of the wave. At the beginning of the segments there is noticeable
separation, but it is very minimal, and at the end of the T wave the two classes blend back
together.
28
Figure 10. Segmented ST Segments
Blue: Normal • Green: ST Elevation
4.3.3 Dimensionality reduction
4.3.3.1 Background
Dimensionality reduction reduces extra redundancy and makes classification easier. For a
smartphone platform with limited RAM and processing power, compared to a PC, it is especially
important because it reduces the classification execution time and data size in memory. Data
reduction will be accomplished first by downsampling, which will remove redundant data points,
and second by applying PCA to reduce the dimensionality down to two principal components for
clustering.
First, downsampling was skipped to determine the classification accuracy just using
PCA. Component analysis is used to determine the correct features for classification. PCA

29
projects n-dimensional data onto a lower-dimensional subspace (two dimensions in this case),
while maintaining an optimal sum-squared error [29]. As given in [29], first, the squared-error
criterion is defined by the following:
( ) ∑ ‖ ‖
(1)
where the samples x1, …, xn are represented by a single vector x0, and the sum of the squared
distances between x0 and xk are as small as possible. The solution is to let x0 equal the sample
mean, m. Since the mean is a zero-dimensional representation of the data which doesn’t show
any variability, consider a one dimensional projection:
(2)
where e is a unit vector in the direction of the line and the scalar a corresponds to the distance of
any point x from m. Solving for ak yields:
( ) (3)
Next, the best direction of e needs to be found, which is performed using the scatter matrix, S,
given by:
∑ ( ) ( )
(4)
The largest eigenvectors are then selected, which correspond to the largest eigenvalues of the
scatter matrix to find the best projection:
(5)
Finally, projection to a lower-dimensional space dn is given by:
∑ (6)
30
4.3.3.2 Results
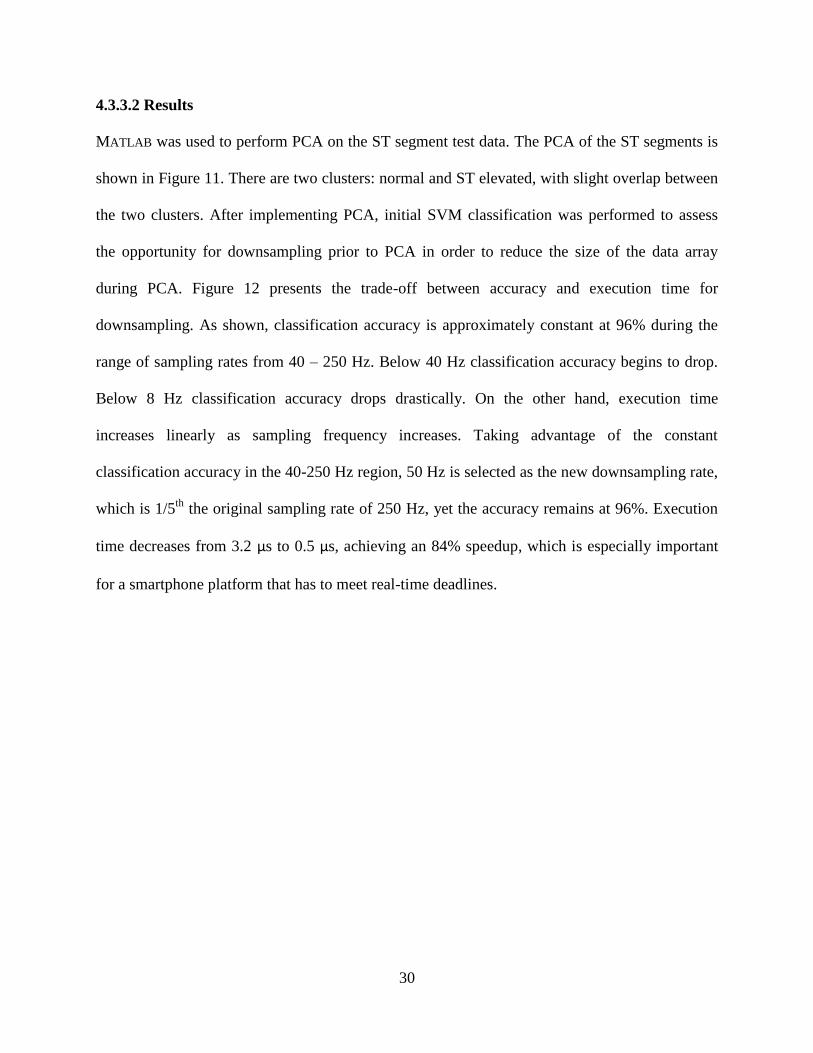
MATLAB was used to perform PCA on the ST segment test data. The PCA of the ST segments is
shown in Figure 11. There are two clusters: normal and ST elevated, with slight overlap between
the two clusters. After implementing PCA, initial SVM classification was performed to assess
the opportunity for downsampling prior to PCA in order to reduce the size of the data array
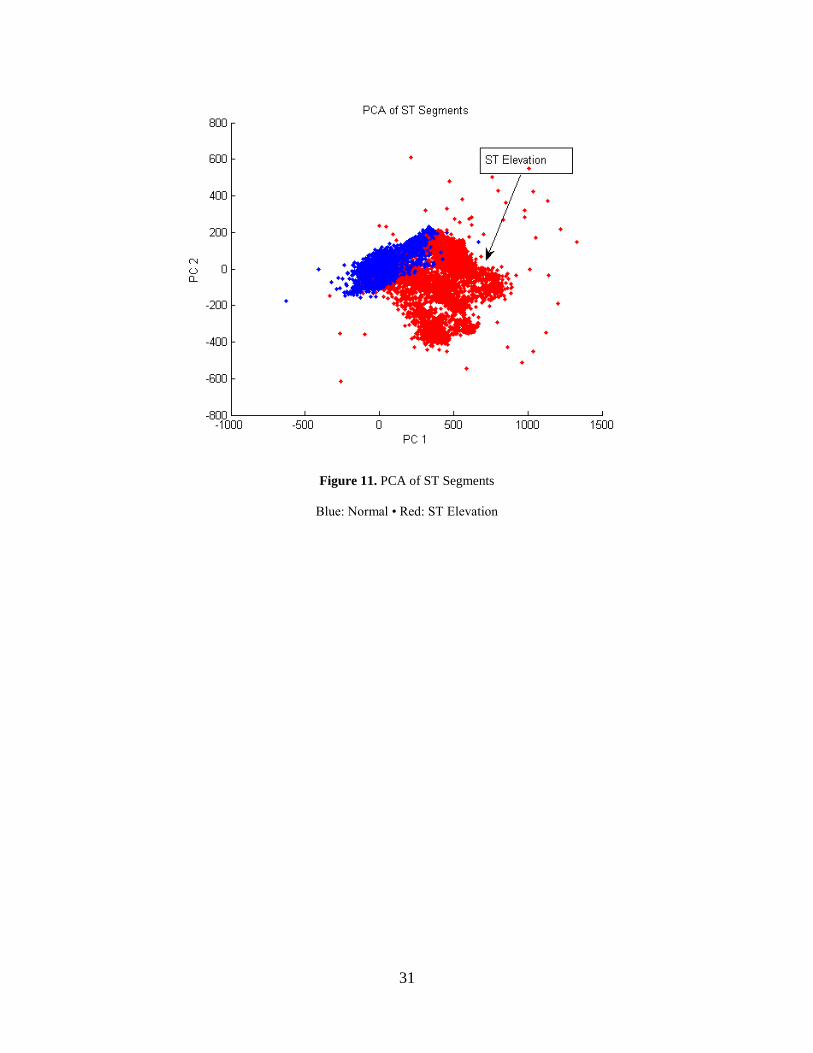
during PCA. Figure 12 presents the trade-off between accuracy and execution time for
downsampling. As shown, classification accuracy is approximately constant at 96% during the
range of sampling rates from 40 – 250 Hz. Below 40 Hz classification accuracy begins to drop.
Below 8 Hz classification accuracy drops drastically. On the other hand, execution time
increases linearly as sampling frequency increases. Taking advantage of the constant
classification accuracy in the 40-250 Hz region, 50 Hz is selected as the new downsampling rate,
which is 1/5th
the original sampling rate of 250 Hz, yet the accuracy remains at 96%. Execution
time decreases from 3.2 μs to 0.5 μs, achieving an 84% speedup, which is especially important
for a smartphone platform that has to meet real-time deadlines.
31
Figure 11. PCA of ST Segments
Blue: Normal • Red: ST Elevation
32
Figure 12. Downsampling: Accuracy vs. Execution Time Trade-off
4.3.4 Classification
4.3.4.1 Background
Classification of beats into normal and ST elevated groups requires defining a boundary between
the two regions. This research uses a support vector machine (SVM) to construct the boundary
between classes. For a smartphone with limited computing power, compared to a PC, the most
light-weight on-the-fly classification method is desired, which would be a linear classifier. With
a linear clinical criterion for ST segment elevation occurring at levels greater than 0.1 mV [3-6],
it is hopeful that a linear SVM can also be used.
33
SVMs are classifiers that rely on preprocessing the data to higher dimensions than the
original feature space. With an appropriate nonlinear mapping kernel, φ, two-class data can be
separated by a hyperplane [29]. For n patterns (k = 1,…n) xk, which have been transformed to yk
= φ (xk), let zk = ± 1depending on whether the pattern is in class C1 or C2. From [29], a linear
discriminator in the augmented space is:
( ) (7)
A separating hyperplane ensures that:
( ) (8)
where the support vectors are those where ( ) . These support vectors are equally close
to the hyperplane (note that Figure 13 circles support vectors) and are the training samples that
define optimal separating hyperplane. Accordingly, they are also the most difficult patterns to
classify [29].
This section examines the classification results using different kernels: linear, quadratic,
multilayer perceptron (MLP), and radial basis function (RBF) to determine which is the most
suitable for use in the heart attack detection algorithm.
4.3.4.2 Results
MATLAB is used for algorithm training and verification due to its prewritten classification
toolboxes. To perform the training and testing cross-validation is used. Twenty-five percent of
the normal heartbeats (4,200) and twenty-five percent of the ST elevated beats (1,200) from the
expertly annotated training set are randomly selected for use in the training stage and the
remaining seventy-five percent of beats are then classified with the trained SVM. Classification
training results are shown in Figure 13 for each kernel and the classification accuracy is outlined
34
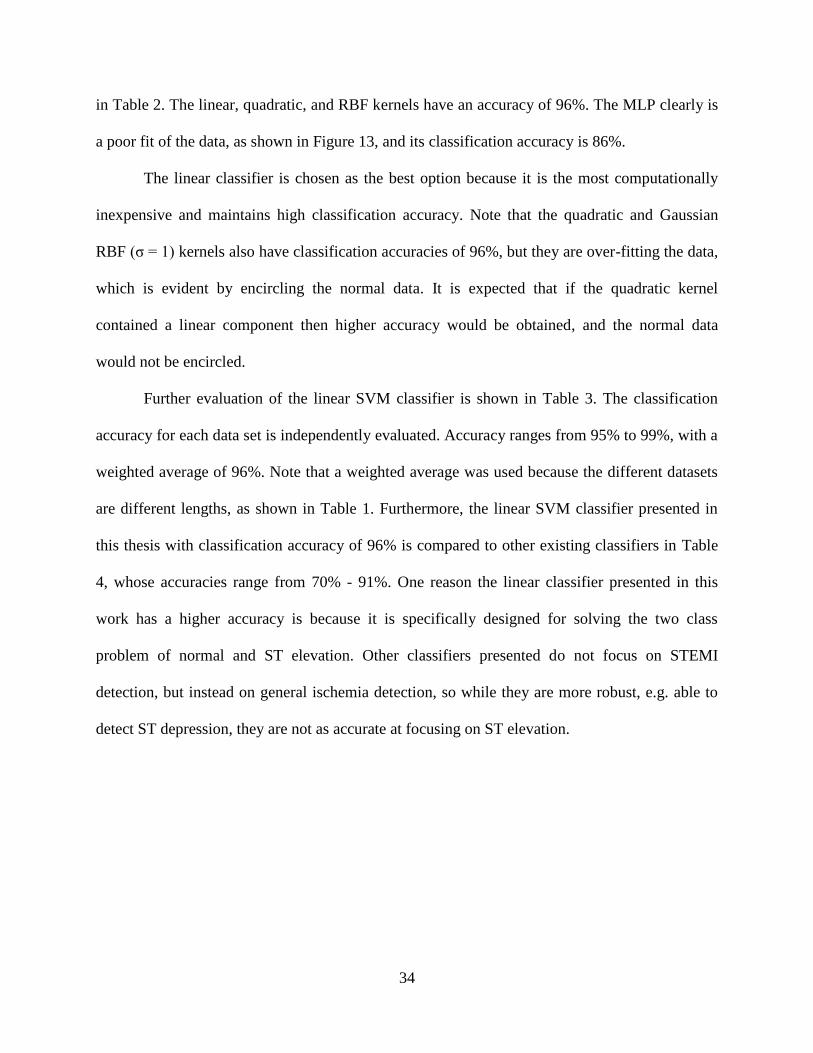
in Table 2. The linear, quadratic, and RBF kernels have an accuracy of 96%. The MLP clearly is
a poor fit of the data, as shown in Figure 13, and its classification accuracy is 86%.
The linear classifier is chosen as the best option because it is the most computationally
inexpensive and maintains high classification accuracy. Note that the quadratic and Gaussian
RBF (σ = 1) kernels also have classification accuracies of 96%, but they are over-fitting the data,
which is evident by encircling the normal data. It is expected that if the quadratic kernel
contained a linear component then higher accuracy would be obtained, and the normal data
would not be encircled.
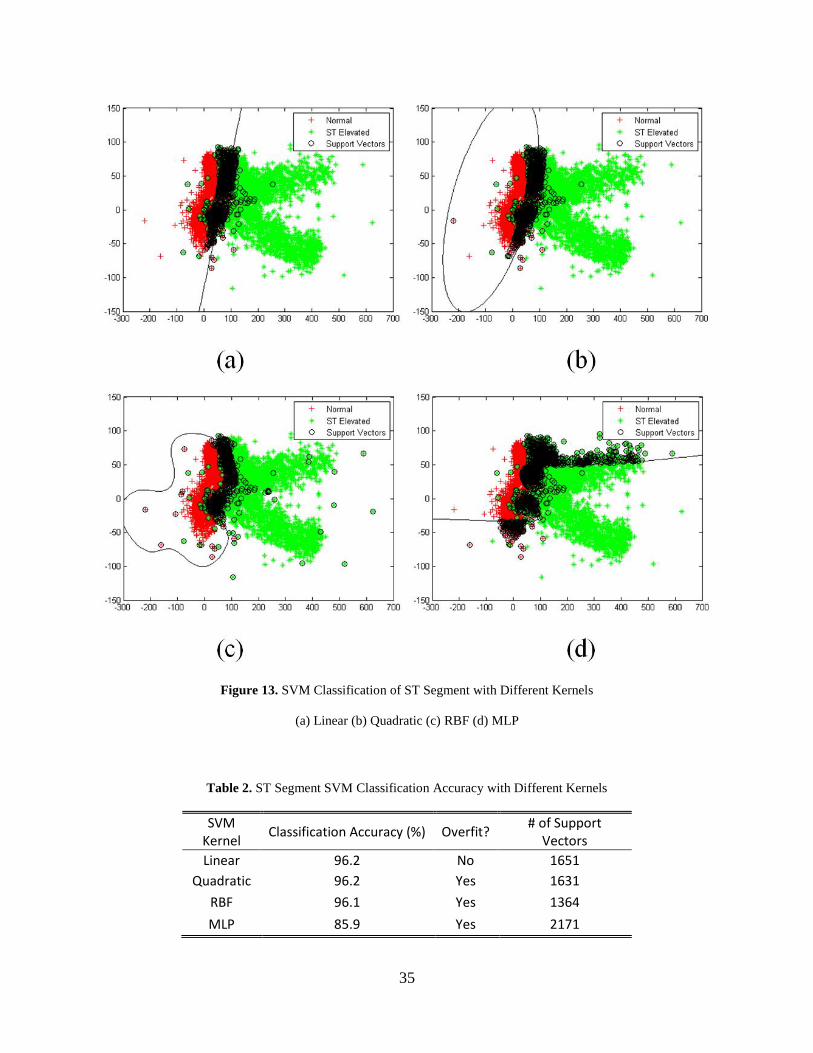
Further evaluation of the linear SVM classifier is shown in Table 3. The classification
accuracy for each data set is independently evaluated. Accuracy ranges from 95% to 99%, with a
weighted average of 96%. Note that a weighted average was used because the different datasets
are different lengths, as shown in Table 1. Furthermore, the linear SVM classifier presented in
this thesis with classification accuracy of 96% is compared to other existing classifiers in Table
4, whose accuracies range from 70% - 91%. One reason the linear classifier presented in this
work has a higher accuracy is because it is specifically designed for solving the two class
problem of normal and ST elevation. Other classifiers presented do not focus on STEMI
detection, but instead on general ischemia detection, so while they are more robust, e.g. able to
detect ST depression, they are not as accurate at focusing on ST elevation.
35
Figure 13. SVM Classification of ST Segment with Different Kernels
(a) Linear (b) Quadratic (c) RBF (d) MLP
Table 2. ST Segment SVM Classification Accuracy with Different Kernels
SVM Kernel
Classification Accuracy (%) Overfit? # of Support
Vectors
Linear 96.2 No 1651
Quadratic 96.2 Yes 1631
RBF 96.1 Yes 1364
MLP 85.9 Yes 2171
36
Table 3. SVM Classification Accuracy of Test Data
Record 105 118 119 121 Weighted Average
Classification Accuracy (%)
95.9 99.3 96.2 98.2 96.2
Table 4. SVM Classification Accuracy vs. Other Methods
Method Accuracy (%)
PCA & SVM (This work) 96
Genetic Algorithm [30] 91
PCA & ANN [31] 79
HMM [32] 86
KL & Mahalanobis [33] 87
ANN Back propagation [34] Rule-based [17]
89 70
4.3.5 Smoothing filter
After individual heartbeat classification, heart attack detection can be performed. As previously
mentioned, one heartbeat with an elevated ST segment does not indicate heart attack. Instead, at
least a thirty second episode of elevated ST segments is clinically significant [24]. To obtain the
ST episodes a smoothing filter is used. This is necessary because 1) the heart attack detection
algorithm is not 100% accurate and may misclassify a few beats in an ST segment and 2) ST
episodes with duration of less than thirty seconds can be filtered out.
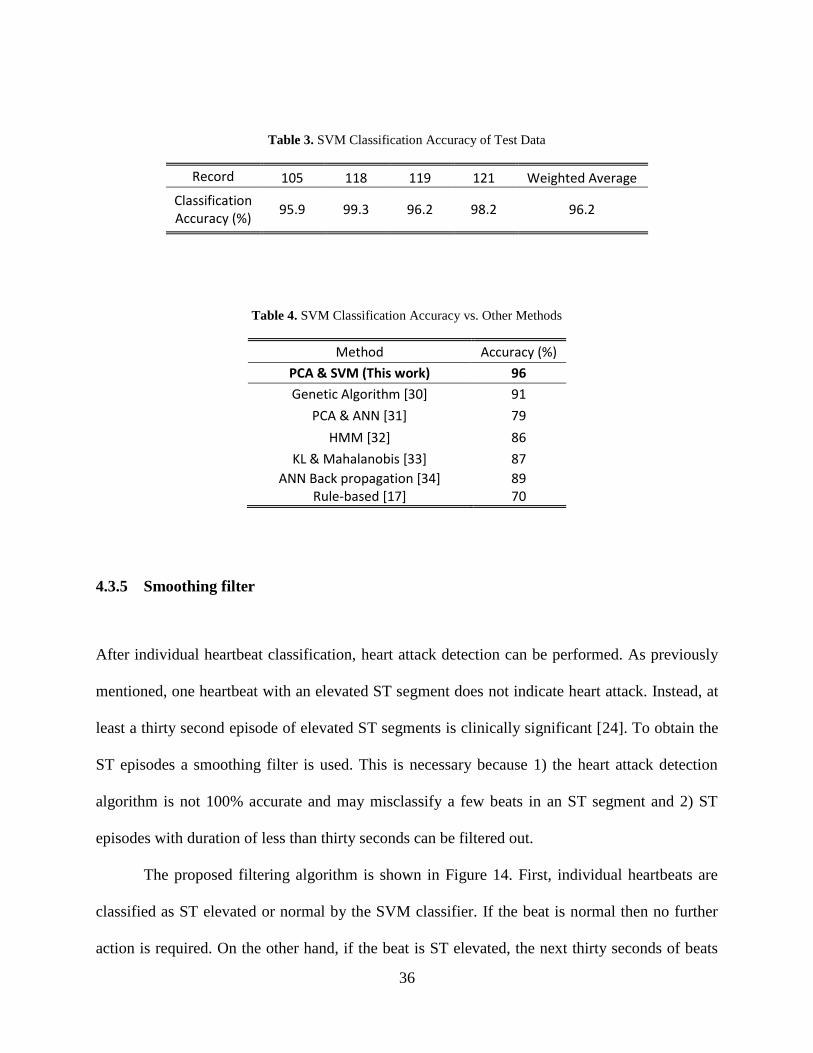
The proposed filtering algorithm is shown in Figure 14. First, individual heartbeats are
classified as ST elevated or normal by the SVM classifier. If the beat is normal then no further
action is required. On the other hand, if the beat is ST elevated, the next thirty seconds of beats
37
are summed (1 ≡ ST elevated beat, 0 ≡ normal beat). If the sum is greater than a certain
threshold, i.e. there were a significant number of ST elevated beats in the episode, then it is
classified as an ST episode and the warning system presented in the next chapter will launch. If
the sum is less than the threshold the beat is reclassified as normal to prevent false alarms.
Figure 14. ST Episode Filter Algorithm
Filtering was performed on the classified results to verify the algorithm and compare the
accuracy of filtering versus using the results directly from the classifier. Figure 15 plots the ST
episodes in time. Expert annotated ST episodes from the database are used as a reference. As
shown, the filtered results match the annotations: all ST episodes were detected and there were
zero false positives. However, while the unfiltered ST episodes also detect all ST episodes, there
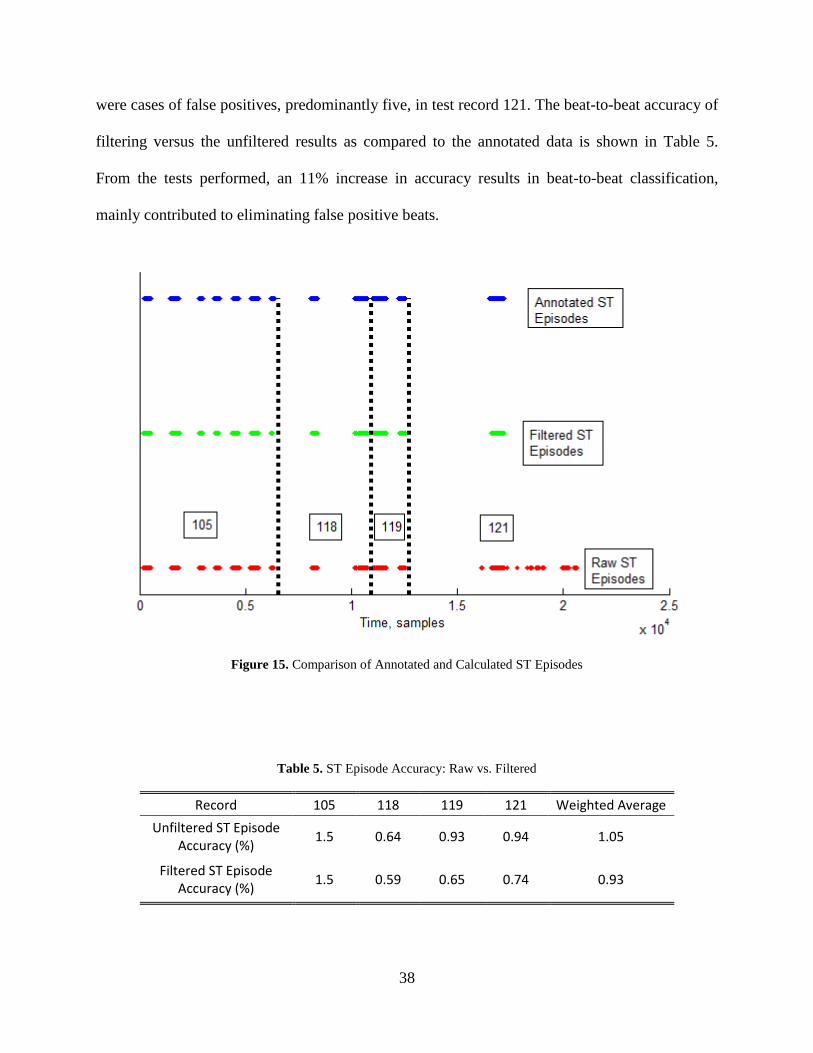
38
were cases of false positives, predominantly five, in test record 121. The beat-to-beat accuracy of
filtering versus the unfiltered results as compared to the annotated data is shown in Table 5.
From the tests performed, an 11% increase in accuracy results in beat-to-beat classification,
mainly contributed to eliminating false positive beats.
Figure 15. Comparison of Annotated and Calculated ST Episodes
Table 5. ST Episode Accuracy: Raw vs. Filtered
Record 105 118 119 121 Weighted Average
Unfiltered ST Episode Accuracy (%)
1.5 0.64 0.93 0.94 1.05
Filtered ST Episode Accuracy (%)
1.5 0.59 0.65 0.74 0.93
39
4.3.6 Discussion
An accurate, real-time heart attack detection algorithm has been proposed, implemented, and
tested. A classification accuracy of 96% was achieved, all ST episodes were detected, and zero
false positives were reported when validating with the European ST database [24]. However, one
disadvantage to the popular European ST database is that only ST episodes are expertly
annotated. Individual beats on the other hand, are not annotated as to whether they are ST
elevated or normal. Because of this, there are, in fact, ST elevated beats that are annotated as
normal beats. While there are not many of these beats, this problem was evident in Figure 15,
which shows that for the raw ST episodes there were short bursts of ST elevation which did not
show up in the annotated episodes because their length was less than thirty seconds. Therefore, it
is desired that for future testing a new database be created and that not only ST episodes are
expertly annotated, but also the ST segment elevation level for each beat be provided for a more
robust training and validation data set.
The heart attack detection algorithm presented consists of multiple stages: beat detection,
ST segmentation, downsampling, PCA, SVM classification, and filtering. With the advent of
multi-core processors for desktop computing, it is only a matter of time before they make their
way into the smartphone market. This pipelined heart attack detection algorithm lends itself to
parallelizations that could be exploited on a multi-core processor. In future work, this algorithm
should be parallelized, which will have the advantage of running faster and therefore, ensuring
that real-time deadlines are met. Furthermore, with a parallel workload the processing of extra
leads of ECG data could be incorporated, once wearable ECG sensor technology advances to
monitoring multiple leads.
40
4.4 INCORPORATION OF CONTEXT AWARENESS
Context awareness provides physical/environmental information to a computer. In this case, the
context is body movement, i.e. acceleration data, which is provided by the Alive sensor’s built-in
accelerometer. This section will describe the usefulness of incorporating accelerometer data into
ECG processing as well as provide testing results.
4.4.1 Motivation
Motion and muscle artifacts are a well-known problem in ECG processing. These artifacts are
notorious for being very difficult to remove from the signal by standard methods such as filtering
because their frequency components are in the same range as the ECG’s frequency spectrum
[23]. In a clinical setting, the patient would be confined to a bed and muscle and motion artifacts
would not be a problem. However, a portable smartphone platform allows users to move freely,
thus introducing muscle and motion noise. The wearable ECG sensor the algorithm needs to be
aware of these artifacts since ST segment elevation detection is very sensitive to noise [22]. One
way to detect excessive motion artifacts is to monitor the user’s acceleration. By monitoring the
user’s acceleration for excessive movement, which significantly degrades the ECG signal, false
alarms can be limited.
4.4.2 Implementation and testing
To introduce body movement context awareness into the heart attack detection algorithm, the
acceleration data is first collected from the Alive ECG sensor’s three-axis accelerometer (X, Y,
41
and Z corresponding to roll, pitch, and yaw axes, respectively). These data are then available to
the heart attack detection algorithm for context consideration.
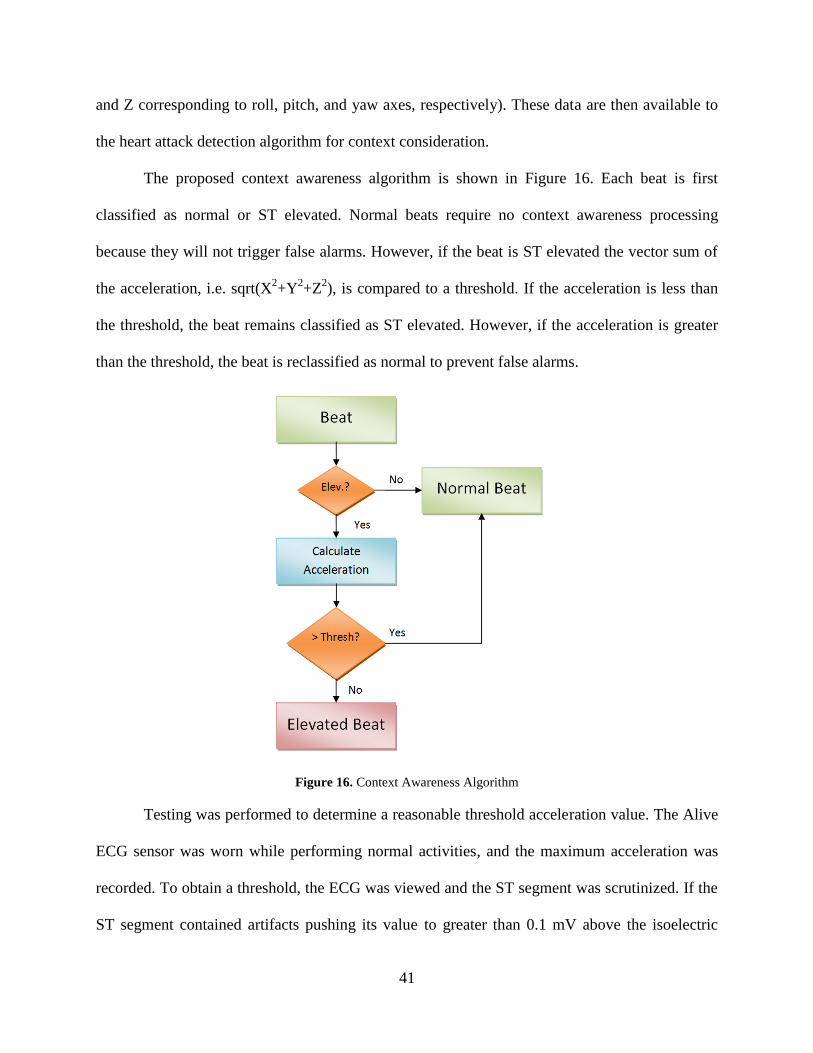
The proposed context awareness algorithm is shown in Figure 16. Each beat is first
classified as normal or ST elevated. Normal beats require no context awareness processing
because they will not trigger false alarms. However, if the beat is ST elevated the vector sum of
the acceleration, i.e. sqrt(X2+Y
2+Z
2), is compared to a threshold. If the acceleration is less than
the threshold, the beat remains classified as ST elevated. However, if the acceleration is greater
than the threshold, the beat is reclassified as normal to prevent false alarms.
Figure 16. Context Awareness Algorithm
Testing was performed to determine a reasonable threshold acceleration value. The Alive
ECG sensor was worn while performing normal activities, and the maximum acceleration was
recorded. To obtain a threshold, the ECG was viewed and the ST segment was scrutinized. If the
ST segment contained artifacts pushing its value to greater than 0.1 mV above the isoelectric
42
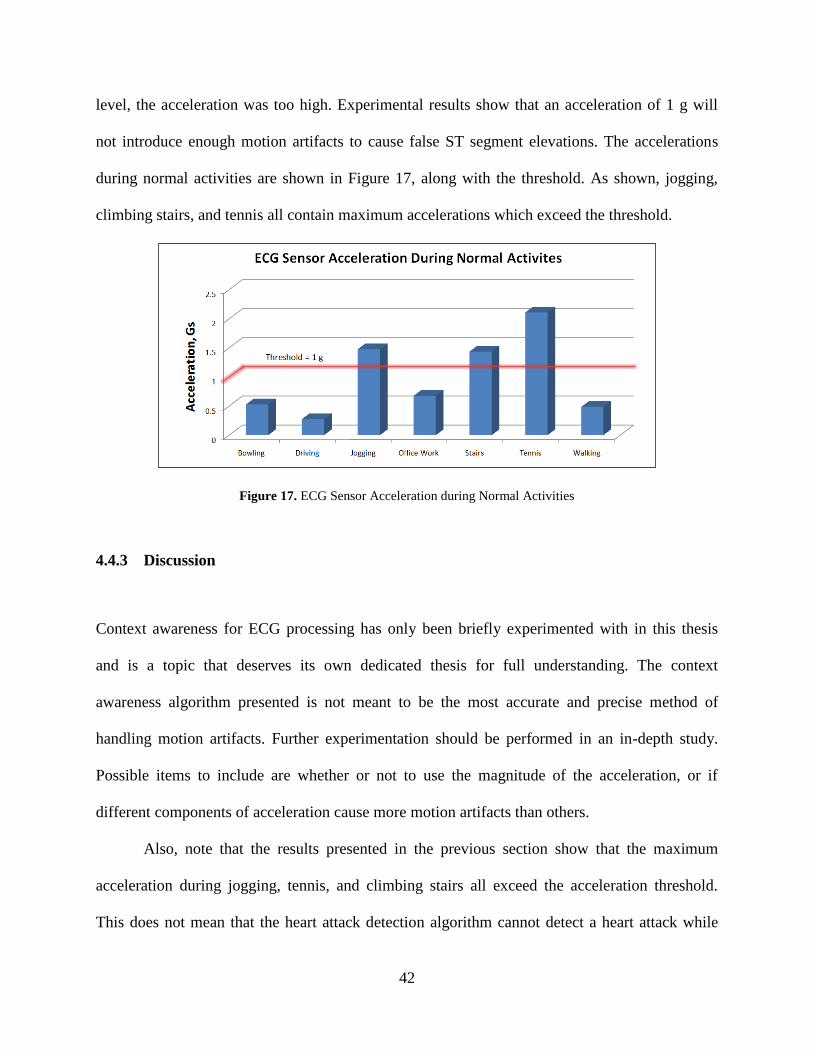
level, the acceleration was too high. Experimental results show that an acceleration of 1 g will
not introduce enough motion artifacts to cause false ST segment elevations. The accelerations
during normal activities are shown in Figure 17, along with the threshold. As shown, jogging,
climbing stairs, and tennis all contain maximum accelerations which exceed the threshold.
Figure 17. ECG Sensor Acceleration during Normal Activities
4.4.3 Discussion
Context awareness for ECG processing has only been briefly experimented with in this thesis
and is a topic that deserves its own dedicated thesis for full understanding. The context
awareness algorithm presented is not meant to be the most accurate and precise method of
handling motion artifacts. Further experimentation should be performed in an in-depth study.
Possible items to include are whether or not to use the magnitude of the acceleration, or if
different components of acceleration cause more motion artifacts than others.
Also, note that the results presented in the previous section show that the maximum
acceleration during jogging, tennis, and climbing stairs all exceed the acceleration threshold.
This does not mean that the heart attack detection algorithm cannot detect a heart attack while

43
the user is engaging in these activities. Instead, it means that individual heartbeats are discarded
only when the body acceleration at that instant in time when the beat occurred is so large that the
ECG is no longer accurate.
44
5.0 MULTILAYERED REAL-TIME ALERT AND TELEMEDICINE SYSTEM
Resting ECG machines provide the most powerful ECG processing and provide real-time alerts
and cardiac summary reports; however, these machines are not portable. On the other hand,
portable Holter monitors only record the ECG signal and lack any real-time feedback. As
previously mentioned, existing intermediate solutions exist that use smartphones to record the
ECG signal and transmit the data via a telemedicine service to more powerful computers for
processing [8-10]. While this is a step above the Holter monitors, the user does not get the
benefit of real-time alerts, summary reports, or assistive diagnoses. However, with the proposed
and implemented heart attack detection algorithm, it is possible to perform real-time beat
analysis and provide assistive diagnosis. After an assistive diagnosis is made, the optimum alerts
and telemedicine functionalities are needed to provide real-time feedback, which will be
described in this chapter.
5.1 PROPOSED ALERT AND TELEMEDICINE WARNING SYSTEM
A system of multilayered levels of alerts and telemedicine functions will be implemented when
an ST episode occurs that is capable of alerting the user, a designated point of contact (POC),
and upload the abnormal ECG data using a telemedicine service. Having a multilayer system of
45
alerts provides redundancy and therefore, added assurance that should a heart attack occur the
system will be able to notify either the user or a POC.
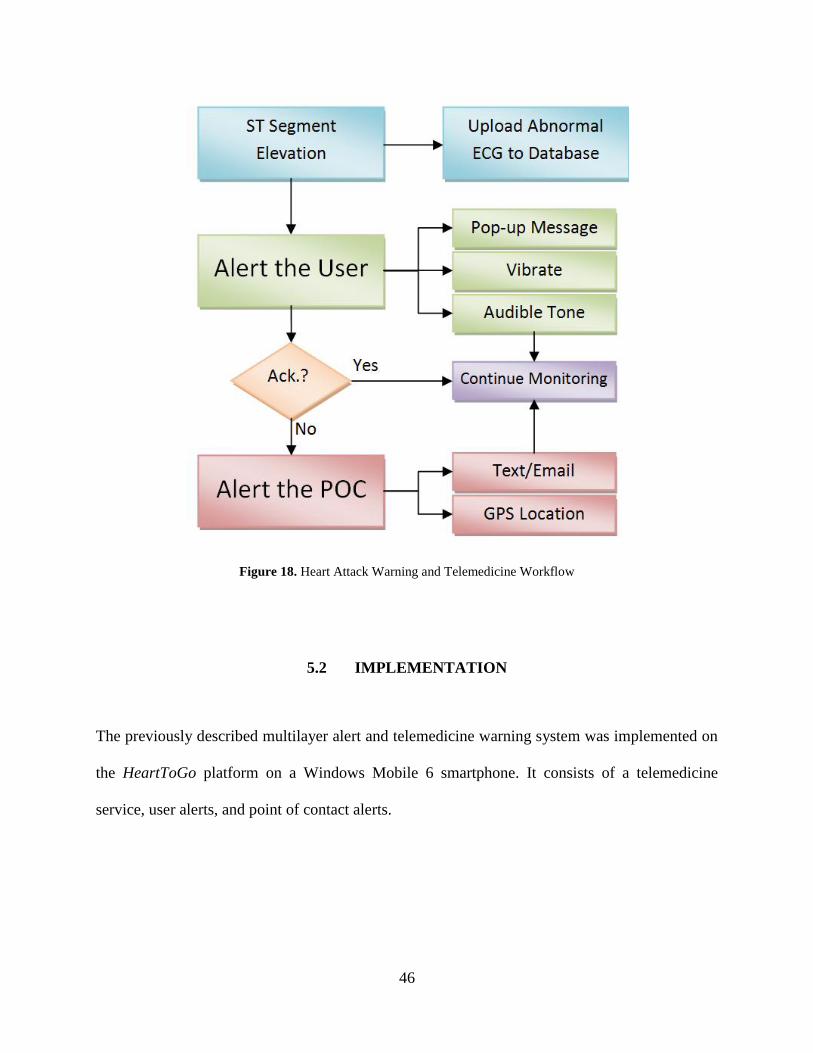
The flow of events for the warning system is given in Figure 18. In the event of ST
segment elevation the ECG signal will be recorded and uploaded to a telemedicine service. Not
only does this allow the user’s doctor the ability to view the ECG in real time, but documents ST
elevation episodes, which would otherwise go unreported. Having a history of cardiac events
could be useful in assessing overall cardiac health. While ECG is streaming to the database, the
user is simultaneously alerted via the native smartphone capabilities (i.e. audible, vibratory and
pop-up alerts). Given the urgency of heart attack, this alert may not be sufficient. Therefore, if
the user does not acknowledge the alert for whatever reason (e.g. incapacitated), a second level
of alerts will be dispatched. A pre-arranged POC will be notified via text message or email that
the user could be experiencing a heart attack and is not responding to the alert. This message will
be supplemented by providing the GPS location of the user in the event they cannot be reached
by the POC. While 911could be notified, it is believed that having an assigned POC is a more
practical solution for an assistive device due to liability concerns.
46
Figure 18. Heart Attack Warning and Telemedicine Workflow
5.2 IMPLEMENTATION
The previously described multilayer alert and telemedicine warning system was implemented on
the HeartToGo platform on a Windows Mobile 6 smartphone. It consists of a telemedicine
service, user alerts, and point of contact alerts.
47
5.2.1 Telemedicine service
Smartphones, whose primary role is communication, have the intrinsic ability to share data.
When ST episodes occur they need to be: 1) documented for medical history and 2) the abnormal
ECG needs to be recorded for review by a cardiologist for a definitive diagnosis. To implement
this telemedicine function, email was used as a proof of concept. Modern smartphones can send
and receive emails over their connection to wireless providers or through Wi-Fi, thus making
them capable of sending and receiving anytime they are in range of cell tower or wireless router.
A buffer is used to accumulate ECG data in five-minute intervals and is then sent to a predefined
email address. In the future, a more elaborate telemedicine system could be implemented that
interfaces with existing hospital protocols, but currently is beyond the scope of the proof of
concept prototype presented in this research.
5.2.2 User alerts
As shown in Figure 18, the first level of alerts is the user alert. The smartphone is an ideal
platform to implement such an alert because they are designed to notify their users of events. The
smartphone implementation takes full advantage of all of the native smartphone alert features.
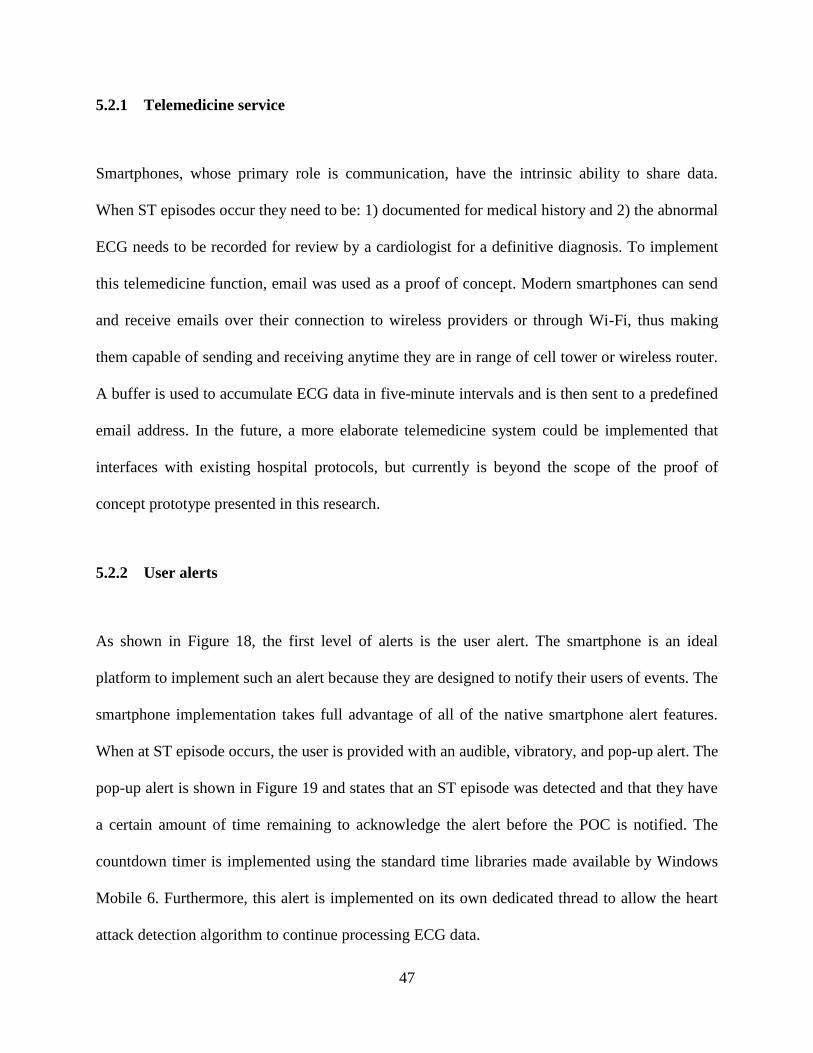
When at ST episode occurs, the user is provided with an audible, vibratory, and pop-up alert. The
pop-up alert is shown in Figure 19 and states that an ST episode was detected and that they have
a certain amount of time remaining to acknowledge the alert before the POC is notified. The
countdown timer is implemented using the standard time libraries made available by Windows
Mobile 6. Furthermore, this alert is implemented on its own dedicated thread to allow the heart
attack detection algorithm to continue processing ECG data.
48
Figure 19. Heart Attack Warning for the User
5.2.3 Point of contact alerts
In the event that the user does not acknowledge their ST episode alert, for whatever reason (e.g.
incapacitated, sleeping), the POC will receive an alert. This alert is predefined to be sent by
email or by text message to either an email address or to another smartphone as a text message.
The advantage of providing the ability to send messages via email or text is that a PDA, which
the application is capable of running on, may not have a cellular network connection, but only be
able to communicate using Wi-Fi, i.e. email. In this situation, despite being able to only send
warnings through email, they could still be received as a text message by taking advantage of
cellular service providers’ features of being able to email a text message. For example, sending
an email to [email protected] would be translated from a text message to an email by
ATT’s server and arrive as a text message on 814-555-1234. Of course, it is more
49
straightforward when using smartphones instead of PDAs, since smartphones have a cellular
network connection and can send normal text messages.
In addition to sending a text-based alert to the POC, the user’s GPS coordinates are
included with the message in the event the POC needs to know their location. Windows Mobile 6
provides an intermediate layer between the GPS hardware and the application layer to make use
of the GPS. To obtain the GPS coordinates the following steps were taken:
1. Enable GPS
2. Poll until a GPS location could be determined from the satellites
3. Disable GPS
Obtaining GPS coordinates is not an instant process. On the smartphone it took at least fifteen
seconds for the phone to obtain a GPS position. This time can be increased if satellite view is
obstructed. Therefore, this process runs on a separate thread so it does not tie up the ECG
monitoring thread. Furthermore, in the case of a battery-powered device, it is critical to disable
the GPS at the end of the sequence, as using GPS is power-hungry.
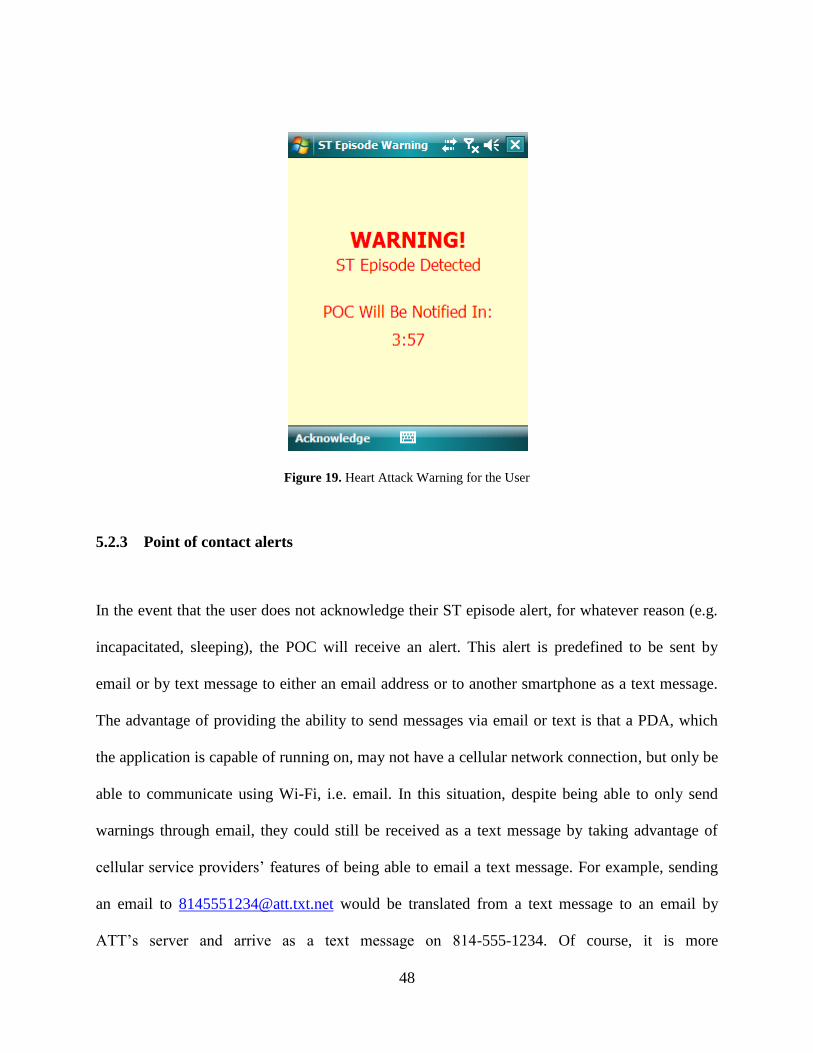
Figure 20 shows a sample email warning sent to a POC. Note that the email includes the
telephone number that the user can be reached at as well as their GPS location. The GPS location
is formatted for use with Google Maps for this prototype. This makes it easy to view the user’s
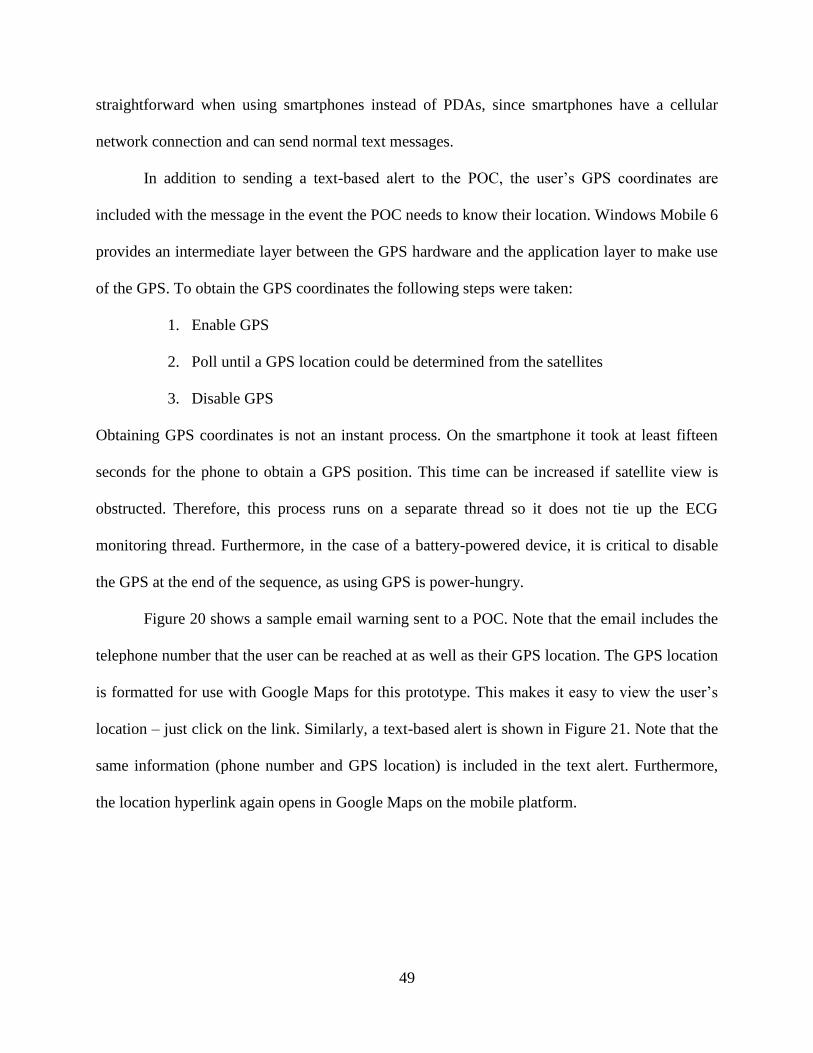
location – just click on the link. Similarly, a text-based alert is shown in Figure 21. Note that the
same information (phone number and GPS location) is included in the text alert. Furthermore,
the location hyperlink again opens in Google Maps on the mobile platform.
50
Figure 20. Emailed Heart Attack Warning to the POC
Figure 21. Text Message Heart Attack Warning to the POC
51
6.0 STREAMING DATABASE VERIFICATION & WORKLOAD ANALYSIS
Product development is not complete when the implementation is finished. Only after a series of
exhaustive tests should a product be deemed ready for use. This is especially true with medical
devices, whose failure can result in loss of life. This chapter will describe the careful attention
given to the challenge of testing the heart attack detection algorithm and warning system.
6.1 MOTIVATION
For a successful accurate, real-time ECG monitoring system the processing deadlines must be
met and the algorithms must function correctly. The popular offline analysis methods run on PCs
for ECG processing have no real-time deadlines and occupy only a small memory footprint on
PCs. With respect to PCs, while smartphones have processing power making them capable of
running demanding applications such as video and voice, their processors are much slower and
their memory is smaller and slower than PCs. Therefore, for smartphones, like for any embedded
platform, testing must be performed to verify that real-time deadlines are met. Furthermore, with
a smartphone that is capable of running multiple time-shared applications at a time, it is critical
to understand the effect of multitasking while performing ECG analysis on the fly.
Furthermore, while algorithms can be verified offline, the system as a whole needs to be
verified. Validating a system designed to detect heart attacks is problematic because a test
52
subject experiencing a heart attack would need to be used – this is not practical. However,
expertly annotated databases, such as the European ST database [24] from Physionet [25],
contain ST episodes that if streamed to the phone could simulate a person having a heart attack.
Therefore, it is necessary to provide a framework for extracting the data from the annotated
database and using it to verify the heart attack detection and warning system in real time.
6.2 IMPLEMENTATION
Aside from testing with patients experiencing a heart attack – which is clearly not practical – the
second best approach to testing this system is to use an expertly annotated database. This
research proposes the novel idea of using a host PC to parse the database into the same format
that the heart monitor uses to transmit data to the phone for real-time testing. This method has
two advantages: 1) real data is used and 2) the use of the streaming database is transparent to the
smartphone.
To accomplish this task, MATLAB is used as the framework for streaming the database.
As previously mentioned, the heart monitor communicates with the phone via Bluetooth. On a
PC, writing to a Bluetooth device is exactly like writing to a serial port, i.e. when writing to
Bluetooth a virtual communications port is being used. MATLAB has built-in functions for
writing to serial ports, which helped speed up the process of creating the serial port object.
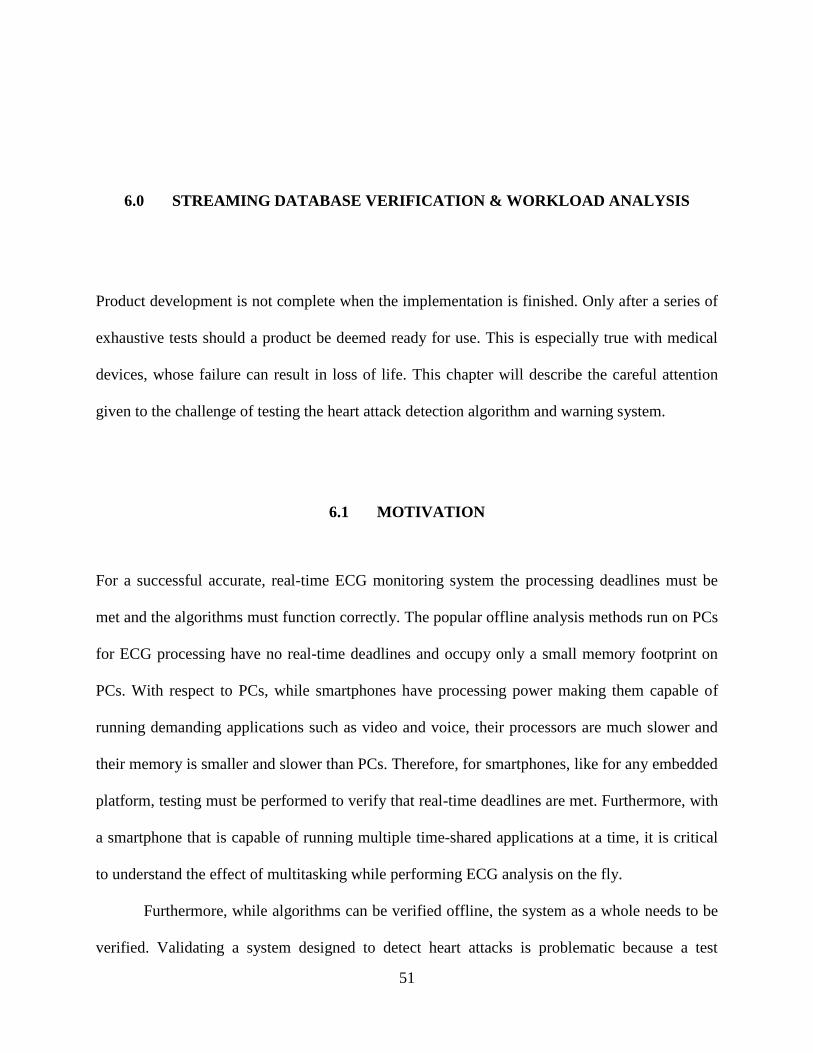
The workflow for the streaming database is shown in Figure 22. First, the host PC and
smartphone are paired – this is handled by Windows Mobile 6. Next, MATLAB opens the virtual
serial port and creates the Bluetooth socket. Samples from the database are then parsed, framed,
and sent out as a packet. Next, there is a delay by the sampling period so the ECG is sent at the
53
proper real-time sampling rate. This process of streaming data continues until the end of file
(EOF).
Figure 22. Database Testing Workflow
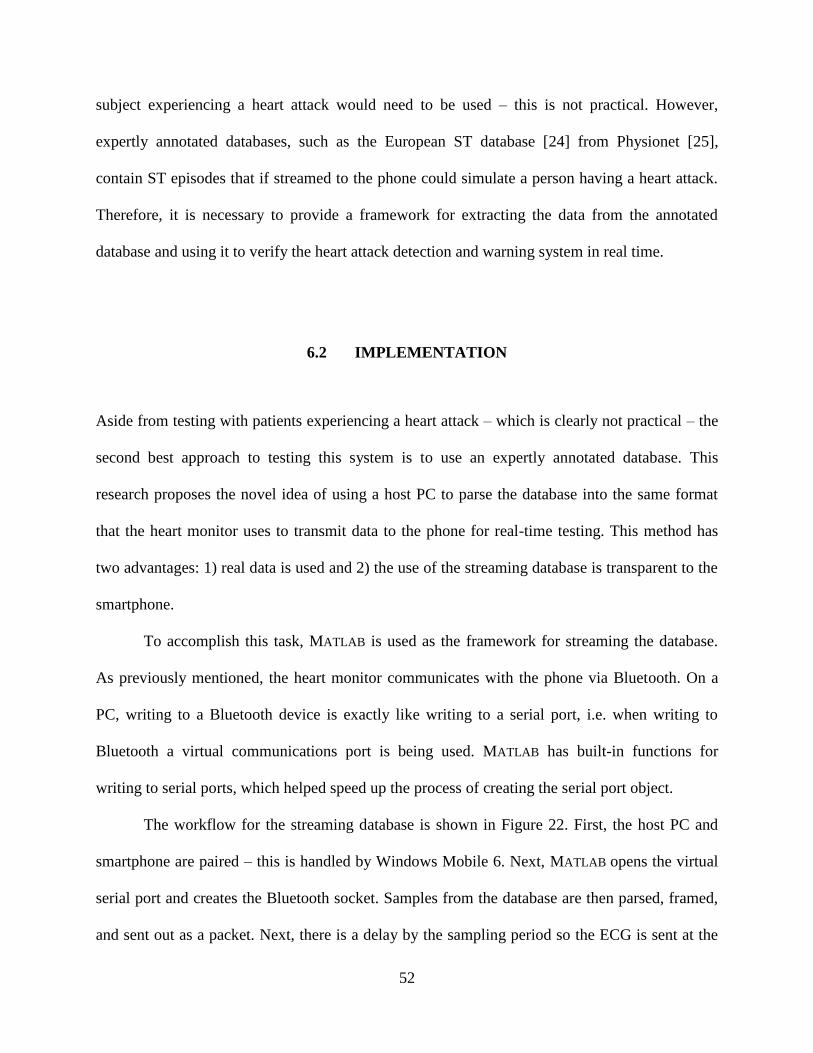
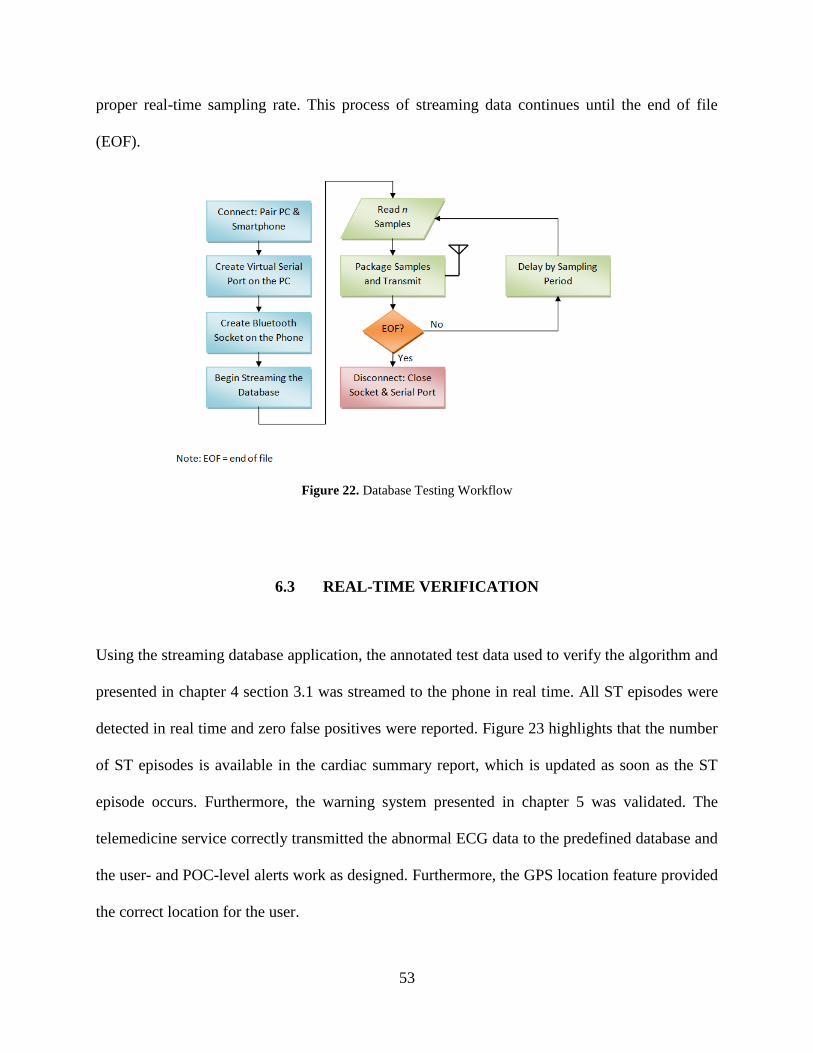
6.3 REAL-TIME VERIFICATION
Using the streaming database application, the annotated test data used to verify the algorithm and
presented in chapter 4 section 3.1 was streamed to the phone in real time. All ST episodes were
detected in real time and zero false positives were reported. Figure 23 highlights that the number
of ST episodes is available in the cardiac summary report, which is updated as soon as the ST
episode occurs. Furthermore, the warning system presented in chapter 5 was validated. The
telemedicine service correctly transmitted the abnormal ECG data to the predefined database and
the user- and POC-level alerts work as designed. Furthermore, the GPS location feature provided
the correct location for the user.
54
Figure 23. Statistics for Detected ST Episodes
6.4 WORKLOAD ANALYSIS
For medical applications, proper functionality is critical. Under ideal conditions, the heart attack
detection algorithm has proven to run without error. However, it is important to consider the
effects of testing in a real phone environment. To simulate this environment, normal phone tasks
will be performed while the heart attack detection algorithm is running in the background. As the
number of applications being multitasked is increased, the real-time deadlines of the heart attack
detection algorithm will be strained.
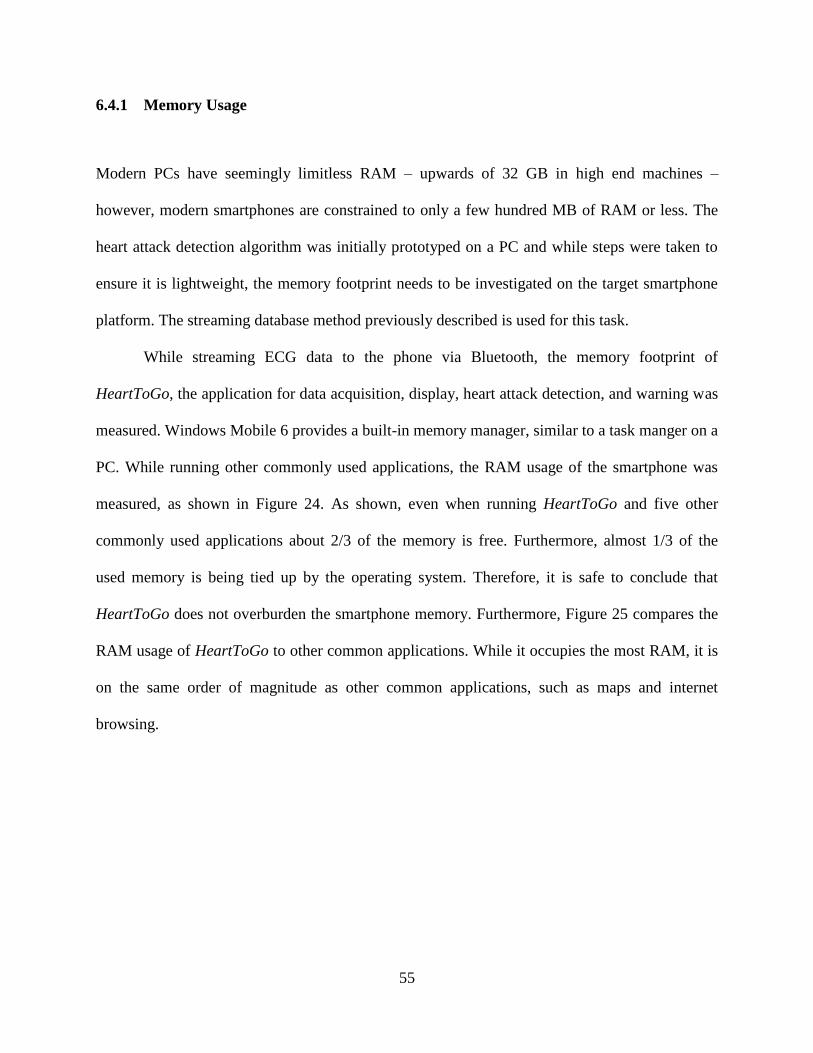
55
6.4.1 Memory Usage
Modern PCs have seemingly limitless RAM – upwards of 32 GB in high end machines –
however, modern smartphones are constrained to only a few hundred MB of RAM or less. The
heart attack detection algorithm was initially prototyped on a PC and while steps were taken to
ensure it is lightweight, the memory footprint needs to be investigated on the target smartphone
platform. The streaming database method previously described is used for this task.
While streaming ECG data to the phone via Bluetooth, the memory footprint of
HeartToGo, the application for data acquisition, display, heart attack detection, and warning was
measured. Windows Mobile 6 provides a built-in memory manager, similar to a task manger on a
PC. While running other commonly used applications, the RAM usage of the smartphone was
measured, as shown in Figure 24. As shown, even when running HeartToGo and five other
commonly used applications about 2/3 of the memory is free. Furthermore, almost 1/3 of the
used memory is being tied up by the operating system. Therefore, it is safe to conclude that
HeartToGo does not overburden the smartphone memory. Furthermore, Figure 25 compares the
RAM usage of HeartToGo to other common applications. While it occupies the most RAM, it is
on the same order of magnitude as other common applications, such as maps and internet
browsing.
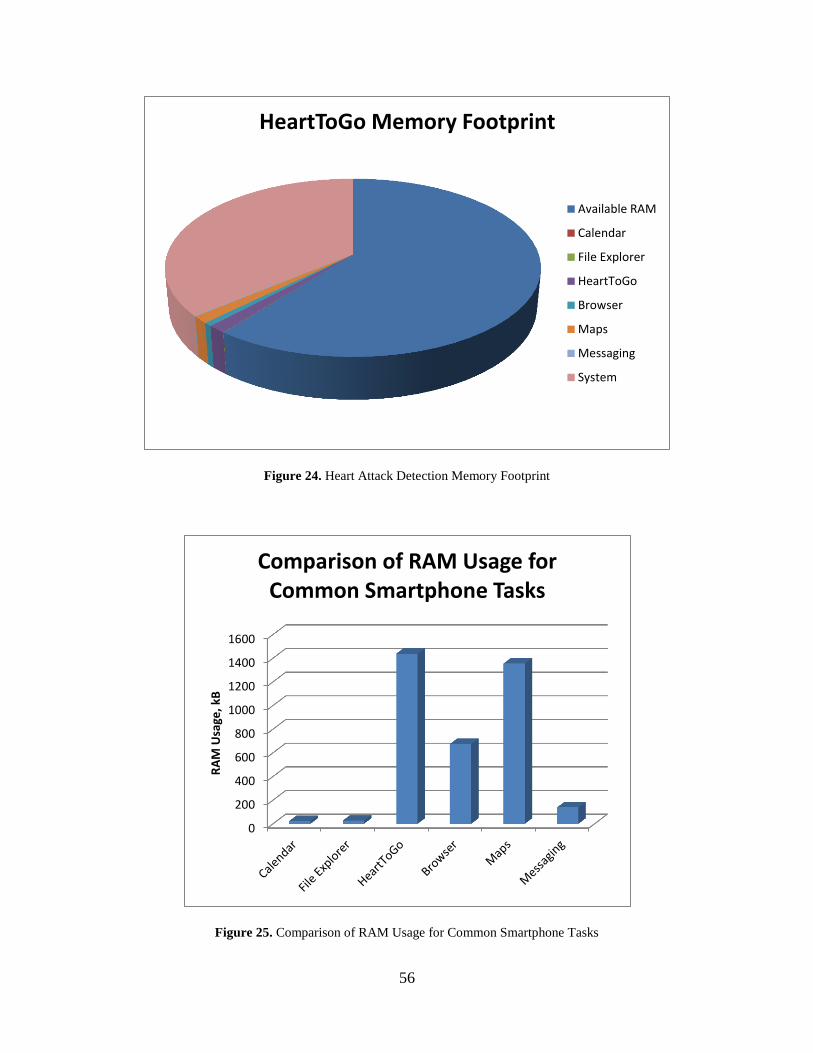
56
Figure 24. Heart Attack Detection Memory Footprint
Figure 25. Comparison of RAM Usage for Common Smartphone Tasks
HeartToGo Memory Footprint
Available RAM
Calendar
File Explorer
HeartToGo
Browser
Maps
Messaging
System
0
200
400
600
800
1000
1200
1400
1600
RA
M U
sage
, kB
Comparison of RAM Usage for Common Smartphone Tasks
57
7.0 CONCLUSION
7.1 THESIS SUMMARY AND CONCLUDING STATEMENTS
In this thesis, heart attack detection by smartphone ECG processing was realized, thus uniting the
portability of Holter monitors with the real-time processing of resting ECG machines. By
proposing and implementing an accurate, real-time, context-aware heart attack detection
algorithm, a high classification accuracy of 96% was achieved. Furthermore, all ST episodes
were detected by the algorithm and zero false positives were reported during testing with
expertly annotated data.
Traditional smartphone alerts such as pop-ups, audible tones, and vibrations were used to
provide real-time heart attack detection feedback. In addition, a more complicated layer of alerts
was added in case the user is incapacitated, or otherwise incapable of acknowledging the alerts.
A text message or email is sent to a designated POC, alerting them that the user is experiencing
heart attack warning signs and is not acknowledging the warning. Furthermore, the precise GPS
location of the user is sent to the POC, along with their telephone number in the case that they
need immediate aid.
Finally, the lack of being able to test the system with a heart attack from the user was
overcome by using an expertly annotated database that was streamed to the phone in real time in
place of wearing the ECG sensor. This process has the advantage of not only being transparent to
58
the heart attack processing algorithms, but also allows the software to run exactly as it would
with the sensor for workload testing.
While it is acknowledged that the prototype presented is not a replacement for the Holter
monitor or the resting ECG, it does serve as a powerful assistive diagnosis tool. Furthermore, it
provides another source of feedback for monitoring the heart. With this system, not only does the
user need to rely on symptoms such as chest pain, which may or may not occur prior to a heart
attack, but additionally, the user’s heart is continuously being monitored for an abnormal ECG.
As smartphones continue to become faster, more ECG processing features can be added to this
proof-of-concept framework to provide a complete heart monitoring system-- capable of saving
lives.
7.2 FUTURE WORK
The smartphone prototype described in this thesis is capable of providing assistive diagnosis for
heart attack via smartphone ECG processing. However, as previously stated, not all heart attacks
are detectable. Advancement in the wearable ECG sensor could incorporate more leads to
provide a better view of the heart from different directions, thus allowing for additional heart
attacks to be detected. Furthermore, additional leads would help to eliminate false positives and
provide a more sound predictive diagnosis, due to the redundancy. Additionally, multiple leads
would allow for the incorporation of reciprocal ST segment depression detection, to aid in heart
attack detection.
With the advent of multi-core processors in PCs, it is only a matter of time before they
make their way into the smartphone market. The most challenging aspect of multi-core
59
processors is to utilize them efficiently. This requires software that takes advantage of the multi-
core architecture. Therefore, parallelizations should be performed on the ECG processing code to
take advantage of concurrency. These optimizations would aid in the future performance of the
program on multi-core phones. Improving performance is important because it helps to meet the
critical real-time processing deadlines and allows for additional functionality, e.g. multiple leads
and the detection of additional CVDs.
Finally, a framework was developed for testing the heart attack detection algorithm in
real time while running on the phone. While expertly annotated data were located, which is hard
to come by, and used for validation, the use of additional test data from a wide variety of patients
with different conditions is recommended, under the supervision of experienced cardiologists.
Also, a database containing accelerometer data is desirable to aid in determining what threshold
(or other method) should be used when adding context awareness.
60
BIBLIOGRAPHY
[1] D. Lloyd-Jones, et al., “Heart disease and stroke statistics 2009 update. A report from the
American Heart Association statistics committee and stroke statistics subcommittee,”
Circulation, vol. 119, no. 3, pp. e21-e181, Jan. 2009.
[2] Wall Street Journal, “For Men at 40, Risk of Cardiac Death 1 in 8,”
http://online.wsj.com/article/SB125833149978449651.html
[3] M. Gertsch, The ECG Manual. London: Springer-Verlag, 2009.
[4] M. Khan, Rapid ECG Interpretation, Totowa, NJ: Humana Press Inc., 2008.
[5] B. Surawicz and T. Knilans, Chou’s Electrocardiography in Clinical Practice. Philadelphia:
Saunders Elsevier, 2008.
[6] S. Chugh, Textbook of Clinical Electrocardiography, Tunbridge Wells, UK: Anshan Ltd.,
2006.
[7] J. Oresko, Z. Jin, J. Cheng, S. Huang, Y. Sun, S. Duschl, and A. Cheng, “A Wearable
Smartphone-based Platform for Real-Time Cardiovascular Disease Detection via
Electrocardiogram Processing,” IEEE Trans. on Information Technology in Biomedicine,
vol. 14, no. 3, pp. 734-740, May 2010.
[8] J. M. Cano-García, E. González-Parada, V. Alarcón-Collantes, and E. Casilari-Pérez, “A
PDA-based portable wireless ECG monitor for medical personal area networks,” in Proc.
IEEE MELECON, Benalmádena, Spain, 2006, pp. 713-716.
61
[9] W. Chung, C. Yau, K. Shin, and R. Myllyla, “A cell phone based health monitoring system
with self analysis processor using wireless sensor network technology,” in Proc. 29th
IEEE EMBC, Lyon, France, 2007, pp. 3705-3708.
[10] T. Lee, J. Hong, and M. Cho, “Biomedical digital assistant for ubiquitous healthcare,” in
Proc. 29th IEEE EMBC, Lyon, France, 2007, pp. 1790-1793.
[11] X. Chen, C. T. Ho, E. T. Lim, and T. Z. Kyaw, “Cellular phone based online ECG
processing for ambulatory and continuous detection,” Computers in Cardiology, vol. 34,
pp. 653-656, Sept. 2007.
[12] K. Goh, J. Lavanya, Y. Kim, E. K. Tan, and C. B. Soh, “A PDA-based ECG beat
detection for home cardiac care,” in Proc. 27th IEEE EMBC, Shanghai, 2005, pp. 375-
378.
[13] J. Rodríguez, A. Goni, and A. Illarramendi, “Real-time classification of ECGs on a
PDA,” IEEE Trans. Info. Tech. in Biomed., vol. 9, no. 1, pp. 23-34, Mar. 2005.
[14] Z. Jin, Y. Sun, and A. Cheng, “Predicting Cardiovascular Disease from Real-Time
Electrocardiographic Monitoring: An Adaptive Machine Learning Approach on a Cell
Phone,” in Proc. 31st IEEE EMBC, Minneapolis, MN, 2009, pp. 6889–6892.
[15] Philips Medical Systems, “ST/AR: ST segment and arrhythmia monitoring,” Clinical
Measurements Datasheet, April, 2004.
[16] X. Li, et al., “ST-T complex automatic analysis of the electrocardiogram signal based on
wavelet transform,” in Proc. 29th IEEE Bioengineering, 2003, pp. 144-145.
[17] C. Papaloukas, D. I. Fotiadis, A. Likas, A. P. Liavas, and L.K. Michalis, “A knowledge-
based technique for automated detection of ischemic episodes in long duration
electrocardiograms,” Med. Biol. Eng. Comput., vol. 39, pp. 105–112, 2001.
[18] T. Stamkopoulos, et. al., “ECG analysis using nonlinear PCA neural networks for
ischemia detection,” IEEE Trans. on Signal Processing, vol. 46, no. 11, pp. 3058-3067,
Nov. 1998.
62
[19] F. Badilini, et al., “Beat-to-beat quantification and analysis of ST displacement from
Holter ECGs: a new approach to ischemia detection,” in Proc. Computers in Cardiology,
Durham, NC, 1992, pp. 179-182.
[20] Fischell, et al., “System for the detection of cardiac events,” United States Patent, US
669023B1, Aug. 19, 2003.
[21] G. Jeong and K. Yu, “Morphological classification of ST segment using reference STs
set,” in Proc. 29th IEEE EMBS, Lyon, France, 2007, pp. 636-639.
[22] C. Papaloukas, et al., “A robust knowledge-based technique for ischemia detection in
noisy ECGs,” in Proc. Knowledge-Based Intelligent Engineering Systemsand Allied
Technologies, Brighton, 2000, pp. 768-771.
[23] M. Raya, et al., “Adaptive noise cancelling of motion artifact in stress ECG signals using
accelerometer,” in Proc. 2nd Joint EMBS/BMES, Houston, 2002, pp. 1756-1757.
[24] A. Taddei, et al., “The European ST-T database: development, distribution, and use,”
Computers in Cardiology, pp. 177-180, 1990.
[25] A. L. Goldberger, et al., “PhysioBank, PhysioToolkit, and PhysioNet: components of a
new research resource for complex physiologic signals,” Circulation, vol. 101, no. 23,
pp. e215-e220, June 2000.
[26] P. Hamilton, “Open source ECG analysis,” Computers in Cardiology, vol. 29, no. 1, pp.
101–104, Sept. 2002.
[27] J. Pan and W. Tompkins, “A real-time QRS detection algorithm,” IEEE Trans. Biomed.
Eng., vol. BME-32, no. 3, pp. 230-236, Mar. 1985.
[28] P. S. Hamilton and W. J. Tompkins, “Quantitative investigation of QRS detection rules
using the MIT/BIH arrhythmia database,” IEEE Trans. Biomed Eng., vol. BME-33, no.
12, pp. 1157-1165, Dec. 1986.
63
[29] R. Duda, P. Hart, and D. Stork, Pattern Classification, John Wiley & Sons, Inc.: New
York, 2001.
[30] Y. Goletsis, C. Papaloukas, D. I. Fotiadis, A. Likas, and L. K. Michalis, “Automated
ischemic beat classification using genetic algorithms and multicriteria decision analysis,”
IEEE Trans.Biomed. Eng., vol. 51, no. 10, pp. 1717–1725, Oct. 2004.
[31] C. Papaloukas, D. I. Fotiadis, A. Likas, and L. K. Michalis, “An ischemia detection
method based on artificial neural networks,” Artif. Intell. Med., vol. 24, no. 2, pp. 167–
178, 2002.
[32] R. V. Andreao, S. M. T. Muller, J. Boudy, B. Dorizzi, T. F. Bastos Filho, and M.
Sarcinelli Filho, “Incremental HMM training applied to ECG signal analysis,” Comput.
Biol. Med., vol. 38, pp. 659–667, 2008.
[33] F. Jager, G. B. Moody, and R.G. Mark, “Detection of transient ST segment episodes
during ambulatory ECG monitoring,” Comput. Biomed. Res., vol. 31, no. 5, pp. 305–322,
1998.
[34] N. Maglaveras, T. Stamkopoulos, C. Pappas, and M. G. Strintzis, “An adaptive
backpropagation neural network for real-time ischemia episodes detection: Development
and performance analysis using the European ST–T database,” IEEE Trans. Biomed.
Eng., vol. 45, no. 7, pp. 805–813, Jul. 1998.


![Wireless Based System for the Continuous ...ali.mansour.free.fr/PDF/ICBSAT2017.pdfECG system [4]. To monitor the physiological variables of a patient's EGG outside of hospital environments,](https://img.pdfslide.net/doc/110x75/5f5e68629bbc982e3203eec3/wireless-based-system-for-the-continuous-ali-ecg-system-4-to-monitor-the.jpg)