Embed Size (px)
Citation preview
Portagallo 1
Table of Contents:
Abstract 4
Introduction 5
Capillary Electrophoresis 5
Chemiluminescence Detection 10
Electrophoretically Mediated Microanalysis 11
Materials and Methods 19
Results and Discussion 24
Validation of the instrument: luminol injections 24
Glucose Oxidase Injections 27
Conclusion and Future Work 37
References 38
Vita 41
Portagallo 2
List of Figures:
Figure 1: Capillary electrophoresis system set-up using an on-column detector 5
Figure 2: EOF diagram in the capillary showing the charged double layer from the
cations in the buffer 6
Figure 3: Different types of flow profiles that can occur in a capillary, with responses 8
Figure 4: Chemiluminescence reaction of hydrogen peroxide and luminol 10
Figure 5: Enzyme-Substrate complex binding - Lock and key model (A) and the induced
fit model (B) 12
Figure 6: Example of Michaelis-Menten plot (A) and Lineweaver-Burk plot (B) 13
Figure 7: Zone of enzyme in the capillary using EMMA 14
Figure 8: Example of expected EMMA plateau (A), EMMA plateau where excess
product is detected first (B), and EMMA plateau where excess product is detected
at the end (C) 15
Figure 9: Catalyzed oxidation reaction of β-D-glucose 16
Figure 10: Enzyme inhibition reaction 17
Figure 11: Lineweaver-Burk plots of competitive inhibition (A), noncompetitive
inhibition (B), and uncompetitive inhibition (C) 18
Figure 12. Structure of competitive inhibitor (A) and substrate (B) 18
Figure 13: Diagram of the CE-CL system (A) and custom CE system with post-column
CL detection (B) 20
Figure 14: Photon counter program used on LabVIEW and EMMA Plateau 21
Figure 15. Normalization of triplicate trials using 1.00 x 10⁻⁵ M (A) and 2.50 x 10⁻⁶ M (B) 25
Figure 16. Normalization of various luminol concentrations used 26

Portagallo 3
Figure 17: Normalization of various luminol concentrations used (A) and calibration
curve (B) 27
Figure 18: Previous results of EMMA plateaus using various glucose oxidase
concentrations (A) and the calibration curve (B) 29
Figure 19: Previous results of a Michaelis-Menten plot of glucose oxidase 30
Figure 20: Previous results of a Lineweaver-Burk plot of glucose oxidase 30
Figure 21. Normalization of replicate trials using 25 U glucose oxidase (A) and 50 U
glucose oxidase (B) 31
Figure 22: Normalization of EMMA plateaus using various concentrations of glucose
oxidase (A) and calibration curve (B) 32
Figure 23. Michaelis-Menten plot of glucose oxidase 33
Figure 24. Lineweaver- Burk plot of glucose oxidase 33
Figure 25. Normalization of luminol injections using 1.00 x 10⁻⁵ M (before changing
the cathode) 35
Figure 26: Normalization of EMMA plateaus using 100U of glucose oxidase 35
Figure 27: Normalization of EMMA plateaus using 100U of glucose oxidase (A) and
75 U glucose oxidase (B) (after changing the cathode) 36
List of Equations:
Equation 1: Velocity of an ion 6
Equation 2: Electrophoretic mobility of an ion 6
Equation 3: Enzyme kinetics 11
Equation 4: Michaelis-Menten equation 12
Equation 5: Lineweaver-Burk plot equation 13
Portagallo 4
Abstract:
A custom capillary electrophoresis system with post-column chemiluminescence
detection (CE-CL) was used with electrophoretically mediated microanalysis (EMMA) to
indirectly determine the enzyme kinetics of glucose oxidase. Validation of the instrument was
performed through injecting luminol hydrodynamically to measure the consistency of the results,
as well as learning how to use the CE-CL system. Based on the results obtained from the luminol
injections, there was strong linearity present, with an R2 value of 0.9925, as the concentration of
luminol increased. The glucose oxidase was introduced by electrokinetically injecting the
enzyme into the system to react with the substrate, β-D-glucose. The byproduct, hydrogen
peroxide, was produced on column and reacted with luminol in the outlet cell, in which the
production of light was detected by the photon counter. Based on the results obtained from the
glucose oxidase injections, there was a fairly strong linearity present, with an R2 value of 0.976.
As the concentration of glucose oxidase increased, the intensity of the plateaus also increased
because there was an increase in the formation of product. CE-CL has been proven to be an
effective technique to indirectly determine kinetic constants of enzymes that produce hydrogen
peroxide and to be later compared to literature values.
Portagallo 5
Introduction:
Capillary electrophoresis
Capillary electrophoresis is a separation technique that is becoming more commonly used
because of its speed, efficiency, high sensitivity, small sample volume, minimal waste, as well as
its various applications.1-4 Capillary electrophoresis does not have a stationary phase, and utilizes
a large electric field to carry the solution across the capillary and results in separation based on
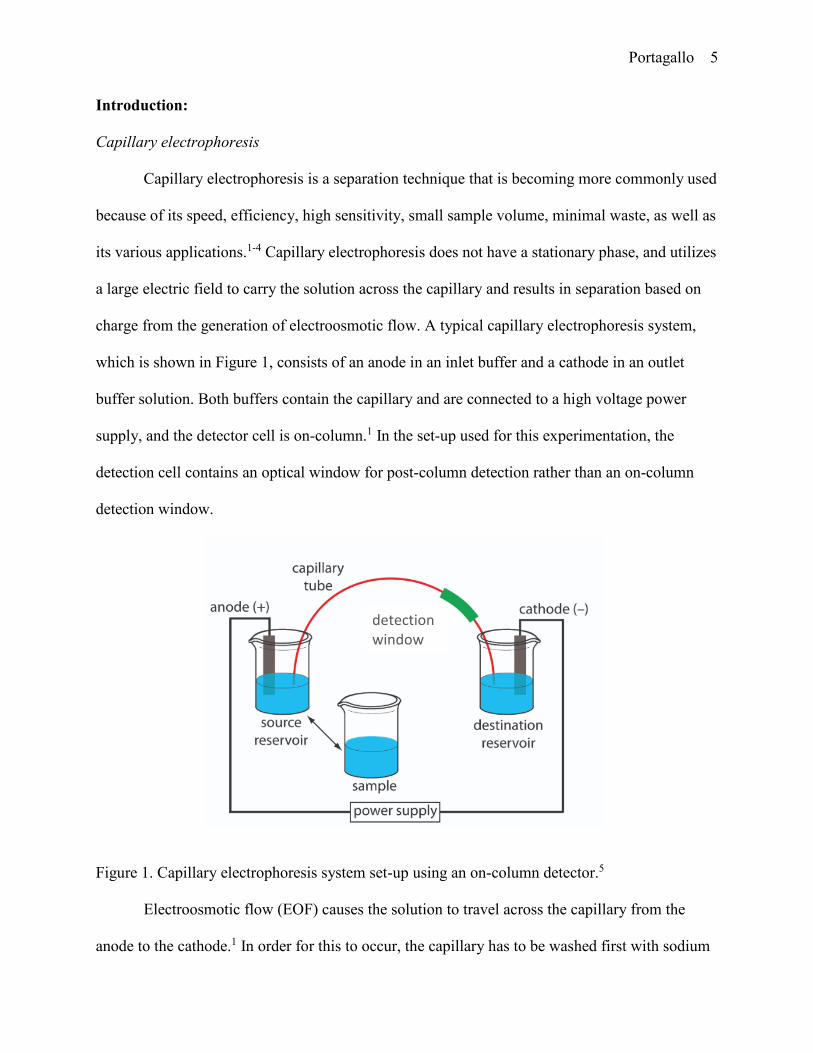
charge from the generation of electroosmotic flow. A typical capillary electrophoresis system,
which is shown in Figure 1, consists of an anode in an inlet buffer and a cathode in an outlet
buffer solution. Both buffers contain the capillary and are connected to a high voltage power
supply, and the detector cell is on-column.1 In the set-up used for this experimentation, the
detection cell contains an optical window for post-column detection rather than an on-column
detection window.
Figure 1. Capillary electrophoresis system set-up using an on-column detector.5
Electroosmotic flow (EOF) causes the solution to travel across the capillary from the
anode to the cathode.1 In order for this to occur, the capillary has to be washed first with sodium
detection window
Portagallo 6
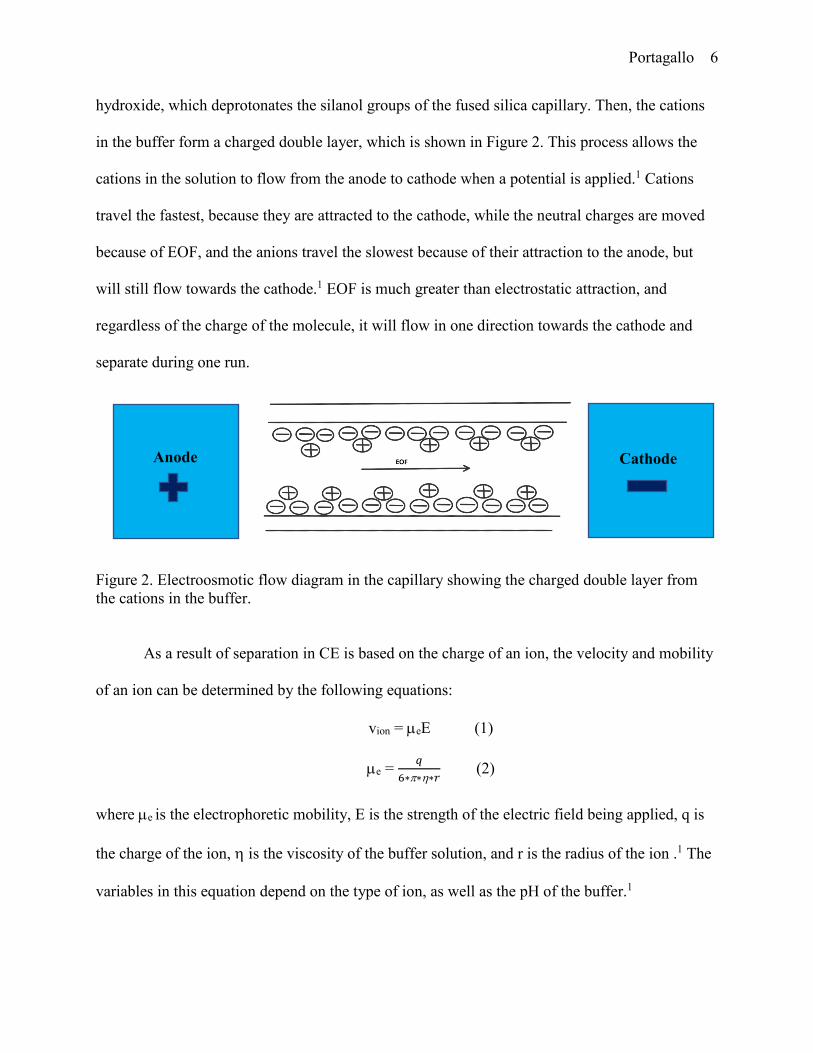
hydroxide, which deprotonates the silanol groups of the fused silica capillary. Then, the cations
in the buffer form a charged double layer, which is shown in Figure 2. This process allows the
cations in the solution to flow from the anode to cathode when a potential is applied.1 Cations
travel the fastest, because they are attracted to the cathode, while the neutral charges are moved
because of EOF, and the anions travel the slowest because of their attraction to the anode, but
will still flow towards the cathode.1 EOF is much greater than electrostatic attraction, and
regardless of the charge of the molecule, it will flow in one direction towards the cathode and
separate during one run.
Figure 2. Electroosmotic flow diagram in the capillary showing the charged double layer from the cations in the buffer.
As a result of separation in CE is based on the charge of an ion, the velocity and mobility
of an ion can be determined by the following equations:
vion = µeE (1)
µe = 𝑞𝑞6∗π∗η∗𝑟𝑟
(2)
where µe is the electrophoretic mobility, E is the strength of the electric field being applied, q is
the charge of the ion, η is the viscosity of the buffer solution, and r is the radius of the ion .1 The
variables in this equation depend on the type of ion, as well as the pH of the buffer.1
Anode
Cathode
Portagallo 7
There are two factors that affect EOF: the pH of the buffer used and suppression of
flow.1,6 The pH of the buffer has to be considered regarding EOF, because it can affect the
charge separation within the capillary.1 When the buffer has a high pH, the silanol groups stay
deprotonated and charged, allowing for the formation of a strong double layer. 1, 7 When the
buffer has a low pH, the silanol groups are protonated and are neutral, resulting in a weaker
double layer and weak EOF. 1, 6, 7
Suppression of flow also has an effect on the EOF, because if there is no current flow, the
solution is prevented from traveling to the cathode where the products can be detected. This
could be due to bubble formation or a blockage in the capillary. Bubble formation occurs when
the capillary is not fully submerged in the sample during injection, if the capillary is placed
above the electrode during injection, or if the sample in the capillary becomes dislodged when
placing back into the inlet buffer solution. Another cause for bubble formation is due to Joule
heating. Joule heating occurs when there is too much current flowing, due to increasing the
applied electric field or the ionic strength of the buffer.8 The temperature increases too much in
the center of the capillary, which can result in bubble formation or laminar flow.1 However,
Joule heating can be prevented by thermostatting the capillary to keep the temperature stable
when current is flowing. A blockage can occur if the capillary was not washed thoroughly. Both
bubble formation and a blockage in the capillary can be resolved by washing the capillary with
buffer.
An advantage of capillary electrophoresis is that the EOF causes the solution to flow
through the capillary with a flat flow profile, or plug flow, which is shown in Figure 3.1 Since
EOF is caused by an electric field and is able to occur because of the charged double layer
surrounding the capillary, and results in separation based on the charge of the ion. This will

Portagallo 8
allow the EOF to be uniform throughout the capillary and results in a flatter shape. The flat flow
profile increases the efficiency of separation, and there will be an increase in the number of
theoretical plates (N).1 In systems with laminar flow, the flow has a parabolic shape and will
have lower resolution, since it is caused by a frictional force along the walls of the stationary
phase and the solution.1, 3, 9, 10 Compared to laminar flow that occurs in high performance liquid
chromatography (HPLC) because of a high pressure pump, EOF can be more efficient for
separation and can have a greater resolution.1, 6, 7
Figure 3. Different types of flow profiles that can occur in a capillary, with the expected responses.1
Depending on the type of sample being injected into the CE system, there are three types
of sample injections that can be performed: hydrodynamic, electrokinetic, and pressure
injections.1, 3, 11 In hydrodynamic injections, the sample is placed at a higher elevation, and when
the capillary is placed in the sample for a few seconds, the height difference allows for the
sample to move into the capillary. For electrokinetic injections, both the capillary and the anode
are placed in the sample, and when a high voltage is applied for a few seconds, the sample is
introduced to the system, and then placed back into the anode reservoir.1 For pressure injections,
pressure is applied in the sample or a vacuum is applied in the cathode reservoir, so when the
capillary is placed in the sample, there is enough pressure to move the sample into the capillary.1
Time (s) Time (s)
Sign
al
Sign
al
EOF Flow
Portagallo 9
Capillary electrophoresis is often advantageous because of its high efficiency; however, a
limitation of this separation method is its detection limits.12, 13 Capillary electrophoresis is often
paired with optical detection, such as UV-Vis absorption, because it is nearly a universal
detector.1, 4 UV-Vis absorption does not have good detection limits because of problems with the
pathlengths.4, 14 This is due to the outer diameter of the capillary being approximately 360 µm,
thus making the path length much shorter than the typical one centimeter.1 Other types of optical
detectors paired with CE include laser induced fluorescence, fluorescence, and photodiode arrays
(PDAs).1,15 These other methods have better sensitivity than UV-Vis absorption, but due to the
fact they are all types of on-column detectors, they will also have higher detection limits because
of smaller path lengths.1, 4, 6, 15
Electrochemical detection can be used as an alternative detection method for CE, because
of its high sensitivity. These methods can be separated into three categories: potentiometric,
conductometric, and amperometric detections.16-18 Potentiometric detection are ion selective,
and are able to detect the ion of interest in small volumes of sample when a potential difference
is applied.17 Conductometric detection utilizes a potential difference between two electrodes in
an electrolytic sample.17 Amperometric detection is highly sensitive and selective, and transfers
electrons when a voltage is applied.1, 17 Electrochemical detection can be favored because of its
sensitivity and selectivity, but this type of detection also has its limitations.16 One of the main
limitations is that it can interfere with the applied voltage, causing fluctuations in the current
flowing across the capillary.16 These electrochemical methods are all post-column detectors,
making it problematic to be paired with capillary electrophoresis systems that utilize post-
column detection cells. With the cathode is in the outlet cell, and in close proximity to the
detector, the increased current leads to noise.16, 17 Another limitation of electrochemical detection
Portagallo 10
is that it is not a universal type of detection, and the outlet cell must be modified in order to use
the external equipment (i.e. electrodes).1, 13, 17
Chemiluminescence detection
Another type of detection that has been paired with capillary electrophoresis is
chemiluminescence (CL). Dadoo et al. used an end-column CE-CL system with several
chemiluminescent reagents due to CE’s higher separation efficiency and high sensitivity.19 Since
then, capillary electrophoresis has often been paired with chemiluminescence detection to
analyze metal ions, enzymes, proteins, as well as amino acids and peptides.2, 14, 20-23
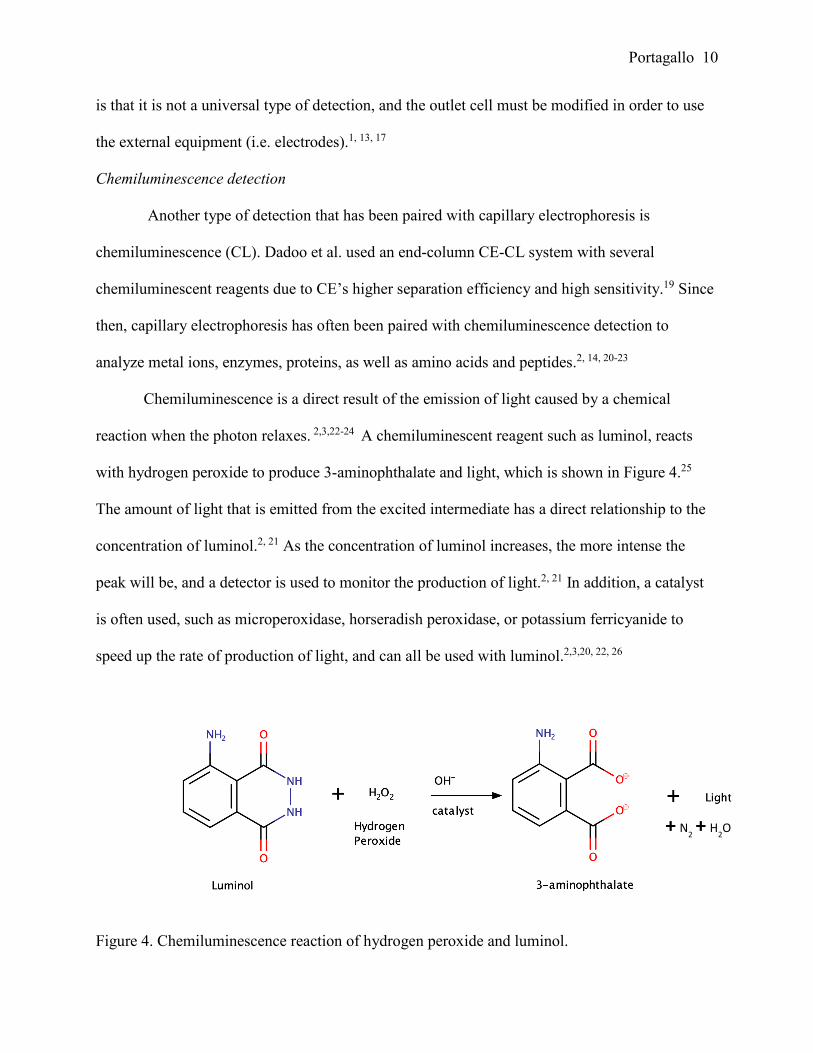
Chemiluminescence is a direct result of the emission of light caused by a chemical
reaction when the photon relaxes. 2,3,22-24 A chemiluminescent reagent such as luminol, reacts
with hydrogen peroxide to produce 3-aminophthalate and light, which is shown in Figure 4.25
The amount of light that is emitted from the excited intermediate has a direct relationship to the
concentration of luminol.2, 21 As the concentration of luminol increases, the more intense the
peak will be, and a detector is used to monitor the production of light.2, 21 In addition, a catalyst
is often used, such as microperoxidase, horseradish peroxidase, or potassium ferricyanide to
speed up the rate of production of light, and can all be used with luminol.2,3,20, 22, 26
Figure 4. Chemiluminescence reaction of hydrogen peroxide and luminol.
+ N2 + H2O

Portagallo 11
CE-CL has also been widely used, because chemiluminescence is a type of detection that
does not require an external light source.22, 24, 27 Due to chemiluminescence not requiring an
external light source, there will be reduced background noise, in addition to high sensitivity and
selectivity when paired with CE because it is usually performed in the dark.2, 15, 19, 22-24, 26, 27
However, a significant drawback to using CE-CL is that luminol is sensitive to pH.14, 24,
26, 28 If the pH of the buffer used is too high, the intensity of the peak increases. Conversely, if the
pH of the buffer is too low, the intensity of the peak will decrease.28 This is due to the conditions
for luminol to be oxidized when reacting with hydrogen peroxide to produce light, and
depending on the pH, there will either be an increase or decrease in amount of light produced. A
possible reason to alter this condition is because another reagent (such as an enzyme) being used
in the reaction requires a different pH to react for optimal activity. Another drawback to using
CE-CL is that there is a limitation on the reagents that can be used with luminol. This limits the
type of enzyme or chemical used because luminol has to react with hydrogen peroxide in order
for chemiluminescence to occur. For this project in particular, it was limited to only enzymatic
reactions that produce hydrogen peroxide. Glucose oxidase, the model enzyme, produced
hydrogen peroxide as a byproduct, which resulted in the reaction with luminol in the outlet cell
and produced light.
Electrophoretically mediated microanalysis
Enzyme kinetics have been used to determine the rate of the enzymatic reaction, and a
generic enzyme reaction is shown in the equation below:
E + S ⇌ ES E + P (3) .29
Equation 3 shows that when an enzyme and substrate react, the substrate binds to the enzyme’s
active site, creating the enzyme-substrate complex (ES), and product is formed after the substrate
Portagallo 12
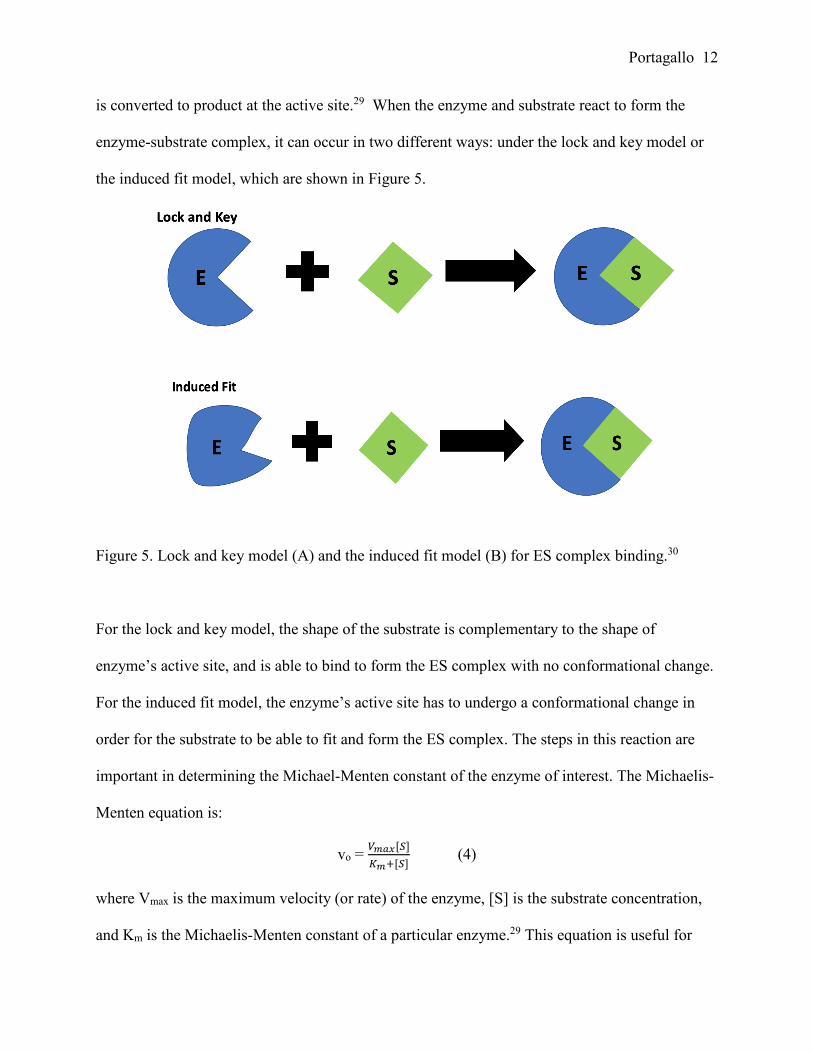
is converted to product at the active site.29 When the enzyme and substrate react to form the
enzyme-substrate complex, it can occur in two different ways: under the lock and key model or
the induced fit model, which are shown in Figure 5.
Figure 5. Lock and key model (A) and the induced fit model (B) for ES complex binding.30 For the lock and key model, the shape of the substrate is complementary to the shape of
enzyme’s active site, and is able to bind to form the ES complex with no conformational change.
For the induced fit model, the enzyme’s active site has to undergo a conformational change in
order for the substrate to be able to fit and form the ES complex. The steps in this reaction are
important in determining the Michael-Menten constant of the enzyme of interest. The Michaelis-
Menten equation is:
vo = 𝑉𝑉𝑚𝑚𝑚𝑚𝑚𝑚[𝑆𝑆]𝐾𝐾𝑚𝑚+[𝑆𝑆]
(4)
where Vmax is the maximum velocity (or rate) of the enzyme, [S] is the substrate concentration,
and Km is the Michaelis-Menten constant of a particular enzyme.29 This equation is useful for
Portagallo 13
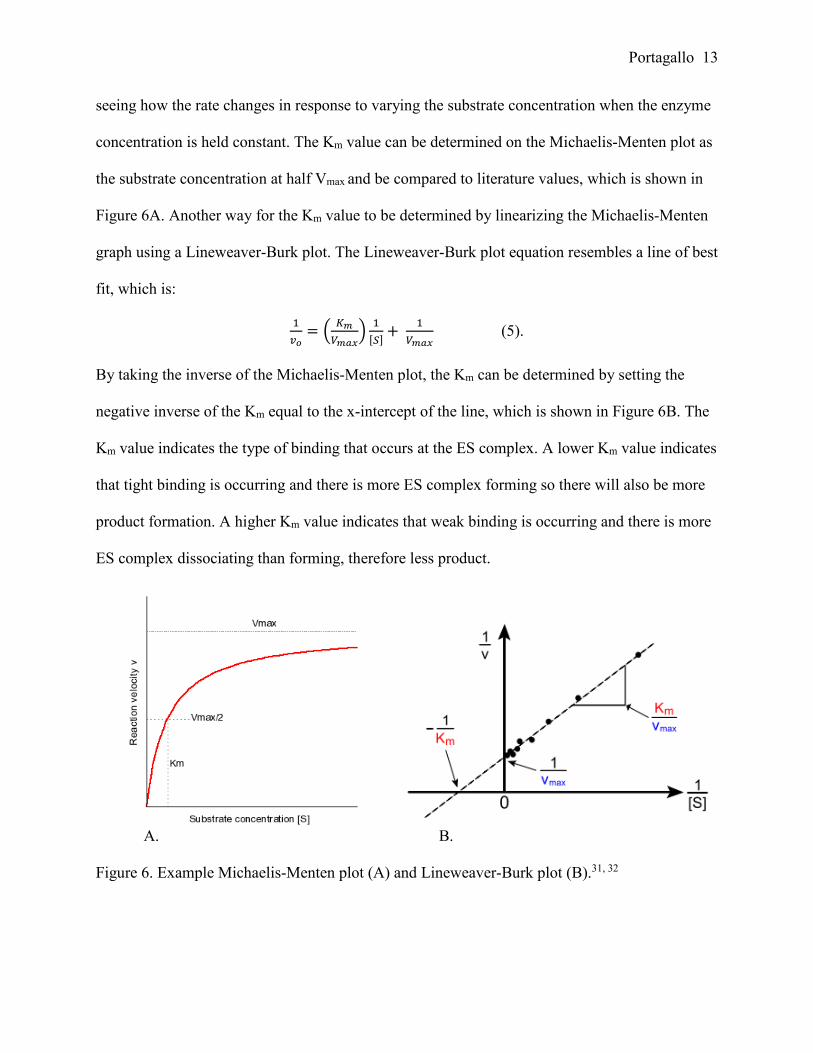
seeing how the rate changes in response to varying the substrate concentration when the enzyme
concentration is held constant. The Km value can be determined on the Michaelis-Menten plot as
the substrate concentration at half Vmax and be compared to literature values, which is shown in
Figure 6A. Another way for the Km value to be determined by linearizing the Michaelis-Menten
graph using a Lineweaver-Burk plot. The Lineweaver-Burk plot equation resembles a line of best
fit, which is:
1𝑣𝑣𝑜𝑜
= � 𝐾𝐾𝑚𝑚𝑉𝑉𝑚𝑚𝑚𝑚𝑚𝑚
� 1[𝑆𝑆] + 1
𝑉𝑉𝑚𝑚𝑚𝑚𝑚𝑚 (5).
By taking the inverse of the Michaelis-Menten plot, the Km can be determined by setting the
negative inverse of the Km equal to the x-intercept of the line, which is shown in Figure 6B. The
Km value indicates the type of binding that occurs at the ES complex. A lower Km value indicates
that tight binding is occurring and there is more ES complex forming so there will also be more
product formation. A higher Km value indicates that weak binding is occurring and there is more
ES complex dissociating than forming, therefore less product.
A. B.
Figure 6. Example Michaelis-Menten plot (A) and Lineweaver-Burk plot (B).31, 32
Portagallo 14
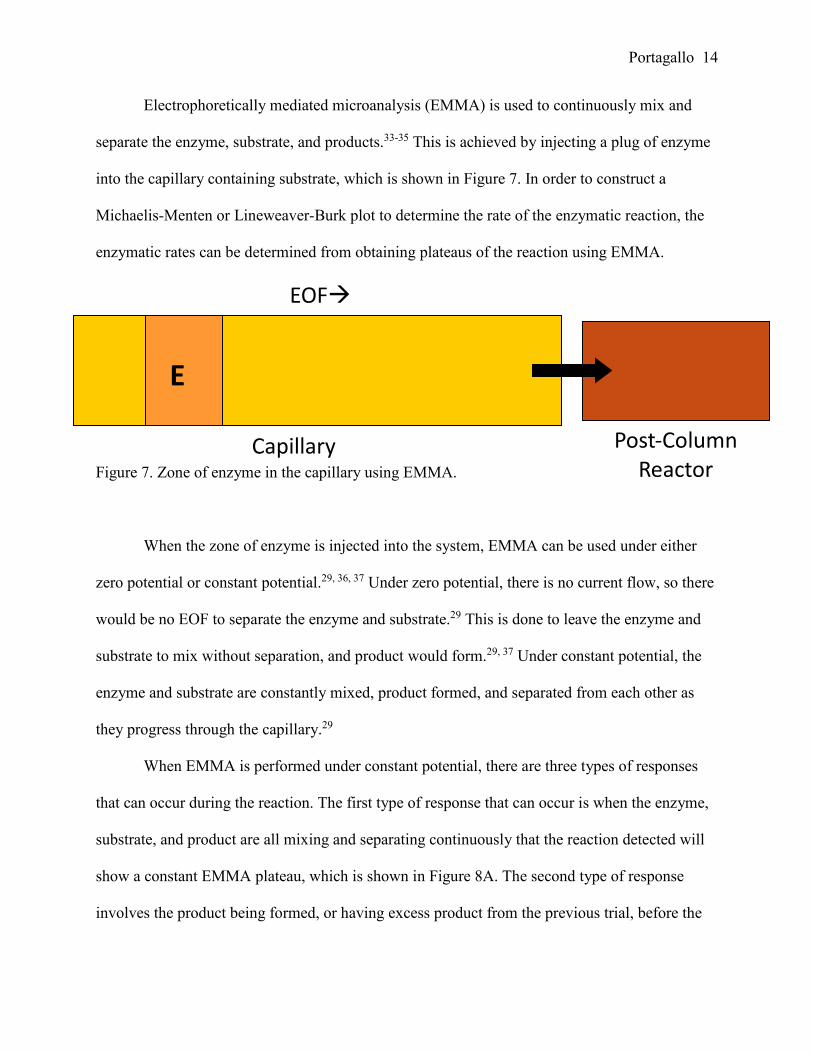
Electrophoretically mediated microanalysis (EMMA) is used to continuously mix and
separate the enzyme, substrate, and products.33-35 This is achieved by injecting a plug of enzyme
into the capillary containing substrate, which is shown in Figure 7. In order to construct a
Michaelis-Menten or Lineweaver-Burk plot to determine the rate of the enzymatic reaction, the
enzymatic rates can be determined from obtaining plateaus of the reaction using EMMA.
Figure 7. Zone of enzyme in the capillary using EMMA.
When the zone of enzyme is injected into the system, EMMA can be used under either
zero potential or constant potential.29, 36, 37 Under zero potential, there is no current flow, so there
would be no EOF to separate the enzyme and substrate.29 This is done to leave the enzyme and
substrate to mix without separation, and product would form.29, 37 Under constant potential, the
enzyme and substrate are constantly mixed, product formed, and separated from each other as
they progress through the capillary.29
When EMMA is performed under constant potential, there are three types of responses
that can occur during the reaction. The first type of response that can occur is when the enzyme,
substrate, and product are all mixing and separating continuously that the reaction detected will
show a constant EMMA plateau, which is shown in Figure 8A. The second type of response
involves the product being formed, or having excess product from the previous trial, before the
E
EOF
Capillary Post-Column Reactor
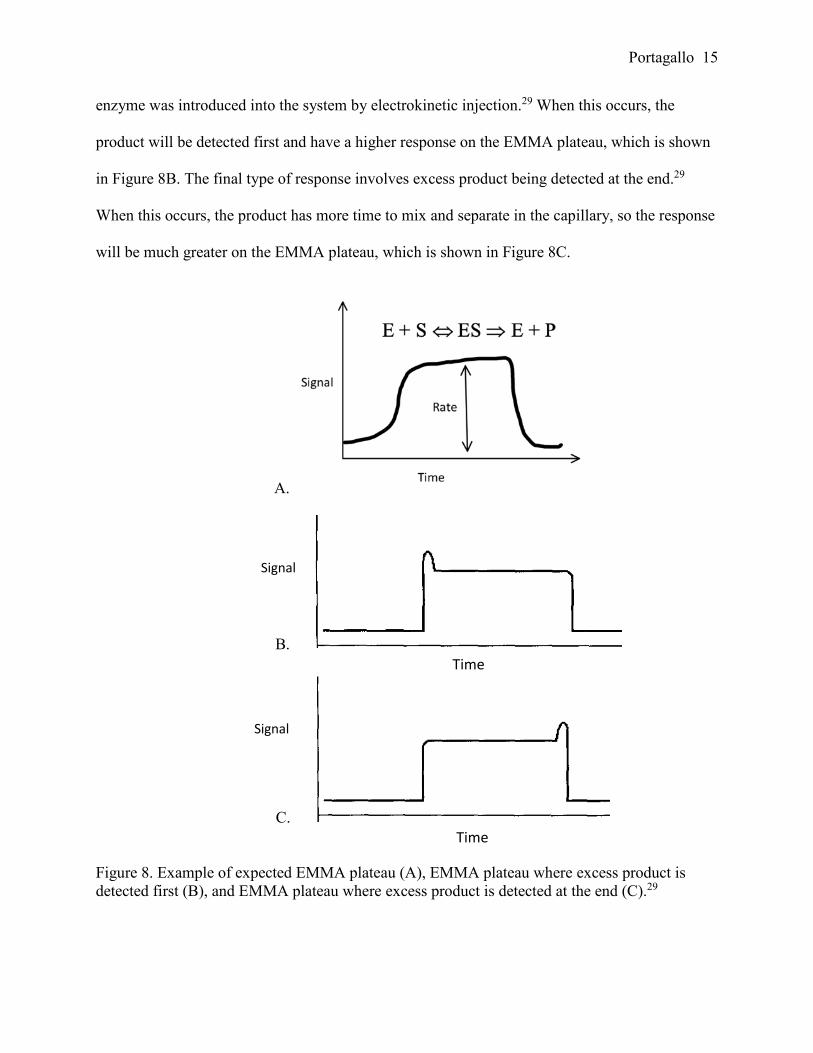
Portagallo 15
enzyme was introduced into the system by electrokinetic injection.29 When this occurs, the
product will be detected first and have a higher response on the EMMA plateau, which is shown
in Figure 8B. The final type of response involves excess product being detected at the end.29
When this occurs, the product has more time to mix and separate in the capillary, so the response
will be much greater on the EMMA plateau, which is shown in Figure 8C.
A.
B.
C.
Figure 8. Example of expected EMMA plateau (A), EMMA plateau where excess product is detected first (B), and EMMA plateau where excess product is detected at the end (C).29
Signal
Signal
Time
Time
Portagallo 16
EMMA paired with CE was the main focus in a paper by Bao and Reigner, where the
enzyme and substrate of interest were NADP oxidoreductase and D-glucose-6-phosphate (G-6-
PDH).29 The enzyme was introduced into the capillary by electrokinetic injection, and the
substrate was constantly flowing through the capillary from the inlet, when a constant potential
was be applied for the enzyme and substrate to mix.29 Using UV-Vis absorbance, product
formation could be detected if the enzyme absorbed light at a certain wavelength.29 This project
is very similar to the work done by Bao and Regnier. However, a custom capillary
electrophoresis system with post-column chemiluminescence detection is being utilized to
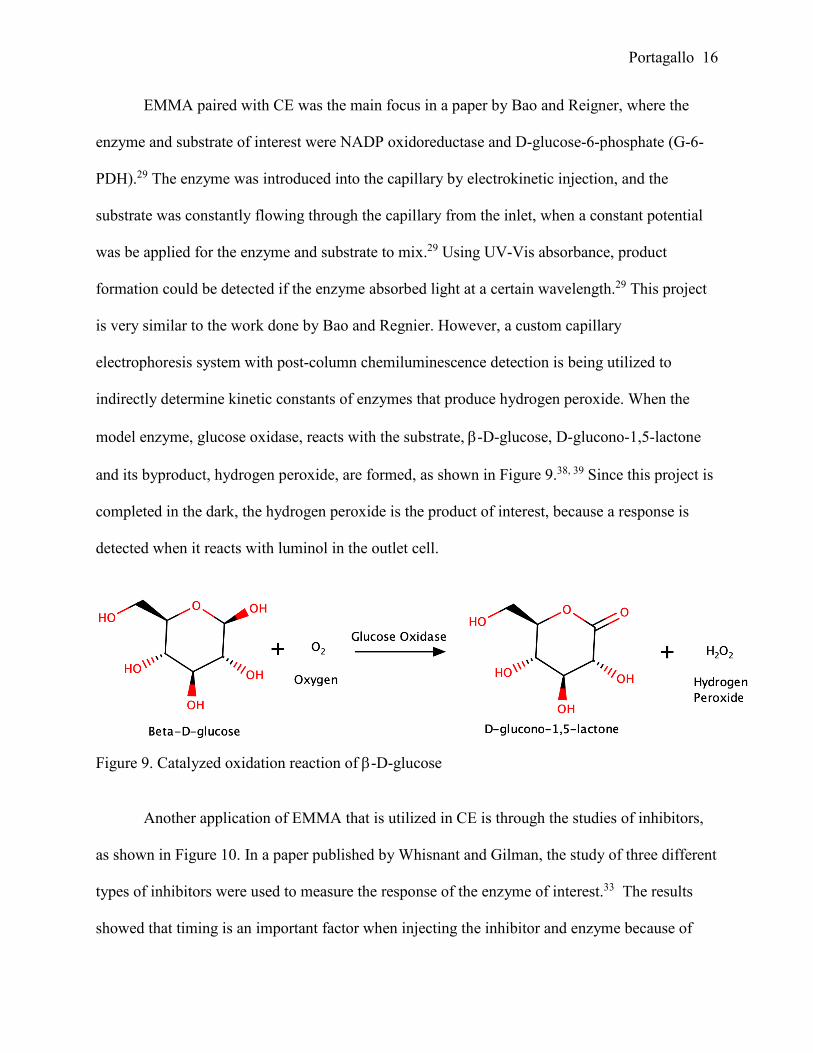
indirectly determine kinetic constants of enzymes that produce hydrogen peroxide. When the
model enzyme, glucose oxidase, reacts with the substrate, β-D-glucose, D-glucono-1,5-lactone
and its byproduct, hydrogen peroxide, are formed, as shown in Figure 9.38, 39 Since this project is
completed in the dark, the hydrogen peroxide is the product of interest, because a response is
detected when it reacts with luminol in the outlet cell.
Figure 9. Catalyzed oxidation reaction of β-D-glucose
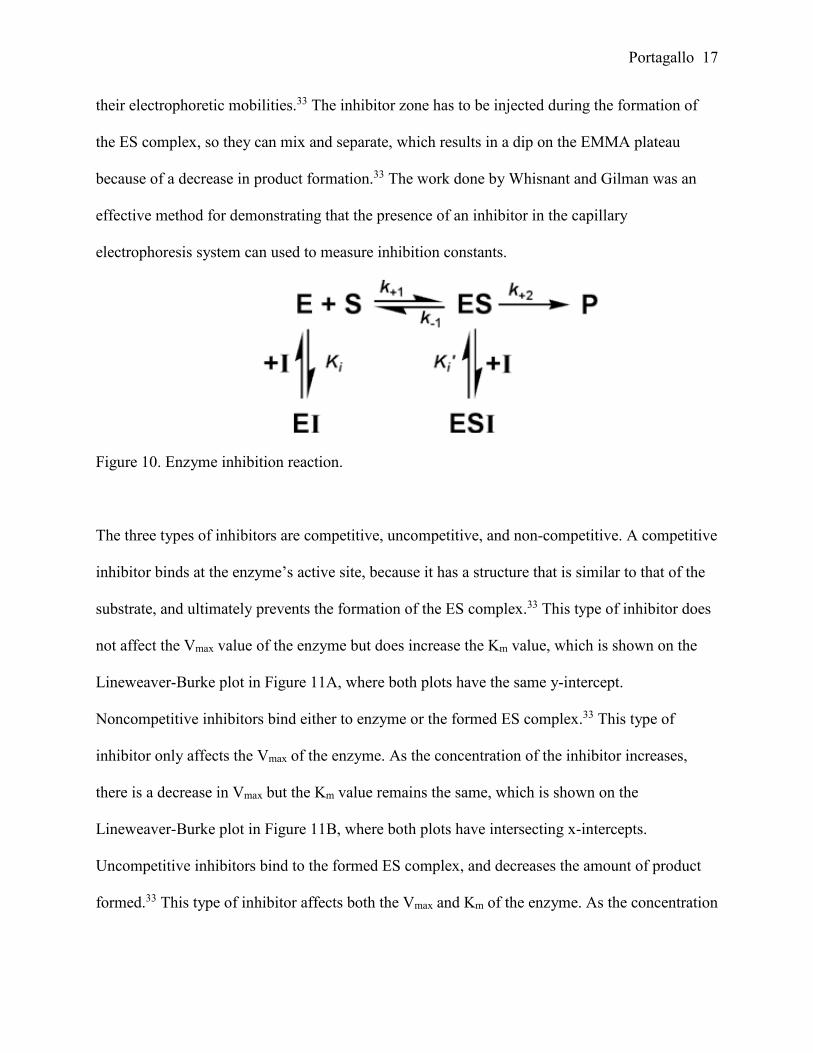
Another application of EMMA that is utilized in CE is through the studies of inhibitors,
as shown in Figure 10. In a paper published by Whisnant and Gilman, the study of three different
types of inhibitors were used to measure the response of the enzyme of interest.33 The results
showed that timing is an important factor when injecting the inhibitor and enzyme because of
Portagallo 17
their electrophoretic mobilities.33 The inhibitor zone has to be injected during the formation of
the ES complex, so they can mix and separate, which results in a dip on the EMMA plateau
because of a decrease in product formation.33 The work done by Whisnant and Gilman was an
effective method for demonstrating that the presence of an inhibitor in the capillary
electrophoresis system can used to measure inhibition constants.
Figure 10. Enzyme inhibition reaction.
The three types of inhibitors are competitive, uncompetitive, and non-competitive. A competitive
inhibitor binds at the enzyme’s active site, because it has a structure that is similar to that of the
substrate, and ultimately prevents the formation of the ES complex.33 This type of inhibitor does
not affect the Vmax value of the enzyme but does increase the Km value, which is shown on the
Lineweaver-Burke plot in Figure 11A, where both plots have the same y-intercept.
Noncompetitive inhibitors bind either to enzyme or the formed ES complex.33 This type of
inhibitor only affects the Vmax of the enzyme. As the concentration of the inhibitor increases,
there is a decrease in Vmax but the Km value remains the same, which is shown on the
Lineweaver-Burke plot in Figure 11B, where both plots have intersecting x-intercepts.
Uncompetitive inhibitors bind to the formed ES complex, and decreases the amount of product
formed.33 This type of inhibitor affects both the Vmax and Km of the enzyme. As the concentration
Portagallo 18
of the inhibitor increases, there is a decrease in both the Km and Vmax, which is shown on the
Lineweaver-Burke plot in Figure 11C, where the plot has non-intersecting lines.
A. B. C.
Figure 11. Lineweaver-Burk plots of competitive inhibition (A), noncompetitive inhibition (B), and uncompetitive inhibition (C).40
For this project, a known, competitive inhibitor of glucose oxidase that can be used as a is
chloride.39 At low pH, chloride ions are a competitive inhibitor for glucose oxidase, and will bind
bind to the active site of the oxidized form of the enzyme.39, 41, 42 However, the conditions for this
project uses a buffer with pH = 10.80, and does not satisfy these conditions for chloride ions.
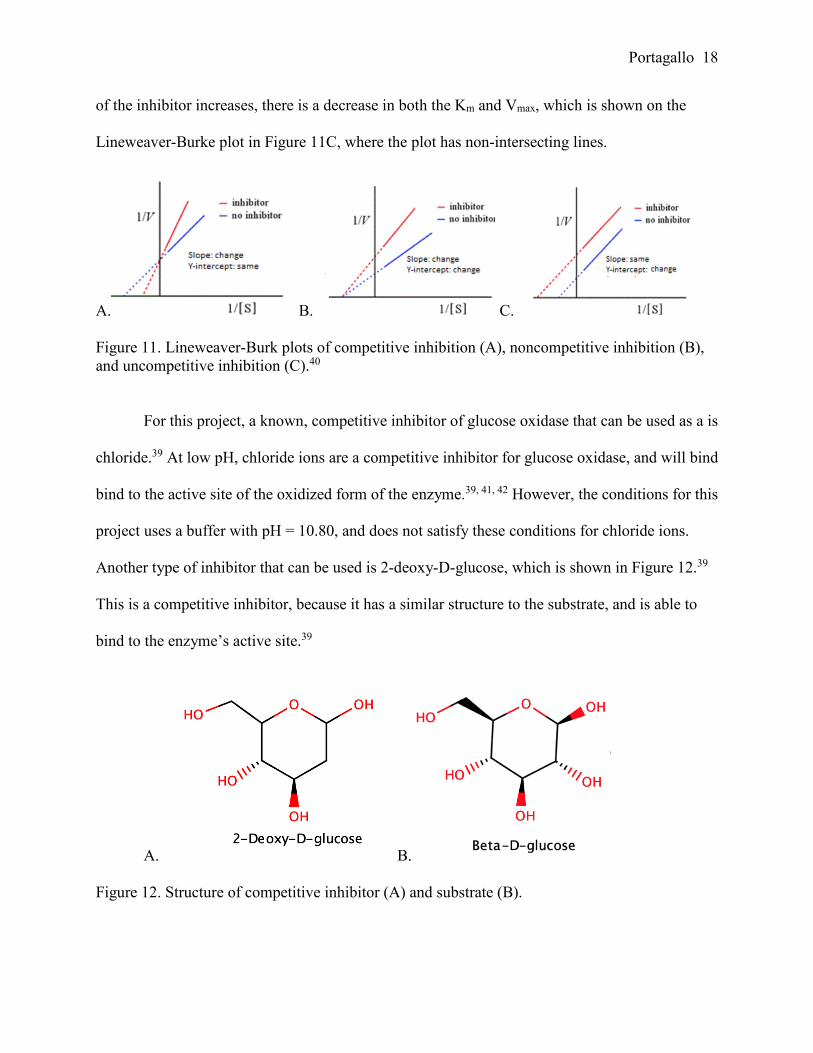
Another type of inhibitor that can be used is 2-deoxy-D-glucose, which is shown in Figure 12.39
This is a competitive inhibitor, because it has a similar structure to the substrate, and is able to
bind to the enzyme’s active site.39
A. B.
Figure 12. Structure of competitive inhibitor (A) and substrate (B).
Portagallo 19
Materials and Methods:
Reagents
Microperoxidase (CAS 104870-94-2) and luminol (CAS 521-31-3), glucose oxidase (CAS 9001-
37-0, 10 kU), methanol (CAS 67-56-1) and hydrogen peroxide (CAS 7722-84-1, 30% w/w) were
purchased from Sigma Aldrich. β-D-glucose (97%, CAS 492-61-5) was purchased from MP
Biomedicals. Sodium phosphate tribasic (CAS 10101-89) and sodium phosphate dibasic (CAS
7558-79-4) were purchased from Fisher Scientific, which were combined to make the sodium
phosphate buffer used (pH =10.80, 1.3780 g Na2PO4, 0.1114 g Na3PO4).
The instrument
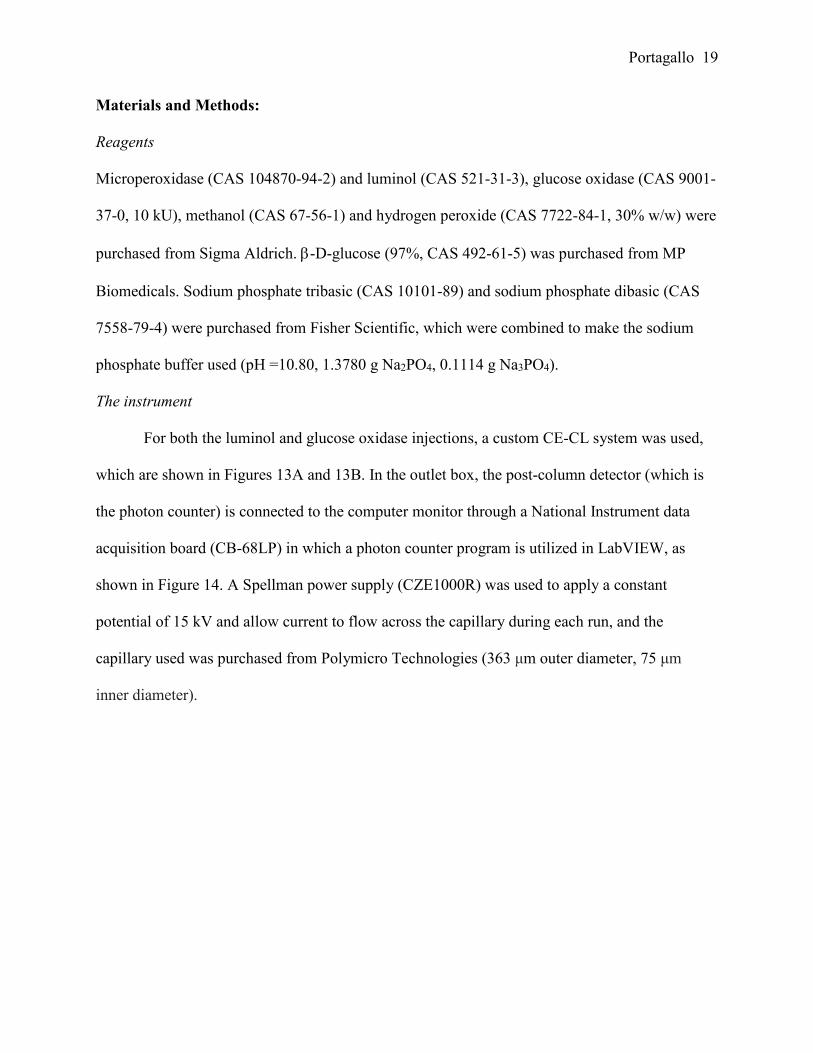
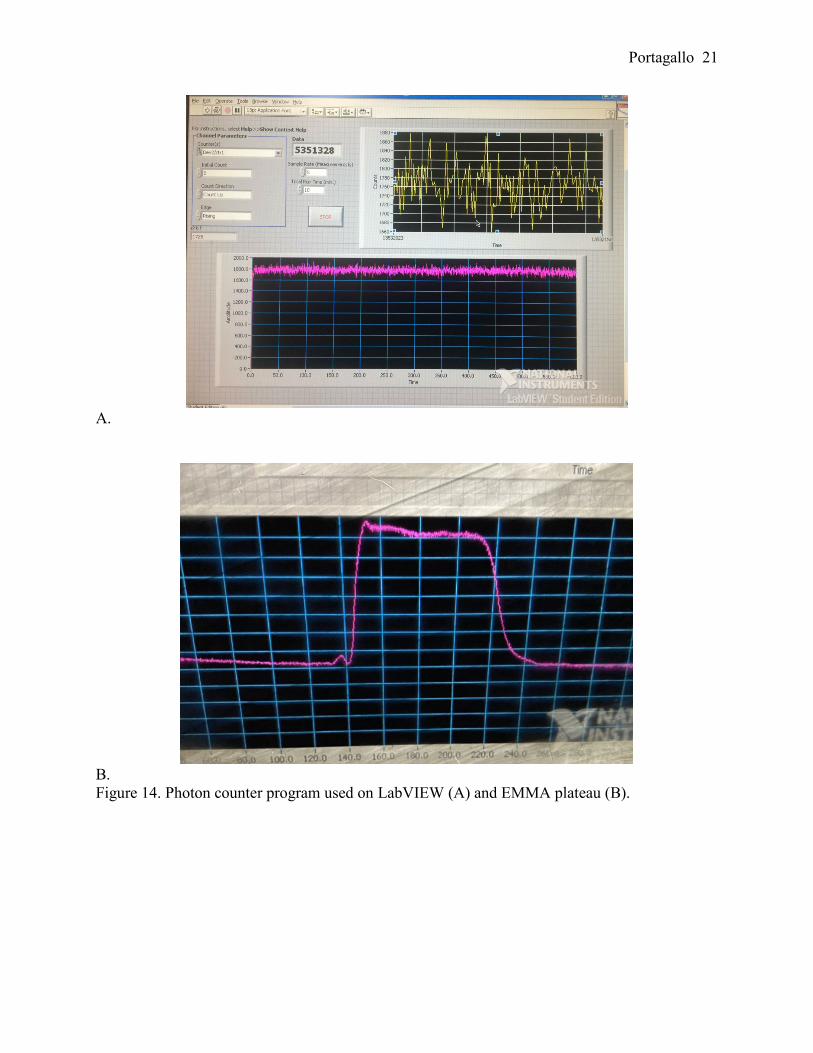
For both the luminol and glucose oxidase injections, a custom CE-CL system was used,
which are shown in Figures 13A and 13B. In the outlet box, the post-column detector (which is
the photon counter) is connected to the computer monitor through a National Instrument data
acquisition board (CB-68LP) in which a photon counter program is utilized in LabVIEW, as
shown in Figure 14. A Spellman power supply (CZE1000R) was used to apply a constant
potential of 15 kV and allow current to flow across the capillary during each run, and the
capillary used was purchased from Polymicro Technologies (363 μm outer diameter, 75 μm
inner diameter).

Portagallo 20
A.
B. Figure 13. Diagram of the CE-CL system (A) and custom CE system with post-column chemiluminescence detection (B).
Portagallo 21
A.
B. Figure 14. Photon counter program used on LabVIEW (A) and EMMA plateau (B).
Portagallo 22
Preparing the capillary
Before the first run, or whenever suppression of flow occurred, the capillary had to be
washed in this order with: 0.1M sodium hydroxide, DI water, then with sodium phosphate buffer.
In order to do this, a custom capillary adapter was used and attached to a syringe.
Validation of the instrument: luminol injections
For the validation of the instrument, various concentrations of luminol were used to
measure the consistency of the trials performed. A 1.0 mM luminol stock solution was prepared
by weighing 0.0089 g and quantitatively transferring it to a 50.00 mL volumetric flask with 5.00
mL of methanol. The solution was sonicated until the luminol fully dissolved, and was then
diluted to the mark with sodium phosphate buffer. A 0.215 mM microperoxidase stock solution
was prepared by weighing 0.0042 g and quantitatively transferring it to a 10.00 mL volumetric
flask to be diluted to the mark with sodium phosphate buffer. A 0.4 M hydrogen peroxide stock
solution was prepared by weighing out 0.435 g in a 10.00 mL volumetric flask and diluting to the
mark with sodium phosphate buffer.
The capillary (37.0 cm) was placed in the inlet and outlet cells. In the inlet, the anode and
capillary were placed in a beaker filled with 0.215 mM microperoxidase solution, while the
cathode and capillary in the outlet cell were placed in 0.4 M hydrogen peroxide. The luminol
sample was prepared in an Eppendorf tube and diluted with sodium phosphate buffer. This
Eppendorf tube was taped above the anode on the inlet box. The capillary was then placed in this
sample to allow the luminol to be introduced into the system by a five second hydrodynamic
injection, then placing it back into the microperoxidase solution. The parameters set for the
luminol injections on the Photon Counter LabVIEW program were a 6-minute runtime, with 5
measurements/second.

Portagallo 23
Glucose oxidase injections
For the glucose oxidase injections, various concentrations of the enzyme were used to
determine the optimal concentration for this portion of the project. The luminol and
microperoxidase stock solutions were prepared the same way as the luminol injections. A 2.50 x
10-5 M microperoxidase/ 2.50 x 10⁻⁶ M luminol solution was prepared by adding 1.00 mL of the
microperoxidase and 75.0 µL of luminol stock solutions in a 10.00 mL volumetric flask, and
diluting to the mark with sodium phosphate buffer. A 200.0 mM β-D-glucose stock solution was
prepared by weighing out 3.60 g and quantitatively transferring it to a 100.0 mL volumetric flask
to be diluted to the mark with sodium phosphate buffer. A glucose oxidase stock solution was
prepared by adding 200.0 µL to a 10.00 mL volumetric flask and diluting to the mark with
sodium phosphate buffer.
Once the optimal glucose oxidase concentration was determined, the concentration of the
substrate, β-D-glucose, was varied. Using the 200.0 mM β-D-glucose stock solution, a series of
10.00 mL dilutions were performed to vary the concentration between 5.00 mM-100.0 mM.
In the inlet, the anode and capillary were placed in a beaker filled with 200.0 mM β-D-
glucose stock solution, while the cathode and capillary in the outlet cell were placed in the 2.50 x
10-5 M microperoxidase/ 2.50 x 10⁻⁶ M luminol solution. Before the run could begin, the β-D-
glucose solution had to flow through the capillary. The glucose oxidase sample was prepared in
an Eppendorf tube and diluted with sodium phosphate buffer, and the Eppendorf tube was placed
in the inlet box. The capillary and anode were then placed in this sample to allow the glucose
oxidase to be introduced into the system, by a five second electrokinetic injection, then placing
both back into the β-D-glucose solution. The parameters set for the glucose oxidase injections on
the Photon Counter LabVIEW program were a 6-minute runtime, with 5 measurements/second.
Portagallo 24
Results and Discussion:
Validation of the instrument: luminol injections
Validation of the instrument was performed in order to learn how to use the custom CE-
CL system, as well as obtaining consistent responses using different concentrations of luminol.
During this method, luminol is injected into the capillary and reacts with hydrogen peroxide in
the outlet cell to produce light, in which the signal detected by the photon counter would be a
peak. In order to learn how to use the system and obtain consistent results, replicates using
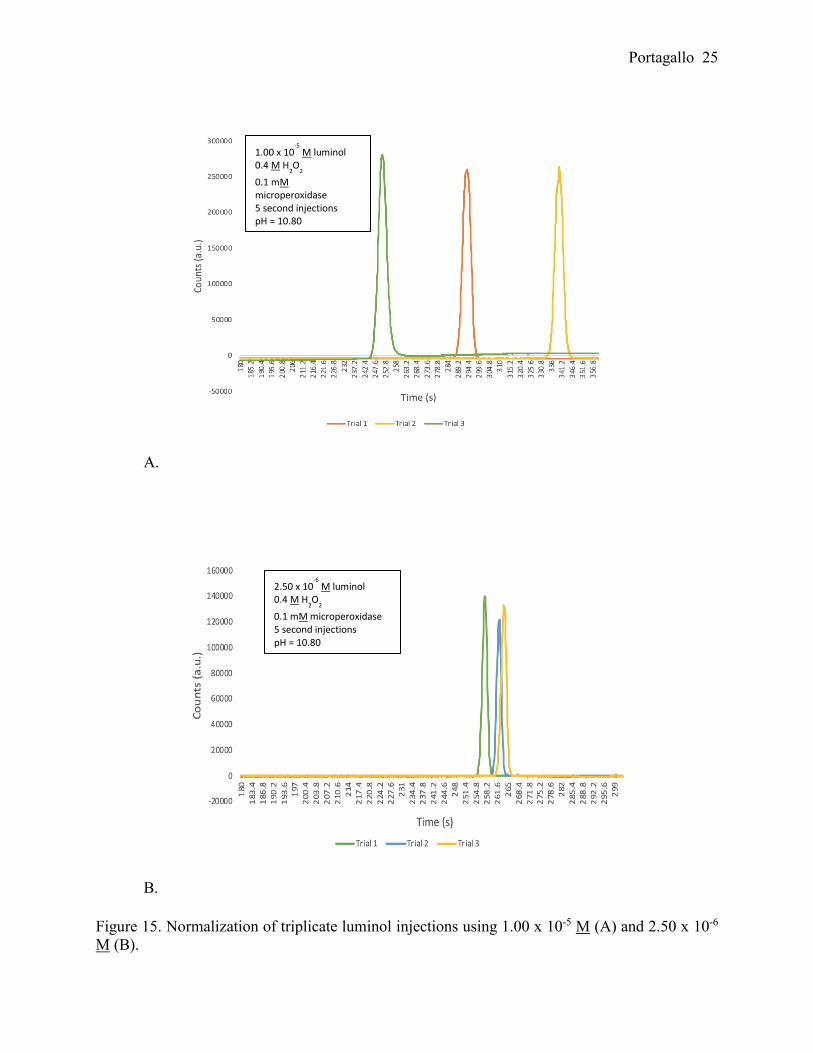
multiple concentrations of luminol had to be obtained, as shown in Figure 15. Due to the fact that
CE-CL system used is not automated, the retention times of the peak will not always be the same
because of the time it takes to have the system in order before the trial starts. However, the
intensity of the peak is what should be consistent throughout the trials. It is also expected that as
the concentration of luminol increased, the peaks increased, which is shown in Figure 16.
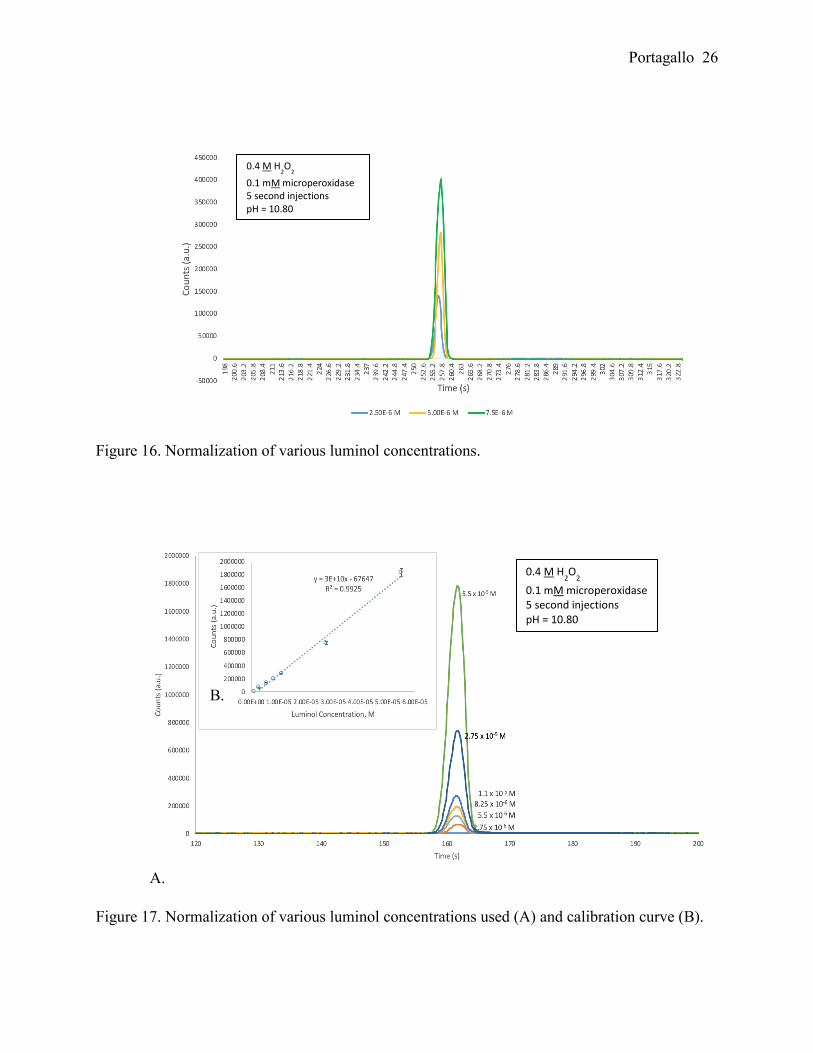
The results from the validation of luminol injections confirmed that the response to the
reaction occurring significantly increases when using increasing concentrations of luminol,
which is shown in Figure 17A. Using the maxima of the peaks obtained from increasing luminol
concentrations, a calibration curve was created to determine if there was consistency in the
results with the method used, which is shown in Figure 17B. The line of best fit was determined
to be 3.0 x 10¹⁰x - 6.7 x 10⁴, with an R2 value of 0.9925. The R2 value indicates that that was
strong linearity present as the concentrations of luminol increased.
The luminol injections validated the method and proved to be a reliable and effective
method in detecting chemiluminescence. It also showed that there was confidence in the obtained
results, and could move forward with the glucose oxidase injections.
Portagallo 25
A.
B.
Figure 15. Normalization of triplicate luminol injections using 1.00 x 10⁻⁵ M (A) and 2.50 x 10⁻⁶ M (B).
1.00 x 10⁻⁵
M luminol 0.4 M H
2O
2
0.1 mM microperoxidase 5 second injections pH = 10.80
2.50 x 10⁻⁶
M luminol 0.4 M H
2O
2
0.1 mM microperoxidase 5 second injections pH = 10.80
Portagallo 26
Figure 16. Normalization of various luminol concentrations.
A.
Figure 17. Normalization of various luminol concentrations used (A) and calibration curve (B).
B.
0.4 M H2O
2
0.1 mM microperoxidase 5 second injections pH = 10.80
0.4 M H2O
2
0.1 mM microperoxidase 5 second injections pH = 10.80
Portagallo 27
Glucose oxidase injections
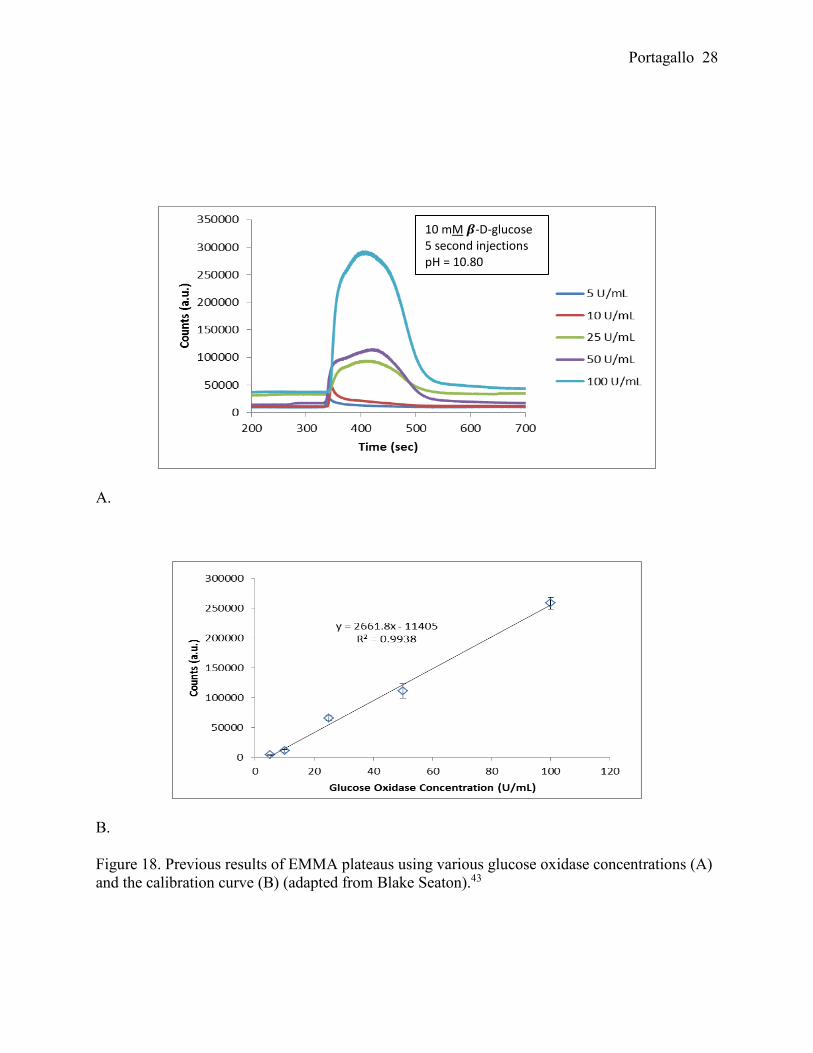
The custom CE-CL system was used with EMMA to introduce various concentrations of
glucose oxidase by electrokinetic injection to see if a signal was detected by the photon counter,
when the byproduct, hydrogen peroxide, reacted with the luminol in the outlet cell. Previous
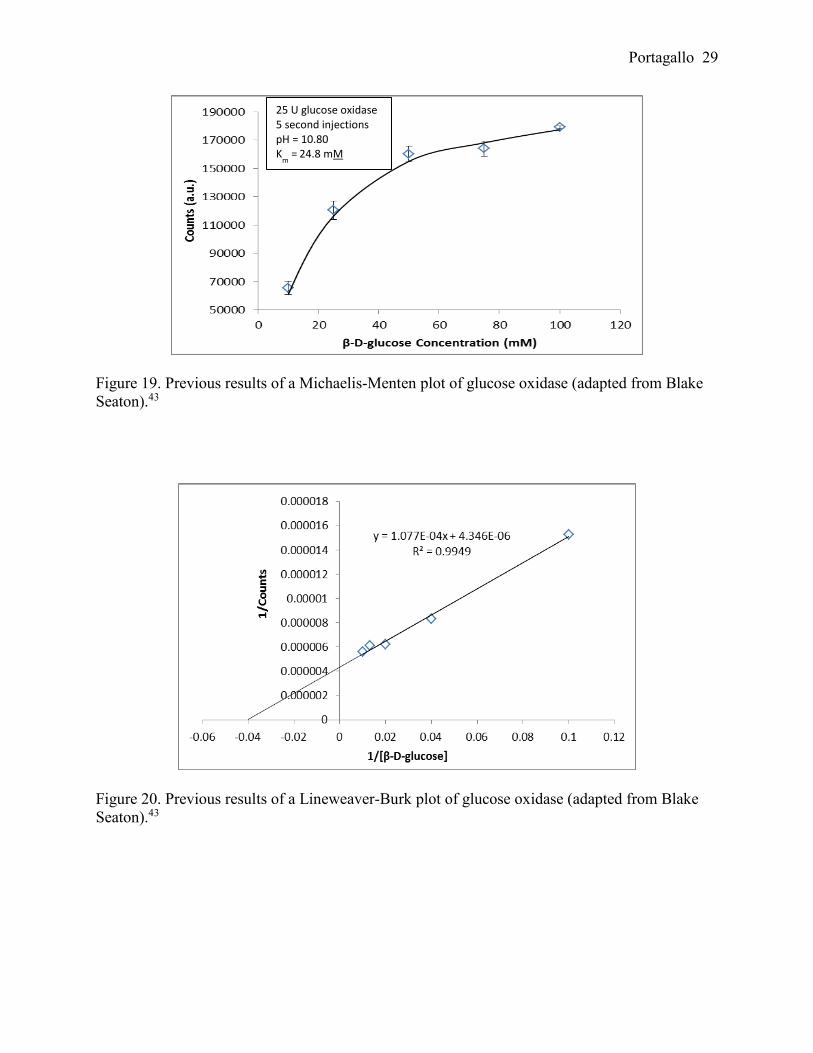
work done by former chemistry major, Blake Seaton, is shown in Figures 18A and 18B.43 As the
concentration of glucose oxidase increases, the intensity of the plateau also increases which is
supported by the R2 value of 0.9938, indicating strong linearity present. However, one difference
between Blake’s results and the ones obtained here is the concentration of the substrate, β-D-
glucose, used. In these results, the substrate concentration was held constant at 200 mM, because
it was to ensure that there was excess substrate during the enzymatic reaction. Blake’s results
utilized a constant substrate concentration of 10.00 mM, but the results show that there was not
enough β-D-glucose to react with glucose oxidase and have product formation, showing that the
results were obtained under non-optimal conditions. Due to this, more results needed to be
obtained, as well as more reproducible data for publication. Blake Seaton also proceeded to
determine the Km value of glucose oxidase, which was 24.8 mM, by producing a Michaelis-
Menten plot, and linearizing it by a Lineweaver-Burk plot, which are shown in Figures 19 and
20. The Km value Blake obtained showed that a higher concentration of β-D-glucose was needed
for this enzymatic reaction.
Portagallo 28
A.
B.
Figure 18. Previous results of EMMA plateaus using various glucose oxidase concentrations (A) and the calibration curve (B) (adapted from Blake Seaton).43
10 mM 𝜷𝜷-D-glucose 5 second injections pH = 10.80
Portagallo 29
Figure 19. Previous results of a Michaelis-Menten plot of glucose oxidase (adapted from Blake Seaton).43
Figure 20. Previous results of a Lineweaver-Burk plot of glucose oxidase (adapted from Blake Seaton).43
25 U glucose oxidase 5 second injections pH = 10.80 K
m = 24.8 mM
Portagallo 30
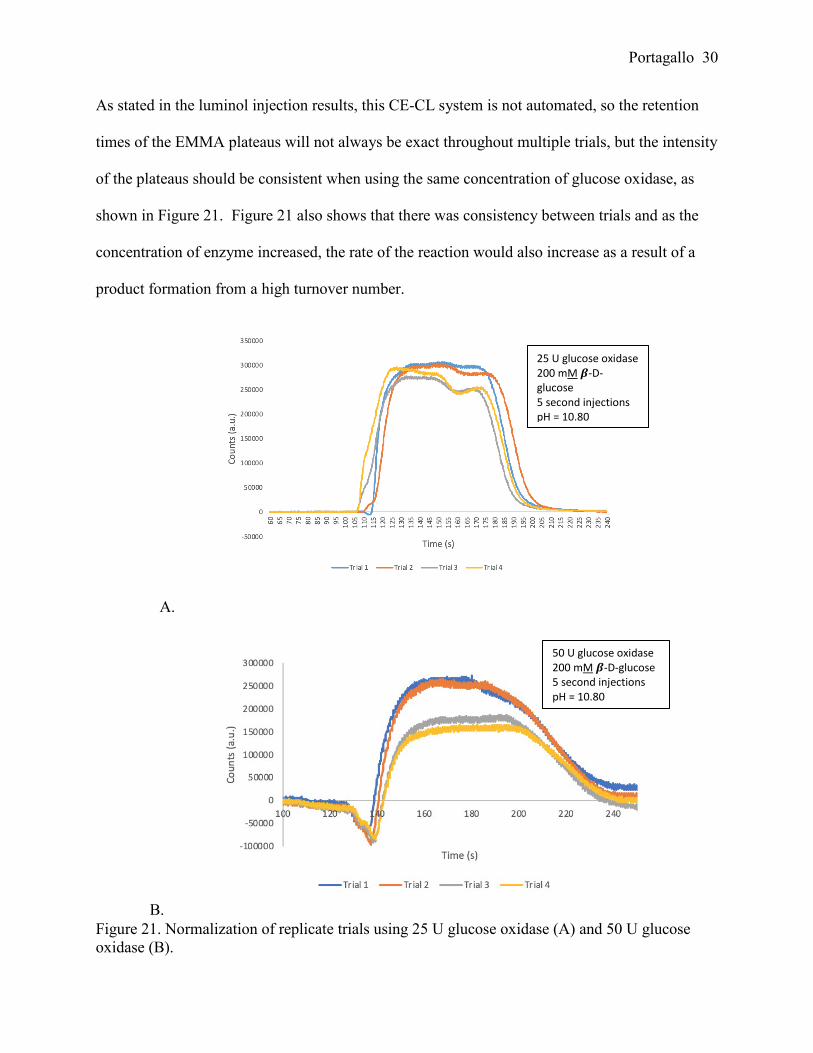
As stated in the luminol injection results, this CE-CL system is not automated, so the retention
times of the EMMA plateaus will not always be exact throughout multiple trials, but the intensity
of the plateaus should be consistent when using the same concentration of glucose oxidase, as
shown in Figure 21. Figure 21 also shows that there was consistency between trials and as the
concentration of enzyme increased, the rate of the reaction would also increase as a result of a
product formation from a high turnover number.
A.
B.
Figure 21. Normalization of replicate trials using 25 U glucose oxidase (A) and 50 U glucose oxidase (B).
25 U glucose oxidase 200 mM 𝜷𝜷-D-glucose 5 second injections pH = 10.80
50 U glucose oxidase 200 mM 𝜷𝜷-D-glucose 5 second injections pH = 10.80
Portagallo 31
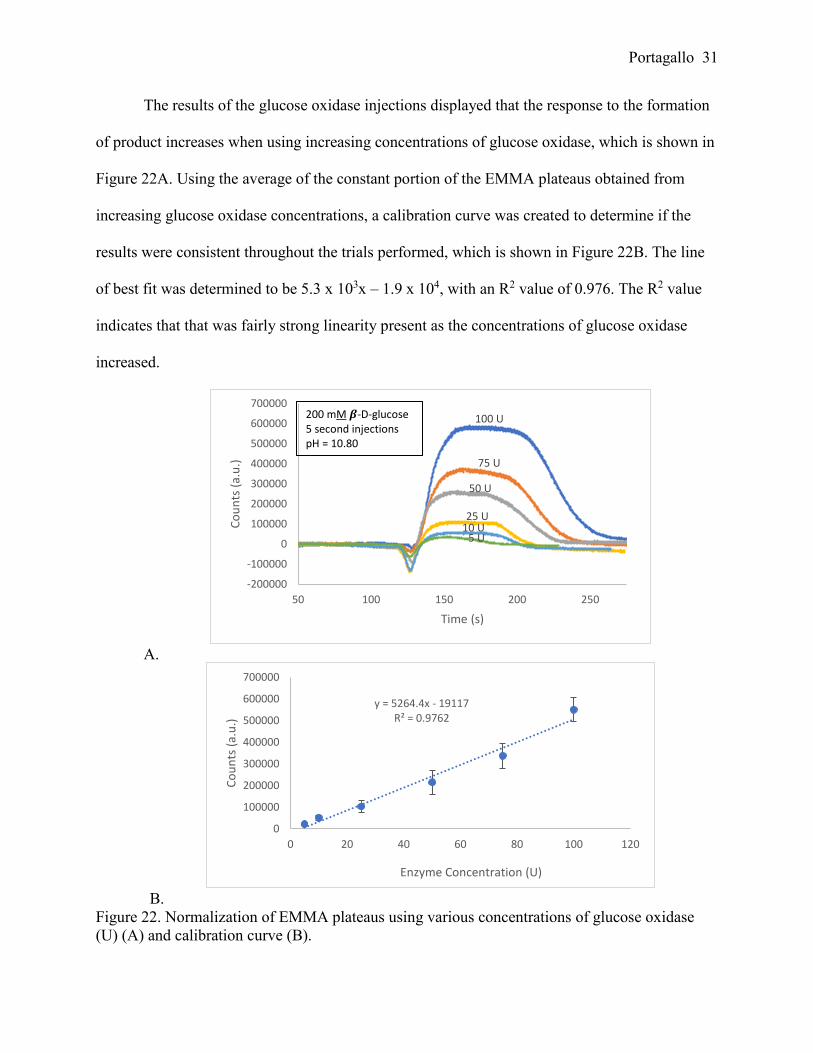
The results of the glucose oxidase injections displayed that the response to the formation
of product increases when using increasing concentrations of glucose oxidase, which is shown in
Figure 22A. Using the average of the constant portion of the EMMA plateaus obtained from
increasing glucose oxidase concentrations, a calibration curve was created to determine if the
results were consistent throughout the trials performed, which is shown in Figure 22B. The line
of best fit was determined to be 5.3 x 10³x – 1.9 x 10⁴, with an R2 value of 0.976. The R2 value
indicates that that was fairly strong linearity present as the concentrations of glucose oxidase
increased.
A.
B.
Figure 22. Normalization of EMMA plateaus using various concentrations of glucose oxidase (U) (A) and calibration curve (B).
100 U
75 U
50 U
25 U10 U
5 U
-200000
-100000
0
100000
200000
300000
400000
500000
600000
700000
50 100 150 200 250
Coun
ts (a
.u.)
Time (s)
y = 5264.4x - 19117R² = 0.9762
0
100000
200000
300000
400000
500000
600000
700000
0 20 40 60 80 100 120
Coun
ts (a
.u.)
Enzyme Concentration (U)
200 mM 𝜷𝜷-D-glucose 5 second injections pH = 10.80
Portagallo 32
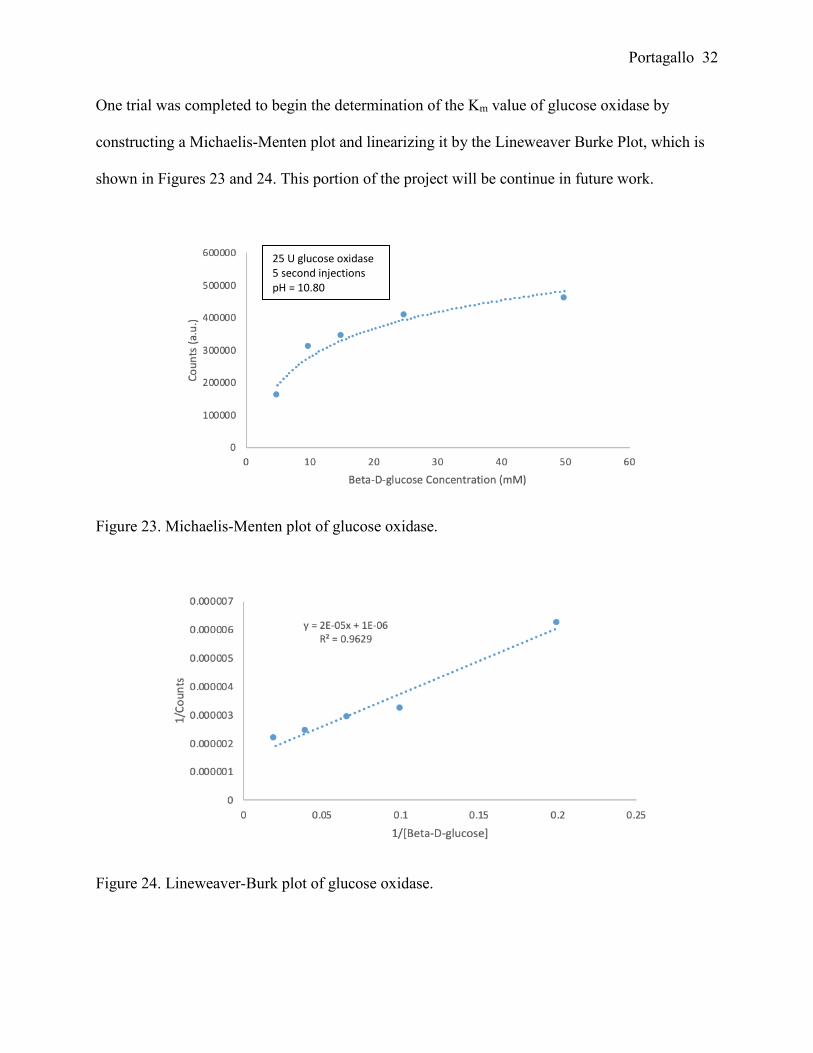
One trial was completed to begin the determination of the Km value of glucose oxidase by
constructing a Michaelis-Menten plot and linearizing it by the Lineweaver Burke Plot, which is
shown in Figures 23 and 24. This portion of the project will be continue in future work.
Figure 23. Michaelis-Menten plot of glucose oxidase.
Figure 24. Lineweaver-Burk plot of glucose oxidase.
25 U glucose oxidase 5 second injections pH = 10.80
Portagallo 33
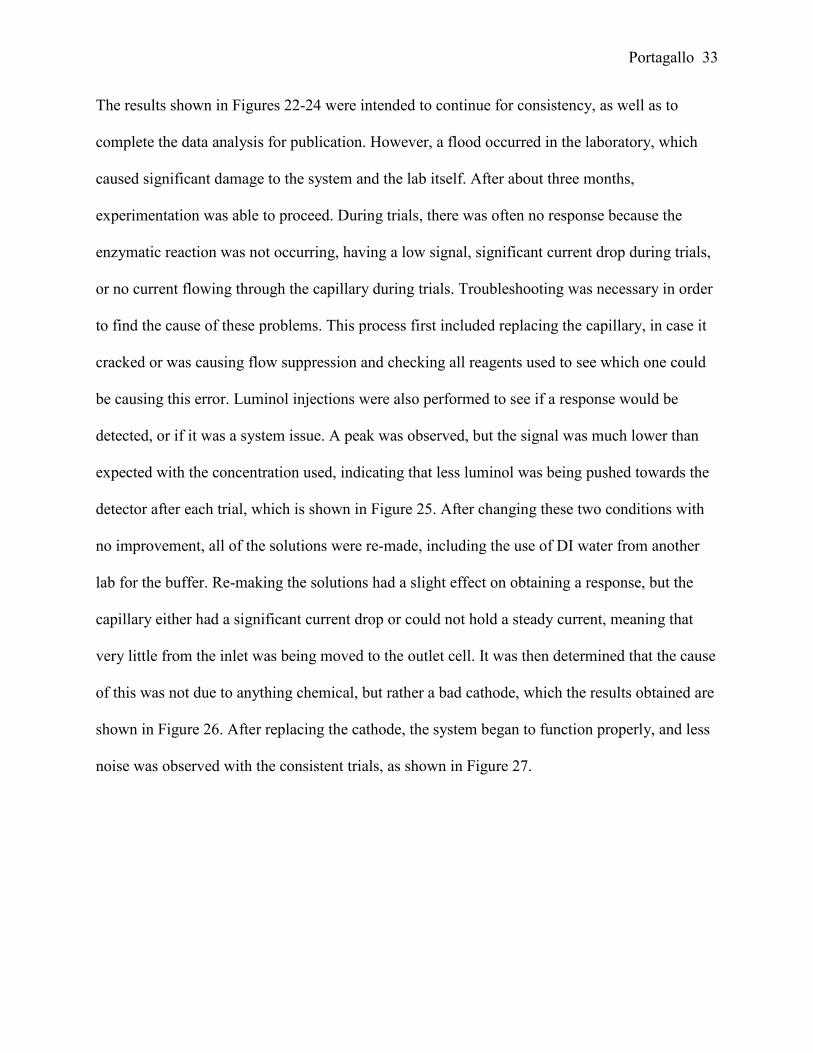
The results shown in Figures 22-24 were intended to continue for consistency, as well as to
complete the data analysis for publication. However, a flood occurred in the laboratory, which
caused significant damage to the system and the lab itself. After about three months,
experimentation was able to proceed. During trials, there was often no response because the
enzymatic reaction was not occurring, having a low signal, significant current drop during trials,
or no current flowing through the capillary during trials. Troubleshooting was necessary in order
to find the cause of these problems. This process first included replacing the capillary, in case it
cracked or was causing flow suppression and checking all reagents used to see which one could
be causing this error. Luminol injections were also performed to see if a response would be
detected, or if it was a system issue. A peak was observed, but the signal was much lower than
expected with the concentration used, indicating that less luminol was being pushed towards the
detector after each trial, which is shown in Figure 25. After changing these two conditions with
no improvement, all of the solutions were re-made, including the use of DI water from another
lab for the buffer. Re-making the solutions had a slight effect on obtaining a response, but the
capillary either had a significant current drop or could not hold a steady current, meaning that
very little from the inlet was being moved to the outlet cell. It was then determined that the cause
of this was not due to anything chemical, but rather a bad cathode, which the results obtained are
shown in Figure 26. After replacing the cathode, the system began to function properly, and less
noise was observed with the consistent trials, as shown in Figure 27.

Portagallo 34
Figure 25. Normalization of luminol injections using 1.00 x 10⁻⁵ M (before changing the cathode).
Figure 26. Normalization of EMMA plateaus using 100 U glucose oxidase (before changing the cathode).
100 U glucose oxidase 200 mM 𝜷𝜷-D-glucose 5 second injections pH = 10.80
1.00 x 10⁻⁵
M luminol 0.4 M H
2O
2
5 second injections pH = 10.80
Portagallo 35
A.
B.
Figure 27. Normalization of EMMA plateaus using 100 U glucose oxidase (A) and 75 U glucose oxidase (B) (after replacing cathode).
100 U glucose oxidase 200 mM 𝜷𝜷-D-glucose 5 second injections pH = 10.80
75 U glucose oxidase 200 mM 𝜷𝜷-D-glucose 5 second injections pH = 10.80
Portagallo 36
Conclusion and Future Work:
This research project included validating the instrument and proceeding to the glucose
oxidase injections to study the enzyme kinetics of glucose oxidase. After validation, the method
of using custom CE-CL system with EMMA to indirectly determine enzyme kinetics has been
proven to be very effective and consistent. Future work for this project includes the completion
of the data analysis of the glucose oxidase injections to determine the Michaelis-Menten
constant, Km, and compare to the literature values. Future work also includes other inhibitors,
such as Co2+, Cu2+, Ag+, Mg2+, or 2-deoxy-D-glucose, a competitive inhibitor.39
Portagallo 37
References: 1. Heiger, D., High Performance Capillary Electrophoresis: An Introduction. Agilent Technologies: 2000. 2. Liu, Y.-M.; Cheng, J.-K., Ultrasensitive chemiluminescence detection in capillary electrophoresis. Journal of Chromatography 2002, 959 (1-2), 1-13. 3. Chien, R.-L.; Burgi, D. S., Field amplified sample injection in high- performance capillary electrophoresis. Journal of Chromatography 1991, 559, 141-152. 4. Dumke, J. C.; Nussbaum, M. A., Adaptation of a Commercial Capillary Electrophoresis Instrument for Chemiluminescence Detection. Journal of Analytical Chemistry 2007, 79 (3), 1262-1265. 5. ChemLibreTexts, Schematic diagram of the basic instrumentation for capillary electrophoresis. The sample and the source reservoir are switched when making injections. 2019. 6. Quirino, J. P.; Terabe, S., Sample stacking of cationic and anionic analytes in capillary electrophoresis. Journal of Chromatography A 2000, 902, 119-135. 7. Hayes, M. A.; Kheterpal, I.; Ewing, A. G., Effects of Buffer pH on Electroosmotic Flow Control by an Applied Radial Voltage for Capillary Zone Electrophoresis. Anal. Chem 1993, 65, 27-31. 8. Xuan, X.; Li, D., Analytical study of Joule heating effects on electrokinetictransportation in capillary electrophoresis. Journal of Chromatography A 2004, 1064 (2005), 227-237. 9. Chien, R.-L.; Burgi, D. S., Optimization in Sample Stacking for High-Performance Capillary Electrophoresis. Anal. Chem 1991, 63 (18), 2042-2047. 10. Chien, R.-L.; Burgi, D. S., Sample Stacking of an Extremely Large Injection Volume in High-Performance Capillary Electrophoresis. Anal. Chem 1992, 64, 1046-1050. 11. Quirino, J. P.; Terabe, S., Sample stacking of cationic and anionic analytes in capillary electrophoresis. Journal of Chromatography A 2000, 902 (2000), 119-135. 12. Quin, W., Chemiluminescence Flow-Through Sensor for Copper Based on an Anodic Stripping Voltammetric Flow Cell and an Ion-Exchange Column with Immobilized Reagents. Anal. Chem 1998, 70, 3579-3584. 13. Chen, Y.; Lin, Z.; Chen, J.; Sun, J.; Zhang, L.; Chen, G. H., New capillary electrophoresis-electrochemiluminescence detection system equipped with an electrically heated Ru(bpy)3(2+)/multi-wall-carbon-nanotube paste electrode. J Chromatogr A 2007, 1172. 14. Carr, A.; Dickson, J.; DIckson, M.; Milofsky, R., Post-Column Ultra-Fast Co-Catalyzed Peroxyoxalate Chemiluminescence Detection in Capillary Electrophoresis and Capillary Electrochromatography. Chromatographia 2012, 55, 687-692. 15. Xu, X.; Li, L.; Weber, S. G., Electrochemical and opticaldetectors for capillary and chip separations. Trends in Analytical Chemistry 2007, 6 (1). 16. Durgbanshi, A.; K, W. T., Capillary electrophoresis and electrochemical detection with a conventional detector cell. Journal of Chromatography A 1998, 798, 289-296. 17. Swinney, K.; Bornhop, D. J., Detection in capillary electrophoresis. Electrophoresis 2000, 21, 1239-1250. 18. Stradiotto, N. R.; Yamanaka, H.; Valnice, M. B. Z., Electrochemical sensors: A powerful tool in analytical chemistry. J. Braz. Chem. Soc. 2003, 14 (2). 19. Dadoo, R.; Seto, A. G.; Colon, L. A.; Zare, R. N., End-Column Chemiluminescence Detector for Capillary Electrophoresis. Anal. Chem 1994, 66, 303-306.
Portagallo 38
20. Xu, Q.; JI, X.; Li, H.; Liu, J.; he, Z., An on-column fracture/end-column reaction interface for chemiluminescencedetection in capillary electrophoresis. Journal of Chromatography 2010, 1217, 5628-5634. 21. Huang, X.; Ren, J., Chemiluminescence detection forcapillary electrophoresis and microchip capillary electrophoresis. Trends in Analytical Chemistry 2006, 25 (2). 22. Tsukagoshi, K.; Nakahama, K.; Nakajima, R., Direct Detection of Biomolecules in a Capillary Electrophoresis−Chemiluminescence Detection System. Anal. Chem 2004, 76 (15), 4410-4415. 23. Shah, S. N. A.; Lin, J.-M., Recent advances in chemiluminescence based on carbonaceous dots. Advances in Colloid and Interface Science 2017, 241, 24-36. 24. Baeyens, W. R. G.; Schulam, S. G.; Calokerinos, A. C.; Zhao, Y.; Campana, A. M. G.; Nakashima, K.; Keukeleire, D. D., Chemiluminescence-based detection: principles and analytical applications in flowing streams and in immunoassays. Journal of Pharmaceutical and Biomedical Analysis 1998, 17, 941-953. 25. Liu, Y.; Lin, M.; Liu, L.; Peng, L.; Yong-hong, C.; Ren, S., Sensitive Chemiluminescence Immunoassay by Capillary Electrophoresis with Gold Nanoparticles. Anal. Chem 2011, 83, 1134-1143. 26. Santafe, A. A.-M.; Doumeche, B.; Blum, L. J.; Girard-Egrot, A. P.; Marquette, C. A., 1-Ethyl-3-Methylimidazolium Ethylsulfate/Copper Catalyst for the Enhancement of Glucose Chemiluminescent Detection: Effects on Light Emission and Enzyme Activity. Journal of Analytical Chemistry 2010, 82, 2401-2404. 27. Zhao, S.; Huang, Y.; Shi, M.; Liu, R.; Liu, Y. M., Chemiluminescence resonance energy transfer-based detection for microchip electrophoresis. Anal Chem 2010, 82 (5), 2036-41. 28. Khan, P.; Idrees, D.; Moxley, M. A.; Corbett, J. A.; Ahmad, F.; von Figura, G.; Sly, W.; Waheed, A.; Hassan, M., Luminol-Based Chemiluminescent Signals: Clinical and Non-clinical Application and Future Uses. Appl Biochem Biotechnol 2014. 29. Bao, J.; Regnier, F. E., Ultramicro enzyme assays in a capillary electrophoretic system. Journal of Chromatography 1992, 608 (1992), 217-224. 30. Yan, C.; Zou, X., 3.13.2 Models for the Mechanisms of Protein Binding. In Science Direct, Fig. 2. Schematic diagrams for the three binding models. (A) The lock-and-key model, B. i.-f. m., and (C) conformational-selection model., Ed. 2017. 31. Lineweaver–Burk plot of Michaelis–Menten kinetics. In Chem.LibreTexts, LibreTexts: 2020. 32. Michaelis-Menten Kinetics and Briggs-Haldane Kinetics. University of Washington. 33. Gilman, D.; Whisnant, A., Studies of reversible inhibition, irreversible inhibition, and activation of alkaline phosphates by capillary electrophoresis. Anal Biochem 2001, 307 (2002), 226-234. 34. Harmon, B. J.; Patterson, D. H.; Regnier, F. E., Electrophorectically mediated microanalysis of ethanol. Journal of Chromatography A 1993, 657 (1993), 429-434. 35. Patterson, D. H.; Harmon, B. J.; Regnier, F. E., Electrophoretically mediated microanalysis of calcium. Journal of Chromatography A 1994, 662, 389-395. 36. Gattu, S.; Crihfield, C. L.; Lu, G.; Bwanali, L.; Veltri, L. M.; Holland, L. A., Advances in enzyme substrate analysis with capillary electrophoresis. Methods 2018, 146, 93-106. 37. Fan, Y.; Scriba, G. K. E., Advances in-capillary electrophoretic enzyme assays. Journal of Pharmaceutical and Biomedical Analysis 2010, 53 (2010), 1076-1090. 38. Bankar, S. B.; Bule, M. V.; Singhal, R. S.; Ananthanarayan, L., Glucose oxidase - An overview Biotechnology Advances 2009, 27, 489-501.
Portagallo 39
39. BRENDA: The Comphrehensive Enzyme Information System. In 1.1.3.4: glucose oxidase, Technical University of Braunschwig: 2020. 40. Lineweaver-Burk plot for enzyme inibition. In NCBI. 41. Rogers, M. J.; Brandt, K. G., Multiple Inhibition Analysis of Aspergillus niger Glucose Oxidase by n-Glucal and Halide Ions. Biochemistry 1971, 10 (25), 4636-4640. 42. Rogers, M. J.; Brandt, K. G., Interaction of Halide Ions with Aspergillus niger Glucose Oxidase. Biochemistry 1971, 10 (25), 4630-4635. 43. Seaton, B., Indirect Determination of Enzyme Kinetics Using Capillary Electrophoresis with Chemiluminescence Detection. Appalachian State University: 2016.

Portagallo 40
Vita:
GraceAnna (Gracie) Taylor Portagallo was born on July 23rd, 1998 in Middletown, New
Jersey. Gracie will be graduating Cum Laude from Appalachian State University in May 2021
with a Bachelor of Science in Chemistry and a minor in Physics, as well as Departmental
Honors. She will begin her Master’s degree in Engineering Physics at Appalachian State
University in August 2021.