Embed Size (px)
Citation preview
Canadian EquitiEs GuidEd Portfolio
Canadian EquitiEs GuidEd Portfolio
March 2008
Portfolio, Action & Research Team
Nesbitt BurnsBMO R
Nesbitt BurnsBMO R
Canadian Equities Guided Portfolio — March 2008 �
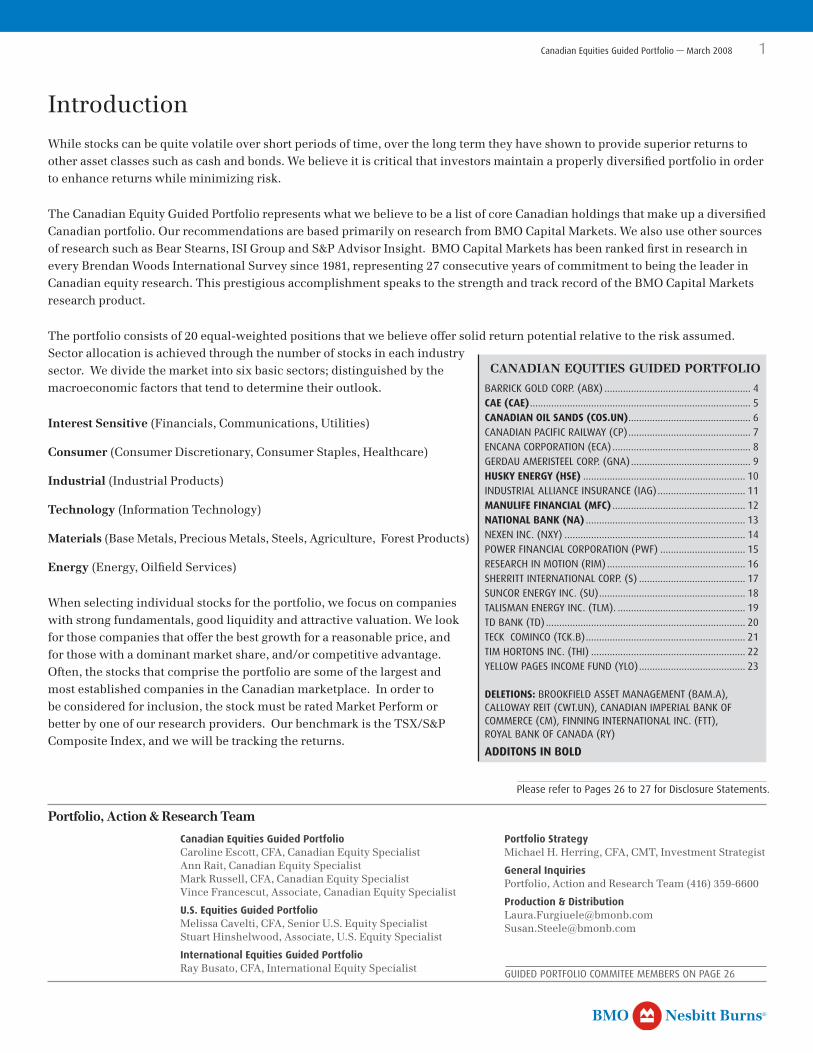
IntroductionWhile stocks can be quite volatile over short periods of time, over the long term they have shown to provide superior returns to other asset classes such as cash and bonds. We believe it is critical that investors maintain a properly diversified portfolio in order to enhance returns while minimizing risk.
The Canadian Equity Guided Portfolio represents what we believe to be a list of core Canadian holdings that make up a diversified Canadian portfolio. Our recommendations are based primarily on research from BMO Capital Markets. We also use other sources of research such as Bear Stearns, ISI Group and S&P Advisor Insight. BMO Capital Markets has been ranked first in research in every Brendan Woods International Survey since 1981, representing 27 consecutive years of commitment to being the leader in Canadian equity research. This prestigious accomplishment speaks to the strength and track record of the BMO Capital Markets research product.
The portfolio consists of 20 equal-weighted positions that we believe offer solid return potential relative to the risk assumed. Sector allocation is achieved through the number of stocks in each industry sector. We divide the market into six basic sectors; distinguished by the macroeconomic factors that tend to determine their outlook.
Interest Sensitive (Financials, Communications, Utilities)
Consumer (Consumer Discretionary, Consumer Staples, Healthcare)
Industrial (Industrial Products)
Technology (Information Technology)
Materials (Base Metals, Precious Metals, Steels, Agriculture, Forest Products)
Energy (Energy, Oilfield Services)
When selecting individual stocks for the portfolio, we focus on companies with strong fundamentals, good liquidity and attractive valuation. We look for those companies that offer the best growth for a reasonable price, and for those with a dominant market share, and/or competitive advantage. Often, the stocks that comprise the portfolio are some of the largest and most established companies in the Canadian marketplace. In order to be considered for inclusion, the stock must be rated Market Perform or better by one of our research providers. Our benchmark is the TSX/S&P Composite Index, and we will be tracking the returns.
Please refer to Pages 26 to 27 for Disclosure Statements.
canadian equities guided portfolio BARRICK GOLD CORP. (ABX) ....................................................... 4CAE (CAE) ................................................................................... 5CANADIAN OIL SANDS (COS.UN) .............................................. 6CANADIAN PACIFIC RAILWAY (CP) .............................................. 7ENCANA CORPORATION (ECA) .................................................... 8GERDAU AMERISTEEL CORP. (GNA) ............................................. 9HUSKY ENERGY (HSE) ............................................................. �0INDUSTRIAL ALLIANCE INSURANCE (IAG) ................................. ��MANULIFE FINANCIAL (MFC) .................................................. �2NATIONAL BANK (NA) ............................................................ �3 NEXEN INC. (NXY) .................................................................... �4POWER FINANCIAL CORPORATION (PWF) ................................ �5RESEARCH IN MOTION (RIM) .................................................... �6SHERRITT INTERNATIONAL CORP. (S) ........................................ �7SUNCOR ENERGY INC. (SU) ....................................................... �8TALISMAN ENERGY INC. (TLM). ................................................ �9TD BANK (TD) ........................................................................... 20TECK COMINCO (TCK.B) ............................................................ 2�TIM HORTONS INC. (THI) .......................................................... 22 YELLOW PAGES INCOME FUND (YLO) ........................................ 23 DELETIONS: BROOKFIELD ASSET MANAGEMENT (BAM.A), CALLOWAY REIT (CWT.UN), CANADIAN IMPERIAL BANK OF COMMERCE (CM), FINNING INTERNATIONAL INC. (FTT), ROYAL BANK OF CANADA (RY)
ADDITONS IN BOLD
Portfolio StrategyMichael H. Herring, CFA, CMT, Investment Strategist
General InquiriesPortfolio, Action and Research Team (416) 359-6600
Production & [email protected] [email protected]
Portfolio, Action & Research Team
Canadian Equities Guided PortfolioCaroline Escott, CFA, Canadian Equity Specialist Ann Rait, Canadian Equity SpecialistMark Russell, CFA, Canadian Equity SpecialistVince Francescut, Associate, Canadian Equity Specialist
U.S. Equities Guided PortfolioMelissa Cavelti, CFA, Senior U.S. Equity SpecialistStuart Hinshelwood, Associate, U.S. Equity Specialist
International Equities Guided Portfolio Ray Busato, CFA, International Equity Specialist GUIDED PORTFOLIO COMMITEE MEMBERS ON PAGE 26
Nesbitt BurnsBMO R
2 Canadian Equities Guided Portfolio — March 2008
Market Outlook
The outlook for the Canadian market remains positive, with an expected total return of 7–10% over the next year. After a significant sell-off in January, stock markets have partially recovered as confidence has returned in the ability of overseas economies to weather a U.S. recession. The TSX/S&P had corrected by as much as 18% from last summer’s high and is now down less than 8%. The recovery in the S&P/TSX over the past month also derives from better-than-expected earnings in the fourth quarter and firmer-than-expected commodity prices. BMO Capital Markets Strategist Ben Joyce believes that there is room for a further rally as investors recognize the mildness of the current cyclical decline in earnings. His one-year target for the TSX/S&P Composite Index is 14,500, resulting in a forecast price return of approximately 6.4%.
From a sector perspective, we recommend an Underweight position in Financials and an Overweight position in Materials, Energy and Industrials. We continue to recommend a Market Weight position in Consumer Products and Technology. This quarter we have reduced our exposure to Financials and increased our exposure to Energy.
Last quarter we spoke about the cautious outlook for Canadian financials and the expectation that this sector would generate market-type returns, at best, over the near to medium term. The performance of the sector since the last quarterly update, December 3, 2007, has been very weak and in hindsight, expecting market-type returns was optimistic. The sector actually declined about 12% over the period, versus the overall market, which was slightly positive, with a return of less than 1%. BMO Capital Markets continues to believe that the turmoil in credit markets will likely translate into slower loan growth and increasing loan losses, which will act to dampen the earnings outlook of the Canadian banks. As such, we have reduced our exposure to financial services, with the removal of Brookfield Asset Management (BAM.A) and Calloway REIT (CWT.UN) from the Primary Recommendations list. In addition, we continue to favour insurance companies in this environment and have therefore replaced CIBC (CM) with Manulife financial (MFC) in the Primary Recommendations list. We have also replaced Royal Bank (RY) with National Bank (NA) this quarter. Royal Bank, Brookfield Asset Management, Calloway REIT and CIBC all remain as Alternatives in the Canadian Equities Guided Portfolio
We continue to recommend a Market Weight position in Consumer and Technology. While there are many interesting companies within these sectors, and many reasons for an optimistic outlook — stable earnings growth and defensive characteristics for consumer staples — there are also significant headwinds for these sectors. The strong Canadian dollar is one of most prominent issues impacting many of the companies in these sectors. We have not made any changes to the stocks.
We have a slight Overweight bias toward Industrials, as there are many well-positioned companies within the sector that benefit from the continued secular growth story of materials. However, we believe that selection is key, as there are also many Industrial companies within Canada that will be hurt by the strong Canadian dollar. Within the Industrials sector, we have replaced Finning (FTT) with CAE (CAE).
We continue to believe that the basic materials sector will deliver better-than-average returns over the near to medium term. The continued strong economic growth in regions such as China and India will continue to drive strong demand for basic commodities for some time. As such, we continue to recommend an Overweight position in Materials. We have not made any changes to the stocks in the Primary Recommendations list for materials.
We have increased our exposure to Energy to an Overweight position. Energy prices remain high and we believe that the returns of the TSX/S&P Composite Index will be driven by the resource sectors, including energy. While Canadian energy companies’ financial results have been somewhat hampered by continued high operating costs, many of the companies are generating significant levels of free cash flow, are trading at attractive valuations and have attractive growth profiles. We have added Husky (HSE) and Canadian Oil Sands Trust (COS.UN) as Primary Recommendations.
We have made the following changes to the portfolio this quarter:
§ Brookfield Asset Management (BAM.A) has been removed from the Primary Recommendations list, but remains as an Alternative within the Canadian Equities Guided Portfolio. This removal is due to our shift toward reducing exposure to financials and does not reflect any fundamental change to the outlook for Brookfield.
Nesbitt BurnsBMO R
Canadian Equities Guided Portfolio — March 2008 3
§ Calloway REIT has also been removed from the Primary list in order to reduce our exposure to financials. Calloway was recently downgraded to Sector Perform from Outperform due to the analysts concern about a funding shortfall. Calloway has committed to spend $1.4 billion, which represents over 35% of its enterprise value. This was not a concern when capital was plentiful at a relatively low cost, however the credit markets have deteriorated and the analyst believes that funding concerns will act as an overhang on the company. Calloway remains as an Alternative on the Guided Portfolio.
§ We have also removed CIBC (CM) from the Primary Recommendations list and replaced it with Manulife Financial (MFC). This move reflects our preference for insurance companies over banks in this environment. CIBC was downgraded by BMO Capital Markets in early December, after the bank announced that it would be taking significant charges related to the turmoil in credit markets. Following the recent release of Q1 results, we continue to believe there is further risk of additional charges at CIBC.
§ We have also removed Royal Bank (RY) from the Primary Recommendations list following the downgrade by BMO Capital Markets Research to an Underperform rating. It has been replaced with National Bank (NA). BMO Capital Markets analyst Ian de Verteuil believes that while the first quarter results for RY included a number of one-time items that should not re-occur, it is clear that the bank did benefit from unusually strong trading revenue. The bank will likely continue to face headwinds in the current capital markets environment. BMO Capital Markets Research is concerned that the bank will continue to face difficult earnings comparisons going forward, and that the current share price may not reflect this risk
§ CAE (CAE) has replaced Finning (FTT) as a Primary Recommendation within the Industrials sector. Finning was also removed on the back of the recent rating downgrade by BMO Capital Markets. Finning was downgraded to Market Perform from Outperform following the release of its year-end results and the fact that the operating margins in the Chilean and U.K. divisions were not improving as expected. We continue to view Finning as a core holding for investors. However, we prefer to wait to see some improvement in the operating margins of those divisions before we add new money to this name. Finning has been moved to the Alternatives list within the Canadian Equities Guided Portfolio.
§ Canadian Oil Sands (COS.UN) and Husky (HSE) have been added to the portfolio to reflect the increased exposure to Energy.
This report is priced as of February 29, 2008.
Nesbitt BurnsBMO R
4 Canadian Equities Guided Portfolio — March 2008
Barrick Gold Corp. (ABX)
Current Price: US$51.20 Sector: Materials
Company Overview
Barrick is the world’s largest gold producer with annual gold production in excess of eight million ounces. The company has 27 operating mines and many advanced exploration and development projects located across five continents. Barrick has the largest reserve base in the industry, with 123 million ounces of proven and probable gold reserves. It also has significant copper and silver reserves: six billion pounds of copper and 964 million ounces of silver.
Investment Thesis
Barrick holds the premiere position within the global gold sector. It is the dominant stock in the sector in terms of market capitalization, annual production and gold reserves. The company is expected to maintain this position through organic growth and acquisitions.
Barrick has a significant new gold mine pipeline that is forecast to add more than 3.5 million ounces of annual production by 2013. The new developments will offset the natural depletion of existing assets, and production is expected to be maintained in the range of 8–10 million ounces per year into the foreseeable future. The gold mines are expected to achieve cash flow payback within five years of start-up, using prevailing spot gold prices.
Barrick has the gold mining industry’s strongest and only ‘A’-rated balance sheet, which positions it very well when evaluating opportunities (exploration and acquisition) as they arise without needing to pause for financing.
Barrick offers investors exposure to a large cap gold stock with a solid management team and track record, a sustainable production profile, a healthy balance sheet and attractive relative value. BMO Capital Markets’ NPV for Barrick is US$18.99 per share, using a 10% discount rate. The 8% discounted NPV based on spot commodity prices is approximately US$35.32 per share.
Recent Developments
In conjunction with the year-end results, Barrick also announced an agreement with Rio Tinto to purchase the remaining 40% interest in the Cortez JV for a total cash consideration of US$1.695 billion. The deal last year with Arizona Star secures a 51% stake in the Cerro Casale project in Chile. Barrick has acquired eight new gold mines that will add to its strong pipeline of development projects. The company’s eight proposed gold mines are estimated to require investment of over $8 billion over the next five years. BMO Capital Markets expects Barrick to have sufficient resources to fulfill this expenditure profile.
Risks
There are a number of risks that are inherent within the mining industry, such as technical and operating risk, resource risk, geopolitical risk, and permitting risk. Fluctuation in commodity prices will also affect the financial results and the prospects of the company, as will the operating costs.
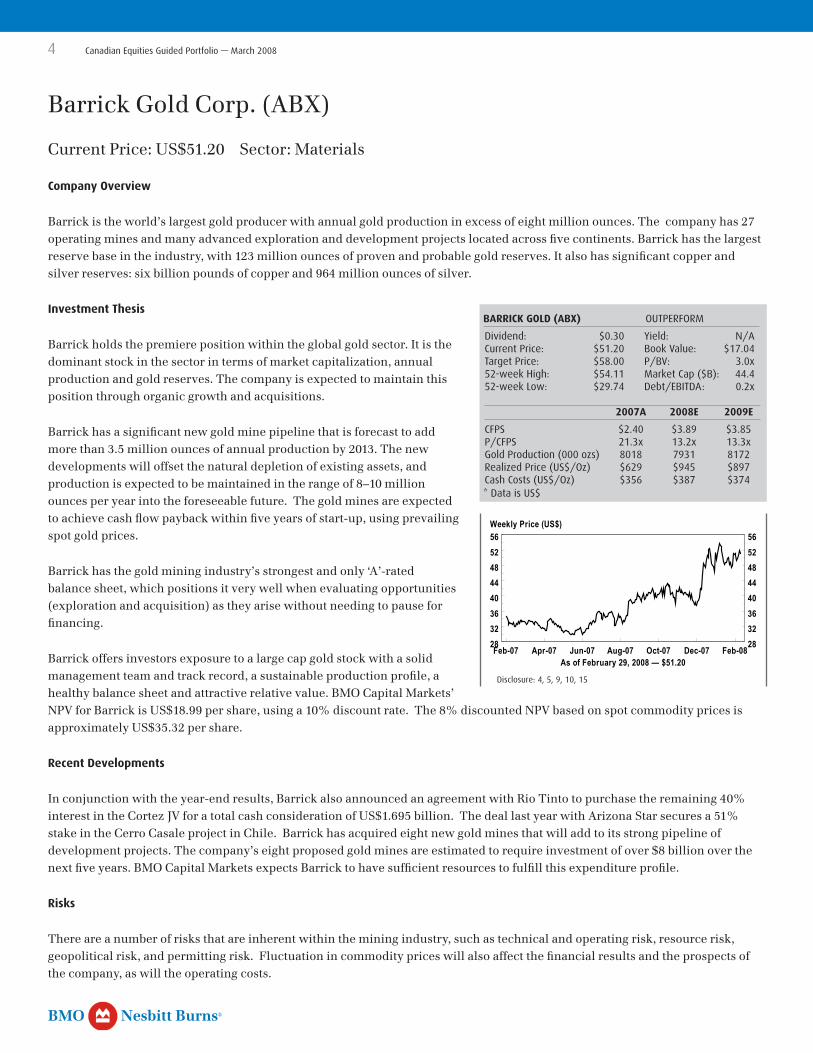
BARRICK GOLD (ABX) OUTPERFORM
Dividend: $0.30 Yield: N/ACurrent Price: $5�.20 Book Value: $�7.04Target Price: $58.00 P/BV: 3.0x52-week High: $54.�� Market Cap ($B): 44.452-week Low: $29.74 Debt/EBITDA: 0.2x
2007A 2008E 2009E
CFPS $2.40 $3.89 $3.85P/CFPS 2�.3x �3.2x �3.3xGold Production (000 ozs) 80�8 793� 8�72Realized Price (US$/Oz) $629 $945 $897Cash Costs (US$/Oz) $356 $387 $374* Data is US$ ABX CN Equity
Feb-07 Apr-07 Jun-07 Aug-07 Oct-07 Dec-07 Feb-082832364044485256
2832364044485256
As of February 29, 2008 — $51.20
Weekly Price (US$)
Disclosure: 4, 5, 9, �0, �5
Nesbitt BurnsBMO R
Canadian Equities Guided Portfolio — March 2008 5
CAE Inc. (CAE)
Current Price: $12.40 Sector: Industrials
Company Overview
CAE is a world leader in design and production of flight simulation systems used in both commercial and military applications. It also provides training services through its network of 119 simulators. CAE operates in four market segments: civil simulation and training, and military simulation and training.
Investment Thesis
CAE has a unique leadership position in the attractive pilot training market. BMO Capital Markets is forecasting significant earnings growth over the next two years, and the current backlog of $2.7 billion, as of the end of December, provides visibility to the earnings forecast.
The outlook for the airline industry continues to be quite positive, as we continue to see strong passenger traffic on a global basis. Historically, the U.S. and developed nations have accounted for the bulk of commercial aircraft demand. However, the significant growth of low-cost carriers in emerging markets such as Asia/Pacific has created a new source of demand. In addition, the shifting demographics of North America and Europe also bode well for CAE’s pilot training business. There is a global pilot shortage, and this creates strong demand for flight simulators.
In addition, strong global demand for military products and services is expected to continue in the foreseeable future. Many countries are increasing military spending in the next few years, which adds support to this division.
Recent Developments
CAE reported strong fiscal third-quarter results (March year-end) as three of the four segments showed top-line growth. However, it was exceptional margins in the civil product segment that led to the better-than-expected results. Operating income increased due to higher product mix, higher volume and sustained cost performance. Management indicated that it now expects to book orders for slightly more than its previous guidance of 34 simulators in fiscal 2008 and that activity levels for 2009 appear quite strong.
Risks
While CAE has Canadian dollar risk (more revenue in U.S. dollars than costs), it hedges its product sales as it signs contracts, hence the currency risk is not as great as the perception. Additional risks include lengthy and unpredictable sales cycles; a reduction in defence spending; volatility in the global airline industry; geopolitical risk; cancellations in the backlog; and unfavourable labour relations.
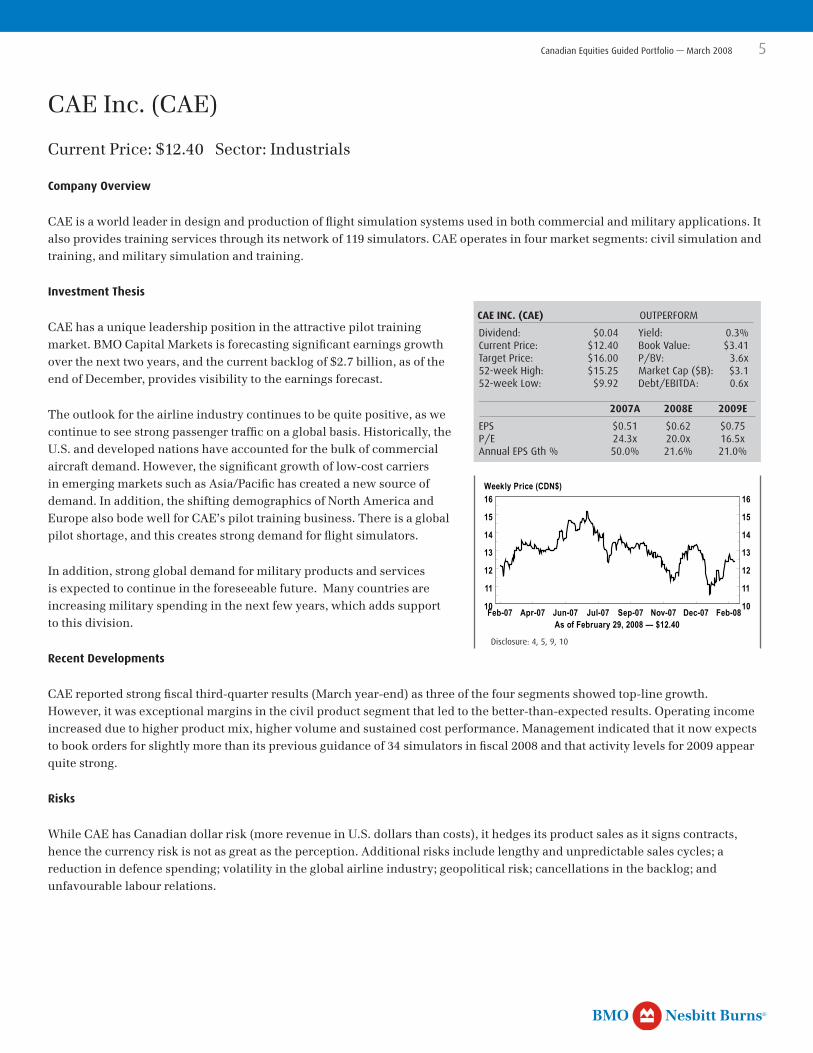
CAE INC. (CAE) OUTPERFORM
Dividend: $0.04 Yield: 0.3%Current Price: $�2.40 Book Value: $3.4�Target Price: $�6.00 P/BV: 3.6x52-week High: $�5.25 Market Cap ($B): $3.�52-week Low: $9.92 Debt/EBITDA: 0.6x
2007A 2008E 2009E
EPS $0.5� $0.62 $0.75P/E 24.3x 20.0x �6.5xAnnual EPS Gth % 50.0% 2�.6% 2�.0%CAE CN Equity
Feb-07 Apr-07 Jun-07 Jul-07 Sep-07 Nov-07 Dec-07 Feb-0810
11
12
13
14
15
16
10
11
12
13
14
15
16
As of February 29, 2008 — $12.40
Weekly Price (CDN$)
Disclosure: 4, 5, 9, �0
Nesbitt BurnsBMO R
6 Canadian Equities Guided Portfolio — March 2008
Canadian Oil Sands Trust (COS.UN)
Current Price: $41.70 Sector: Energy
Company Overview
Canadian Oil Sands is an open-end investment trust created from the merger of the former Canadian Oil Sands Trust and Athabasca Oil Sands Trust in July 2001. Canadian Oil Sands Trust owns a 36.74% working interest in the Syncrude joint venture at Fort McMurray, Alberta. Syncrude is the world’s largest producer of Syncrude Sweet Blend, a light, sweet synthetic crude oil.
Investment Thesis
Canadian Oil Sands is attractively valued at current levels, as it is trading at a slight premium to the BMO Capital Markets’ 2008 Net Asset Value estimate discount of $43.92 per unit. This valuation level is generally in line with the peer group of oil sands companies.
The trust offers investors exposure to the ever-increasing profile of Alberta oil sands production, without some of the capital cost risk associated with earlier-stage projects. In addition, investors collect a yield of approximately 7.5% while gaining access to this significant, strategic asset base.
Recent Developments
Canadian Oil Sands announced full year 2007 results that were slightly above expectations, with cash flow from operations of $3.22 per unit and oil production of 112,032 barrels per day (bbl/d). In addition to the strong results, the trust also announced a 36% increase to the distribution rate, bringing the quarterly rate to $0.75 per unit, or $3.00 per year. This increase was expected and the decision to raise it reflects the trust’s objective to increase the payout ratio of free cash flow and conserve tax pools prior to the tax changes scheduled for 2011. The Trust also indicated that it is continuing to evaluate alternative structures and expects that it will maintain its current trust structure until 2011, after which it will most likely convert to a corporate structure.
In addition, management noted that it is still in discussions with the Alberta government regarding an equitable solution to transition the company’s oil sands royalties to the new generic framework by 2016.
Risks
Canadian Oil Sands is subject to the general risks that are applicable to all resource companies: volatile commodity prices, supply disruptions and cost pressure. In addition, given the labour shortage issue and cost pressure in the oil sands regions (Fort McMurray in particular), Canadian Oil Sands has an increased risk of progress delays associated with future expansions.
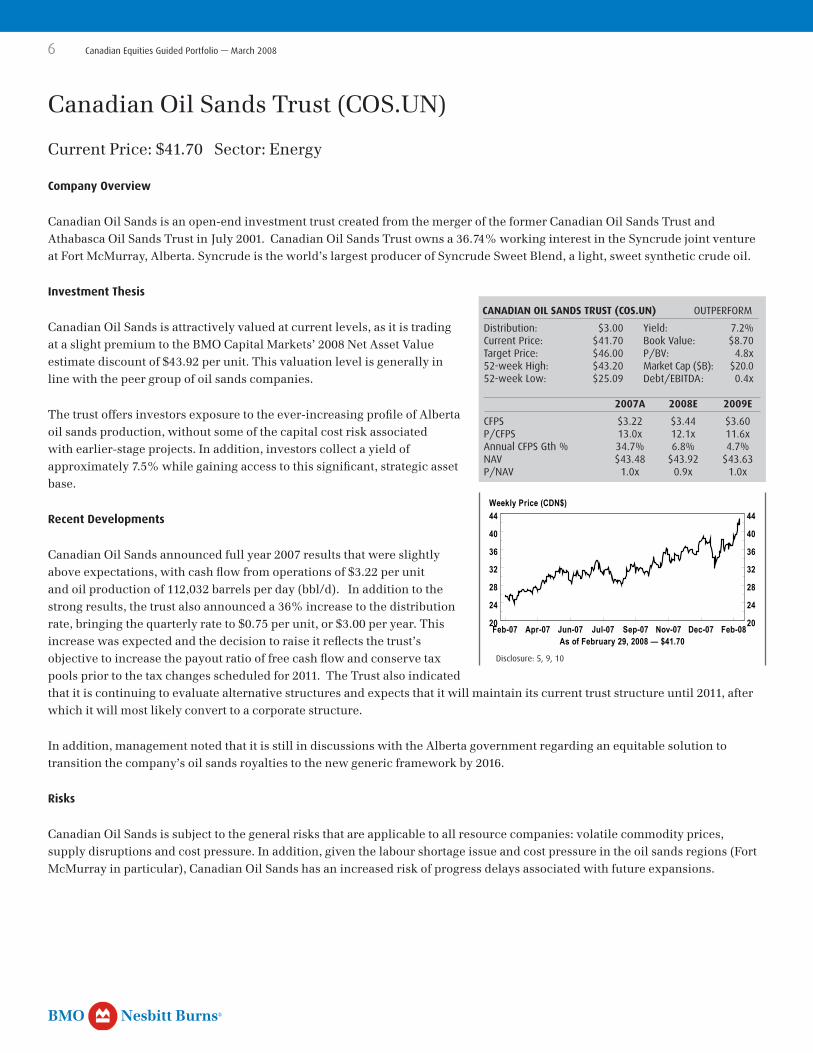
CANADIAN OIL SANDS TRUST (COS.UN) OUTPERFORM
Distribution: $3.00 Yield: 7.2%Current Price: $4�.70 Book Value: $8.70Target Price: $46.00 P/BV: 4.8x52-week High: $43.20 Market Cap ($B): $20.052-week Low: $25.09 Debt/EBITDA: 0.4x
2007A 2008E 2009E
CFPS $3.22 $3.44 $3.60P/CFPS �3.0x �2.�x ��.6xAnnual CFPS Gth % 34.7% 6.8% 4.7%NAV $43.48 $43.92 $43.63P/NAV �.0x 0.9x �.0xCOS-U CN Equity
Feb-07 Apr-07 Jun-07 Jul-07 Sep-07 Nov-07 Dec-07 Feb-0820
24
28
32
36
40
44
20
24
28
32
36
40
44
As of February 29, 2008 — $41.70
Weekly Price (CDN$)
Disclosure: 5, 9, �0
Nesbitt BurnsBMO R
Canadian Equities Guided Portfolio — March 2008 7
Canadian Pacific Railway (CP)
Current Price: $71.54 Sector: Industrials
Company Overview
Canadian Pacific Railway (CPR) is one of Canada’s oldest corporations and provides rail and intermodal freight transportation services over a 14,000-mile network extending from Montreal to Vancouver, and through the U.S. Midwest and Northeast. The company holds a significant market position in the transportation of Western Canadian bulk commodities, which account for a large portion of CPR’s revenues.
Investment Thesis
The railroad sector continues to offer excellent long-term growth potential. While the next year could be a transition year for the Canadian rails as their customers adjust to a higher Canadian dollar, we believe the long-term secular story remains well intact.
The U.S. economy is under significant stress due to the housing meltdown and the subprime mess. The prospects for growth in Canada and the rest of the world in 2008 are much better than they are in the United States. CPR has less exposure to the North American economy than its peers, as its business is focused on bulk export and the domestic Canadian consumer. CP has a much greater focus on international trade, with greater exposure to grain, potash, and metallurgical coal. While the opportunity to increase volumes and/or rates is limited due to structural issues, the continued favourable outlook for commodities provides protection for CPR.
CPR is trading at a price to earnings ratio of about 13x, which is attractive when considering the expectations for annual earnings growth of about 13%.
CPR is forecast to generate annual earnings growth in the range of 13–18% over the next two years. This is similar to the growth that has been delivered over the past two years, and is expected to be greater than the group average.
Recent Developments
CPR recently reported its 2007 results with EPS of $4.32, up from $3.95 in 2006. Late last year, CPR announced an agreement to acquire Dakota, Minnesota & Eastern Railroad Corporation and its subsidiaries (DM&E) for US$1.48 billion. With this acquisition, CP expands its current network by approximately 2,500 miles and increases its access to U.S. Midwest markets including agri-products, coal and ethanol. CPR believes that it can double the EBITDA of the DME over a three- to five-year timeframe. BMO Capital Markets believes that DM&E alone will add $0.15 to $0.17 in earnings to CPR.
Risks
The freight transportation industry is highly competitive, and CPR faces tough competition for freight transportation in Canada and the U.S., including competition from other railways and trucking companies. CPR’s freight volumes and revenues are sensitive to factors such as weather, commodity pricing, and import/export markets. In addition, fuel costs constitute a large portion of operating costs and a large portion of the workforce is unionized.
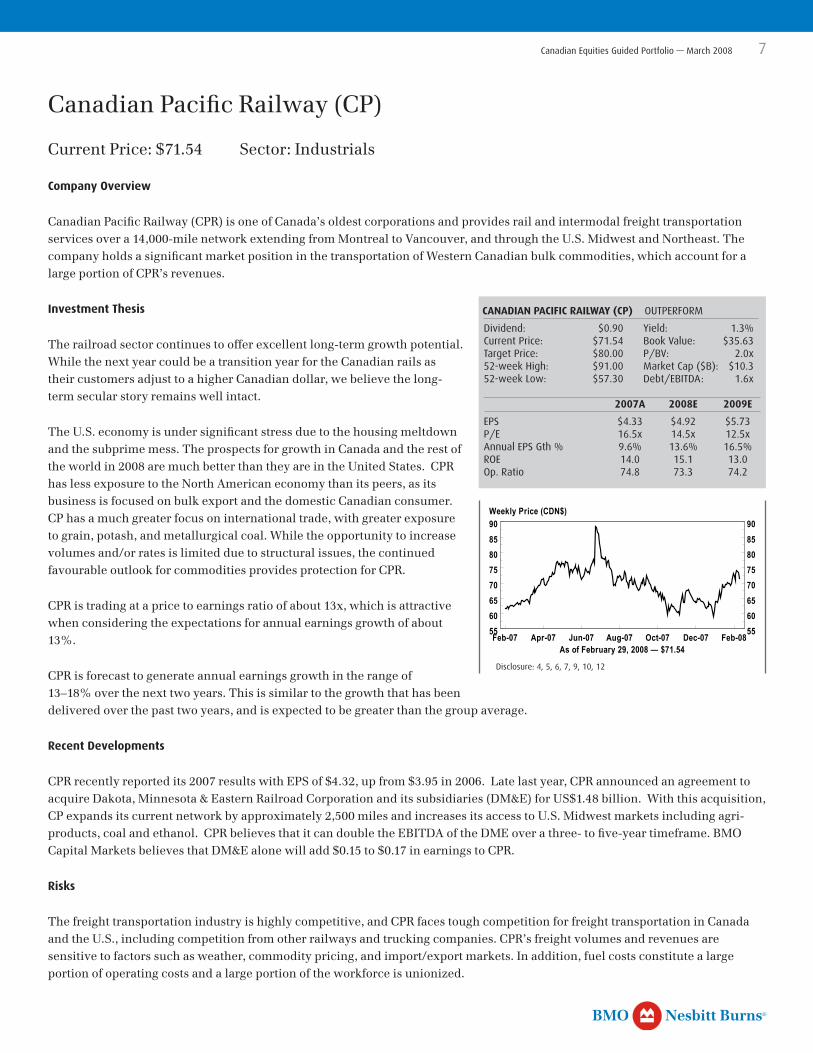
CANADIAN PACIFIC RAILWAY (CP) OUTPERFORM
Dividend: $0.90 Yield: �.3%Current Price: $7�.54 Book Value: $35.63Target Price: $80.00 P/BV: 2.0x52-week High: $9�.00 Market Cap ($B): $�0.352-week Low: $57.30 Debt/EBITDA: �.6x
2007A 2008E 2009E
EPS $4.33 $4.92 $5.73P/E �6.5x �4.5x �2.5xAnnual EPS Gth % 9.6% �3.6% �6.5%ROE �4.0 �5.� �3.0Op. Ratio 74.8 73.3 74.2CP CN Equity
Feb-07 Apr-07 Jun-07 Aug-07 Oct-07 Dec-07 Feb-085560657075808590
5560657075808590
As of February 29, 2008 — $71.54
Weekly Price (CDN$)
Disclosure: 4, 5, 6, 7, 9, �0, �2

Nesbitt BurnsBMO R
8 Canadian Equities Guided Portfolio — March 2008
EnCana Corporation (ECA)
Current Price: $75.03 Sector: Energy
Company Overview
EnCana is a leading North American unconventional natural gas and integrated oil sands company. It is among the largest holders of oil and gas resource lands in onshore North America with natural gas representing over 80% of production. The majority of EnCana’s operations are located in Canada and the United States and the company is also engaged in select exploration activities internationally. In January 2007, EnCana, with ConocoPhillips, completed the creation of an integrated heavy oil business. This venture provides greater certainty for EnCana’s oil sands projects and gives EnCana immediate participation in the North American refining industry.
Investment Thesis
EnCana has a strong business risk profile, reflecting the company’s large net proven reserve base and its sizable undeveloped land holdings. The recently created business venture with ConocoPhillips provides EnCana with a meaningful downstream presence in the U.S. Midwest and mid-continent markets and medium- and long-term potential for Canadian crude oil exports. By focusing on these resource plays, the company believes that it can add production and reserves in North America with lower geopolitical risk than some of its competitors. This strategy will also slow the rate of decline in its asset base and position it to grow production at a more predictable rate. Since 2002, EnCana has divested over US$13.5 billion in non-core assets, strengthened its North American asset base and purchased over 270 million shares under its normal course issuer bid. Overall, EnCana possesses a vast, long-life unconventional natural gas asset base and integrated oil sands business. The company’s management is focused on surfacing shareholder value through its share repurchase program and other initiatives that will crystallize value for shareholders.
Recent Events
While EnCana reported Q4 cash flow that was below expectations, the company managed to exceed operating and cash flow guidance for the year, contrary to many of its North American peers. In addition, the company did an excellent job of growing the reserve base, replacing 227% of production at an average cost of roughly US$13.60/boe. This compares to 197% and US$11.29/boe in 2006 (excluding dispositions).
BMO Capital Markets says the new Alberta government royalty framework that takes effect January 2009 will only slightly increase EnCana’s royalties. This is largely because of higher conventional crude oil and bitumen royalties. It expects there will be very little effect on the natural gas royalties for Encana due to its high mineral rights ownership. In early November, the company acquired the remaining interest in the Amoruso Field in East Texas for US$2.55 billion. The transaction is positive because EnCana knows what it is purchasing (given it is the operator) and the economics appear attractive on a full development basis.
Risks
There are a number of risks that are common to resource companies, such as a substantial or extended decline in crude oil and natural gas prices, hedging activities, exchange rate fluctuations, failure to acquire additional crude oil and natural gas reserves and environmental legislation. As well, the potential of extraordinary operational events, such as well blow-outs, pipeline breaks, or other operating problems could have a material impact on the company’s share price.
ENCANA CORPORATION (ECA) OUTPERFORM
Dividend: $�.60 Yield: 2.�%Current Price: $75.03 Book Value: $27.60Target Price: $75.00 P/BV: 2.7x52-week High: $77.29 Market Cap ($B): $53.�52-week Low: $53.67 Debt/EBITDA: �.2x
2007A 2008E 2009E
CFPS $�0.83 $��.59 $��.46P/CFPS 6.9x 6.5x 6.5xAnnual CFPS Gth % 28.6% 7.0% -�.�%NAV $79.50 $88.94 $96.83P/NAV 0.9x 0.8x 0.8xECA CN Equity
Feb-07 Apr-07 Jun-07 Aug-07 Oct-07 Dec-07 Feb-085256606468727680
5256606468727680
As of February 29, 2008 — $75.03
Weekly Price (CDN$)
Disclosure: 2, 3, 4, 5, 7, 9, �0

Nesbitt BurnsBMO R
Canadian Equities Guided Portfolio — March 2008 9
Gerdau Ameristeel Corp. (GNA)
Current Price: $14.57 Sector: Materials
Company Overview
Gerdau Ameristeel is the fourth-largest overall steel company in North America and it is one of the largest producers of long products in North America. Through a combined network of 16 mills, it has annual manufacturing capacity in excess of 8.9 million tons of finished steel. Gerdau’s mini mills are integrated with 43 downstream businesses that produce specialty steel products and fabricated steel mainly for use in the construction and industrial markets. The Gerdau Group is the majority shareholder of Gerdau Ameristeel, which offers Gerdau Ameristeel unique stability in a cyclical industry.
Investment Thesis
In contrast with the flat-rolled market, pricing for long products in the United States has stayed comparatively firm. The long products market is dominated by three large players (Gerdau, Nucor, and Commercial Metals), which helps to keep a stable pricing environment. What makes Gerdau a great investment in times of uncertainty is the ability of the company and its leading competitors to manage supply to the level of demand. In addition, residential housing is not a significant source of demand for long products, and prices are not sensitive to the housing market. Long products are primarily found in non-residential construction and infrastructure. Every indication is that demand for these products continues to be very stable.
While Gerdau is a steel producer, given the business mix and the source of demand, it is more similar to an integrated infrastructure company. In essence, Gerdau’s products are found anywhere you find concrete: bridges and tunnels, commercial construction, highways, etc.
Gerdau is forecast to generate significant levels of free cash flow over the next two years, which can be used for debt reduction and/or additional special dividends.
Recent Developments
The company reported Q4 EPS of $0.37, slightly better than the consensus estimate of $0.33. However, Gerdau is a story about free cash flow, as the acquisition of Chaparral has added significant non-cash charges to the company’s Income Statement. As an example, in 2008, amortization and depreciation chares will total $300 million compared to capital spending requirements of $200 million.
The USITC recently elected to uphold existing duties against rebar from seven different countries including China, which will help to ensure that the Chinese will not undermine rebar prices in the United States.
Risks
Overcapacity in the steel industry is a risk for Gerdau as expansion of steel production around the world, combined with increases in imports to North America, could put prices of Gerdau’s products under pressure, affecting its margins. In addition, scrap is a primary raw material for Gerdau. Rising scrap and other input costs could potentially impair the company’s profitability.
GERDAU AMERISTEEL (GNA) OUTPERFORM
Dividend: $0.08 Yield: 0.5%Current Price: $�4.57 Book Value: $8.94Target Price: $�8.00 P/BV: �.6x52-week High: $�7.75 Market Cap ($B): $6.352-week Low: $�0.28 Debt/EBITDA: �.6x
2007A 2008E 2009E
EPS $�.65 $�.65 $�.85P/E 8.8x 8.8x 7.9xAnnual EPS Gth % 24.�% 0.0% �2.�%*Price, target and cap C$, all other data US$ GNA CN Equity
Feb-07 Apr-07 Jun-07 Aug-07 Oct-07 Dec-07 Feb-0810
12
14
16
18
10
12
14
16
18
As of February 29, 2008 — $14.57
Weekly Price (CDN$)
Disclosure: 2, 3, 7, 9, �0
Nesbitt BurnsBMO R
�0 Canadian Equities Guided Portfolio — March 2008
Husky Energy (HSE)
Current Price: $41.70 Sector: Energy
Company Overview
Husky was formed in August 2000, through the combination of Renaissance Energy and privately held Husky Oil. It is an integrated oil and gas company with a diverse portfolio of resource assets. It is active in the East Coast offshore, Western Canada and offshore China. The company owns and operates substantial midstream infrastructure in Western Canada, including a heavy oil upgrader, gas processing facilities and crude oil pipelines.
Investment Thesis
Husky’s share price is trading at a discount to the peer group average, while the company offers an attractive long-term growth profile and is forecast to show a meaningful improvement in profitability over the next few years. Given the strong free cash flow generation, there is the possibility of a special dividend in 2008.
Husky remains focused on developing high-return projects offshore the East Coast of Canada, China and Indonesia, as well as progressing the development of its integrated oil sands business.
The company has done a commendable job of growing its asset base. For 2007, Husky again grew its proven reserves, replacing 112% of 2007 production.
Recent Developments
Husky reported fourth-quarter results that were weaker than the BMO Capital Markets forecast. The weakness is primarily attributable to lower upstream production and weaker-than-expected realized refining margins in the U.S. downstream business. The White Rose operation on the East Coast underwent unplanned maintenance in December, which has continued into Q1/08. However, Husky has not changed its 2008 production guidance. There was downtown scheduled for White Rose maintenance in Q3/08, which has been moved to this quarter.
As previously mentioned, the company has grown its proven reserves, replacing 112% of production in 2007 by adding about 154 million boe of proven reserves, primarily through new extensions and discoveries. The company spent $2.4 billion in the upstream business, which implies proven reserve replacement costs of roughly $15.50/boe. This compares to $17.50 last year.
Risks
Husky is subject to the general risks that are applicable to all resource companies: volatile commodity prices, supply disruptions and cost pressure. In addition, given that Husky operates internationally, it is also subject to additional geopolitical risk. The potential of extraordinary upstream or downstream operational events, such as well blow-outs, pipeline breaks, unexpected refinery shutdowns or other environmental issues, could have a significant impact on the share price.
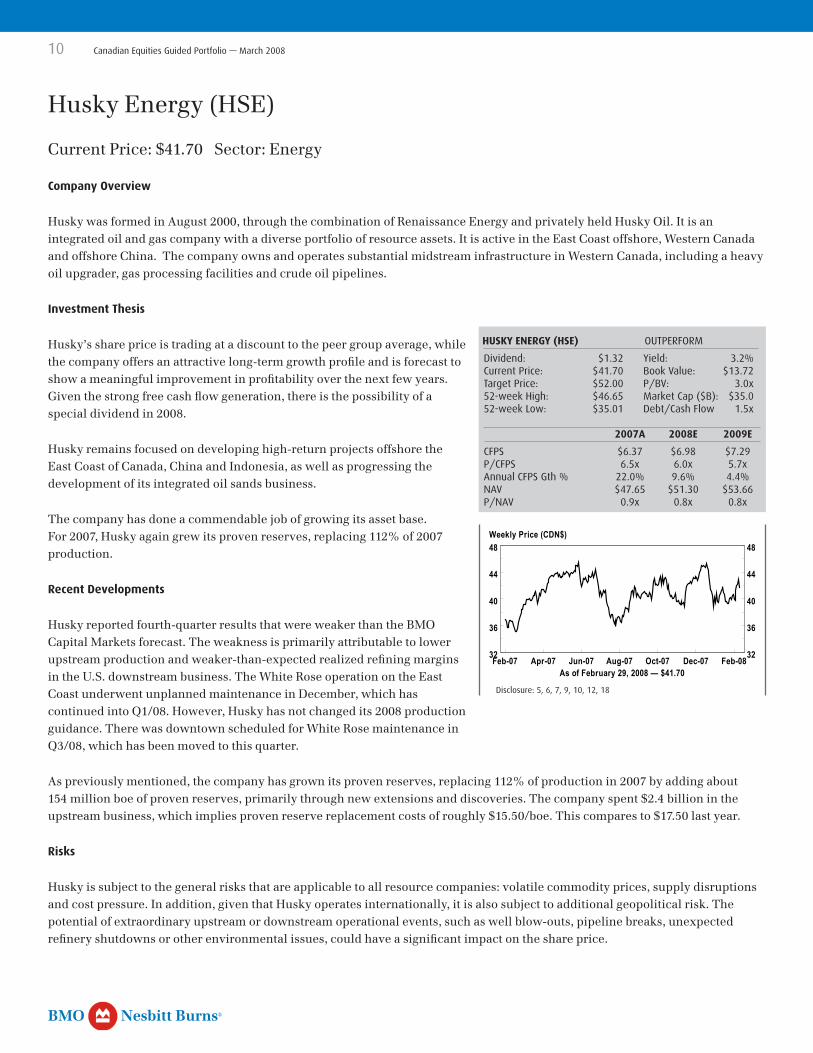
HUSKY ENERGY (HSE) OUTPERFORM
Dividend: $�.32 Yield: 3.2%Current Price: $4�.70 Book Value: $�3.72Target Price: $52.00 P/BV: 3.0x52-week High: $46.65 Market Cap ($B): $35.052-week Low: $35.0� Debt/Cash Flow �.5x
2007A 2008E 2009E
CFPS $6.37 $6.98 $7.29P/CFPS 6.5x 6.0x 5.7xAnnual CFPS Gth % 22.0% 9.6% 4.4%NAV $47.65 $5�.30 $53.66P/NAV 0.9x 0.8x 0.8xHSE CN Equity
Feb-07 Apr-07 Jun-07 Aug-07 Oct-07 Dec-07 Feb-0832
36
40
44
48
32
36
40
44
48
As of February 29, 2008 — $41.70
Weekly Price (CDN$)
Disclosure: 5, 6, 7, 9, �0, �2, �8
Nesbitt BurnsBMO R
Canadian Equities Guided Portfolio — March 2008 ��
Industrial Alliance Insurance (IAG)
Current Price: $35.20 Sector: Financials
Company Overview
Quebec-based Industrial Alliance is the fifth-largest life insurance company in Canada. The company collects approximately 97% of its premiums and deposits in Canada and has a network of over 1,500 exclusive agents and 12,000 brokers that span across Canada, including Quebec. Industrial Alliance provides a wide range of protection and wealth management products through its extensive multi-channel distribution network.
Investment Thesis
The operating and financial results from Industrial Alliance continue to improve. Overall, the company offers a better balance of sales growth, with life insurance sales gaining momentum after earlier declines. The earnings profile is also a nice balance of individual life insurance (approximately 42%) and individual wealth management (approximately 32%). The success of the Clarington acquisition provides Industrial Alliance’s wealth management business with strong business momentum. In addition, this business offers higher Returns on Equity than some of the more traditional insurance businesses and generally trades at higher multiples in the market. While Industrial Alliance has historically traded at a discount multiple relative to its peer group, BMO Capital Markets believes that a narrowing of that historic discount is warranted given the business mix and strong earnings momentum. Industrial Alliance has consistently demonstrated an ability to grow in excess of industry growth rates, and BMO Capital Markets believes that it has the ability to continue to grow in excess of its market share in all lines of business.
In addition, Industrial Alliance is less exposed to deteriorating credit quality and has no exposure to the weak U.S. dollar.
Recent Developments
Industrial Alliance reported another strong quarter in Q4/07, with EPS of $0.78, a 10% increase despite a challenging environment. Premiums and deposits were up 10%, primarily driven by strong mutual fund and insurance sales. The value of new business for the year rose 26% and assets under management increased 13%. Overall, it was another excellent quarter in terms of new business.
IAG has increased its annualized dividend over 60% in the last two years, and while we do not expect the dividend to continue to grow at that rate, we do expect dividends to grow in line with earnings growth.
Risks
Industrial Alliance manages asset portfolios to produce risk-adjusted returns in support of policyholder obligations and to achieve desired corporate profitability. The main risks in the business reflect interest rate, credit and liquidity risk. In addition, Industrial Alliance generates income based on the level of equity markets, and volatility in equity markets can lead to volatility in earnings. Insurance companies also establish reserves using actuarial assumptions based on mortality, future costs, future investment returns, and lapses among other things. Therefore, any deviation from these assumptions can have a meaningful effect on the insurer.
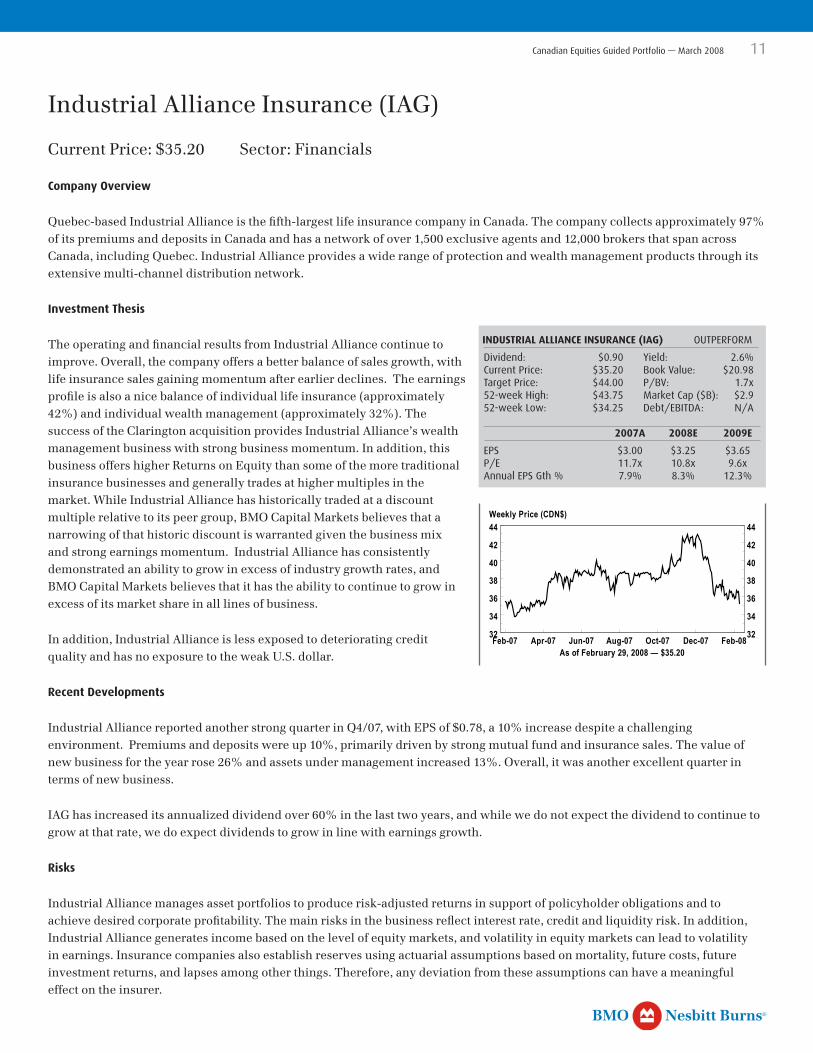
INDUSTRIAL ALLIANCE INSURANCE (IAG) OUTPERFORM
Dividend: $0.90 Yield: 2.6%Current Price: $35.20 Book Value: $20.98Target Price: $44.00 P/BV: �.7x52-week High: $43.75 Market Cap ($B): $2.952-week Low: $34.25 Debt/EBITDA: N/A
2007A 2008E 2009E
EPS $3.00 $3.25 $3.65P/E ��.7x �0.8x 9.6xAnnual EPS Gth % 7.9% 8.3% �2.3%IAG CN Equity
Feb-07 Apr-07 Jun-07 Aug-07 Oct-07 Dec-07 Feb-0832
34
36
38
40
42
44
32
34
36
38
40
42
44
As of February 29, 2008 — $35.20
Weekly Price (CDN$)
Nesbitt BurnsBMO R
�2 Canadian Equities Guided Portfolio — March 2008
Manulife Financial (MFC)
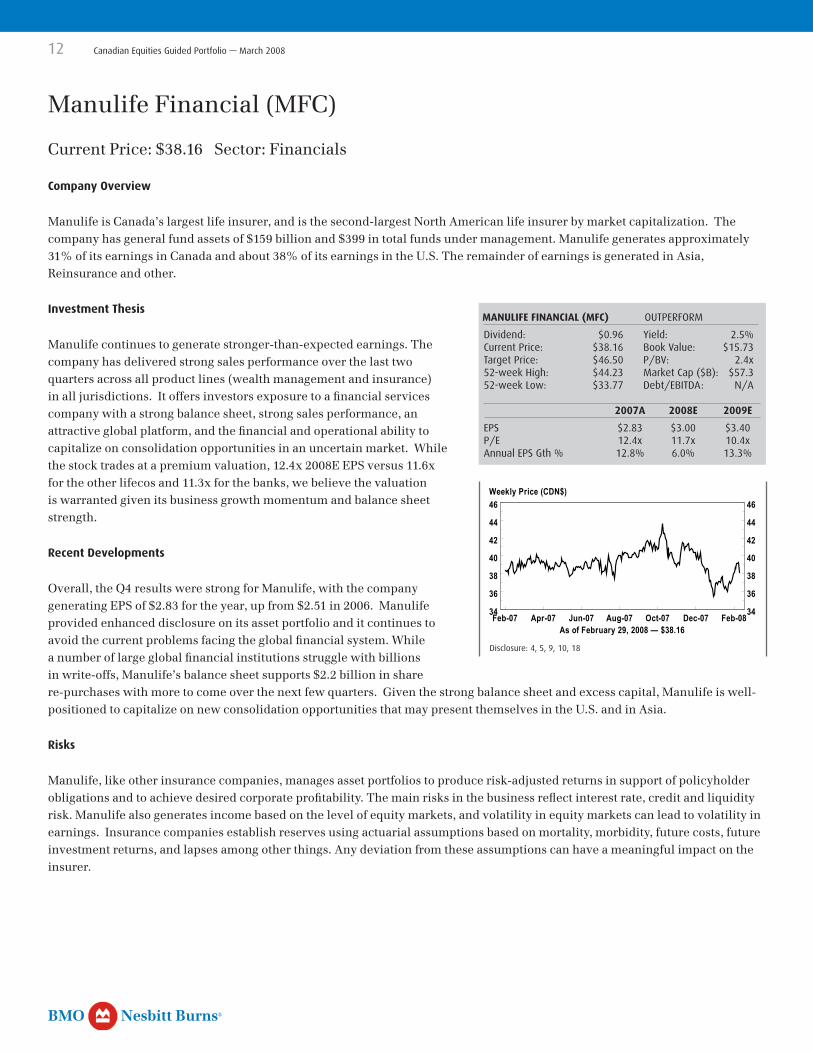
Current Price: $38.16 Sector: Financials
Company Overview
Manulife is Canada’s largest life insurer, and is the second-largest North American life insurer by market capitalization. The company has general fund assets of $159 billion and $399 in total funds under management. Manulife generates approximately 31% of its earnings in Canada and about 38% of its earnings in the U.S. The remainder of earnings is generated in Asia, Reinsurance and other.
Investment Thesis
Manulife continues to generate stronger-than-expected earnings. The company has delivered strong sales performance over the last two quarters across all product lines (wealth management and insurance) in all jurisdictions. It offers investors exposure to a financial services company with a strong balance sheet, strong sales performance, an attractive global platform, and the financial and operational ability to capitalize on consolidation opportunities in an uncertain market. While the stock trades at a premium valuation, 12.4x 2008E EPS versus 11.6x for the other lifecos and 11.3x for the banks, we believe the valuation is warranted given its business growth momentum and balance sheet strength.
Recent Developments
Overall, the Q4 results were strong for Manulife, with the company generating EPS of $2.83 for the year, up from $2.51 in 2006. Manulife provided enhanced disclosure on its asset portfolio and it continues to avoid the current problems facing the global financial system. While a number of large global financial institutions struggle with billions in write-offs, Manulife’s balance sheet supports $2.2 billion in share re-purchases with more to come over the next few quarters. Given the strong balance sheet and excess capital, Manulife is well-positioned to capitalize on new consolidation opportunities that may present themselves in the U.S. and in Asia.
Risks
Manulife, like other insurance companies, manages asset portfolios to produce risk-adjusted returns in support of policyholder obligations and to achieve desired corporate profitability. The main risks in the business reflect interest rate, credit and liquidity risk. Manulife also generates income based on the level of equity markets, and volatility in equity markets can lead to volatility in earnings. Insurance companies establish reserves using actuarial assumptions based on mortality, morbidity, future costs, future investment returns, and lapses among other things. Any deviation from these assumptions can have a meaningful impact on the insurer.
MANULIFE FINANCIAL (MFC) OUTPERFORM
Dividend: $0.96 Yield: 2.5%Current Price: $38.�6 Book Value: $�5.73Target Price: $46.50 P/BV: 2.4x52-week High: $44.23 Market Cap ($B): $57.3 52-week Low: $33.77 Debt/EBITDA: N/A
2007A 2008E 2009E
EPS $2.83 $3.00 $3.40P/E �2.4x ��.7x �0.4xAnnual EPS Gth % �2.8% 6.0% �3.3%MFC CN Equity
Feb-07 Apr-07 Jun-07 Aug-07 Oct-07 Dec-07 Feb-0834
36
38
40
42
44
46
34
36
38
40
42
44
46
As of February 29, 2008 — $38.16
Weekly Price (CDN$)
Disclosure: 4, 5, 9, �0, �8

Nesbitt BurnsBMO R
Canadian Equities Guided Portfolio — March 2008 �3
National Bank (NA)
Current Price: $48.58 Sector: Financials
Company Overview
National Bank is a Montreal based, fully integrated financial services company. It is the smallest of the Big Six Canadian banks, with approximately 460 branches nationwide. It offers a full range of personal, commercial and corporate banking services. Brokerage and underwriting services are offered through its brokerage unit, National Bank Financial.
Investment Thesis
National Bank has continued to deliver a premium ROE, despite the difficult environment. BMO Capital Markets Research believes that National offers attractive value, as it trades at a discount valuation to the peer group, which reflects the current environment as well as the regional nature of the banks operations (Quebec).
BMO Capital Markets believes that the ABCP problems experienced by National are well-understood and that it has reasonable opportunities to grow its retail banking and wealth management businesses. In addition we believe the bank’s exposures to other areas of concern (CDOs, monolines, SIVs, etc.) are low. The market is likely discounting this, which has resulted in National Bank offering better value. National shares offer attractive value and are thought to be a relatively low risk way of buying into a possible return to normalcy in capital markets.
Recent Developments
National Bank reported first quarter results that were encouraging. The underlying operating earnings was $1.46 per share, which was better than the $1.34 reported last quarter and better than the BMO Capital Market’s forecast of $1.35. The bank appears to have gotten its arms around the ABCP issue. The Pan-Canadian Investors Committee for 3rd Party structured ABCP expects to have details of the approval process before March 14, 2008, and to have a closing by the end of April 2008.
National Bank has a $1.7 billion carrying value on its remaining 3rd party ABCP. It has already written down 25% of the holding, more than the other major holders. It is possible that in the event that the Pan-Canadian Investors Committee fails, and there is a disorderly liquidation of the structures, that National would take additional charges. BMO Capital Markets sees this as a low risk event, and would describe it as a disaster scenario.
Risks
Canadian banks are levered institutions, with leverage to, among other things, the credit cycle, currency rates, interest rates, capital markets activity, the level of equity markets and the shape of the yield curve. In addition, National Bank generates most of its earnings in the province of Quebec, which makes it particularly sensitive to changes in the Quebec economy. The recent turmoil in credit markets continues to unfold, and there is additional risk of further issues for the banks.
NATIONAL BANK (NA) OUTPERFORMDividend: $2.48 Yield: 5.�%Current Price: $48.58 Book Value: $28.�3Target Price: $55.00 P/BV: �.7x52-week High: $66.50 Market Cap ($B): $7.752-week Low: $44.5� Debt/EBITDA: N/A
2007A 2008E 2009EEPS $3.22 $5.50 $5.60P/E �5.�x 8.8x 8.7xAnnual EPS Gth % -37.2% 70.8% �.8%ROE ��.5% �9.6% �9.0%Tier One Capital 9.0% 9.7% 9.7%NA CN Equity
Feb-07 Apr-07 Jun-07 Jul-07 Sep-07 Nov-07 Dec-07 Feb-0844
48
52
56
60
64
68
44
48
52
56
60
64
68
As of February 29, 2008 — $48.58
Weekly Price (CDN$)
Disclosure: 4, 5, 9, �0, �6
Nesbitt BurnsBMO R
�4 Canadian Equities Guided Portfolio — March 2008
Nexen Inc. (NXY)
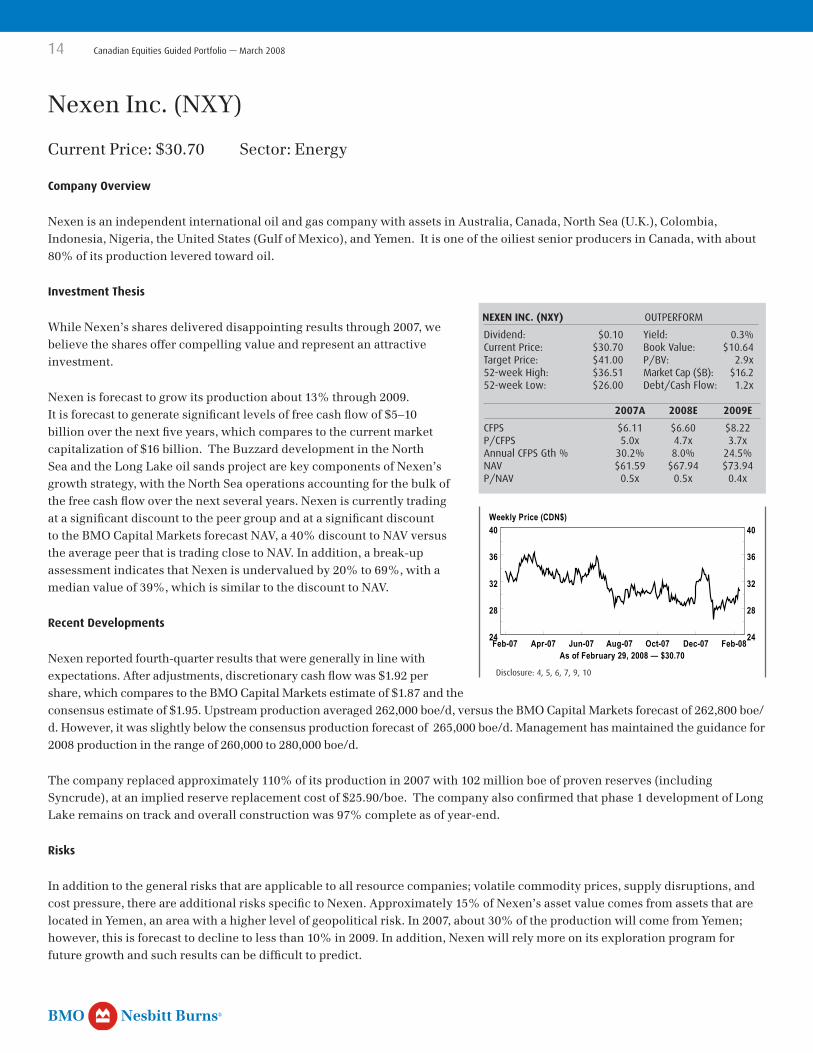
Current Price: $30.70 Sector: Energy
Company Overview
Nexen is an independent international oil and gas company with assets in Australia, Canada, North Sea (U.K.), Colombia, Indonesia, Nigeria, the United States (Gulf of Mexico), and Yemen. It is one of the oiliest senior producers in Canada, with about 80% of its production levered toward oil.
Investment Thesis
While Nexen’s shares delivered disappointing results through 2007, we believe the shares offer compelling value and represent an attractive investment.
Nexen is forecast to grow its production about 13% through 2009. It is forecast to generate significant levels of free cash flow of $5–10 billion over the next five years, which compares to the current market capitalization of $16 billion. The Buzzard development in the North Sea and the Long Lake oil sands project are key components of Nexen’s growth strategy, with the North Sea operations accounting for the bulk of the free cash flow over the next several years. Nexen is currently trading at a significant discount to the peer group and at a significant discount to the BMO Capital Markets forecast NAV, a 40% discount to NAV versus the average peer that is trading close to NAV. In addition, a break-up assessment indicates that Nexen is undervalued by 20% to 69%, with a median value of 39%, which is similar to the discount to NAV.
Recent Developments
Nexen reported fourth-quarter results that were generally in line with expectations. After adjustments, discretionary cash flow was $1.92 per share, which compares to the BMO Capital Markets estimate of $1.87 and the consensus estimate of $1.95. Upstream production averaged 262,000 boe/d, versus the BMO Capital Markets forecast of 262,800 boe/d. However, it was slightly below the consensus production forecast of 265,000 boe/d. Management has maintained the guidance for 2008 production in the range of 260,000 to 280,000 boe/d.
The company replaced approximately 110% of its production in 2007 with 102 million boe of proven reserves (including Syncrude), at an implied reserve replacement cost of $25.90/boe. The company also confirmed that phase 1 development of Long Lake remains on track and overall construction was 97% complete as of year-end.
Risks
In addition to the general risks that are applicable to all resource companies; volatile commodity prices, supply disruptions, and cost pressure, there are additional risks specific to Nexen. Approximately 15% of Nexen’s asset value comes from assets that are located in Yemen, an area with a higher level of geopolitical risk. In 2007, about 30% of the production will come from Yemen; however, this is forecast to decline to less than 10% in 2009. In addition, Nexen will rely more on its exploration program for future growth and such results can be difficult to predict.
NEXEN INC. (NXY) OUTPERFORM
Dividend: $0.�0 Yield: 0.3%Current Price: $30.70 Book Value: $�0.64Target Price: $4�.00 P/BV: 2.9x52-week High: $36.5� Market Cap ($B): $�6.252-week Low: $26.00 Debt/Cash Flow: �.2x
2007A 2008E 2009E
CFPS $6.�� $6.60 $8.22P/CFPS 5.0x 4.7x 3.7xAnnual CFPS Gth % 30.2% 8.0% 24.5%NAV $6�.59 $67.94 $73.94P/NAV 0.5x 0.5x 0.4xNXY CN Equity
Feb-07 Apr-07 Jun-07 Aug-07 Oct-07 Dec-07 Feb-0824
28
32
36
40
24
28
32
36
40
As of February 29, 2008 — $30.70
Weekly Price (CDN$)
Disclosure: 4, 5, 6, 7, 9, �0
Nesbitt BurnsBMO R
Canadian Equities Guided Portfolio — March 2008 �5
Power Financial (PWF)
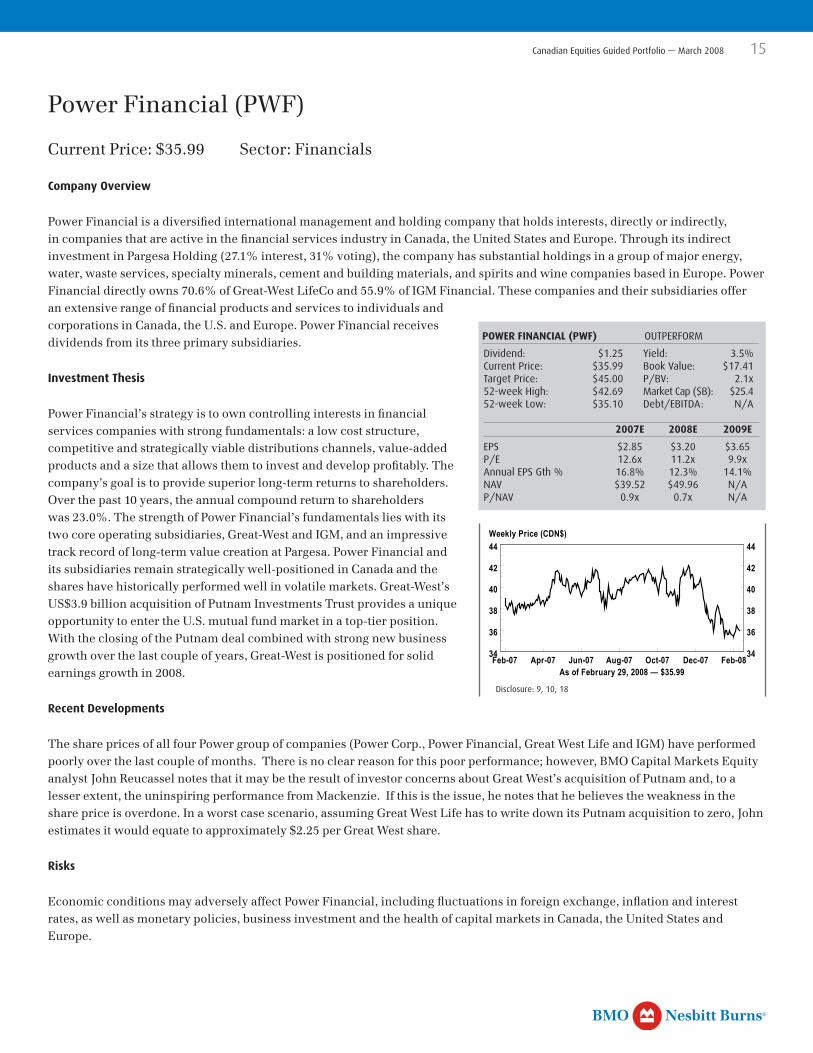
Current Price: $35.99 Sector: Financials
Company Overview
Power Financial is a diversified international management and holding company that holds interests, directly or indirectly, in companies that are active in the financial services industry in Canada, the United States and Europe. Through its indirect investment in Pargesa Holding (27.1% interest, 31% voting), the company has substantial holdings in a group of major energy, water, waste services, specialty minerals, cement and building materials, and spirits and wine companies based in Europe. Power Financial directly owns 70.6% of Great-West LifeCo and 55.9% of IGM Financial. These companies and their subsidiaries offer an extensive range of financial products and services to individuals and corporations in Canada, the U.S. and Europe. Power Financial receives dividends from its three primary subsidiaries.
Investment Thesis
Power Financial’s strategy is to own controlling interests in financial services companies with strong fundamentals: a low cost structure, competitive and strategically viable distributions channels, value-added products and a size that allows them to invest and develop profitably. The company’s goal is to provide superior long-term returns to shareholders. Over the past 10 years, the annual compound return to shareholders was 23.0%. The strength of Power Financial’s fundamentals lies with its two core operating subsidiaries, Great-West and IGM, and an impressive track record of long-term value creation at Pargesa. Power Financial and its subsidiaries remain strategically well-positioned in Canada and the shares have historically performed well in volatile markets. Great-West’s US$3.9 billion acquisition of Putnam Investments Trust provides a unique opportunity to enter the U.S. mutual fund market in a top-tier position. With the closing of the Putnam deal combined with strong new business growth over the last couple of years, Great-West is positioned for solid earnings growth in 2008.
Recent Developments
The share prices of all four Power group of companies (Power Corp., Power Financial, Great West Life and IGM) have performed poorly over the last couple of months. There is no clear reason for this poor performance; however, BMO Capital Markets Equity analyst John Reucassel notes that it may be the result of investor concerns about Great West’s acquisition of Putnam and, to a lesser extent, the uninspiring performance from Mackenzie. If this is the issue, he notes that he believes the weakness in the share price is overdone. In a worst case scenario, assuming Great West Life has to write down its Putnam acquisition to zero, John estimates it would equate to approximately $2.25 per Great West share.
Risks
Economic conditions may adversely affect Power Financial, including fluctuations in foreign exchange, inflation and interest rates, as well as monetary policies, business investment and the health of capital markets in Canada, the United States and Europe.
POWER FINANCIAL (PWF) OUTPERFORM
Dividend: $�.25 Yield: 3.5%Current Price: $35.99 Book Value: $�7.4�Target Price: $45.00 P/BV: 2.�x52-week High: $42.69 Market Cap ($B): $25.452-week Low: $35.�0 Debt/EBITDA: N/A
2007E 2008E 2009E
EPS $2.85 $3.20 $3.65P/E �2.6x ��.2x 9.9xAnnual EPS Gth % �6.8% �2.3% �4.�%NAV $39.52 $49.96 N/AP/NAV 0.9x 0.7x N/APWF CN Equity
Feb-07 Apr-07 Jun-07 Aug-07 Oct-07 Dec-07 Feb-0834
36
38
40
42
44
34
36
38
40
42
44
As of February 29, 2008 — $35.99
Weekly Price (CDN$)
Disclosure: 9, �0, �8
Nesbitt BurnsBMO R
�6 Canadian Equities Guided Portfolio — March 2008
Research In Motion (RIM)
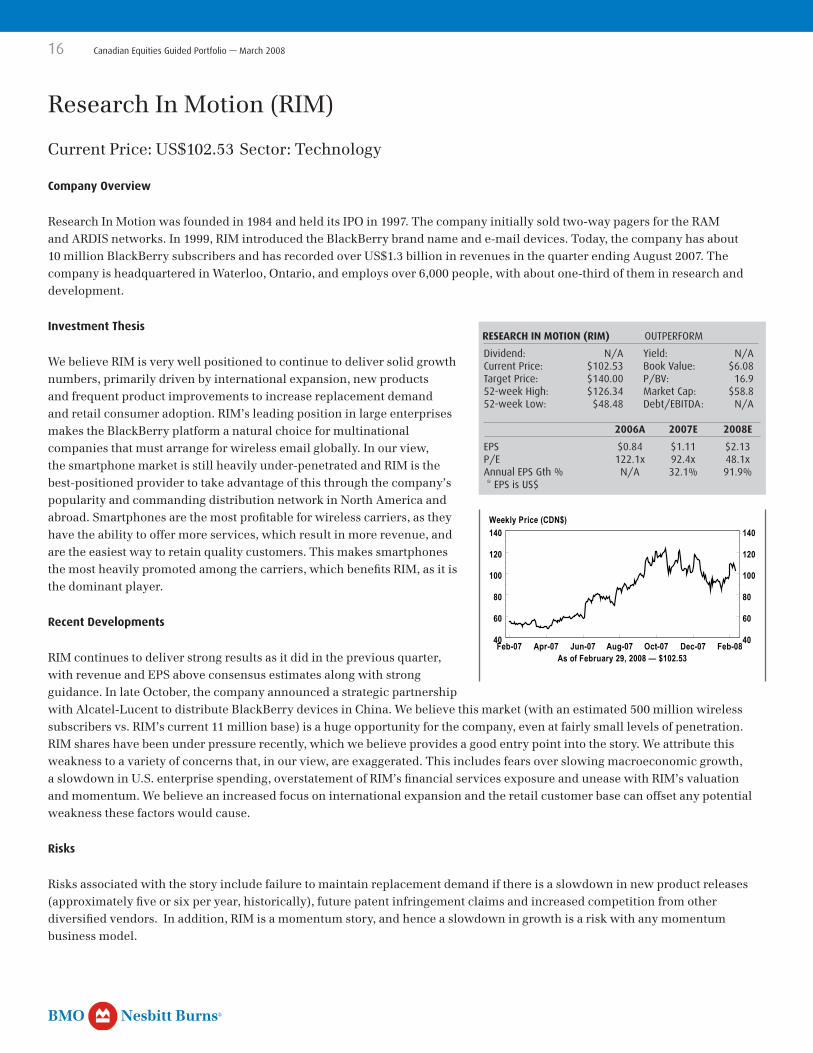
Current Price: US$102.53 Sector: Technology
Company Overview
Research In Motion was founded in 1984 and held its IPO in 1997. The company initially sold two-way pagers for the RAM and ARDIS networks. In 1999, RIM introduced the BlackBerry brand name and e-mail devices. Today, the company has about 10 million BlackBerry subscribers and has recorded over US$1.3 billion in revenues in the quarter ending August 2007. The company is headquartered in Waterloo, Ontario, and employs over 6,000 people, with about one-third of them in research and development.
Investment Thesis
We believe RIM is very well positioned to continue to deliver solid growth numbers, primarily driven by international expansion, new products and frequent product improvements to increase replacement demand and retail consumer adoption. RIM’s leading position in large enterprises makes the BlackBerry platform a natural choice for multinational companies that must arrange for wireless email globally. In our view, the smartphone market is still heavily under-penetrated and RIM is the best-positioned provider to take advantage of this through the company’s popularity and commanding distribution network in North America and abroad. Smartphones are the most profitable for wireless carriers, as they have the ability to offer more services, which result in more revenue, and are the easiest way to retain quality customers. This makes smartphones the most heavily promoted among the carriers, which benefits RIM, as it is the dominant player.
Recent Developments
RIM continues to deliver strong results as it did in the previous quarter, with revenue and EPS above consensus estimates along with strong guidance. In late October, the company announced a strategic partnership with Alcatel-Lucent to distribute BlackBerry devices in China. We believe this market (with an estimated 500 million wireless subscribers vs. RIM’s current 11 million base) is a huge opportunity for the company, even at fairly small levels of penetration. RIM shares have been under pressure recently, which we believe provides a good entry point into the story. We attribute this weakness to a variety of concerns that, in our view, are exaggerated. This includes fears over slowing macroeconomic growth, a slowdown in U.S. enterprise spending, overstatement of RIM’s financial services exposure and unease with RIM’s valuation and momentum. We believe an increased focus on international expansion and the retail customer base can offset any potential weakness these factors would cause.
Risks
Risks associated with the story include failure to maintain replacement demand if there is a slowdown in new product releases (approximately five or six per year, historically), future patent infringement claims and increased competition from other diversified vendors. In addition, RIM is a momentum story, and hence a slowdown in growth is a risk with any momentum business model.
RESEARCH IN MOTION (RIM) OUTPERFORM
Dividend: N/A Yield: N/ACurrent Price: $�02.53 Book Value: $6.08Target Price: $�40.00 P/BV: �6.952-week High: $�26.34 Market Cap: $58.852-week Low: $48.48 Debt/EBITDA: N/A
2006A 2007E 2008E
EPS $0.84 $�.�� $2.�3P/E �22.�x 92.4x 48.�xAnnual EPS Gth % N/A 32.�% 9�.9% * EPS is US$ RIM CN Equity
Feb-07 Apr-07 Jun-07 Aug-07 Oct-07 Dec-07 Feb-0840
60
80
100
120
140
40
60
80
100
120
140
As of February 29, 2008 — $102.53
Weekly Price (CDN$)
Nesbitt BurnsBMO R
Canadian Equities Guided Portfolio — March 2008 �7
Sherritt International Corp. (S)
Current Price: $16.60 Sector: Materials
Company Overview
Sherritt International is a diversified Canadian natural resources company that operates in Canada, Cuba and internationally. The company has four principal businesses: a vertically integrated nickel/cobalt metals operation, upstream oil and gas operations, power generation and thermal coal production for the export market. Sherritt is also developing a nickel project in Madagascar, participates in smaller businesses in Cuba and owns 41.2% of Royal Utilities Income Fund.
Investment Thesis
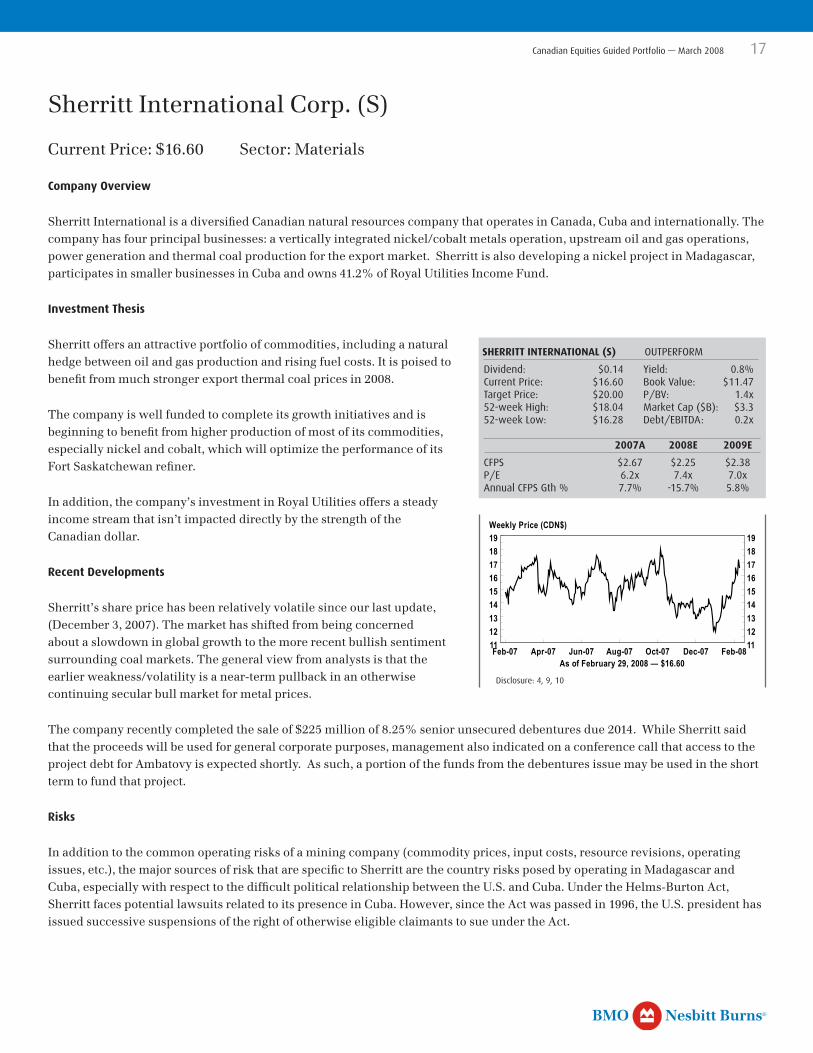
Sherritt offers an attractive portfolio of commodities, including a natural hedge between oil and gas production and rising fuel costs. It is poised to benefit from much stronger export thermal coal prices in 2008.
The company is well funded to complete its growth initiatives and is beginning to benefit from higher production of most of its commodities, especially nickel and cobalt, which will optimize the performance of its Fort Saskatchewan refiner.
In addition, the company’s investment in Royal Utilities offers a steady income stream that isn’t impacted directly by the strength of the Canadian dollar.
Recent Developments
Sherritt’s share price has been relatively volatile since our last update, (December 3, 2007). The market has shifted from being concerned about a slowdown in global growth to the more recent bullish sentiment surrounding coal markets. The general view from analysts is that the earlier weakness/volatility is a near-term pullback in an otherwise continuing secular bull market for metal prices.
The company recently completed the sale of $225 million of 8.25% senior unsecured debentures due 2014. While Sherritt said that the proceeds will be used for general corporate purposes, management also indicated on a conference call that access to the project debt for Ambatovy is expected shortly. As such, a portion of the funds from the debentures issue may be used in the short term to fund that project.
Risks
In addition to the common operating risks of a mining company (commodity prices, input costs, resource revisions, operating issues, etc.), the major sources of risk that are specific to Sherritt are the country risks posed by operating in Madagascar and Cuba, especially with respect to the difficult political relationship between the U.S. and Cuba. Under the Helms-Burton Act, Sherritt faces potential lawsuits related to its presence in Cuba. However, since the Act was passed in 1996, the U.S. president has issued successive suspensions of the right of otherwise eligible claimants to sue under the Act.
SHERRITT INTERNATIONAL (S) OUTPERFORM
Dividend: $0.�4 Yield: 0.8%Current Price: $�6.60 Book Value: $��.47Target Price: $20.00 P/BV: �.4x52-week High: $�8.04 Market Cap ($B): $3.352-week Low: $�6.28 Debt/EBITDA: 0.2x
2007A 2008E 2009E
CFPS $2.67 $2.25 $2.38P/E 6.2x 7.4x 7.0xAnnual CFPS Gth % 7.7% -�5.7% 5.8%S CN Equity
Feb-07 Apr-07 Jun-07 Aug-07 Oct-07 Dec-07 Feb-08111213141516171819
111213141516171819
As of February 29, 2008 — $16.60
Weekly Price (CDN$)
Disclosure: 4, 9, �0
Nesbitt BurnsBMO R
�8 Canadian Equities Guided Portfolio — March 2008
Suncor Energy Inc. (SU)
Current Price: $101.50 Sector: Energy
Company Overview
Suncor is one of three pure-play integrated oil sands operators in Canada involved in oil sands production, upgrading, and refining. The company explores for, acquires, develops, produces and markets crude oil and natural gas, transports and refines crude oil, and markets petroleum and petrochemical products through four business units: Oil Sands (47% of 2006 revenues; 95% of net earnings); Natural Gas (4%; 4%); Energy Marketing and Refining – Canada (35%; 3%); and Refining and Marketing – U.S.A. (20%; 6%).
Investment Thesis
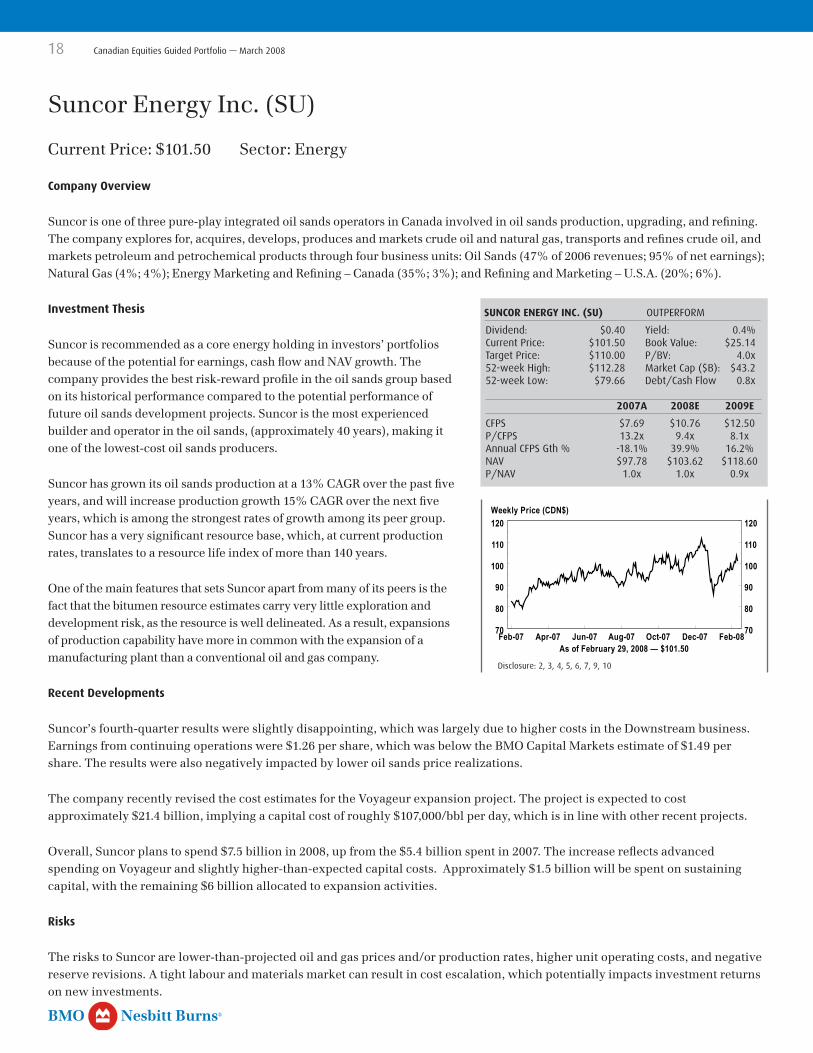
Suncor is recommended as a core energy holding in investors’ portfolios because of the potential for earnings, cash flow and NAV growth. The company provides the best risk-reward profile in the oil sands group based on its historical performance compared to the potential performance of future oil sands development projects. Suncor is the most experienced builder and operator in the oil sands, (approximately 40 years), making it one of the lowest-cost oil sands producers.
Suncor has grown its oil sands production at a 13% CAGR over the past five years, and will increase production growth 15% CAGR over the next five years, which is among the strongest rates of growth among its peer group. Suncor has a very significant resource base, which, at current production rates, translates to a resource life index of more than 140 years.
One of the main features that sets Suncor apart from many of its peers is the fact that the bitumen resource estimates carry very little exploration and development risk, as the resource is well delineated. As a result, expansions of production capability have more in common with the expansion of a manufacturing plant than a conventional oil and gas company.
Recent Developments
Suncor’s fourth-quarter results were slightly disappointing, which was largely due to higher costs in the Downstream business. Earnings from continuing operations were $1.26 per share, which was below the BMO Capital Markets estimate of $1.49 per share. The results were also negatively impacted by lower oil sands price realizations.
The company recently revised the cost estimates for the Voyageur expansion project. The project is expected to cost approximately $21.4 billion, implying a capital cost of roughly $107,000/bbl per day, which is in line with other recent projects.
Overall, Suncor plans to spend $7.5 billion in 2008, up from the $5.4 billion spent in 2007. The increase reflects advanced spending on Voyageur and slightly higher-than-expected capital costs. Approximately $1.5 billion will be spent on sustaining capital, with the remaining $6 billion allocated to expansion activities.
Risks
The risks to Suncor are lower-than-projected oil and gas prices and/or production rates, higher unit operating costs, and negative reserve revisions. A tight labour and materials market can result in cost escalation, which potentially impacts investment returns on new investments.
SUNCOR ENERGY INC. (SU) OUTPERFORM
Dividend: $0.40 Yield: 0.4%Current Price: $�0�.50 Book Value: $25.�4Target Price: $��0.00 P/BV: 4.0x52-week High: $��2.28 Market Cap ($B): $43.252-week Low: $79.66 Debt/Cash Flow 0.8x
2007A 2008E 2009E
CFPS $7.69 $�0.76 $�2.50P/CFPS �3.2x 9.4x 8.�xAnnual CFPS Gth % -�8.�% 39.9% �6.2%NAV $97.78 $�03.62 $��8.60P/NAV �.0x �.0x 0.9xSU CN Equity
Feb-07 Apr-07 Jun-07 Aug-07 Oct-07 Dec-07 Feb-0870
80
90
100
110
120
70
80
90
100
110
120
As of February 29, 2008 — $101.50
Weekly Price (CDN$)
Disclosure: 2, 3, 4, 5, 6, 7, 9, �0
Nesbitt BurnsBMO R
Canadian Equities Guided Portfolio — March 2008 �9
Talisman Energy Inc. (TLM)
Current Price: $16.73 Sector: Energy
Company Overview
Talisman is an oil and gas producer with a balanced portfolio of North American and international operations. The company produces substantial oil and gas volumes in the United Kingdom and Scandinavia, with ongoing exploration and development activities in these areas. Talisman is active in Southeast Asia and has producing interests in North Africa and in Trinidad and Tobago. Talisman also has exploration interests in Colombia, Peru and Qatar.
Investment Thesis
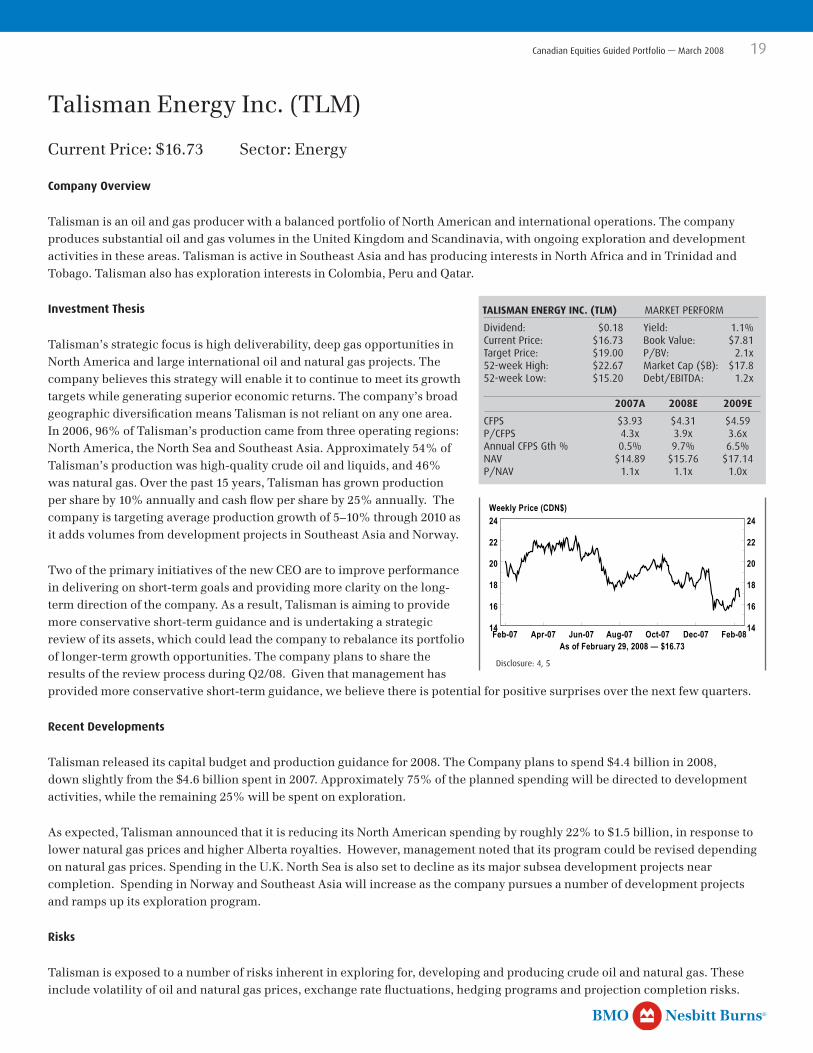
Talisman’s strategic focus is high deliverability, deep gas opportunities in North America and large international oil and natural gas projects. The company believes this strategy will enable it to continue to meet its growth targets while generating superior economic returns. The company’s broad geographic diversification means Talisman is not reliant on any one area. In 2006, 96% of Talisman’s production came from three operating regions: North America, the North Sea and Southeast Asia. Approximately 54% of Talisman’s production was high-quality crude oil and liquids, and 46% was natural gas. Over the past 15 years, Talisman has grown production per share by 10% annually and cash flow per share by 25% annually. The company is targeting average production growth of 5–10% through 2010 as it adds volumes from development projects in Southeast Asia and Norway.
Two of the primary initiatives of the new CEO are to improve performance in delivering on short-term goals and providing more clarity on the long-term direction of the company. As a result, Talisman is aiming to provide more conservative short-term guidance and is undertaking a strategic review of its assets, which could lead the company to rebalance its portfolio of longer-term growth opportunities. The company plans to share the results of the review process during Q2/08. Given that management has provided more conservative short-term guidance, we believe there is potential for positive surprises over the next few quarters.
Recent Developments
Talisman released its capital budget and production guidance for 2008. The Company plans to spend $4.4 billion in 2008, down slightly from the $4.6 billion spent in 2007. Approximately 75% of the planned spending will be directed to development activities, while the remaining 25% will be spent on exploration.
As expected, Talisman announced that it is reducing its North American spending by roughly 22% to $1.5 billion, in response to lower natural gas prices and higher Alberta royalties. However, management noted that its program could be revised depending on natural gas prices. Spending in the U.K. North Sea is also set to decline as its major subsea development projects near completion. Spending in Norway and Southeast Asia will increase as the company pursues a number of development projects and ramps up its exploration program.
Risks
Talisman is exposed to a number of risks inherent in exploring for, developing and producing crude oil and natural gas. These include volatility of oil and natural gas prices, exchange rate fluctuations, hedging programs and projection completion risks.
TALISMAN ENERGY INC. (TLM) MARKET PERFORM
Dividend: $0.�8 Yield: �.�%Current Price: $�6.73 Book Value: $7.8�Target Price: $�9.00 P/BV: 2.�x52-week High: $22.67 Market Cap ($B): $�7.852-week Low: $�5.20 Debt/EBITDA: �.2x
2007A 2008E 2009E
CFPS $3.93 $4.3� $4.59P/CFPS 4.3x 3.9x 3.6xAnnual CFPS Gth % 0.5% 9.7% 6.5%NAV $�4.89 $�5.76 $�7.�4P/NAV �.�x �.�x �.0xTLM CN Equity
Feb-07 Apr-07 Jun-07 Aug-07 Oct-07 Dec-07 Feb-0814
16
18
20
22
24
14
16
18
20
22
24
As of February 29, 2008 — $16.73
Weekly Price (CDN$)
Disclosure: 4, 5
Nesbitt BurnsBMO R
20 Canadian Equities Guided Portfolio — March 2008
Teck Cominco (TCK.B)
Current Price: $39.27 Sector: Materials
Company Overview
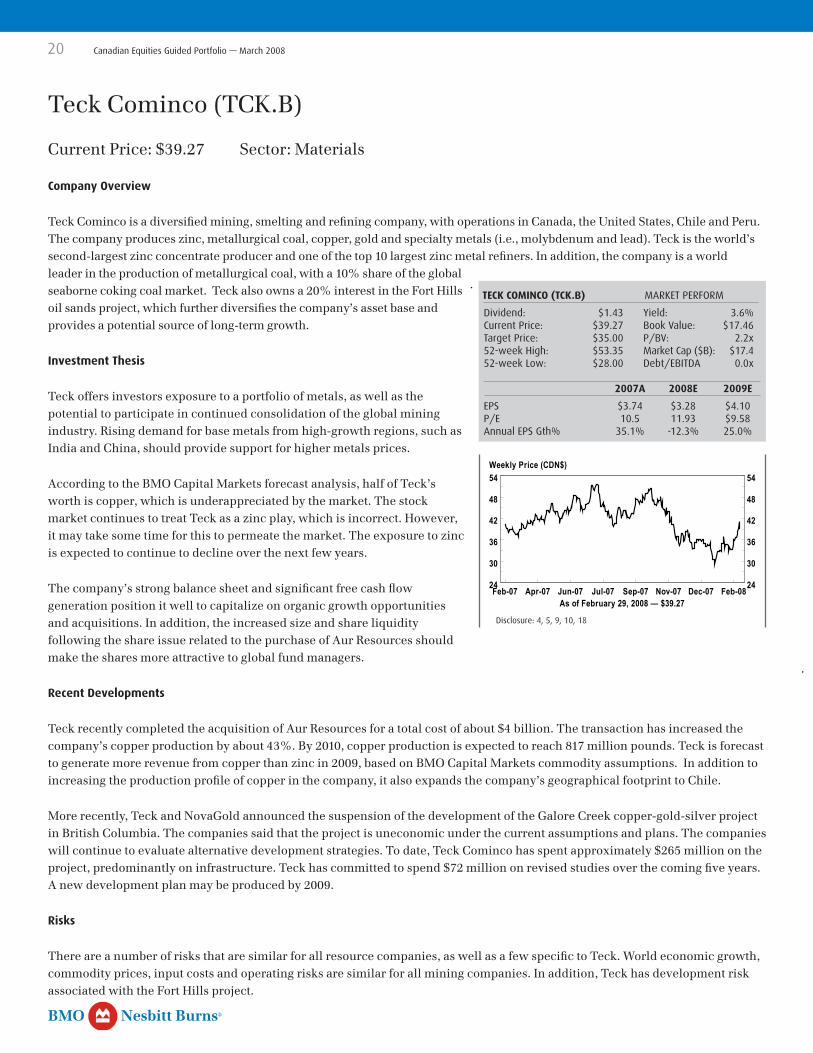
Teck Cominco is a diversified mining, smelting and refining company, with operations in Canada, the United States, Chile and Peru. The company produces zinc, metallurgical coal, copper, gold and specialty metals (i.e., molybdenum and lead). Teck is the world’s second-largest zinc concentrate producer and one of the top 10 largest zinc metal refiners. In addition, the company is a world leader in the production of metallurgical coal, with a 10% share of the global seaborne coking coal market. Teck also owns a 20% interest in the Fort Hills oil sands project, which further diversifies the company’s asset base and provides a potential source of long-term growth.
Investment Thesis
Teck offers investors exposure to a portfolio of metals, as well as the potential to participate in continued consolidation of the global mining industry. Rising demand for base metals from high-growth regions, such as India and China, should provide support for higher metals prices.
According to the BMO Capital Markets forecast analysis, half of Teck’s worth is copper, which is underappreciated by the market. The stock market continues to treat Teck as a zinc play, which is incorrect. However, it may take some time for this to permeate the market. The exposure to zinc is expected to continue to decline over the next few years.
The company’s strong balance sheet and significant free cash flow generation position it well to capitalize on organic growth opportunities and acquisitions. In addition, the increased size and share liquidity following the share issue related to the purchase of Aur Resources should make the shares more attractive to global fund managers.
Recent Developments
Teck recently completed the acquisition of Aur Resources for a total cost of about $4 billion. The transaction has increased the company’s copper production by about 43%. By 2010, copper production is expected to reach 817 million pounds. Teck is forecast to generate more revenue from copper than zinc in 2009, based on BMO Capital Markets commodity assumptions. In addition to increasing the production profile of copper in the company, it also expands the company’s geographical footprint to Chile.
More recently, Teck and NovaGold announced the suspension of the development of the Galore Creek copper-gold-silver project in British Columbia. The companies said that the project is uneconomic under the current assumptions and plans. The companies will continue to evaluate alternative development strategies. To date, Teck Cominco has spent approximately $265 million on the project, predominantly on infrastructure. Teck has committed to spend $72 million on revised studies over the coming five years. A new development plan may be produced by 2009.
Risks
There are a number of risks that are similar for all resource companies, as well as a few specific to Teck. World economic growth, commodity prices, input costs and operating risks are similar for all mining companies. In addition, Teck has development risk associated with the Fort Hills project.
TECK COMINCO (TCK.B) MARKET PERFORM
Dividend: $�.43 Yield: 3.6%Current Price: $39.27 Book Value: $�7.46Target Price: $35.00 P/BV: 2.2x52-week High: $53.35 Market Cap ($B): $�7.452-week Low: $28.00 Debt/EBITDA 0.0x
2007A 2008E 2009E
EPS $3.74 $3.28 $4.�0P/E �0.5 ��.93 $9.58Annual EPS Gth% 35.�% -�2.3% 25.0%TCK/B CN Equity
Feb-07 Apr-07 Jun-07 Jul-07 Sep-07 Nov-07 Dec-07 Feb-0824
30
36
42
48
54
24
30
36
42
48
54
As of February 29, 2008 — $39.27
Weekly Price (CDN$)
Disclosure: 4, 5, 9, �0, �8
Nesbitt BurnsBMO R
Canadian Equities Guided Portfolio — March 2008 2�
Tim Hortons (THI)
Current Price: $34.64 Sector: Consumer Discretionary
Company Overview
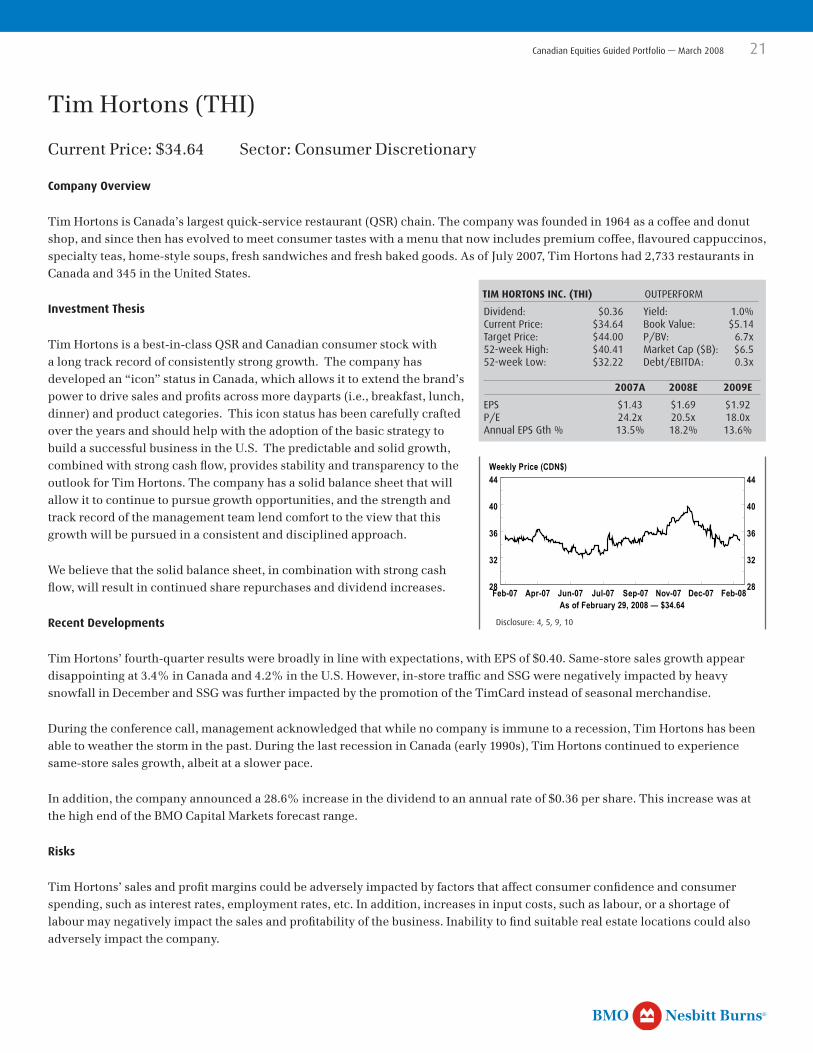
Tim Hortons is Canada’s largest quick-service restaurant (QSR) chain. The company was founded in 1964 as a coffee and donut shop, and since then has evolved to meet consumer tastes with a menu that now includes premium coffee, flavoured cappuccinos, specialty teas, home-style soups, fresh sandwiches and fresh baked goods. As of July 2007, Tim Hortons had 2,733 restaurants in Canada and 345 in the United States.
Investment Thesis
Tim Hortons is a best-in-class QSR and Canadian consumer stock with a long track record of consistently strong growth. The company has developed an “icon” status in Canada, which allows it to extend the brand’s power to drive sales and profits across more dayparts (i.e., breakfast, lunch, dinner) and product categories. This icon status has been carefully crafted over the years and should help with the adoption of the basic strategy to build a successful business in the U.S. The predictable and solid growth, combined with strong cash flow, provides stability and transparency to the outlook for Tim Hortons. The company has a solid balance sheet that will allow it to continue to pursue growth opportunities, and the strength and track record of the management team lend comfort to the view that this growth will be pursued in a consistent and disciplined approach.
We believe that the solid balance sheet, in combination with strong cash flow, will result in continued share repurchases and dividend increases.
Recent Developments
Tim Hortons’ fourth-quarter results were broadly in line with expectations, with EPS of $0.40. Same-store sales growth appear disappointing at 3.4% in Canada and 4.2% in the U.S. However, in-store traffic and SSG were negatively impacted by heavy snowfall in December and SSG was further impacted by the promotion of the TimCard instead of seasonal merchandise.
During the conference call, management acknowledged that while no company is immune to a recession, Tim Hortons has been able to weather the storm in the past. During the last recession in Canada (early 1990s), Tim Hortons continued to experience same-store sales growth, albeit at a slower pace.
In addition, the company announced a 28.6% increase in the dividend to an annual rate of $0.36 per share. This increase was at the high end of the BMO Capital Markets forecast range.
Risks
Tim Hortons’ sales and profit margins could be adversely impacted by factors that affect consumer confidence and consumer spending, such as interest rates, employment rates, etc. In addition, increases in input costs, such as labour, or a shortage of labour may negatively impact the sales and profitability of the business. Inability to find suitable real estate locations could also adversely impact the company.
TIM HORTONS INC. (THI) OUTPERFORM
Dividend: $0.36 Yield: �.0%Current Price: $34.64 Book Value: $5.�4Target Price: $44.00 P/BV: 6.7x52-week High: $40.4� Market Cap ($B): $6.552-week Low: $32.22 Debt/EBITDA: 0.3x
2007A 2008E 2009E
EPS $�.43 $�.69 $�.92P/E 24.2x 20.5x �8.0xAnnual EPS Gth % �3.5% �8.2% �3.6%THI CN Equity
Feb-07 Apr-07 Jun-07 Jul-07 Sep-07 Nov-07 Dec-07 Feb-0828
32
36
40
44
28
32
36
40
44
As of February 29, 2008 — $34.64
Weekly Price (CDN$)
Disclosure: 4, 5, 9, �0

Nesbitt BurnsBMO R
22 Canadian Equities Guided Portfolio — March 2008
Toronto Dominion Bank (TD)
Current Price: $65.90 Sector: Financials
Company Overview
TD Bank Financial Group is one of the largest financial services providers in North America, offering comprehensive retail and commercial banking, wealth management and wholesale banking products and services. TD Bank provides a broad range of financial services through 1,700 retail branches. TD Securities offers investment banking services; TD has a discount brokerage presence in the U.S.; and TD Banknorth operates in the U.S. Northeast.
Investment Thesis
While the general outlook for the Canadian banks has moderated recently, cost reductions in the U.S. operations, increased ownership of Banknorth and growth in the contribution from the domestic bank should support the forecast of modest overall earnings growth for TD Bank. TD offers investors great underlying franchises and a very defensive business mix combined with growth options. Upon completion of the pending acquisition of Commerce Bank in the U.S., 80% of TD Bank’s earnings will come from retail banking and wealth management, both very stable businesses. BMO Capital Markets believes the Commerce Bank deal completes TD Bank’s transformation from a “wholesale heavy” Canadian bank only to a global bank with strong positions in most business lines.
Recent Developments
TD Bank recently reported first-quarter results that demonstrated the bank is well positioned to deal with the ongoing challenges in the global financial markets. Operating earnings of $1.45 per share were above the BMO Capital Markets’ forecast of $1.41. The strength was broad-based across all business lines. TD also announced a small quarterly dividend increase of $0.02 per share to $0.59 per share quarterly.
The US$8.5 billion Commerce Bank deal is expected to close next quarter. Commerce Bank has been a fast-growing, highly successful retail banking franchise in wealthy parts of the U.S. Northeast with an emphasis on convenience banking. The deal meaningfully advances TD’s retail banking strategy in the U.S., as the merged entity (Banknorth and Commerce) will be a top-five player in most markets in which it competes. Retail banking and wealth management businesses will make up over 80% of TD Bank’s earnings and would argue for a premium multiple versus the peer group.
Risks
Risks include further credit market issues, a severe downturn in global economic conditions, a significant increase in credit losses and currency fluctuations. In addition, CBH is significantly under-loaned, as two-thirds of the assets are securities. This carries with it both some risks and opportunities. It is likely that TD will take some losses at the time of closing.
TORONTO DOMINION BANK (TD) OUTPERFORM
Dividend: $2.36 Yield: 3.6%Current Price: $65.90 Book Value: $30.69Target Price: $75.00 P/BV: 2.�x52-week High: $77.�0 Market Cap ($B): $47.452-week Low: $6�.00 Debt/EBITDA: N/A
2007A 2008E 2009E
EPS $5.97 $5.75 $6.�5P/E ��.0x ��.5x �0.7xAnnual EPS Gth % 30.9% -3.7% 7.0%ROE 2�.0% �6.5% �5.7%Tier One Capital �0.3% �0.9% �0.0%TD CN Equity
Feb-07 Apr-07 Jun-07 Aug-07 Oct-07 Dec-07 Feb-0860
64
68
72
76
80
60
64
68
72
76
80
As of February 29, 2008 — $65.90
Weekly Price (CDN$)
Disclosure: 2, 3, 4, 5, 7, 9, �0, �7, �8
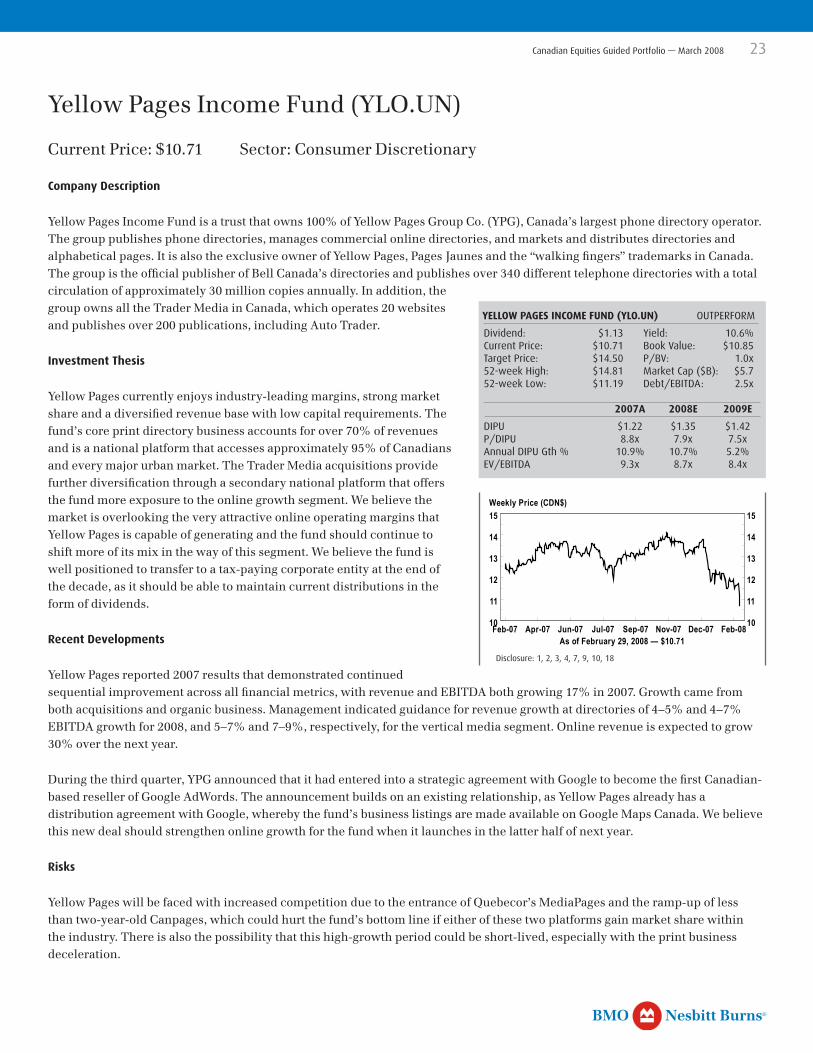
Nesbitt BurnsBMO R
Canadian Equities Guided Portfolio — March 2008 23
Yellow Pages Income Fund (YLO.UN)
Current Price: $10.71 Sector: Consumer Discretionary
Company Description
Yellow Pages Income Fund is a trust that owns 100% of Yellow Pages Group Co. (YPG), Canada’s largest phone directory operator. The group publishes phone directories, manages commercial online directories, and markets and distributes directories and alphabetical pages. It is also the exclusive owner of Yellow Pages, Pages Jaunes and the “walking fingers” trademarks in Canada. The group is the official publisher of Bell Canada’s directories and publishes over 340 different telephone directories with a total circulation of approximately 30 million copies annually. In addition, the group owns all the Trader Media in Canada, which operates 20 websites and publishes over 200 publications, including Auto Trader.
Investment Thesis
Yellow Pages currently enjoys industry-leading margins, strong market share and a diversified revenue base with low capital requirements. The fund’s core print directory business accounts for over 70% of revenues and is a national platform that accesses approximately 95% of Canadians and every major urban market. The Trader Media acquisitions provide further diversification through a secondary national platform that offers the fund more exposure to the online growth segment. We believe the market is overlooking the very attractive online operating margins that Yellow Pages is capable of generating and the fund should continue to shift more of its mix in the way of this segment. We believe the fund is well positioned to transfer to a tax-paying corporate entity at the end of the decade, as it should be able to maintain current distributions in the form of dividends.
Recent Developments
Yellow Pages reported 2007 results that demonstrated continued sequential improvement across all financial metrics, with revenue and EBITDA both growing 17% in 2007. Growth came from both acquisitions and organic business. Management indicated guidance for revenue growth at directories of 4–5% and 4–7% EBITDA growth for 2008, and 5–7% and 7–9%, respectively, for the vertical media segment. Online revenue is expected to grow 30% over the next year.
During the third quarter, YPG announced that it had entered into a strategic agreement with Google to become the first Canadian-based reseller of Google AdWords. The announcement builds on an existing relationship, as Yellow Pages already has a distribution agreement with Google, whereby the fund’s business listings are made available on Google Maps Canada. We believe this new deal should strengthen online growth for the fund when it launches in the latter half of next year.
Risks
Yellow Pages will be faced with increased competition due to the entrance of Quebecor’s MediaPages and the ramp-up of less than two-year-old Canpages, which could hurt the fund’s bottom line if either of these two platforms gain market share within the industry. There is also the possibility that this high-growth period could be short-lived, especially with the print business deceleration.
YELLOW PAGES INCOME FUND (YLO.UN) OUTPERFORM
Dividend: $�.�3 Yield: �0.6%Current Price: $�0.7� Book Value: $�0.85Target Price: $�4.50 P/BV: �.0x52-week High: $�4.8� Market Cap ($B): $5.752-week Low: $��.�9 Debt/EBITDA: 2.5x
2007A 2008E 2009E
DIPU $�.22 $�.35 $�.42P/DIPU 8.8x 7.9x 7.5xAnnual DIPU Gth % �0.9% �0.7% 5.2%EV/EBITDA 9.3x 8.7x 8.4xYLO-U CN Equity
Feb-07 Apr-07 Jun-07 Jul-07 Sep-07 Nov-07 Dec-07 Feb-0810
11
12
13
14
15
10
11
12
13
14
15
As of February 29, 2008 — $10.71
Weekly Price (CDN$)
Disclosure: �, 2, 3, 4, 7, 9, �0, �8
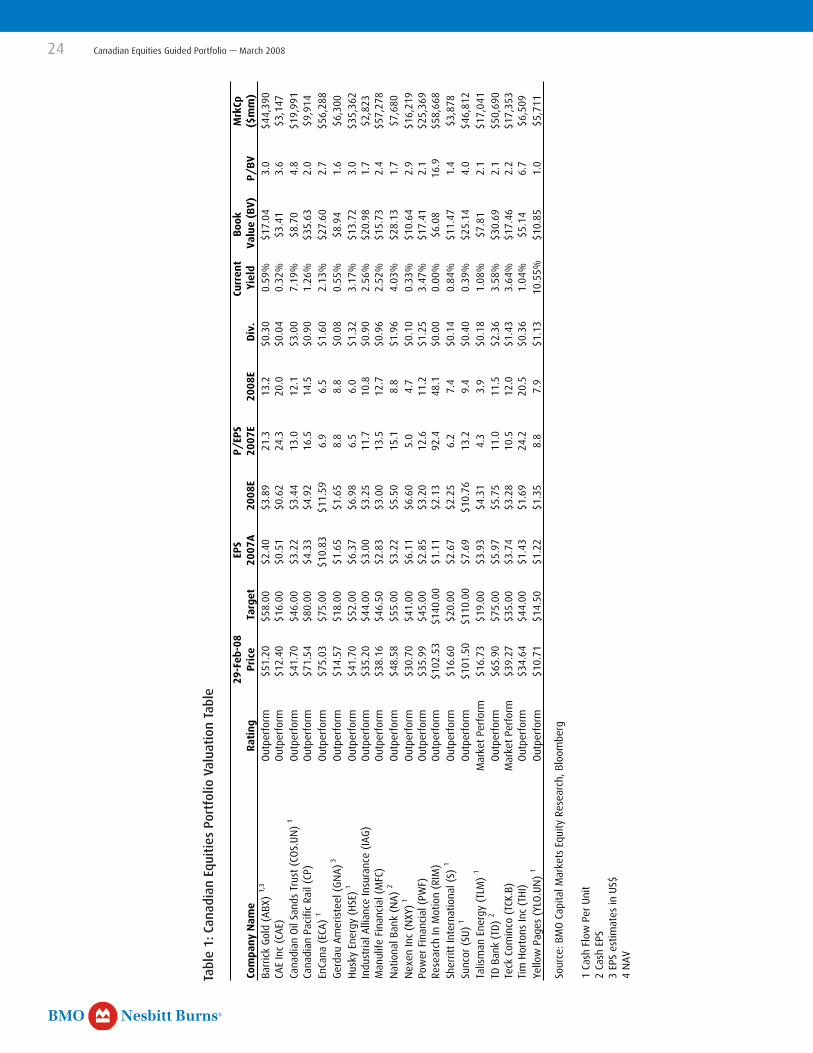
Nesbitt BurnsBMO R
24 Canadian Equities Guided Portfolio — March 2008
29
-Feb
-08
EPS
P/
EPS
Curr
ent
Boo
k M
rkCp
Com
pan
y N
ame
Rat
ing
Pri
ceTa
rget
2007
A20
08E
2007
E20
08E
Div
.Yi
eld
Valu
e (B
V)P
/B
V($
mm
)Ba
rric
k G
old
(ABX
) 1,
3O
utpe
rfor
m$5
1.20
$58.
00$2
.40
$3.8
921
.313
.2$0
.30
0.59
%$1
7.04
3.0
$44,
390
CAE
Inc
(CA
E)O
utpe
rfor
m$1
2.40
$16.
00$0
.51
$0.6
224
.320
.0$0
.04
0.32
%$3
.41
3.6
$3,1
47Ca
nadi
an O
il Sa
nds
Trus
t (C
OS.
UN
) 1
Out
perf
orm
$41.
70$4
6.00
$3.2
2$3
.44
13.0
12.1
$3.0
07.
19%
$8.7
04.
8$1
9,99
1Ca
nadi
an P
acifi
c Ra
il (C
P)O
utpe
rfor
m$7
1.54
$80.
00$4
.33
$4.9
216
.514
.5$0
.90
1.26
%$3
5.63
2.0
$9,9
14En
Cana
(EC
A)
1O
utpe
rfor
m$7
5.03
$75.
00$1
0.83
$11.
596.
96.
5$1
.60
2.13
%$2
7.60
2.7
$56,
288
Ger
dau
Am
eris
teel
(G
NA
) 3O
utpe
rfor
m$1
4.57
$18.
00$1
.65
$1.6
58.
88.
8$0
.08
0.55
%$8
.94
1.6
$6,3
00H
usky
Ene
rgy
(HSE
) 1O
utpe
rfor
m$4
1.70
$52.
00$6
.37
$6.9
86.
56.
0$1
.32
3.17
%$1
3.72
3.0
$35,
362
Indu
stria
l Alli
ance
Insu
ranc
e (I
AG
)O
utpe
rfor
m$3
5.20
$44.
00$3
.00
$3.2
511
.710
.8$0
.90
2.56
%$2
0.98
1.7
$2,8
23M
anul
ife F
inan
cial
(M
FC)
Out
perf
orm
$38.
16$4
6.50
$2.8
3$3
.00
13.5
12.7
$0.9
62.
52%
$15.
732.
4$5
7,27
8N
atio
nal B
ank
(NA
) 2
Out
perf
orm
$48.
58$5
5.00
$3.2
2$5
.50
15.1
8.8
$1.9
64.
03%
$28.
131.
7$7
,680
Nex
en In
c (N
XY) 1
Out
perf
orm
$30.
70$4
1.00
$6.1
1$6
.60
5.0
4.7
$0.1
00.
33%
$10.
642.
9$1
6,21
9Po
wer
Fin
anci
al (
PWF)
Out
perf
orm
$35.
99$4
5.00
$2.8
5$3
.20
12.6
11.2
$1.2
53.
47%
$17.
412.
1$2
5,36
9Re
sear
ch In
Mot
ion
(RIM
)O
utpe
rfor
m$1
02.5
3$1
40.0
0$1
.11
$2.1
392
.448
.1$0
.00
0.00
%$6
.08
16.9
$58,
668
Sher
ritt
Inte
rnat
iona
l (S)
1O
utpe
rfor
m$1
6.60
$20.
00$2
.67
$2.2
56.
27.
4$0
.14
0.84
%$1
1.47
1.4
$3,8
78Su
ncor
(SU
) 1
Out
perf
orm
$101
.50
$110
.00
$7.6
9$1
0.76
13.2
9.4
$0.4
00.
39%
$25.
144.
0$4
6,81
2Ta
lism
an E
nerg
y (T
LM)
1M
arke
t Pe
rfor
m$1
6.73
$19.
00$3
.93
$4.3
14.
33.
9$0
.18
1.08
%$7
.81
2.1
$17,
041
TD B
ank
(TD
) 2
Out
perf
orm
$65.
90$7
5.00
$5.9
7$5
.75
11.0
11.5
$2.3
63.
58%
$30.
692.
1$5
0,69
0Te
ck C
omin
co (
TCK.
B)
Mar
ket
Perf
orm
$39.
27$3
5.00
$3.7
4$3
.28
10.5
12.0
$1.4
33.
64%
$17.
462.
2$1
7,35
3Ti
m H
orto
ns In
c (T
HI)
Out
perf
orm
$34.
64$4
4.00
$1.4
3$1
.69
24.2
20.5
$0.3
61.
04%
$5.1
46.
7$6
,509
Yello
w P
ages
(YL
O.U
N)
1O
utpe
rfor
m$1
0.71
$14.
50$1
.22
$1.3
58.
87.
9$1
.13
10.5
5%$1
0.85
1.0
$5,7
11
Sour
ce: B
MO
Cap
ital M
arke
ts E
quity
Res
earc
h, B
loom
berg
1 Ca
sh F
low
Per
Uni
t2
Cash
EPS
3 EP
S es
timat
es in
US$
4 N
AV
Tabl
e 1:
Can
adia
n Eq
uiti
es P
ortf
olio
Val
uati
on T
able

Nesbitt BurnsBMO R
Canadian Equities Guided Portfolio — March 2008 25
Table 3: Canadian dollar denominated total returns (%)
Year-to-date
Since Inception*
Canadian Equities Portfolio -1.8% -1.1%S&P/TSX Composite Index -2.5% -1.0%
* Total return since inception date of Dec-03-07.
Table 2: Individual Stock Quarterly Performance
Price as of Price as of3-Dec-07 2/29/2008 Return*
Barrick Gold (ABX) $41.00 $51.20 24.9%Brookfield Asset Management (BAM.A) $35.84 $29.12 -18.4%Calloway REIT (CWT.UN) $23.87 $21.55 -8.1%CIBC (CM) $86.64 $66.79 -21.9%CP Railway (CP) $63.78 $71.54 12.5%EnCana (ECA) $64.85 $75.03 16.0%Finning International (FTT) $28.00 $27.75 -0.5%Gerdau Steel (GNA) $12.54 $14.57 18.3%Industrial Alliance (IAG) $42.52 $35.20 -16.7%Nexen (NXY) $28.45 $30.70 8.0%Power Financial (PWF) $41.68 $35.99 -12.9%Research In Motion (RIM) $104.76 $102.53 -2.1%Royal Bank (RY) $53.49 $49.39 -6.7%Sherritt Int'l (S) $13.97 $16.60 19.1%Suncor (SU) $98.38 $101.50 3.3%Talisman (TLM) $17.76 $16.73 -5.3%TD Bank (TD) $73.79 $65.90 -9.9%Teck Cominco (TCK.B) $37.48 $39.27 6.1%Tim Hortons (THI) $38.70 $34.64 -10.3%Yellow Pages (YLO.UN) $13.83 $10.71 -20.6%
* Including dividends.

Nesbitt BurnsBMO R
26 Canadian Equities Guided Portfolio — March 2008
Table 4: Canadian Equities Guided Portfolio Stocks At A Glance
financials
S&P/TSX Weight: 28.�%Recommended: Mkt Weight
utilities
S&P/TSX Weight: 4.8% Recommended: Under Weight
telecom services
S&P/TSX Weight: 5.0% Recommended: Under Weight
Primary
moderate aggressive
alternatives
inter
est s
en
sit
ive
Co
nsu
mer
ind
ustr
ials
teC
hn
olo
gy
en
er
gy
ENERGY*
Canadian Oilsands (COS.UN) Imperial Oil (IMO) ARC Energy (AET.un) EnCana (ECA) Petro Canada (PCA) Enerplus (ERF.un) Husky (HSE) CDN Natural Resources (CNQ) Penn West (PWT.UN) Nexen (NXY) Bonavista (BNP.UN) Suncor (SU) Talisman (TLM)
ma
ter
ials
BASIC MATERIALS
Barrick Gold (ABX) Potash (POT) Agrium (AGU) Gerdau Ameristeel (GNA) Kinross Gold (K) Quadra Mining (QUA) Sherritt Int’l (S) Goldcorp (G) Silver Wheaton (SLW) Teck Cominco (TCK.B) Franco-Nevada (FNV) Claymore Global Agr. ETF (COW)
discretionary
S&P/TSX Weight: 4.3%Recommended: Mkt Weight
staples
S&P/TSX Weight: 2.3% Recommended: Mkt Weight
healthcare
S&P/TSX Weight: 0.4% Recommended: Mkt Weight
industrials
S&P/TSX Weight: 5.5%Recommended: Mkt Weight
information technology
S&P/TSX Weight: 4.4%Recommended: Mkt Weight
energy
S&P/TSX Weight: 25.6%Recommended: Under Weight
basic materials
S&P/TSX Weight: �9.7%Recommended: Over Weight
{{{{
{{
INDUSTRIALS
CP Railway (CP) Toromont (TIH) Stantec (STN) CAE (CAE) CN Railway (CNR) Finning (FTT)
INFORMATION TECHNOLOGY
Research In Motion (RIM) MDA (MDA) Open Text (OTC) Evertz Technologies (ET)
FINANCIALS Industrial Alliance (IAG) Bank of Nova Scotia (BNS) CIBC (CM) Manulife (MFC) Bank of Montreal (BMO) Onex Corp. (OCX) National Bank (NA) Great-West Life Co. (GWF) Home Capital (HCG) Power Financial (PWF) Sun Life (SLF) H&R REIT (HR.un) Toronto Dominion Bank (TD) Brookfield Asset Management (BAM.A) RioCan (REI.un) Calloway REIT (CWT.UN) Royal Bank (RY)
UTILITIES* Emera (EMA) Fortis (FTS) Enbridge (ENB) TransCanada Corp. (TRP)
TELECOM SERVICES TELUS (T)
DISCRETIONARY Tim Hortons (THI) Thomson (TOC) Cineplex Income Fund (CGX.un) Yellow Pages (YLO.un) Cogeco (CCA)
STAPLES Rothmans Inc (ROC) Viterra (VT) Saputo (SAP) Alimentation Couche-Tard (ATD.B)
HEALTHCARE CML Healthcare (CLC.UN)
Energy and Utilities have been adjusted to reflect pipeline companies Bold indicates stock has been downgraded mid quarter — see Mid-Quarter Update for recommendation Italics indicates stock on restricted list
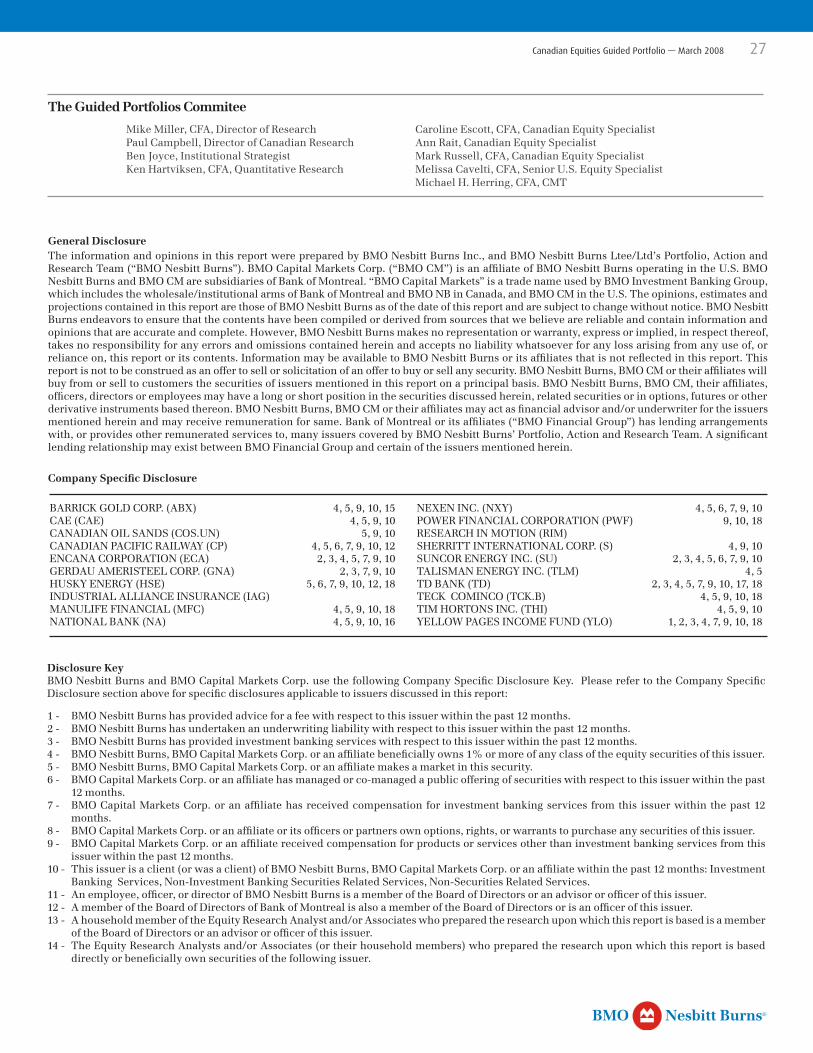
Nesbitt BurnsBMO R
Canadian Equities Guided Portfolio — March 2008 27
General DisclosureThe information and opinions in this report were prepared by BMO Nesbitt Burns Inc., and BMO Nesbitt Burns Ltee/Ltd’s Portfolio, Action and Research Team (“BMO Nesbitt Burns”). BMO Capital Markets Corp. (“BMO CM”) is an affiliate of BMO Nesbitt Burns operating in the U.S. BMO Nesbitt Burns and BMO CM are subsidiaries of Bank of Montreal. “BMO Capital Markets” is a trade name used by BMO Investment Banking Group, which includes the wholesale/institutional arms of Bank of Montreal and BMO NB in Canada, and BMO CM in the U.S. The opinions, estimates and projections contained in this report are those of BMO Nesbitt Burns as of the date of this report and are subject to change without notice. BMO Nesbitt Burns endeavors to ensure that the contents have been compiled or derived from sources that we believe are reliable and contain information and opinions that are accurate and complete. However, BMO Nesbitt Burns makes no representation or warranty, express or implied, in respect thereof, takes no responsibility for any errors and omissions contained herein and accepts no liability whatsoever for any loss arising from any use of, or reliance on, this report or its contents. Information may be available to BMO Nesbitt Burns or its affiliates that is not reflected in this report. This report is not to be construed as an offer to sell or solicitation of an offer to buy or sell any security. BMO Nesbitt Burns, BMO CM or their affiliates will buy from or sell to customers the securities of issuers mentioned in this report on a principal basis. BMO Nesbitt Burns, BMO CM, their affiliates, officers, directors or employees may have a long or short position in the securities discussed herein, related securities or in options, futures or other derivative instruments based thereon. BMO Nesbitt Burns, BMO CM or their affiliates may act as financial advisor and/or underwriter for the issuers mentioned herein and may receive remuneration for same. Bank of Montreal or its affiliates (“BMO Financial Group”) has lending arrangements with, or provides other remunerated services to, many issuers covered by BMO Nesbitt Burns’ Portfolio, Action and Research Team. A significant lending relationship may exist between BMO Financial Group and certain of the issuers mentioned herein.
Company Specific Disclosure
Disclosure KeyBMO Nesbitt Burns and BMO Capital Markets Corp. use the following Company Specific Disclosure Key. Please refer to the Company Specific Disclosure section above for specific disclosures applicable to issuers discussed in this report:
1 - BMO Nesbitt Burns has provided advice for a fee with respect to this issuer within the past 12 months.2 - BMO Nesbitt Burns has undertaken an underwriting liability with respect to this issuer within the past 12 months.3 - BMO Nesbitt Burns has provided investment banking services with respect to this issuer within the past 12 months.4 - BMO Nesbitt Burns, BMO Capital Markets Corp. or an affiliate beneficially owns 1% or more of any class of the equity securities of this issuer.5 - BMO Nesbitt Burns, BMO Capital Markets Corp. or an affiliate makes a market in this security.6 - BMO Capital Markets Corp. or an affiliate has managed or co-managed a public offering of securities with respect to this issuer within the past
12 months.7 - BMO Capital Markets Corp. or an affiliate has received compensation for investment banking services from this issuer within the past 12
months.8 - BMO Capital Markets Corp. or an affiliate or its officers or partners own options, rights, or warrants to purchase any securities of this issuer.9 - BMO Capital Markets Corp. or an affiliate received compensation for products or services other than investment banking services from this
issuer within the past 12 months. 10 - This issuer is a client (or was a client) of BMO Nesbitt Burns, BMO Capital Markets Corp. or an affiliate within the past 12 months: Investment
Banking Services, Non-Investment Banking Securities Related Services, Non-Securities Related Services. 11 - An employee, officer, or director of BMO Nesbitt Burns is a member of the Board of Directors or an advisor or officer of this issuer.12 - A member of the Board of Directors of Bank of Montreal is also a member of the Board of Directors or is an officer of this issuer.13 - A household member of the Equity Research Analyst and/or Associates who prepared the research upon which this report is based is a member
of the Board of Directors or an advisor or officer of this issuer.14 - The Equity Research Analysts and/or Associates (or their household members) who prepared the research upon which this report is based
directly or beneficially own securities of the following issuer.
BARRICK GOLD CORP. (ABX) 4, 5, 9, 10, 15CAE (CAE) 4, 5, 9, 10CANADIAN OIL SANDS (COS.UN) 5, 9, 10CANADIAN PACIFIC RAILWAY (CP) 4, 5, 6, 7, 9, 10, 12ENCANA CORPORATION (ECA) 2, 3, 4, 5, 7, 9, 10GERDAU AMERISTEEL CORP. (GNA) 2, 3, 7, 9, 10HUSKY ENERGY (HSE) 5, 6, 7, 9, 10, 12, 18INDUSTRIAL ALLIANCE INSURANCE (IAG)MANULIFE FINANCIAL (MFC) 4, 5, 9, 10, 18NATIONAL BANK (NA) 4, 5, 9, 10, 16
NEXEN INC. (NXY) 4, 5, 6, 7, 9, 10POWER FINANCIAL CORPORATION (PWF) 9, 10, 18RESEARCH IN MOTION (RIM)SHERRITT INTERNATIONAL CORP. (S) 4, 9, 10SUNCOR ENERGY INC. (SU) 2, 3, 4, 5, 6, 7, 9, 10TALISMAN ENERGY INC. (TLM) 4, 5TD BANK (TD) 2, 3, 4, 5, 7, 9, 10, 17, 18TECK COMINCO (TCK.B) 4, 5, 9, 10, 18TIM HORTONS INC. (THI) 4, 5, 9, 10YELLOW PAGES INCOME FUND (YLO) 1, 2, 3, 4, 7, 9, 10, 18
The Guided Portfolios Commitee
Mike Miller, CFA, Director of ResearchPaul Campbell, Director of Canadian ResearchBen Joyce, Institutional StrategistKen Hartviksen, CFA, Quantitative Research
Caroline Escott, CFA, Canadian Equity Specialist Ann Rait, Canadian Equity SpecialistMark Russell, CFA, Canadian Equity SpecialistMelissa Cavelti, CFA, Senior U.S. Equity SpecialistMichael H. Herring, CFA, CMT
Nesbitt BurnsBMO R
28 Canadian Equities Guided Portfolio — March 2008
15 - BMO Nesbitt Burns Inc, Barrick Gold Corporation and others are defendants in a U.S. securities fraud action on behalf of U.S. purchasers of Bre-X stock. That action is in the early stages of pretrial proceedings. No assessment of the risks created by the legal action or of the potential for adverse claims between or among defendants was undertaken in preparing this report and none is reflected herein.
16 - BMO Nesbitt Burns Inc., National Bank Financial Inc. (a subsidiary of National Bank), along with others, were named as defendants in three proposed class actions relating to FMF Capital Income Participating Securities. The class actions have now been settled and the claims administrator is in the course of reviewing the claims of the class members. No assessment of the merits of the legal actions or of the potential for adverse claims between or among defendants is reflected in this report.
17 - BMO Nesbitt Burns Inc., TD Securities Inc. (a subsidiary of TD Bank), along with others, were named as defendants in three proposed class actions relating to FMF Capital Income Participating Securities. The class actions have now been settled and the claims administrator is in the course of reviewing the claims of the class members. No assessment of the merits of the legal actions or of the potential for adverse claims between or among defendants is reflected in this report.
18 - The authors of this report (or their household members) directly or beneficially own securities of this issuer: Common Shares - HSE, MFC, PWF, TD, TCK, YLO
19 - A household member of the authors of this report is a member of the Board of Directors or an advisor or officer of this issuer.
Dissemination of Reports BMO Nesbitt Burns Portfolio, Action and Research Team’s reports are made widely available at the same time to all BMO Nesbitt Burns Investment Advisors. Please contact your Investment Advisor for more information.
Additional Matters TO U.S. RESIDENTS: BMO CM and/or BMO Nesbitt Burns Securities Ltd., affiliates of BMO Nesbitt Burns, furnish this report to U.S. residents and accept responsibility for the contents herein subject to the terms as set out above. Any U.S. person wishing to effect transactions in any security discussed herein should do so through BMO CM and/or BMO Nesbitt Burns Securities Ltd. TO U.K. RESIDENTS: The contents hereof are intended solely for the use of, and may only be issued or passed onto, persons described in part VI of the Financial Services and Markets Act 2000 (Financial Promotion) Order 2001.
BMO Nesbitt Burns is a Member of CIPF. BMO CM is a Member of SIPC.
® BMO and the roundel symbol are registered trade-marks of Bank of Montreal, used under license.
RT11050_A2 (03/08)

Nesbitt BurnsBMO R
Canadian Equities Guided Portfolio — March 2008 29
— Notes —

Nesbitt BurnsBMO R