Embed Size (px)
Citation preview

Rich Weiss
Senior Vice President
Senior Portfolio Manager
Portfolio Construction:
Rethinking Global Asset Allocation
ACI-1010142

Agenda
It’s a Changed World
Game Changers
A Leading-Edge Approach
2 FOR INSTITUTIONAL USE ONLY/NOT FOR PUBLIC USE

CDO MBS
SIV CLO
BB / CCC / CC / C / D
The Financial Bailout
A Simple Flowchart
CPA, CFP or a CFA
APR on ARMs
FNMA FHLMC
GSEs
CPI, PPI, GDP IPD,
et. al. … FDIC
FED, FOMC,
ECB, BofJ, &
SEC
PDQ
WSJ FHFA
LTVs BS, LEH, AIG
FUBAR …
FASB /
GAAP:
EPS, ROE,
ROI, P/E,
etc.
H1N1
I.O.U.
3 FOR INSTITUTIONAL USE ONLY/NOT FOR PUBLIC USE

In the past 40 years, how many times has the U.S. been the best performing equity market?
a. 27
b. 13
c. 4
d. 1
Pop Quiz – Building a Global Portfolio
4 FOR INSTITUTIONAL USE ONLY/NOT FOR PUBLIC USE

Performance Rankings by CountryBased on Annual Returns of MSCI Indices, 2002 - 2015
2002 2003 2004 2005 2006 2007 2008 2009 2010 2011 2012 2013 2014 2015
NEW ZEALAND GREECE AUSTRIA ISRAEL SPAIN FINLAND JAPAN NORWAY SWEDEN IRELAND BELGIUM GREECE ISRAEL DENMARK
AUSTRIA SWEDEN NORWAY JAPAN PORTUGAL HONG KONG ISRAEL AUSTRALIA DENMARK NEW ZEALAND DENMARK FINLAND USA IRELAND
AUSTRALIA GERMANY GREECE AUSTRIA IRELAND ISRAEL SWITZERLAND SINGAPORE HONG KONG USA SINGAPORE IRELAND NEW ZEALAND BELGIUM
NORWAY SPAIN BELGIUM DENMARK SINGAPORE GERMANY USA SWEDEN SINGAPORE UNITED KINGDOM GERMANY USA DENMARK ISRAEL
ITALY ISRAEL IRELAND NORWAY NORWAY GREECE SPAIN HONG KONG JAPAN SWITZERLAND NEW ZEALAND GERMANY HONG KONG JAPAN
JAPAN AUSTRIA SWEDEN FINLAND SWEDEN NORWAY FRANCE BELGIUM USA NORWAY HONG KONG SPAIN BELGIUM AUSTRIA
SWITZERLAND NEW ZEALAND NEW ZEALAND SWITZERLAND DENMARK SINGAPORE GERMANY ISRAEL AUSTRALIA BELGIUM AUSTRIA NETHERLANDS SINGAPORE ITALY
SINGAPORE AUSTRALIA ITALY GREECE BELGIUM AUSTRALIA SINGAPORE NEW ZEALAND SWITZERLAND AUSTRALIA AUSTRALIA BELGIUM IRELAND FINLAND
PORTUGAL DENMARK DENMARK AUSTRALIA AUSTRIA DENMARK DENMARK SPAIN NORWAY NETHERLANDS SWEDEN JAPAN SWITZERLAND NETHERLANDS
BELGIUM NORWAY AUSTRALIA SINGAPORE GERMANY PORTUGAL NETHERLANDS UNITED KINGDOM FINLAND SPAIN FRANCE SWITZERLAND FINLAND PORTUGAL
UNITED KINGDOM IRELAND SPAIN NETHERLANDS GREECE SPAIN UNITED KINGDOM AUSTRIA AUSTRIA JAPAN NETHERLANDS FRANCE AUSTRALIA USA
SPAIN PORTUGAL HONG KONG SWEDEN FRANCE NETHERLANDS SWEDEN NETHERLANDS UNITED KINGDOM SWEDEN SWITZERLAND DENMARK NETHERLANDS SWITZERLAND
DENMARK FRANCE PORTUGAL GERMANY ITALY FRANCE ITALY PORTUGAL GERMANY DENMARK NORWAY SWEDEN JAPAN FRANCE
HONG KONG HONG KONG SINGAPORE FRANCE NETHERLANDS NEW ZEALAND AUSTRALIA DENMARK NEW ZEALAND HONG KONG USA UNITED KINGDOM SPAIN HONG KONG
NETHERLANDS ITALY ISRAEL BELGIUM AUSTRALIA UNITED KINGDOM HONG KONG FRANCE ISRAEL FRANCE UNITED KINGDOM ITALY UNITED KINGDOM GERMANY
FRANCE SINGAPORE UNITED KINGDOM HONG KONG UNITED KINGDOM ITALY PORTUGAL ITALY NETHERLANDS SINGAPORE FINLAND AUSTRIA SWEDEN SWEDEN
USA JAPAN FRANCE UNITED KINGDOM HONG KONG USA NEW ZEALAND USA BELGIUM GERMANY ITALY NEW ZEALAND ITALY NEW ZEALAND
GREECE BELGIUM GERMANY USA FINLAND SWITZERLAND FINLAND SWITZERLAND FRANCE PORTUGAL JAPAN HONG KONG FRANCE UNITED KINGDOM
IRELAND SWITZERLAND JAPAN SPAIN SWITZERLAND AUSTRIA NORWAY GERMANY PORTUGAL ITALY IRELAND PORTUGAL GERMANY AUSTRALIA
FINLAND UNITED KINGDOM SWITZERLAND ITALY NEW ZEALAND SWEDEN GREECE GREECE ITALY ISRAEL GREECE ISRAEL NORWAY NORWAY
SWEDEN USA NETHERLANDS NEW ZEALAND USA BELGIUM BELGIUM IRELAND IRELAND FINLAND PORTUGAL NORWAY AUSTRIA SPAIN
ISRAEL NETHERLANDS USA PORTUGAL JAPAN JAPAN AUSTRIA FINLAND SPAIN AUSTRIA SPAIN AUSTRALIA PORTUGAL SINGAPORE
GERMANY FINLAND FINLAND IRELAND ISRAEL IRELAND IRELAND JAPAN GREECE GREECE ISRAEL SINGAPORE GREECE GREECE
Global Investing – Country Rankings
5
Data reflects rankings based on annual returns of indices of MSCI World country constituents at the end of each annual period
Source: MSCI, Zephy r Sty leAdv isor
FOR INSTITUTIONAL USE ONLY/NOT FOR PUBLIC USE

Shift in Economic Influence
6 FOR INSTITUTIONAL USE ONLY/NOT FOR PUBLIC USE
$-
$10,000
$20,000
$30,000
$40,000
$50,000
$60,000
$70,000
$80,000
$90,000
1970 1974 1978 1982 1986 1990 1994 1998 2002 2006 2010 2014
Gross Domestic Product(in $Billions)
United States Non-U.S.
Data from 12/31/1970 to 12/31/2014Source: World Bank

World Markets Have Become More Correlated
7 FOR INSTITUTIONAL USE ONLY/NOT FOR PUBLIC USE
0%
10%
20%
30%
40%
50%
60%
70%
80%
90%
100%
1950 1955 1960 1965 1970 1975 1980 1985 1990 1995 2000 2005 2010 2015
Correlation Between S&P 500 and International Equity Markets
Rolling 60-Month CorrelationApril 1950 - December 2015
Source: Wolfe Trahan & Co. , FactSet. This information is for illustrative purposes only and is not intended to represent any particular investment product.

Traditional Approach to Asset Allocation Portfolios
8 FOR INSTITUTIONAL USE ONLY/NOT FOR PUBLIC USE
S&P 500
60/40 Balanced Portfolio
4
5
6
7
8
9
10
4 6 8 10 12 14 16 18 20
Re
turn
(A
nn
ualize
d %
)
Risk (Standard Deviation)
Ten-Year Risk/Return
Source: Morningstar Direct60/40 Balanced Portfolio represented by 50% S&P 500 Index, 10% MSCI EAFE Index, 40% Barclays Aggregate Bond Index. Rebalanced monthly. Data as of 12/31/2015This hypothetical situation contains assumptions that are intended for illustrative purposes only and are not representative of the performance of any security. There is no assurance similar results can be achieved. This information should not be relied upon as a specific recommendation to buy or sell securities.

Game Changers
1. Sector diversification is as important as country diversification
2. Alternative investments are helping to optimize the risk/return trade-off
3. Volatility instruments offer the potential to limit downside risk
9 FOR INSTITUTIONAL USE ONLY/NOT FOR PUBLIC USE

1. Sector diversification is as important as country diversification
Game Changers
10 FOR INSTITUTIONAL USE ONLY/NOT FOR PUBLIC USE

United States Japan United Kingdom
Hong Kong Switzerland France
Germany Canada Australia
South Korea Taiwan Netherlands
Spain Others < 1.0%
MSCI World Index: Country Weights
Data as of 12/31/2015Source: FactSet
Consumer Discretionary Consumer Staples
Energy Financials
Health Care Industrials
Information Technology Materials
Telecommunication Services Utilities
MSCI World Index: Sector Weights
By definition, country allocation/rotation implies sector allocation/rotation. They are two sides of the
same coin.
Global Sector Allocation
11 FOR INSTITUTIONAL USE ONLY/NOT FOR PUBLIC USE

MSCI United States Index
Consumer Discretionary Consumer Staples Energy
Financials Health Care Industrials
Information Technology Materials Telecommunication Services
Utilities
Data as of 12/31/2015Source: FactSet
MSCI Japan Index MSCI New Zealand Index
MSCI Country Sector Weights
12 FOR INSTITUTIONAL USE ONLY/NOT FOR PUBLIC USE

Sector Diversification as Important as Country Diversification
Source: "The Rise of Sector Effects in Major Equity Markets", by Baca, Garbe, and Weiss, Financial Analysts Journal, Sept/Oct 2000, pages 34-40
13 FOR INSTITUTIONAL USE ONLY/NOT FOR PUBLIC USE

14
Data from MSCI confirm that the relative strength of countries and industries in explaining global stock returns has become roughly
equivalent through 2010.
Global Sector Rotation – Additional Evidence
FOR INSTITUTIONAL USE ONLY/NOT FOR PUBLIC USE
0
0.5
1
1.5
2
2.5
3
3.5
4
4.5
1994 1995 1996 1997 1998 1999 2000 2001 2002 2003 2004 2005 2006 2007 2008 2009 2010
MA
D (
\Pe
rce
nt
Mo
nth
ly)
Countries (World) Industries (World)
Results are based on cap-weighted regressions and cap-weighted segment averages.Data from April 2011. Source: MSCI
Mean Absolute Deviation for 48-Country Global Model

Central banks lower interest
rates to spur growth,
stimulating the financials
sector.
1
Lower interest rates
generate greater
consumption and
production, revitalizing the
consumer goods
sectors.
2
Higher demand for
consumer goods in turn
boosts activity in the
services sector and
subsequently the
industrials sector.
3
Heightened demand in the
industrials sectors intensifies
demand for raw materials,
stimulating the resources
sectors.
4
Rising demand eventually
causes inflation to
accelerate at a global level.
In response, central banks
raise interest rates. With the
onset of recession, the
defensive characteristics of
the utilities sector grow
increasingly attractive.
5
In time, central banks again
lower interest rates to promote
expansion, and a new cycle
begins.
6
Classic Economic Sector Rotation Cycle
15
Consumer
Goods
Services
Resources
Industrials
Financials
Utilities
FOR INSTITUTIONAL USE ONLY/NOT FOR PUBLIC USE

Quantitatively-Disciplined Global Sector Return Forecasts
16
Fundamental Valuation Measures
Dividend yields 1
2
3
FOR INSTITUTIONAL USE ONLY/NOT FOR PUBLIC USE
Economically Driven Factors
Cyclical momentum
Industrial production
Interest rates
Inflation
Yield spreads
Credit spreads
Technical Indicators
Volatility
Sector-specific momentum

Current Global Sector Forecasts
17 FOR INSTITUTIONAL USE ONLY/NOT FOR PUBLIC USE
-1.5%
-1.0%
-0.5%
0.0%
0.5%
1.0%
1.5%
Proprietary Equity Sector Return ExpectationsExcess Returns Relative to MSCI ACWI
Current Previous
Data as of 1/31/2016. Global equity sector forecasts based on proprietary asset allocation models. Forecasts show normalized excess returns relative to the MSCI ACWI. Source: American Century Investments, MSCI

2. Alternative investments are helping to optimize the risk/return trade-off
Game Changers
18 FOR INSTITUTIONAL USE ONLY/NOT FOR PUBLIC USE

Liquid alternatives
Alternative strategies
packaged in vehicles that
provide daily or weekly
pricing and liquidity in accord
with U.S. and European
regulations for investments
that are broadly marketed to
the public.
40 Act Mutual Funds,
ETFs
SMAs
UCITS
Listed securities such as
closed-end funds
Asset Class Framework
19
Illiquid Alternatives
Liquid Alternatives
Extended
Traditional
Large cap equity
Mid/small cap equity
International equity
Core fixed income
Emerging markets equity
REITs/Global REITs
International fixed income
Emerging markets debt
High yield bonds
TIPS
Sector funds
Market neutral
130/30
Global macro
Managed futures
Commodities – CTA, ETN
Currency
Direct real estate
Private equity
Infrastructure
Hedge funds
Collectibles (Art, Coins, Wine)
FOR INSTITUTIONAL USE ONLY/NOT FOR PUBLIC USE

The World of International Investing
192 Countries
20
Source: Shutterstock
Image ID: 64143952
Used with permission.
FOR INSTITUTIONAL USE ONLY/NOT FOR PUBLIC USE

Global Equity Markets
Nepal
Panama
Papua New Guinea
Paraguay
Serbia
Montenegro
Sri Lanka
Tanzania
Uganda
Uruguay
Uzbekistan
West Bank
Gaza
Cayman Islands
United States
Japan
United Kingdom
France
Germany
Canada
Hong Kong
Italy
Switzerland
Spain
Australia
Taiwan
South Korea
Saudi Arabia
Netherlands
India
Sweden
China
Brazil
Russia
Belgium
South Africa
Singapore
Mexico
Finland
Malaysia
Norway
Denmark
U.A.E.
Austria
Greece
Chile
Turkey
Thailand
Ireland
Kuwait
Israel
Indonesia
Qatar
Poland
Portugal
Argentina
Egypt
New Zealand
Czech Republic
Pakistan
Philippines
Hungary
Jordan
Colombia
Luxembourg
Morocco
Peru
Ukraine
Iceland
Bahrain
Romania
Nigeria
Oman
Croatia
Cyprus
Lithuania
Venezuela
Slovenia
Jamaica
Kenya
Slovakia
Botswana
Trinidad
Lebanon
Tunisia
Estonia
Zimbabwe
Malta
Mauritius
Bulgaria
Latvia
Bermuda
Ghana
Zambia
Barbados
Swaziland
Malawi
Vietnam
Argentina
Armenia
Bangladesh
Bolivia
Costa Rica
Cote d'lvoire
Ecuador
El Salvador
Fiji
Georgia
Guyana
Iran
Kazakhstan
Kyrgyz Republic
Macedonia
Moldova
Mongolia
Namibia
116 Countries: 50,000 Equity Securities
21
As of 12/31/2012
Source: MSCI
FOR INSTITUTIONAL USE ONLY/NOT FOR PUBLIC USE

$0
$500
$1,000
$1,500
$2,000
$2,500
$3,000
$3,500
Emerging Markets - Equity Market Capitalization ($U.S. Billions)
Data as of 3/31/2016
Source: FactSet
Emerging Markets - Equity Market Capitalization
22 FOR INSTITUTIONAL USE ONLY/NOT FOR PUBLIC USE

$0
$10
$20
$30
$40
$50
$60
$70
$80
Frontier Markets - Equity Market Capitalization ($U.S. Billions)
Data as of 3/31/2016; Data for Bill Gates' estimated net worth as of 3/31/2016
Source: FactSet, Bloomberg
“Frontier” Markets - Equity Market Capitalization
23 FOR INSTITUTIONAL USE ONLY/NOT FOR PUBLIC USE

“BRIC” (Brazil / Russia / India / China)
“Malarkey” (Malaysia / Turkey)
“Thailitius” (Thailand / Mauritius)
“Chileconcarne” (Chile / Morocco / Ukraine)
“Upper Colon” (Upper Estonia / Colombia / Lebanon)
Emerging Market Investing
Rule of Thumb
Avoid Nicknames (e.g. “BRIC”, “Lefty”)
24 FOR INSTITUTIONAL USE ONLY/NOT FOR PUBLIC USE

Lower portfolio volatility
– Lower correlation
– Increased diversification
Separation of Alpha versus Beta
Earn an illiquidity premium
Benefits of Alternative Investments
25 FOR INSTITUTIONAL USE ONLY/NOT FOR PUBLIC USE
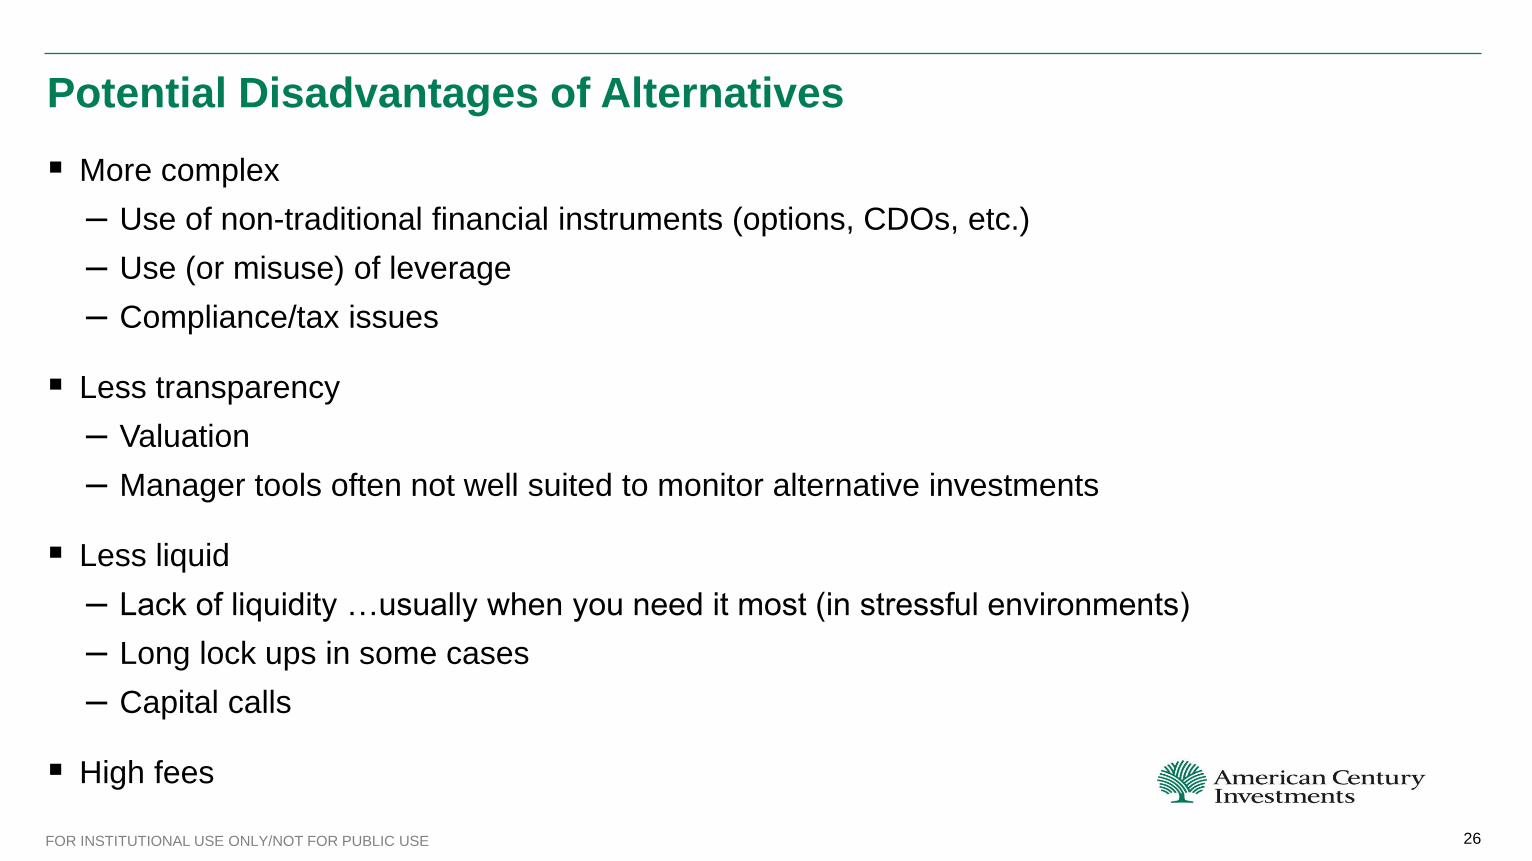
More complex
– Use of non-traditional financial instruments (options, CDOs, etc.)
– Use (or misuse) of leverage
– Compliance/tax issues
Less transparency
– Valuation
– Manager tools often not well suited to monitor alternative investments
Less liquid
– Lack of liquidity …usually when you need it most (in stressful environments)
– Long lock ups in some cases
– Capital calls
High fees
Potential Disadvantages of Alternatives
26 FOR INSTITUTIONAL USE ONLY/NOT FOR PUBLIC USE

Commodities
27 FOR INSTITUTIONAL USE ONLY/NOT FOR PUBLIC USE
0
50
100
150
200
250
1969 1971 1973 1975 1977 1979 1981 1983 1985 1987 1989 1991 1993 1995 1997 1999 2001 2003 2005 2007 2009 2011 2013 2015
Bloomberg Commodity Index Returns December 1969 to December 2015
Source: Bloomberg, Federal Reserve Bank of St. Louis, American Century
Annualized excess return Jan 1970 – Dec 2007: 5.4% Correlation with U.S. Stocks: 2%
Annualized excess return Jan 2008 - Dec 2015: -10.2%Correlation with U.S. Stocks: 54%

Roll returns diminished
after 1991,
commensurate with an
increase in the availability
and demand for
commodity-linked
products
Roll Cost and Diversification Benefits of Commodities
28 FOR INSTITUTIONAL USE ONLY/NOT FOR PUBLIC USE
-25%
-20%
-15%
-10%
-5%
0%
5%
10%
15%
20%
25%
1991 1993 1995 1997 1999 2001 2003 2005 2007 2009 2011 2013 2015
DJ-UBS Return Decomposition
Roll Return
Data as of 12/31/2015Source: Bloomberg, Federal Reserve Bank of St. Louis, American Century

Roll Cost and Diversification Benefits of Commodities
29 FOR INSTITUTIONAL USE ONLY/NOT FOR PUBLIC USE
-0.4
-0.2
0.0
0.2
0.4
0.6
0.8
1.0
1990 1991 1992 1993 1994 1995 1996 1997 1998 1999 2000 2001 2002 2003 2004 2005 2006 2007 2008 2009 2010 2011 2012 2013 2014 2015
Bloomberg Commodity Index and MSCI Emerging MarketsRolling 36-Month Correlation - January 1991 - December 2015
Source: Bloomberg, Federal Reserve Bank of St. Louis, American Century

Emerging Market Debt
30
Return (%) Std Dev (%) Sharpe Ratio Correlations to
EM Debt
S&P 500 8.90 13.92 0.55 0.64
Russell 2000 10.16 18.86 0.47 0.59
MSCI EAFE Index 7.95 17.24 0.39 0.77
Barclays U.S. Aggregate 4.31 3.44 0.87 0.39
Citigroup Non-USD World Government Bond
Index 3.83 8.04 0.31 0.59
BofA Merrill Lynch U.S. High Yield 8.30 9.59 0.73 0.66
MSCI U.S. REIT 11.46 23.95 0.42 0.59
S&P GSCI -4.08 24.07 -0.22 0.41
MSCI EM (Emerging Markets) 11.04 22.40 0.43 0.80
JPMorgan GBI-EM Global Diversified Unhedged
USD 6.72 11.89 0.46 1.00
Source: Zephyr StyleADVISOR
Risk/Return Table Annualized Summary Statistics: January 2003-December 2015
FOR INSTITUTIONAL USE ONLY/NOT FOR PUBLIC USE

Emerging Markets Debt
31 FOR INSTITUTIONAL USE ONLY/NOT FOR PUBLIC USE
0%
5%
10%
15%
20%
25%
Emerging Markets DebtFive-Year Annualized Standard Deviations as of 12/31/2015
Currency Debt
Average FX Volatility: 10.29%Average Debt Volatility: 5.39%
Source: FactSet

3. Volatility instruments offer the potential to limit downside risk
Game Changers
32 FOR INSTITUTIONAL USE ONLY/NOT FOR PUBLIC USE

Volatility as an Asset Class
33 FOR INSTITUTIONAL USE ONLY/NOT FOR PUBLIC USE
0%
20%
40%
60%
80%
100%
120%
1/4/1897 12/6/1904 10/28/1912 2/17/1921 1/17/1929 12/17/1936 10/25/1944 9/17/1952 7/13/1960 5/13/1968 4/7/1976 2/8/1984 12/17/1991 10/27/1999 9/21/2007 6/29/2015
Dow Jones Industrials Historical VolatilityRolling 30-Day Annualized Standard Deviation
November 291929 November 27
1987
November 142008
Data from 1/1/1987 to 12/31/2015Source: Factset

CBOE Volatility Index® (VIX) created in 1993
Measures implied or “expected” volatility of the stock market using options prices
Barometer of investor sentiment (“fear” gauge)
VIX in the Mix: The “Godfather” Asset Class
34 FOR INSTITUTIONAL USE ONLY/NOT FOR PUBLIC USE
0
10
20
30
40
50
60
70
80
90
0
500
1000
1500
2000
2500
Dec-08 Jun-09 Dec-09 Jun-10 Dec-10 Jun-11 Dec-11 Jun-12 Dec-12 Jun-13 Dec-13 Jun-14 Dec-14 Jun-15 Dec-15
VIX
S&
P 5
00
CBOE Volatility Index (VIX) with S&P500
S&P 500
VIX
Data from December 2008 to December 2015Source: FactSet
VIX

The Relationship Between Equities and VIX
35
Monday Tuesday Wednesday Thursday
8 Market falls on first
full day of trading after
S&P downgraded U.S.
credit rating
9
Market rises after first
regularly scheduled
Federal Reserve meeting
following U.S. downgrade.
10 Market falls on European
debt default concerns
11
Market rises on positive
U.S. economic news
S&P 500: -6.7%
VIX®: +50.0%
S&P 500: +4.7%
VIX®: -26.9%
S&P 500: -4.4%
VIX®: +22.6%
S&P 500: +4.6%
VIX®: -9.3%
August, 2011
FOR INSTITUTIONAL USE ONLY/NOT FOR PUBLIC USE

Autocorrelation (trending)
Mean-reverting (varies around some “normal”/historical level)
Information in term-structure
Characteristics of VIX
36 FOR INSTITUTIONAL USE ONLY/NOT FOR PUBLIC USE
-60%
-50%
-40%
-30%
-20%
-10%
0%
10%
20%
30%
40%
12 14 16 18 20 22 24 26 28 30 32 34 36 38 40 >=40
Re
turn
VIX Level
VIX Level vs. Future Returns
1-Mo Return 3-Mo Return 6-Mo Return 1-Yr Return
Data from January 1990 to December 2015Source: FactSet
January 1990 to December 2015

VIX is a mathematical formula, not an investment vehicle
VIX Index is not directly tradable
Volatility is volatile – (roughly 4x the volatility of market)
Beta, cost, and liquidity of swaps, futures, options, ETNs, and ETFs
VIX Implementation Hurdles
37 FOR INSTITUTIONAL USE ONLY/NOT FOR PUBLIC USE

U.S.-Listed VIX Futures-Linked Volatility Indices
Source: ProShares, Barclays, UBS, VelocityShares
Investment Vehicles
38
VIXY
VIXM
VXX
XXV
IVO
VXZ
VZZ
TVIX
XIV
VIIZ
TVIZ
ZIV
XVIX
FOR INSTITUTIONAL USE ONLY/NOT FOR PUBLIC USE

VIX in the Mix
39 FOR INSTITUTIONAL USE ONLY/NOT FOR PUBLIC USE
Global Balanced
Global Balanced with
10% Insurance Package
2
3
4
5
6
7
8
2 4 6 8 10 12 14 16 18 20
Re
turn
(A
nn
ualize
d %
)
Risk (Standard Deviation)
Risk/Return
Data from January 2006 to December 2015. Weights: Global Balanced: 17.50% Russell 3000, 18.00% MSCI EAFE, 5.50% MSCI Emerging Markets, 9.00% Barclays U.S. Aggregate Bond, 12.00% Barclays Global Treasury ex-U.S., 5.00% Barclays Intermediate U.S. HY, 10.00% MSCI ACWI REIT, 8.00% S&P GSCI, 3% BofA Merrill Lynch Global Emerging Markets Sovereign & Credit Bond, 3% London Fix Gold PM, and 9.00% Barclays 1-3 month T-Bill; "Volatility Insurance Package”: Equally weighted portfolio comprised of VIX, Oil VIX, Gold VIX and Euro VIX . Global Balanced and Global Balanced with 10% MidTerm VIX Futures are not actual portfolios available for investment. Source: Zephyr StyleAdvisor, BloombergPerformance results provided are hypothetical. Hypothetical performance results have many inherent limitations. Hypothetical trading does not involve financial risk, and no hypothetical trading record can
completely account for the impact of financial risk in actual trading. In addition, the hypothetical performance results do not represent actual recommendations or trading decisions, and they may not reflect the impact that economic and market factors might have had on the investment decision-making. For example, the ability to withstand losses, or to adhere to a particular trading program in spite of losses, can adversely affect actual results. There are numerous other factors related to the markets in general or to the implementation of any specific trading program that cannot be fully accounted for in the preparation of hypothetical performance results, but which can adversely affect actual results.

Technical Filtering
State-of-the-Art Tactical Volatility Hedging
40
Forecasting Model
Developed multivariate
linear regression forecast:
–Consider historical
performance and current
market environment
–Evaluate mean-reverting
tendencies and other
characteristics of VIX to
predict future level of VIX
futures
VIX futures ETFs
selected for
implementation
(VIXM, VIXY)
Invest up to 5.0% of
portfolio in VIX
futures, depending
on forecast strength
Implementation
Designed timing
factor to identify
possible inflection
points in VIX’s
direction
FOR INSTITUTIONAL USE ONLY/NOT FOR PUBLIC USE

A Leading-Edge Approach to Global Asset Allocation
41 FOR INSTITUTIONAL USE ONLY/NOT FOR PUBLIC USE

Alternatives
Alpha Strategies/
Cash
Fixed Income
Equity
Commodities
Global Real Estate
Mkt Neutral
Currencies Sector ETFs
Volatility
Instruments
EM Debt
High Yield Bonds
Non-U.S. BondsU.S. Bonds
Non-U.S. Equity
U.S. Equity
The New Recipe
42
Equity
Fixed Income
Source: American Century Investment Management
Alpha Strategies includes investments in non-U.S. currencies, bonds, exchange traded funds (ETFs) and futures that are designed to improve the fund's risk-adjusted
performance. Alpha is the excess return of a portfolio over its benchmark. An ETF is a security that tracks an index, commodity or basket of assets. Futures are agreements
to buy or sell a specific amount of a commodity or financial instrument at a particular price on a stipulated future date.
FOR INSTITUTIONAL USE ONLY/NOT FOR PUBLIC USE

Tactical Allocation Overlay: Alpha With Intelligent Risk Control
43 FOR INSTITUTIONAL USE ONLY/NOT FOR PUBLIC USE
41%
29%
23%
7%
0%
10%
20%
30%
40%
50%
60%
Equity Fixed Income Alternatives Alpha Strategies/Cash
Asset Class Strategic Weights and Tactical RangesAmerican Century Global AllocationMarch 2015

New Pages for Your Playbook
Sector diversification perspective required in today’s integrated global markets.
Alternative investments may not only boost return potential, but also help improve portfolio
efficiency.
Volatility investments may help reduce downside risk.
Summary
44 FOR INSTITUTIONAL USE ONLY/NOT FOR PUBLIC USE
Pop Quiz
Volatility can be thought of as "The Godfather" asset class because:
a. "You want to keep your friends close, but your enemies closer"
b. “Fuggedaboudit”
c. (The unwritten law of 'Omerta' prevents me from telling you the answer)
d. Volatility One and Volatility Two were great, but Volatility Three sucked
45 FOR INSTITUTIONAL USE ONLY/NOT FOR PUBLIC USE

A picture of a classic business cycle looks like this:
a. b.
c. d.
VISUAL DAILY
DOUBLE
46 FOR INSTITUTIONAL USE ONLY/NOT FOR PUBLIC USE
Pop Quiz
Consumer
Goods
Services
Resources
Industrials
Financials
Utilities

Pop Quiz
In light of increasing global economic and capital market integration, sector allocation
strategies represent a promising approach for performing global asset allocation going
forward.
a. True
b. False
c. Don’t know
d. Don’t care
e. All of the above
f. When is this over?
47 FOR INSTITUTIONAL USE ONLY/NOT FOR PUBLIC USE

Thank You
48 FOR INSTITUTIONAL USE ONLY/NOT FOR PUBLIC USE

Performance focus for 50+ years
Pure play business model
Privately controlled and independent
Profits with a purpose
American Century Investments
49
American Century Investment Services, Inc., Distributor
©2016 American Century Proprietary Holdings, Inc. All rights reserved.
The contents of this American Century Investments presentation are protected by applicable copyright and trademark laws. No permission is granted to copy,
redistribute, modify, post or frame any text, graphics, images, trademarks, designs or logos.
FOR INSTITUTIONAL USE ONLY/NOT FOR PUBLIC USE