Embed Size (px)
Citation preview

www.fitchratings.com
1 © Copyright Fitch Ratings Ltd 2016
sf
Portfolio Credit Model Version 2.6.1

Page 2 of 61 Fitch Ratings Portfolio Credit Model Users Manual © Copyright Fitch Ratings Ltd 2016
TABLE OF CONTENTS Starting the Model .................................................................................................... 3
The Tool Bar ............................................................................................................. 5
A. Utilities .............................................................................................................. 5
B. Paste Values .................................................................................................... 5
C. Validate Data .................................................................................................... 6
D. View.................................................................................................................. 7
E. Calculate Portfolio Properties ........................................................................... 8
F. Run Simulation ................................................................................................. 8
G. SA Tools ........................................................................................................... 8
H. CFM Tools ........................................................................................................ 9
I. Generate Report ............................................................................................... 9
J. Help Function ................................................................................................... 9
Input: Simulation Parameters ............................................................................... 10
Input: Portfolio ....................................................................................................... 12
A. Generic Portfolio Inputs .................................................................................. 12
B. Corporate Portfolio Inputs ............................................................................... 16
C. Corporate SME Portfolio Inputs ...................................................................... 18
D. Corporate SME Portfolio Data Mapping ......................................................... 23
E. Structured Finance Portfolio Inputs ................................................................ 24
F. REITS & CREL Asset Inputs Inputs ............................................................... 25
G. Public Finance Portfolio Inputs ....................................................................... 25
Input: Asset Class Parameters ............................................................................. 28
A. Obligor Concentration Stress Inputs ............................................................... 28
B. Corporate Parameters Inputs ......................................................................... 30
C. ABS Parameters Inputs .................................................................................. 32
D. PF Parameters Inputs..................................................................................... 33
Outputs ................................................................................................................... 34
A. Asset Properties Outputs ................................................................................ 34
B. Portfolio Properties and Stratification Outputs ................................................ 36
C. Analytic Output ............................................................................................... 42
D. Cashflow Model Assumptions – Corporate and SME CLOs only ................... 44
E. Distribution Output .......................................................................................... 49
Assumptions – Criteria PD, Criteria RR, Criteria SME ........................................ 50
Tools & Functionality: CDO^2 ............................................................................... 52
Tools & Functionality: Structural Analysis .......................................................... 54
A. Inputs .............................................................................................................. 54
B. Outputs ........................................................................................................... 56
Installation .............................................................................................................. 59
A. System Requirements .................................................................................... 59
B. Installation Checklist ....................................................................................... 59
C. Downloading the Fitch Ratings Portfolio Credit Model ................................... 59
D. Installing the Fitch Ratings Portfolio Credit Model .......................................... 60
E. Reinstalling the Fitch Ratings Portfolio Credit Model ...................................... 60
F. Downloading and Installing the Fitch Ratings ResiEMEA Model .................... 60

Page 3 of 61 Fitch Ratings Portfolio Credit Model Users Manual © Copyright Fitch Ratings Ltd 2016
Starting the Model
Step One: After a standard installation (See Appendix II) - From the start menu select Programs, Fitch PCM, or use the desktop short cut to launch from the desk top. The following window will be displayed. Select Standard PCM and click the Go button.
Step Two: The next screen allows the user to select the asset types. For example the collateral for securitizations of small and medium size corporates (SMEs) does not usually include larger corporates or asset back securities. In this case the user can tick off asset backed securities and larger corporates. This will cause PCM to only display the relevant inputs for SME assets. The user can select any combination of the four main asset types in PCM.
Step Three: This will launch excel and open the excel template of the Model.

Page 4 of 61 Fitch Ratings Portfolio Credit Model Users Manual © Copyright Fitch Ratings Ltd 2016

Page 5 of 61 Fitch Ratings Portfolio Credit Model Users Manual © Copyright Fitch Ratings Ltd 2016
The Tool Bar
A. Utilities
Load – Loads the portfolio data from a saved XML file. BatchRun The PCM also provides the option to run a batch of portfolios. To do so the user should select all saved portfolio files and the model will sequentially load each selected portfolio and run the Monte Carlo Simulation. Once the simulation has run the model will save the data as XML file in the same folder. SaveXML – Saves a copy of the current portfolio data as XML file. SavePCMFile – Validates the data and saves a copy of the current portfolio data as XML file only if the data passes the validation. The saved file has the extension .pcm. Clear Portfolios – Clears all the current portfolio data. Clear All – Clears all the current portfolio data, the correlation values and all the results. Clear This – Clears the worksheet that is currently displayed Reset All – Resets all parameters and correlation assumptions to the Fitch Ratings default correlation assumptions. Reset This – Resets the default values for the currently displayed worksheet, Example Portfolios – Loads example portfolios for all asset classes ( corporate, corporate SME and Structured Finance),
B. Paste Values
The only way in PCM to import data is by using the Past Values button on the toolbar which executes a paste special for values only. The same function can be used to

Page 6 of 61 Fitch Ratings Portfolio Credit Model Users Manual © Copyright Fitch Ratings Ltd 2016
import data from another excel application which executes a copy text command. Both preserve the original formatting of the PCM input sheet. Note: When copying numerical values from another excel application that are using the scientific format the paste command will copy the value into a string text value as shown in scientific format in the source file. For example a number of 1.00E+09 when copied from a different excel application would become a string value of 1.00E+09 when copied to a text field in PCM. To avoid accidental changes of the input cell formatting by coping formats PCM is locked for the standard paste functionality (Ctral+^Insert and Ctrl + V). The formatting is particularly important for text string Ids or nace codes that may start with a 0 which under the number format would vanish and change the IDs.
C. Validate Data
This checks the portfolio data for errors (the validation is carried out automatically as part of the ‘Calculate Portfolio Properties’ or ‘Run simulation’ functions). All invalid data will be highlighted and a drop down menu showing the allowed values is provided for all required alphanumeric fields. The arrows to the right can be used to locate to the next invalid input and navigate back and forward between fields. e.g.

Page 7 of 61 Fitch Ratings Portfolio Credit Model Users Manual © Copyright Fitch Ratings Ltd 2016
D. View
This allows navigation to certain worksheets and the display or hiding of certain attributes on the ‘Corporate Portfolio’ and ‘ABS portfolio’ worksheets as follows: Simulation Parameters – go to Simulation Parameters worksheet Corporate Portfolio – go to Corporate Portfolio worksheet ABS Portfolio – goto ABS Portfolio worksheet Corporate SME Portfolio – goto Corporate SME Portfolio worksheet Simulation Summary – go to Simulation Summary worksheet [+/-] Recovery Rates – Show or hide asset specific recovery rate input fields on
the portfolio worksheets [+/-] Amortisation – Show or hide the amortisation schedule input fields on
portfolio worksheets [+/-] CDO Squared – Show or hide CDO^2 input fields on Corporate Portfolio
worksheet

Page 8 of 61 Fitch Ratings Portfolio Credit Model Users Manual © Copyright Fitch Ratings Ltd 2016
E. Calculate Portfolio Properties
Calculate all portfolio characteristics such as portfolio weighted average life or weighted average rating as well as asset specific properties such as the Fitch Derived Rating or the asset weighed average life. For more details see outputs section below. This function will not run the monte carlo simulation.
F. Run Simulation
This will run the simulation and produce the portfolio and asset specific properties as well as the analytical outputs (see outputs below). The time to complete the simulation will depend on, among others, the number of simulation runs, the simulation horizon, and the number of assets in the portfolio and computer hardware. As a guide, for a portfolio of 100 assets, a 10-year simulation horizon and 1,000,000 simulation runs, the simulation takes between one and two minutes. Simulation speed can be improved by:
a. shutting down all other applications; b. running the model on a standalone work station; and c. using a computer with a 2GHz processor or higher.
The simulation progress is shown in the start up window. While the simulation is running the excel application is locked and hidden.
G. SA Tools
Load Standard Assumptions For SA Tool – Enters the standard assumptions for Interest Rates and Cure Rate Tiering into the Structural Analysis tool. Run SME Structural Analysis – runs the tool.

Page 9 of 61 Fitch Ratings Portfolio Credit Model Users Manual © Copyright Fitch Ratings Ltd 2016
H. CFM Tools
Generate CLO Cashflow Model Inputs EMEA – Generates the cashflow model inputs for CLOs using EMEA assumptions. The inputs appear on the simulation summary sheet. Generate CLO Cashflow Model Inputs US – Generates the cashflow model inputs for CLOs using US assumptions. The inputs appear on the simulation summary sheet. Load Standard Assumptions for SMEs – Loads the standard assumptions as per SME criteria into the cashflow model inputs on the Simulation Summary sheet. Generate SME Cashflow Model Inputs – Generates the cashflow model inputs for SMEs, requires either the standard assumptions to have been loaded and user input.
I. Generate Report
The function generates a Microsoft word report and copies all output tables to the word document.
J. Help Function
The PCM help function provides a drop down menu with links to several pdf documents, which include the model handbook and all major criteria reports related to the model.
Page 10 of 61 Fitch Ratings Portfolio Credit Model Users Manual © Copyright Fitch Ratings Ltd 2016
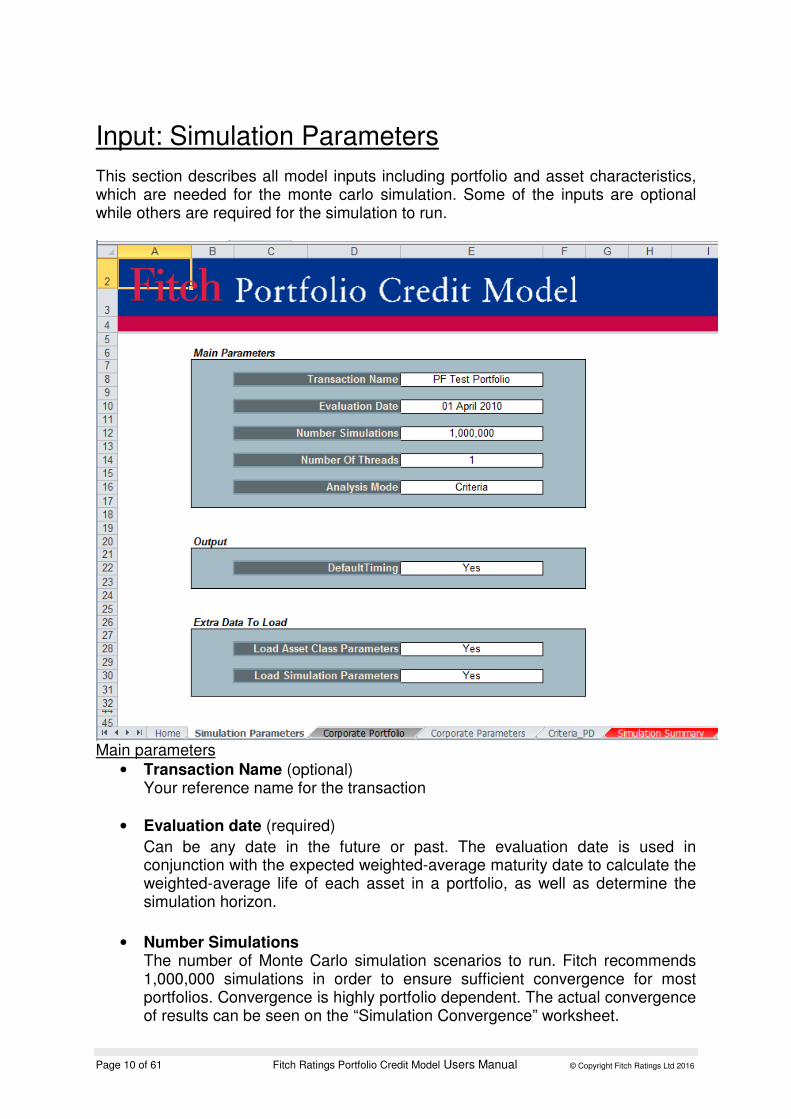
Input: Simulation Parameters
This section describes all model inputs including portfolio and asset characteristics, which are needed for the monte carlo simulation. Some of the inputs are optional while others are required for the simulation to run.
Main parameters
• Transaction Name (optional) Your reference name for the transaction
• Evaluation date (required)
Can be any date in the future or past. The evaluation date is used in conjunction with the expected weighted-average maturity date to calculate the weighted-average life of each asset in a portfolio, as well as determine the simulation horizon.
• Number Simulations The number of Monte Carlo simulation scenarios to run. Fitch recommends 1,000,000 simulations in order to ensure sufficient convergence for most portfolios. Convergence is highly portfolio dependent. The actual convergence of results can be seen on the “Simulation Convergence” worksheet.

Page 11 of 61 Fitch Ratings Portfolio Credit Model Users Manual © Copyright Fitch Ratings Ltd 2016
• Number Of Threads PCM is designed to run the simulation on multiple process cores in parallel. For example with a dual core a monte carlo simulation of one million simulation trials, would be run in two threads of 500 thousand simulation trials per processor core. This should approximately reduce the simulation run time by 50%.
• Analysis Mode The analysis mode is set to ‘Criteria’. Starting with version 2.4.4 the model only allows the user to select the ‘Criteria’ from the drop down menu. This is equivalent to running ‘NewDeal’ in previous versions and applies the OCU.
Extra Data To Load
• Load Asset Class Parameters Load the correlation numbers from the saved XML file.
• Load Simulation Parameters Load the simulation parameters from the saved XML portfolio.
Output
• Default Timing Provides the average default timing for the portfolio. For portfolios without asset amortisation or CDO squared features the simulation runtime can be significantly reduced by setting the flag to no.

Page 12 of 61 Fitch Ratings Portfolio Credit Model Users Manual © Copyright Fitch Ratings Ltd 2016
Input: Portfolio
The first section describes the generic asset inputs that are common to most of the four asset type (Large Corporate, SME Corporate, Public Finance and SF) in PCM. The following sections describe the specific attributes for each asset type.
A. Generic Portfolio Inputs
Asset Name (optional) – This is a text field that describes the asset. This field is not used by the model but allows the user to enter asset specific information.
Asset ID (required) –a unique case sensitive string value.
Issuer Name (optional) – This is a text field that describes the issuer. This field is not used by the model but allows the user to enter issuer specific information.
Issuer ID (required) – a unique case sensitive string value that identifies each individual issuer. All assets from the same issuer should have the same issuer ID. During the simulation the same random variable will be applied to all assets with the same Issuer ID, which will effectively impose a correlation of 100% between all assets from the same issuer. As the

Page 13 of 61 Fitch Ratings Portfolio Credit Model Users Manual © Copyright Fitch Ratings Ltd 2016
correlation is derived from country and industry all assets from the same issuer should also have the same country and industry. Ratings and seniority are asset specific information and may vary between assets from the issuer.
OCU Selection (optional) – Allows the user to overwrite the model selection of the largest risk contributors by selecting specific Obligors for the Obligor concentration stress. Note that any selections in this field are NOT in addition to the model selection but instead of. Therefore selecting even a
single asset in this field will turn off the model selection.
Current Par Value (required) – Represents the current notional or par value of each asset. For synthetic CDOs the asset par value represents the reference notional of each of the underlying obligors.
Current Balance Date (optional) – is the cut off date for the current balance. This field in conjunction with the evaluation date is used to determine the amortisation schedule and the weighted average life of each asset. If this field is left blank the current balance date is set to the evaluation date. By setting this date the user can move the valuation date
foreward and the model will recomputed the amortisation schedule and the weighted average life automatically.
Expected Maturity Date (required) – for bullet assets this is the maturity date of the asset.
Fitch Rating (required if available) – This is the Fitch rating of the asset as of the valuation date. For corporate entities, the rating should be the Issuer Default Rating (IDR) of the company. For securities rated ‘D’, Fitch Ratings Portfolio Credit Model will assume a 100% default probability and that asset
will default in the first period each simulation trial.
Status Fitch (required if available) – represents the outlook and rating watch information for the explicit Fitch rating. The Rating Watch settings should take precedence over the Outlook. The Rating Watch and Outlook information will be used in determining the Fitch Derived Rating (FDR) (see “Global Rating Criteria for Corporate CDO’s”, for further information and
“Global Rating Criteria for Structured Finance CDO’s”).
Alternate Ratings and Status 1 & 2:
These are ratings from other nationally recognised statistical rating organisations (NRSROs), which will be required for the FDR only if there is no explicit Fitch
rating available.

Page 14 of 61 Fitch Ratings Portfolio Credit Model Users Manual © Copyright Fitch Ratings Ltd 2016
NOTE: If ALL ratings are left blank then a rating of CCC will be assumed for that asset
Default Probability Multiplier (optional) – allows the user to adjust the default probability assumption. For example, to increase the default probability for a specific asset by a net 10%, the user should input 110%. If this field is left blank the default value will be 100% (i.e. no adjustment).
Note that any adjustment will alter the default term structure of this asset.
Country (required) – The country represents the geographical location of the individual company; for multinationals this can be the country where the majority of assets are held. The Country is used in the correlation framework and affects the pairwise correlation
between assets. The country is also used to determine the recovery rate for some asset types.
Recovery Rates
By default the model will use Fitch’s standard tiered recovery rates found on the Recovery Rates worksheet. However this may be overridden or altered by the following methods:
Recovery Rate Multiplier (optional) – May be used to adjust base recovery rates. For example, to reduce the base recovery rate for a specific asset by 20% the user should input 80%. If this field is left blank, the default value will be 100% (i.e. no adjustment).

Page 15 of 61 Fitch Ratings Portfolio Credit Model Users Manual © Copyright Fitch Ratings Ltd 2016
Asset Specific Recovery rates (optional)
To make this section of the portfolio input sheets visible select the toolbar option Show, [+] Recovery Rates.
Allows the user to specify recovery rates to be used in each liability rating stress scenario for each asset. When using the asset specific recovery rates all of the fields need to be populated. Asset Amortisation Schedule (optional)
To make this section of the portfolio input sheets visible select toolbar option Show, [+] Amortisation
Amortisation Schedule (optional) – The user can select to model individual assets as amortising assets (as opposed to bullet maturities) using the amortisation schedule. The amortisation schedule is specified in terms of the outstanding notional as a percentage which will be applied to the par value of each asset. The schedule shows the month from the current balance date when the payment is received and the balance is adjusted. In the example above the balance is adjusted to 90% at the end of month 3 (effective in month 4). The balance is further adjusted in month 6 to 80%. The values have to be equal to or greater than 0 less than or equal to 1. Furthermore any future value has to be equal to or less than the previous value. By selecting a value less than one for any period the asset will be registered as amortising and the model will overwrite the expected maturity date. In each simulation trial the model will determine the month of default for each issuer. If the amortisation schedule was entered the model will register a loss based on the outstanding notional as at the time of default. NOTE: The Expected Maturity Date field is ignored when an asset has an amortization schedule.

Page 16 of 61 Fitch Ratings Portfolio Credit Model Users Manual © Copyright Fitch Ratings Ltd 2016
B. Corporate Portfolio Inputs
Portfolio Inputs – Generic (described in section A above) Asset Name; Asset ID; Issuer Name; Current Par Value; Current Balance Date; Expected Maturity Date; Fitch Rating; Status Fitch; Alternate Ratings and Status 1&2; Default Probability Multiplier; Country; Recovery Rate Multiplier; Asset Specific Recovery Rates; Amortisation Schedule
Portfolio Inputs – Corporate Specific
CDS Implied Rating (CDS-IR) – (required for the initial analysis, see “Global Rating Criteria for Corporate CDO’s”, for further information on the use of CDS-IR). The CDS implied rating is only used if the FDR process on the simulation parameter page is set to ‘New Deal’.
Soft CE1 Restruct. / Soft CE2 Oblg. Acc. (optional) – These
fields apply to synthetic transactions only, for which restructuring and obligation acceleration can be selected as credit events under the
International Swaps and Derivatives Association (ISDA) definitions. Neither event is captured in Fitch’s study of historical default rates, which was used to derive the CDO Default Matrix. Therefore, Fitch adjusts the Default Rates for those assets for which either one or both of these events are applicable.
Fitch Industry (required) – For corporate entities, this represents the business sector of an underlying obligor. For diversified companies the applicable industry class should be derived from the Industry accounting for the majority of the company’s revenues. All
assets from the same issuer should have the same industry. The industry, together with the Country classification, determines the correlation of an asset with all other assets in a portfolio applied by the model.
Recovery Classification (required) – Describes recovery expectation for the particular asset. The standard classifications are strong, moderate and weak. The user can also enter the specific recovery rating (if available) between RR1 and RR6. The Recovery Classification in conjunction with the Country, determines the recovery rate for a specific asset. (For US second lien loans select
junior secured).
Recovery Estimate (optional) – The user may enter a recovery estimate, which will override the model recovery rate assumptions. The recovery estimate will be used to interpolate recovery assumptions for each rating level on the basis of the BB column for the recovery ratings criteria table.

Page 17 of 61 Fitch Ratings Portfolio Credit Model Users Manual © Copyright Fitch Ratings Ltd 2016
Time To Recovery (optional) – The user may enter the recovery lag in months. If no number is entered PCM uses the recovery lag from the corporate criteria.
Fixed/Floating (required) – Describes whether the asset pays a fixed or floating interest rate. This is used when calculating the fixed floating interest rate buckets.
Loan Interest Rate/Margin (required) – This field relates to the interest rate paid by a specific loan or bond. It is used when calculating the fixed floating interest rate buckets.

Page 18 of 61 Fitch Ratings Portfolio Credit Model Users Manual © Copyright Fitch Ratings Ltd 2016
C. Corporate SME Portfolio Inputs
The SME Portfolio input worksheets contains separate input tables for issuers, collateral and assets. This allows to enter several collateral items per asset and multiple assets per issuer without replication of data. Therefore all the issuer related inputs are grouped together in the issuer table. Note: The naming convention for SME loan portfolios is different to other asset types in PCM. For SME loans issuers are referred to as borrowers and assets are referred to as loans. Despite the different convention the description of generic inputs given above remains the same for SMEs. So for example the issuer Id for SMEs would be the borrower Id but remains a unique alphanumeric field. Borrower Inputs – Generic (described in section A above) Borrower Name; Borrower ID; OCU Selection Borrower Inputs – SME Specific
Borrower Industry (required; string) – this represents the business sector of the borrower. For diversified companies the applicable industry class should be derived from the Industry accounting for the majority of the company’s revenues. Input Values that are not recognised as Fitch industries or NACE codes will have to be mapped on the SME Ptfl mapping page to
a Fitch industry class. PCM uses the four digit Nace code with an n as a prefix.
Borrower Location (required, string) – this represents the country of the borrower. For multi national companies the applicable country class should be derived from the country accounting for the majority of the company’s revenues. Inputs that are not on the allowed PCM country list will have to be
mapped on the SME Ptfl mapping page to an allowed PCM country.
Borrower Size Group (required, string) – allows the user to differentiate between micro, small, medium and large companies. Most banks use an internal classification that is derived from the EU turnover based definition. This field needs to be populated but is only used for portfolio statistics.
Loan Inputs – Generic (described in section A above) Loan Name, Loan ID, Borrower ID, Current Balance Date, Expected Maturity Date; Asset Specific Recovery Rates; Amortisation Schedule Loan Inputs - SME Specific
Bank Internal Rating (optional; string) – The user can enter an internal rating. The input has to be mapped to a corresponding one year PD value using the mapping table on the worksheet SME Ptfl Mapping.

Page 19 of 61 Fitch Ratings Portfolio Credit Model Users Manual © Copyright Fitch Ratings Ltd 2016
One year PD (required if no rating; double) – The user can enter a one year pd assumption. This is optional together with a bank internal rating rating. In the absence of a rating this is a required field. The one year PD assumption is used to determine an average pd term structure based on
the nearest rating based term structures. If both the one year PD and a rating are specified the user input for the one year Pd will overwrite the rating based PD.
Delinquent (required) – shows the delinquency status for each asset. This has to be a positive integer number of 0 or higher. Delinquent assets are assigned a higher PD assumption. The model will select the higher of (i) user defined one year pd (if specified, otherwise the rating implied one year PD), and (iii) the one year pd derived from the delinquency status.
Unsecured Recovery Rate Multiplier (optional) – May be used to adjust unsecured recovery rates. For example, to reduce the unsecured recovery rate for a specific asset by 20% the user should input 80%. If this field is left blank, the default value will be 100% (i.e. no adjustment). Adjustments are typically done on a case-by-case basis and should only be made in
consultation with a Fitch analyst to ensure the model accurately reflects agency assumptions.
Flag Asset Specific Recovery Rating Cap (optional) – Determines whether the asset specific recovery rates are used as either recovery rates (blank) or recovery rate caps (cap). If the user selects Cap the Asset specific recovery rates will be applied in conjunction with the criteria recovery rates calculated by PCM. For example if the cap
for AAA is specified to be 5% and the criteria recovery rates based on MVDs and collateral values is 10%, the model will apply the lower of the two. In this case 5%.
Loan Interest Basis, Loan Interest Rate and Loan Interest Rate/Margin Margin (required) – These fields relate
to the interest rate paid by the specific loan. The loan interest basis can be
fixed or floating and for floating rate loans should identify the specific index. The Loan Interest Rate is the current interest rate paid by the loan, and should be entered the same as the Loan Interest Rate/Margin for fixed rate loans. For floating rate loans the loan interest rate shows the current interest rate including margin and index, while the loan interest margin only show the margin charged over the index. The Loan Interest Basis and Loan interest margin are used for portfolio statistics and report and do not affect the PCM analytic output. Standard Amortisation Profile (required) – For SME assets PCM allows to model
standard amortisation profiles including linear and annuity profiles. The user can specify the applicable profile under amortisation method. Note this will be overridden by the user

Page 20 of 61 Fitch Ratings Portfolio Credit Model Users Manual © Copyright Fitch Ratings Ltd 2016
defined amortisation profile (if any) as explain in the generic inputs. The user needs to provide the payment frequency as well as the loan interest rate. For amortisation method and payment frequency the user can enter any string or select a value from the allowed list in the drop down menu. If the input is not recognised by PCM as an allowed value the user has to assign a corresponding allowed value on the SME Ptfl Mapping worksheet.

Page 21 of 61 Fitch Ratings Portfolio Credit Model Users Manual © Copyright Fitch Ratings Ltd 2016
Collateral Input (optional)
The recovery analysis for SME assets is based on the level of collateral provided. Assets without assigned collateral will be considered unsecured and the unsecured recovery assumptions will apply. It is possible to enter multiple collateral items for each asset. All collateral related inputs are group in the collateral table. Collateral items are optional, but most of the inputs are required if a collateral ID is entered.
Collateral ID (optional, string) - a unique case sensitive string value. Like asset IDs and Issuer IDs the collateral id is used in pcm to determine the number of collateral items. The model will consider all entries up to the first blank cell.
Loan ID (required if Clt Id, string) – a string id from the loan table that is used as key to assign collateral items to the specific assets. It is possible to use the same loan Id multiple times which indicates multiple collateral items for a specific loan.
Collateral Type (required if Clt Id, string) – This indicates the type of collateral which determines the collateral analysis. The user can enter a value from the allowed list as show in the drop down menu. If the input is not recognised by PCM the user will be asked to assign a
corresponding mapped value from the list of allowed values on the SME Ptfl mapping worksheet. For residential collateral the Fitch Residential Default Model is used and has to be installed along side PCM (see Installation Section). For cash like asset no market value decline will be applied.
Collateral Value Multiplier (optional) – a positive floating number that allows the user to apply an adjustment to the collateral proceeds. For example a Collateral Value Multiplier of 90% means the collateral value is reduced by 10%.
Collateral Value (required if Clt Id, double) – a positive floating point number. For residential properties this should be the value of the property at the time of the valuation date. For commercial or other collateral this should be the current market value.
Valuation Date (required if Clt Id, date) – The date of valuation that corresponds to the collateral value. This field has to be populated but is only used for residential property collateral.
Location (Property) (required if Clt Id, string) – defines the location of the collateral
item. This is only used for residential property to determine the applicable market value decline. For other asset types the field has to be populated but is not used by the model. The user can enter a recognised string from a list of valid postcodes or European Data Warehouse Regions as shown

Page 22 of 61 Fitch Ratings Portfolio Credit Model Users Manual © Copyright Fitch Ratings Ltd 2016
on the Criteria SME worksheet. When entering a postcode for regions other than the UK only the first two digits are validated it is therefore important that leading zeros are included. Note: PCM requires that the location be from the same country as that of the borrower.
Prior Charge (required if Clt Id, double) – positive floating point number that shows the amount of any prior charge secured by the same collateral item. The prior charge amount will be deducted first from the collateral proceeds and any remaining proceeds will be allocated to the recovery rate
of the securitised asset.

Page 23 of 61 Fitch Ratings Portfolio Credit Model Users Manual © Copyright Fitch Ratings Ltd 2016
D. Corporate SME Portfolio Data Mapping
This worksheet shows seven mapping tables which are used in conjunction with the corporate SME specific asset inputs as described in the previous section. PCM will check the mapping table for the specific borrower, loan or collateral input. If the input is one of the key value in the mapping table the model will use the corresponding mapped value in the analysis. The validation routine in PCM will check the user inputs on the corporate SME portfolio worksheet and list any unrecognised inputs in the respective mapping tables. Multiple entries of unrecognised values will only be shown once in the mapping table. So the user only needs to map each value once to a corresponding value that is recognised by PCM. Note: The mapping is case sensitivity meaning that values that contain characters in a different case and are otherwise identical are show multiple times in the mapping table.

Page 24 of 61 Fitch Ratings Portfolio Credit Model Users Manual © Copyright Fitch Ratings Ltd 2016
E. Structured Finance Portfolio Inputs
Portfolio Inputs – Generic (described in section A above) Asset Name; Asset ID; Issuer Name; Current Par Value; Current Balance Date; Expected Maturity Date; Fitch Rating; Status Fitch; Alternate Ratings and Status 1&2; Default Probability Multiplier; Country; Recovery Rate Multiplier; Asset Specific Recovery Rates; Amortisation Schedule
Portfolio Inputs – Structured Finance Specific
ABS Sub-Sector (required) – Different sectors are applicable to structured finance assets,
Static Portfolio (required) – Is the portfolio static or revolving? If the portfolio is revolving then for correlation purposes the latest year will be used as the Origination year regardless of the setting of the next column.
Origination Year (required) – For structured finance assets it is necessary to input the year of origination. Note that for a revolving asset (see above) the most recent vintage will be assumed regardless of the year of origination.
Seniority (required) – determines the applicable recovery rate. Structured finance assets can be either senior or non senior in the capital structure. For an asset to be senior it has to be the last position with respect to loss allocation in the capital structure.
Tranche Size (required) – For structured finance assets the recovery rates are determined by the thickness of the tranche relative to the total size of the structure. So this is the % of the total notional of the underlying asset structure of this tranche.
Zero RR Rating (optional) – represents the rating of the next senior ranking tranche in the capital structure. If left blank the default assumption is one category above the fitch derived rating of the asset. The simulation will test whether the senior rating has defaulted in which case the applied principal
recovery rate for the asset will be set to zero. This represents a sequential waterfall structure typical for most structured finance transactions. In order to disable the zero RR approach for a specific asset the user can select ‘NONE’ from the drop down menu.

Page 25 of 61 Fitch Ratings Portfolio Credit Model Users Manual © Copyright Fitch Ratings Ltd 2016
F. REITS & CREL Asset Inputs Inputs
Real Estate Investment Trusts and Corporate Real Estate Loans can be entered on the ABS portfolio sheet but have some unique characteristics REITS are divided into either Commercial or Residential and use the Corporate asset recovery table. Therefore the seniority drop down for a REIT is different from other ABS asset types. The seniority classification for REITS is either ‘Strong Recovery’ or ‘Moderate Recovery’. In order to get the drop down selection changed to for REIT assets it is necessary to run the ‘Validate Portfolio’ function after the other parts of REITS data have been entered. Note that the following have no affect on REIT assets – Tranche Thickness and Zero Recovery rate field. These will be ignored by the model if populated. CREL is a single ABS subsector. CREL assets are treated like CMBs assets in the model. The recovery is based on Tranche thickness and seniority. For CREL tranches in excess of 50% of the respective capital structure the criteria applies recovery rates commensurate with an RR3 recovery rating.
G. Public Finance Portfolio Inputs
Issuer Inputs – Generic (described in section A above) Issuer Name; Issuer ID; OCU Selection; Issuer Inputs - Public Finance Specific
Local Region (required) – For public finance entities, this represents the local region of the underlying obligor. The local region determines the country of the obligor. The current PCM version has local regions for Germany and France only. For all other countries the input for this field is the country name.
Issuer Type (required) – this distinguishes sovereign from municipal issuers. This field is used to identify sovereign issuers included in the portfolio. A default by the sovereign will impact all municipal issuers from the same country, which are assumed to default with an exposure set by the exposure at sovereign default (see below).
Asset Inputs – Generic (described in section A above)
Asset Name; Asset ID; Issuer Name; Current Par Value; Current Balance Date; Expected Maturity Date; Fitch Rating; Status Fitch; Alternate Ratings and Status 1&2; Default Probability Multiplier; Recovery Rate Multiplier; Asset Specific Recovery Rates; Amortisation Schedule
Asset Inputs – Public Finance Specific
Seniority Classification (required) – Describes recovery expectation for the particular asset. The standard classifications

Page 26 of 61 Fitch Ratings Portfolio Credit Model Users Manual © Copyright Fitch Ratings Ltd 2016
are sovereign or municipal. Sovereign assets can be entered either under public finance or corporate asset types. The sovereign recovery rates are the same for sovereign assets regardless whether they are entered on the corporate or public finance input page.
Exposure at Sovereign Default (optional) – This sets the proportional amount of the notional exposure at the time of the sovereign default that is assumed to default for each asset. If left blank the default value is 100%. The percentage is applied to the outstanding balance of the asset at time of default of the sovereign. This takes into account the amortisation
schedule of the asset.
Sovereign Inputs (required)
For each country represented in the portfolio the user needs to supply the Fitch sovereign rating and rating status fields. For issuer characterised as sovereign on the issuer type the model will populate this table based on
the ratings of the assets assigned to the sovereign issuer. for municipal assets in jurisdictions for which the portfolio does not contain any sovereign assets the user will have to provide the rating and rating status. The model will check upon validation which jurisdictions are present and prepopulate the list of sovereigns for which the rating information is required. Fitch Rating and Status Fitch inputs are the same as described in section A – Generic Portfolio Inputs.
Methodology – Modelling Municipal Performance conditional upon sovereign default
See criteria report for analysing portfolios of public sector assets.
For sub-national obligors, the rating or credit opinion assumes that the respective sovereign has not defaulted. It is Fitch’s view that the default risk for PSEs conditional on the default of the corresponding sovereign is significantly higher compared to the default risk indicated by the rating or credit opinion. To reflect this, the sovereign risk is modelled jointly with the PSE in PCM and the PSE performance is conditional on the sovereign performance, as described above.
Implementation: PCM will map each municipal asset to a corresponding sovereign asset based on the country derived from the local region input. If no sovereign asset is included in the portfolio, PCM will create “dummy” sovereign assets with zero exposure. The default time for the “dummy” assets will be modelled in the simulation but no additional loss will be registered for these assets as they have a zero exposure or notional.
When calculating the portfolio loss for each simulation trial the model will check the default time for each issuer and the corresponding sovereign. The asset loss will be computed as the higher of

Page 27 of 61 Fitch Ratings Portfolio Credit Model Users Manual © Copyright Fitch Ratings Ltd 2016
(i) Asset loss at time of sovereign default using the sovereign recovery rate times the exposure at sovereign default (EaSD)
(ii) Asset loss at time of municipal issuer default using the municipal recovery rate.
With an EaSD equal to zero the sovereign would not affect the municipal performance.

Page 28 of 61 Fitch Ratings Portfolio Credit Model Users Manual © Copyright Fitch Ratings Ltd 2016
Input: Asset Class Parameters
A. Obligor Concentration Stress Inputs
The obligor concentration stress can be set for each of the four asset classes on the individual parameter worksheet. The methodology is the same but the parameters values vary between the four asset classes. The obligor concentration parameters represent a stress on each of the three key model parameters, which include default probability, recovery rate and correlation. The user can select the obligors to which the concentration stress should be applied. If the user has not selected any the model can automatically identify the largest risk contributors by expected loss or loss given default or notional. PCM reports the selected issuer under the asset outputs for the individual asset classes.
• PD Stress
The PD to be applied to all assets related to the largest risk contributors. The PD stress is only applied if it leads to a higher one year pd than the one derived by the model based on the pd inputs, which also takes into account the pd multiplier. Example 1 Assuming the asset rating is B minus which implies a one year pd of 8.35% the model would override the rating using the large obligor stress rating, which for SME assets is 25%, leading to a one year pd of 25.00%. Example 2 If the same asset is subject to a pd multiplier of 400% (one year pd of 8.35%*400%=33.4%) the PD stress would not be applied since the PD stress is less than the asset one year pd. Example 2 If the same asset is subject to a pd multiplier of 200% (one year pd of 8.35%*200%=16.7%) the PD stress would be applied since the pd stress of 25.0% is greater than the asset one year pd. The pd multiplier would not be applied to the stress rating and the pd used by the model would be 25.0%.
Page 29 of 61 Fitch Ratings Portfolio Credit Model Users Manual © Copyright Fitch Ratings Ltd 2016
• Correlation Uplift This is a correlation stress applied between issuers subject to the stress. Technically this is done by added an extra factor which only affects the selected issuers. This means that the pair wise correlation between any pair among the largest risk contributors is increased by correlation stress.
• Recovery Multiplier The recovery rate multiplier is a factor that is applied to Fitch’s recovery assumptions for all assets related to the selected issuers. Note this is NOT applied to any fixed recovery rate or any asset specific recovery rates assumption.
• Minimum Number of Issuers This is the minimum number of issuers to be selected by PCM if no assets have been selected by the user. PCM will select up to the minimum number of issuers that are the largest in terms of the specified selection basis. For example if the selection basis is expected loss and the minimum number is set to 5, PCM will select the five issuers with the largest expected loss in the portfolio.
• Issuer Size Threshold In addition to the minimum number of issuers the user can specify a size threshold in percent of the selection basis. PCM will select all issuers that exceed the size threshold in term of the selection basis. For example if the selection basis is notional and the size threshold is 50bps, than PCM will select all issuers that exceed 50bps of the portfolio notional.
• Selection Basis The issuer selection is done based on the selection basis, which can be either expected loss (default rate times notional times one minus recovery rate), notional or loss given default (notional times one minus recovery rate). This is used in conjunction with the minimum number and the issuer size threshold.
• Aggregate Notional Threshold Thus allows the user to set a notional threshold level. The Obligor concentration stress will only be applied to the largest obligors selected based on the minimum number of Issuers and selection basis, IF they in aggregate exceed the aggregate notional threshold. For example if the aggregate notional threshold is set to 10%, out of the selected OCU issuers the smallest set of obligors which in aggregate represents 10% or less of the selection basis will be removed again. Issuers will only be removed from the OCU selection under the aggregate notional threshold if they represent less than the Issuer Size threshold.

Page 30 of 61 Fitch Ratings Portfolio Credit Model Users Manual © Copyright Fitch Ratings Ltd 2016
B. Corporate Parameters Inputs
On this worksheet the user can specify the obligor concentration stress parameters and correlation parameters for large corporate and small and medium sized corporate (SMEs).
The correlation between issuers is calculated as the sum of the correlation uplifts for each attribute the two issuers have in common:
A Global base correlation (from previous sheet above)
Regional correlation (from previous sheet above)
Country correlation (from previous sheet above)
Global Industry Sector
Global Industry
Local (Country) industry
The Fitch standard correlations for corporate assets can be found on the corporate correlation worksheet. In the Fitch PCM the user is able to overwrite the individual correlation uplifts. Since the allowed range for correlation is between 0% and 100% the values entered and added up across the correlation dimensions should not exceed 1 minus the OCU uplift.
The model validation will verify that no combination of correlation uplifts is greater than 1 – OCU uplift. Only the largest combination causing this error will be highlighted.
The user can reset the correlation values to the Fitch default assumptions by selecting Toolbar/Portfolio/Reset All (see tool bar section).
The correlation between two corporate assets is calculated as follows:
Start with the Global Corporate Correlation percentage
• If two assets are in the same region add the regional uplift for this region
• If two assets are in the same country add the country uplift for this country

Page 31 of 61 Fitch Ratings Portfolio Credit Model Users Manual © Copyright Fitch Ratings Ltd 2016
• If two assets are in the same Global Industry Sector add the uplift for that sector
• If two assets are in the same Global Industry add the uplift for this Global Industry
• If two assets are in the same Local Industry sector add the uplift for this Local Industry sector
Finally if the two assets are deemed to be in the OCU selection (manual or automatic) add on the OCU uplift.

Page 32 of 61 Fitch Ratings Portfolio Credit Model Users Manual © Copyright Fitch Ratings Ltd 2016
C. ABS Parameters Inputs
On this worksheet the user can specify the obligor concentration stress parameters and correlation parameters for structured finance assets. The obligor concentration stress by default is disabled as per the criteria. However the user can override the default values, with the exception of the correlation stress. This is because the correlation levels for ABS are high even without a stress.
The correlation between two structured finance assets is calculated as follows:
Start with the Global ABS correlation
• If two assets are from the same country add the ABS country correlation.
• If two assets are in the same Global ABS sector add the Global ABS sector uplift for this Global ABS sector.
• If two assets are in the same Global ABS sub sector add the Global ABS sub sector uplift for that Global ABS sub sector
• If two assets are in the same Local ABS sector add the Local ABS sub sector for that local ABS sector
• If two assets are in the same Local ABS sub sector add the uplift for that Local ABS sub sector
• If two assets are in the same country, same sector and same vintage grouping add the uplift for that country, sector and vintage grouping
Finally if the two assets are deemed to be in the OCU selection (manual or automatic) add on the OCU uplift. NOTE1: ABS ASSETS ARE ADDITIONALLY CORRELATED TO ALL BANKING AND FINANCE CORPERATE ASSETS BY 15% (REGARDLESS OF COUNTRY)

Page 33 of 61 Fitch Ratings Portfolio Credit Model Users Manual © Copyright Fitch Ratings Ltd 2016
D. PF Parameters Inputs
On this worksheet the user can specify the obligor concentration stress parameters and correlation parameters for public finance assets.
The correlation between two public finance assets is calculated as follows:
Start with the Global Base correlation
• If two assets are from the same region add the region correlation.
• If two assets are in the same country add the specific country uplift.
• If two assets are in the same local region add the Local Region uplift for this Local Region.
Finally if the two assets are deemed to be in the OCU selection (manual or automatic) add on the OCU uplift.

Page 34 of 61 Fitch Ratings Portfolio Credit Model Users Manual © Copyright Fitch Ratings Ltd 2016
Outputs
A. Asset Properties Outputs
Final Rating - FDR – shows the final rating determined based on the rating information for each asset and the FDR mode selected on the parameter sheet.
One Year PD UnAdjusted – shows the one year pd applied by the model, before the obligor concentration stress is applied.
Weighted Average Life PD UnAdjusted – shows the pd corresponding to the Weighted average life of the asset.
AAA to B Recovery Rate Assumptions - Shows the scenario recovery assumption for each asset from B to AAA, taking into account the fixed or asset specific recovery assumptions (if any).

Page 35 of 61 Fitch Ratings Portfolio Credit Model Users Manual © Copyright Fitch Ratings Ltd 2016
Base Case Recovery Assumption - Shows the base recovery assumption (‘CCC’ rating level) for each asset, taking into account the fixed or asset specific recovery assumptions (if any).
Weighted Average Life - Shows the weighted average life for each asset in months, which is either calculated based on the amortisation schedule for amortising assets or from the evaluation and expected maturity date.
Default Probability Adjustment - Shows the default probability adjustment to be applied by the simulation. This takes into account the default probability multiplier specified by the user as well as the default probability multiplier as a result of soft credit events.
Expected Loss - The expected loss amount for each asset based on the ‘B’ recovery assumption. The expected loss is show in notional term and does not incorporate obligor concentration adjustment.
OCU Selection - shows the OCU issuers selected by the model based on their aggregated expected loss or those selected by the user.
For Structured Finance Assets Only
Zero RR Rating - shows the zero recovery rating applied by the model.

Page 36 of 61 Fitch Ratings Portfolio Credit Model Users Manual © Copyright Fitch Ratings Ltd 2016
B. Portfolio Properties and Stratification Outputs
PCM calculates portfolio properties and stratifications for each of the asset classes as well as for the combined portfolio including all asset classes. These are show on the following five worksheets
Worksheet – Corp Stats – for the Large Corporates portfolio
Worksheet – ABS Stats – for the structured finance portfolio
Worksheet – PF Stats – for the public finance (municipal) portfolio
Worksheet – Corp SME Stats – for the SME Corporate portfolio
Worksheet – Portfolio Stats – for the combined portfolio
Each worksheet contains a (i) portfolio summary table including average portfolio statistics (ii) portfolio stratifications and (iii) a table showing the asset inputs and asset properties (described in asset properties and portfolio inputs above) in for the largest obligors, ordered starting with the largest.
The portfolio stratification are different for different asset type depending on the relevant characteristics for each asset type, and include for example distributions by base PD, base RR, industry, country, Weighted average life and rating among others.
Note: All distributions are calculated a percentage of the portfolio notional.
Portfolio Summary Properties – Combined Portfolio
Summary Portfolio Properties ALL
Portfolio Notional Amount 417,600,000.0
Portfolio Notional Amount (ABS) 0.0
Portfolio Notional Amount (CORP) 400,000,000.0
Portfolio Notional Amount (SME) 17,600,000.0
Portfolio Notional Amount (PF) 0.0
Number of Issuers 120
Number of Assets 179
Max WA Life (month) 134.79
Ptfl WA Maturity (month from Eval. Date) 135.00
Portfolio Correlation Level 0.18
Ptfl WALife (month) 133.60
Amortising (% of Notional) 2.16%
Largest Issuer (% of Notional) 2.87%
Largest 10 Issuers (% of Notional) 25.38%
Number of OCU Issuers 39
Foreclosed 2400000
PCM Version 2.5.0

Page 37 of 61 Fitch Ratings Portfolio Credit Model Users Manual © Copyright Fitch Ratings Ltd 2016
(Note these values exclude inner CDO’s in a CDO^2 structure.) The portfolio properties calculated by the PCM include the following: 1. Portfolio Notional Amount – is the sum of the par value of all assets in the CDO
portfolio.
2. Portfolio Notional Amount (ABS) – is the sum of par value of all assets in the ABS part of the portfolio.
3. Portfolio Notional Amount (CORP) – is the sum of par value of all assets in the CORP part of the portfolio.
4. Portfolio Notional Amount (SME) – is the sum of par value of all assets in the SME part of the portfolio.
5. Portfolio Notional Amount (PF) – is the sum of par value of all assets in the PF part of the portfolio.
6. Number of Issuers – The number of individual obligors / issuers in the portfolio. 7. Number of Assets – The total number of individual asset rows in the portfolio. 8. Max WA Life (months) - is equal to weighted average life the longest-dated asset
in the portfolio. 9. Ptfl WA Maturity (months from Eval. Date) - is the number of months between the
evaluation date and the weighted average maturity date calculated as the average of the individual maturity date of each asset weighted by the asset notional.
10. Portfolio Correlation Level is the weighted average pair-wise correlation of all
assets in the portfolio. 11. Ptfl WALife (months) - is the average of the weighted-average lives of all assets
in the CDO weighted by the assets’ par value. The portfolio WALife determines the risk horizon and hence the significance level for the Rating Default Rate and Rating Loss Rate.
12. Amortising (% Notional) – is the proportion of the portfolio that is amortising either
following a standard amortisation profile or a user defined amortisation profile. 13. Largest Issuer (% Notional) – show the proportion of the notional exposure of the
largest obligor (same as issuer) of the overall portfolio notional. 14. Largest 10 Issuers (% Notional) – show the proportion of the notional exposure of
the ten largest obligors (same as issuer) of the overall portfolio notional. 15. Number of OCU Issuers – show the number of obligors selected for the obligor
concentration uplift.

Page 38 of 61 Fitch Ratings Portfolio Credit Model Users Manual © Copyright Fitch Ratings Ltd 2016
16. Foreclosed - is the sum of par value of all assets which are designated foreclosed. For SME assets these are asset greater than 365 delinquent and for the other asset classes any asset rated ‘Dsf’.
17. PCM Version – is the current PCM version number.

Page 39 of 61 Fitch Ratings Portfolio Credit Model Users Manual © Copyright Fitch Ratings Ltd 2016
Portfolio Summary Properties – Large Corporate Portfolio
Summary Portfolio Properties L Corporates
Portfolio Notional Amount 400,000,000.00
Number of Issuers 76
Number of Assets 91
Portfolio WA Rating - WARF B
Portfolio WARating (numerical) - WARF 33.02
CLO Weighted Average Recovery Rate (WARR) 70.05
Ptfl WALife (month) 135.00
Max WA Life (month) 135.00
Portfolio Correlation Level 6.799%
Ptfl WA Maturity (month from Eval. Date) 135.00
WA One Year PD 6.10%
Amortising (% of Notional) 0.00%
Largest Issuer (% of Notional) 3.00%
Largest 10 Issuers (% of Notional) 26.50%
Largest Industry (by # Issuers) business services 15
Number of OCU Issuers 5
Floating Rate (% Current Balance) 46.00%
Foreclosed 0
PCM Version 2.5.0 The ADDITIONAL portfolio properties calculated by the PCM for large corporate assets include the following: 1. Portfolio WA Rating - WARF – The alphabetic representation of the average
rating of the portfolio weighed by asset par value and the Fitch 10 year PD assumption.
2. Portfolio WA Rating (numerical) - WARF – The numeric representation of the
weighted average rating.
3. CLO Weighted Average Recovery Rate (WA RR) – the recovery rate entered in the “Recovery Estimate” column in the Corporate Portfolio sheet weighted by the asset par value.
4. WA One Year PD – the average one year PD assigned by PCM weighted by the
asset par value. The one year PD does not include the OCU PD stress. 5. Largest Industry (by # Issuers) – shows the largest industry based on Fitch
classification and number of obligors in that industry.
6. Floating Rate (% Current Balance) – the proportion of the Corporate Portfolio which pays interest at a floating rate.
Page 40 of 61 Fitch Ratings Portfolio Credit Model Users Manual © Copyright Fitch Ratings Ltd 2016
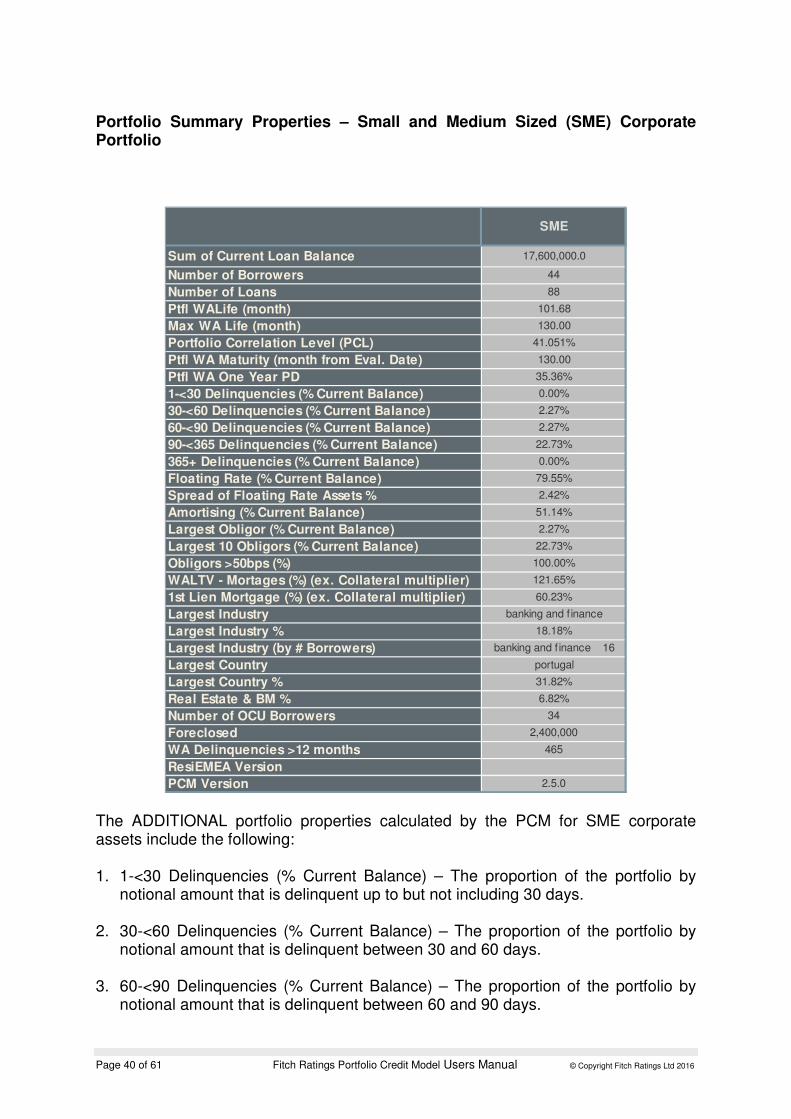
Portfolio Summary Properties – Small and Medium Sized (SME) Corporate Portfolio
SME
Sum of Current Loan Balance 17,600,000.0
Number of Borrowers 44
Number of Loans 88
Ptfl WALife (month) 101.68
Max WA Life (month) 130.00
Portfolio Correlation Level (PCL) 41.051%
Ptfl WA Maturity (month from Eval. Date) 130.00
Ptfl WA One Year PD 35.36%
1-<30 Delinquencies (% Current Balance) 0.00%
30-<60 Delinquencies (% Current Balance) 2.27%
60-<90 Delinquencies (% Current Balance) 2.27%
90-<365 Delinquencies (% Current Balance) 22.73%
365+ Delinquencies (% Current Balance) 0.00%
Floating Rate (% Current Balance) 79.55%
Spread of Floating Rate Assets % 2.42%
Amortising (% Current Balance) 51.14%
Largest Obligor (% Current Balance) 2.27%
Largest 10 Obligors (% Current Balance) 22.73%
Obligors >50bps (%) 100.00%
WALTV - Mortages (%) (ex. Collateral multiplier) 121.65%
1st Lien Mortgage (%) (ex. Collateral multiplier) 60.23%
Largest Industry banking and f inance
Largest Industry % 18.18%
Largest Industry (by # Borrowers) banking and f inance 16
Largest Country portugal
Largest Country % 31.82%
Real Estate & BM % 6.82%
Number of OCU Borrowers 34
Foreclosed 2,400,000
WA Delinquencies >12 months 465
ResiEMEA Version
PCM Version 2.5.0 The ADDITIONAL portfolio properties calculated by the PCM for SME corporate assets include the following: 1. 1-<30 Delinquencies (% Current Balance) – The proportion of the portfolio by
notional amount that is delinquent up to but not including 30 days. 2. 30-<60 Delinquencies (% Current Balance) – The proportion of the portfolio by
notional amount that is delinquent between 30 and 60 days. 3. 60-<90 Delinquencies (% Current Balance) – The proportion of the portfolio by
notional amount that is delinquent between 60 and 90 days.

Page 41 of 61 Fitch Ratings Portfolio Credit Model Users Manual © Copyright Fitch Ratings Ltd 2016
4. 90-<365 Delinquencies (% Current Balance) – The proportion of the portfolio by notional amount that is delinquent between 90 and 365 days.
5. 365+ Delinquencies (% Current Balance) - The proportion of the portfolio by
notional amount that is delinquent by 365 days or more. 6. Floating Rate (% Current Balance) – The proportion of the portfolio by notional
amount pays interest at a floating rate. 7. Spread of Floating Rate Assets % - The weighted average spread of those
assets that pay a floating rate. 8. Obligors > 50bps (%) – The proportion of the assets by notional amount that
makes up more than 50 basis points of the portfolio.
9. WALTV – Mortgages (%) (ex. Collateral multiplier) – The weighted average loan to value of assets backed by either residential or commercial collateral type.
10. 1st Lien Mortgage (%) (ex. Collateral multiplier) – The proportion of the portfolio
backed by collateral that is first lien collateral.
11. Real Estate & BM (%) – The proportion of the portfolio by notional amount that is backed by the Fitch Industry Real Estate or Building Materials.
12. WA Delinquencies >12 months – The weighted average number of days
delinquent of foreclosed assets. For SME foreclosed assets are those delinquent for more the 365 days.
13. ResiEMEAVersion – if the ResiEMEA has been used to calculate recoveries on
those loans backed by residential collateral the version number of the model appears here.

Page 42 of 61 Fitch Ratings Portfolio Credit Model Users Manual © Copyright Fitch Ratings Ltd 2016
C. Analytic Output
The Simulation Summary displays the main model outputs including the rating default rate (RDR), the rating recovery rate (RRR), the rating loss rate (RLR). The outputs will be time stamped and include the version number of the model used. There are two sets of results “Master” in which the portfolio has had foreclosed assets removed and the monte carlo simulation run with only performing assets. The second set of results includes foreclosures.

Page 43 of 61 Fitch Ratings Portfolio Credit Model Users Manual © Copyright Fitch Ratings Ltd 2016
The RDR and RLR are derived as the percentile (confidence level)of the respective distribution, corresponding to the CDO default rates and the portfolio weighted average life (risk horizon). Note that if no value in the default and loss distribution exactly matches the specific percentile, then the value with a percentile higher than but closest to the percentile of the rating level is used.
Confidence Level (CL) – Shows the percentile for each of the rating levels. This is derived as one minus from the default probability corresponding to the portfolio weighted average live.
Rating Default Rate (RDR ) – Shows the value that corresponds to the percentile of the notional default distribution, which is derived as the exposure at default. The exposure at default takes into account the initial par value as well as the amortisation schedule (if specified) but excludes recovery rates.
Rating Loss Rate (RLR) – Shows the portfolio loss for the particular credit portfolio in the respective rating scenario, taking into account Fitch’s recovery rate assumptions for each asset. The RLR is gross of any structural features such as excess spread and is derived from the portfolio loss distribution in the same way as the RDR. Rating Recovery Rate (RRR) – The RRR equals one minus the RLR divided by the RDR.
DEFAULTS: This shows the proportion of the current balance considered in default and the corresponding expected recovery rate as well as expected loss rate. These are based on the base case recovery expectations. Generally assets are considered defaulted if the one year probability of default assumption is 100%. For rated assets that would include assets rated ‘D’ or assets with default probability multipliers that result in a one year PD of 100%. For SME assets which are unrated this is based on the one year PD input (considers the mapping), the delinquency status and the default probability multiplier.
Foreclosed RRR – This is the RRR for the foreclosed portion of the portfolio. For SME CLOs the model considers all assets foreclosed, for which the Days delinquent is greater than 365. Note that the amount of assets considered foreclosed is a subset of the defaulted assets. For example for SME loans the model considers asset that are 90 days or more delinquent to be defaulted but not necessarily foreclosed. For all other sectors assets are considered foreclosed if the month one PD is 100%. This is typically the case if the rating is set ‘D’ or in case of Structured finance portfolios ‘CC’ and ‘C’ which are assumed to have defaulted. For these sectors the amount of defaults would typically be the same as the amount in foreclosure.
Page 44 of 61 Fitch Ratings Portfolio Credit Model Users Manual © Copyright Fitch Ratings Ltd 2016
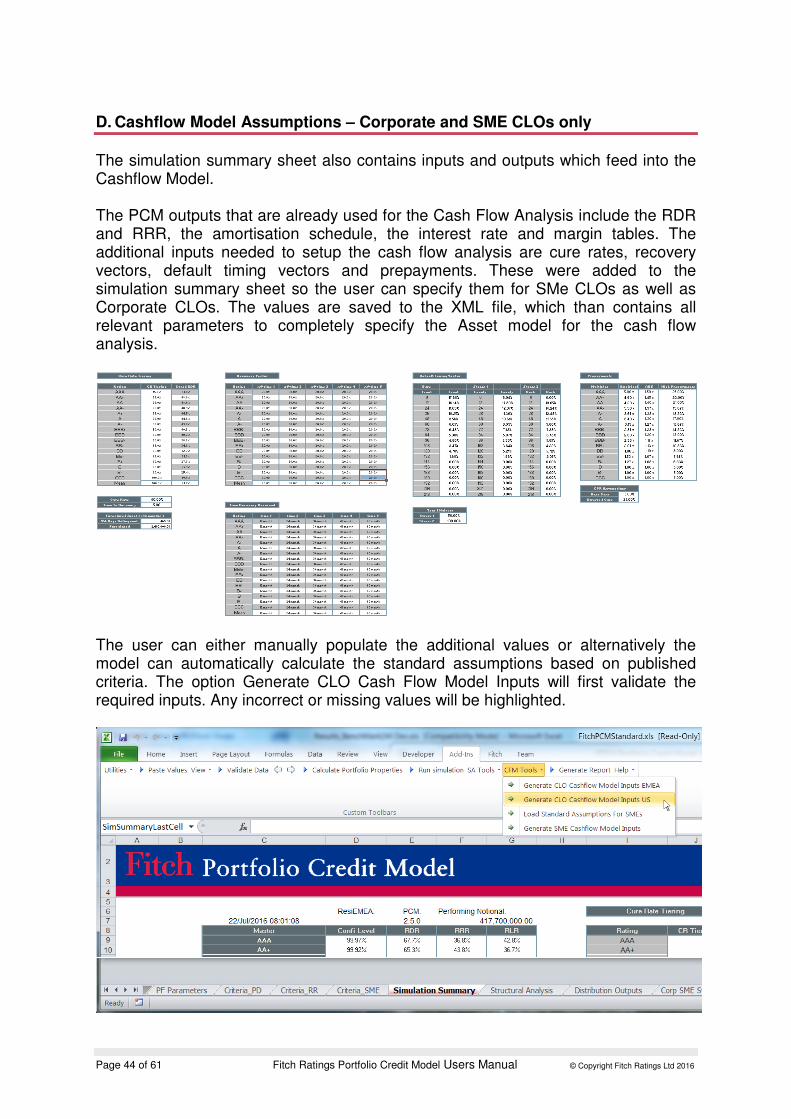
D. Cashflow Model Assumptions – Corporate and SME CLOs only
The simulation summary sheet also contains inputs and outputs which feed into the Cashflow Model. The PCM outputs that are already used for the Cash Flow Analysis include the RDR and RRR, the amortisation schedule, the interest rate and margin tables. The additional inputs needed to setup the cash flow analysis are cure rates, recovery vectors, default timing vectors and prepayments. These were added to the simulation summary sheet so the user can specify them for SMe CLOs as well as Corporate CLOs. The values are saved to the XML file, which than contains all relevant parameters to completely specify the Asset model for the cash flow analysis.
The user can either manually populate the additional values or alternatively the model can automatically calculate the standard assumptions based on published criteria. The option Generate CLO Cash Flow Model Inputs will first validate the required inputs. Any incorrect or missing values will be highlighted.

Page 45 of 61 Fitch Ratings Portfolio Credit Model Users Manual © Copyright Fitch Ratings Ltd 2016
Cured RDR (SME CLOs only)
Required Inputs for Standard Assumptions as per the SME CLO Criteria:
• Cure Rate – here the user inputs the proportion of defaulted assets they expect to be cured in the base case.
• CR Tiering – the cure rate is tiered by the percentages entered in this column. For example at the ‘AAAsf’ level only 15% of the 40% cure rate is applied. The user can either enter their own tiering or select “Load Standard SME Assumptions” from the “CFM Tools” menu which will load the tiering as specified in the SME Criteria.
Outputs:
• Cured RDR – the cured RDR is derived from the tiered cure rates and the RDR (not including foreclosures).
For CLOs the model automatically sets the cure rate to zero so the cured RDR is the same as the RDR produced by PCM. Recover Vector ( both CLOs and SME CLOs) PCM computes the standard recovery vector as specified in the SMe CLo criteria and the CLO criteria. The user can override the standard assumptions.

Page 46 of 61 Fitch Ratings Portfolio Credit Model Users Manual © Copyright Fitch Ratings Ltd 2016
Inputs:
• Time To Recovery – the assumed time to final recovery in years. For example if the number of years entered is five it is assumed that all recoveries possible for a given asset are distributed over five years as per the SME criteria.
Outputs:
• Recovery Vector – the proportion of recoveries received at that time. The tool calculates a linear recovery vector so if we assume a five year time to recovery at each of the five points in time 20% recovery will be received. The user can overwrite this table.
• Time Recovery Received – the number of months after which recovery outlines in the Recovery Vector table is received. The tool calculates a linear recovery vector so if we assume a five year time to recovery 20% of the RRR will be

Page 47 of 61 Fitch Ratings Portfolio Credit Model Users Manual © Copyright Fitch Ratings Ltd 2016
received after 12 months and another 20% after 24 months, up until five years.
Default Timing Vector –(both CLOs and SMEs CLOs) PCM computes the standard default timing assumptions as specified in the SMe CLo criteria and the Corporate CLo criteria. The user can override the standard default timing assumptions.
Inputs (SME CLOs only): The Base default timing for SME CLOs is derived by PCM based on the average timing of defaults during the simulation. The base default timing if largely a function of the default term structure. Stress one and stress two default timing assumptions are derived from the base default timing by redistriubting some of the first year defaults proprotionately to the following years as specified in the SME CLO criteira. The year 1 and year 2 Haircut inputs determine the amount of defaults to be redistributed. For example a haircut of 50% means that half the year one proportion will be redistributed to the remaining years. Note: The columns titled Months shows the starting months for the relevant default proportion. For CLOs the Stress 1 and Stress 2 inputs should be left blank. The outputs will reflect the default timing assumptions for Front, Mid and Back Loading as specified in the Corporate CLO Criteria.

Page 48 of 61 Fitch Ratings Portfolio Credit Model Users Manual © Copyright Fitch Ratings Ltd 2016
Prepayments (both SME and Corporate CLOs)
PCM computes the standard prepayment assumptions as specified in the SMe CLo criteria. The user can override the standard prepayment assumptions. Required Inputs for Standard Assumptions as per the SME CLO Criteria:
• Base Case – the base case prepayment assumption corresponding to a ‘Bsf’ scenario.
• Stressed Case – the stressed case prepayment assumption corresponding to a ‘AAAsf’ scenario.
Ouput Standard Assumptions:
• Prepayments – the prepayment assumptions at each ratings level are computed by linearly interpolating between the “Stressed Case” and “Base Case” by notches.
Note: Low prepayment assumptions are not shown as they are assumed to be zero at all rating levels as per the SMe CLO criteria. For corporate CLOs the standard assumption is zero prepayments. The model will populate the prepayment vector with Zeros if the CPR assumptions are left blank.

Page 49 of 61 Fitch Ratings Portfolio Credit Model Users Manual © Copyright Fitch Ratings Ltd 2016
E. Distribution Output
Column A/B – Distribution of the number of defaults Column D/E – Distribution of the notional amounts defaulted Column G/H – Loss distribution in AAA stress scenario due to tiered recovery rate assumptions Column J/K – Loss distribution under AA stress scenario due to tiered recovery rate assumptions Column M/N – Loss distribution under the BBB stress scenario due to tiered recovery rate assumptions

Page 50 of 61 Fitch Ratings Portfolio Credit Model Users Manual © Copyright Fitch Ratings Ltd 2016
Assumptions – Criteria PD, Criteria RR, Criteria SME
Worksheets: Criteria PD, Criteria RR, Criteria SME These three worksheets DISPLAY the key assumptions for default rates, recovery rates and mapping tables. These can not be changed by the user and are for display only. PCM does not read the data from these worksheets. Example Criteria PD: The first table shows Fitch’s default rate assumptions for corporate, structured finance and public finance assets on a yearly basis up to a maximum tenor of 30 years. The default rates are displayed on a cumulative basis. The second table shows the CDO target default rates for all asset classes, which except for AAA and AA are equal to the corporate default rate assumptions. The CDO target default rates together with the portfolio weighted average life are used to determine the RLR and RDR outputs.

Page 51 of 61 Fitch Ratings Portfolio Credit Model Users Manual © Copyright Fitch Ratings Ltd 2016

Page 52 of 61 Fitch Ratings Portfolio Credit Model Users Manual © Copyright Fitch Ratings Ltd 2016
Tools & Functionality: CDO^2
PCM supports a ‘look through’ analysis for corporate CDO squared structures. The ‘look through’ analysis requires additional inputs in respect of the ‘inner’ CDO portfolios, which can be entered on the corporate portfolio worksheet.
To make this section of the Corporate Portfolio sheet visible select toolbar option Show, [+] CDO Squared
For a CDO squared structure the same asset and issuer attributes as described for a single tier CDO structure in Corporate Inputs have to be entered for each corporate reference name, whether it is reference by the master CDO or any inner CDO. The field ‘Par Value Master’ represents the notional reference by the master CDO of the specific corporate name. For names that are only referenced in the inner CDOs this field should be set to zero.

Page 53 of 61 Fitch Ratings Portfolio Credit Model Users Manual © Copyright Fitch Ratings Ltd 2016
The additional information with regards to each of the inner CDOs includes the following:
• Maturity Date – Date set later than the CDO evaluation date. Each name in the inner CDO portfolio has the same maturity date.
• Attachment Point – in notional terms
• Detachment Point - in notional terms
• Reference Notional for each of the corporate names In the PCM model the default times for each of the specified corporates and for each simulation scenario will compute the loss incurred by each of the inner CDOs. The results will be included in the default and loss distribution as well as the RDR and RLR. Note: The inner CDOs are NOT considered in the default timing output or the calculation of the portfolio properties as described above. The properties are only calculated for the master portfolio excluding the inner CDOs.
Page 54 of 61 Fitch Ratings Portfolio Credit Model Users Manual © Copyright Fitch Ratings Ltd 2016
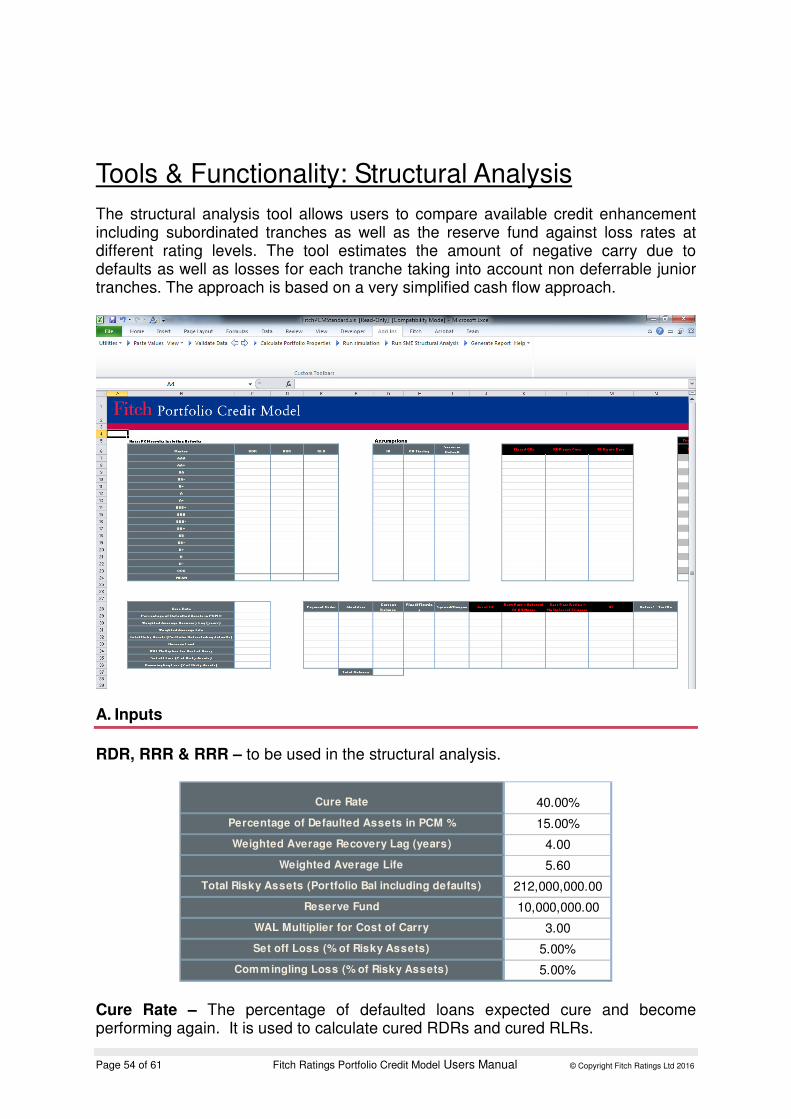
Tools & Functionality: Structural Analysis
The structural analysis tool allows users to compare available credit enhancement including subordinated tranches as well as the reserve fund against loss rates at different rating levels. The tool estimates the amount of negative carry due to defaults as well as losses for each tranche taking into account non deferrable junior tranches. The approach is based on a very simplified cash flow approach.
A. Inputs
RDR, RRR & RRR – to be used in the structural analysis.
Cure Rate 40.00%
Percentage of Defaulted Assets in PCM % 15.00%
Weighted Average Recovery Lag (years) 4.00
Weighted Average Life 5.60
Total Risky Assets (Portfolio Bal including defaults) 212,000,000.00
Reserve Fund 10,000,000.00
WAL Multiplier for Cost of Carry 3.00
Set off Loss (% of Risky Assets) 5.00%
Commingling Loss (% of Risky Assets) 5.00% Cure Rate – The percentage of defaulted loans expected cure and become performing again. It is used to calculate cured RDRs and cured RLRs.

Page 55 of 61 Fitch Ratings Portfolio Credit Model Users Manual © Copyright Fitch Ratings Ltd 2016
Percentage of Defaulted Assets in PCM – The percentage of defaulted assets included in the portfolio input into PCM. This is used to carve out the assets that are already defaulted when applying the cure rate to the RDR and RLR. Weighted Average Recovery Lag (years) – The average length of time taken to receive recoveries. A linear recovery vector is assumed therefore if it takes five years to receive all recoveries on a loan 2.5 years is entered as the weighted average recovery lag. The recovery lag is used to estimate the amount of negative carry due on the notes backed by non performing collateral until recovery proceeds are used to repay the notes. Weighted Average Life (years) – The weighted average life of the transaction. This is calculated by PCM on the various “Stats” sheets. It is used in conjunction with the multiplier (see below) to calculate the negative carry due on the notes which remain backed by non performing collateral after recovery proceeds have been used to repay some of the notes. Total Risky Assets – The portfolio balance including defaults, which is used to compute the available credit enhancement. The percentages of credit enhancement, default rate and loss rate need to be based on the same portfolio notional. Reserve Fund – remaining reserve fund amount. WAL Multiplier for Cost of Carry – Any tranche that remains outstanding after all recoveries are received may be subject to additional carry if the remaining amount of performing assets does not cover all the non-deferrable junior tranches. The multiplier is used to determine the length of time the junior tranches remain outstanding. Set off Loss (% of Risky Assets) – The percentage of portfolio lost to set off, it is applied to the “RDR post Cure” and the “RLR post Cure”. It is only applied to the rating scenarios for which the servicer is assumed to default, as set in the “Servicer Default” column. Commingling Loss (% of Risky Assets) – The percentage of portfolio lost to commingling funds in the servicer account, it is applied to the “RDR post Cure” and the “RLR post Cure”. It is only applied to the rating scenarios for which the servicer is assumed to default as set in the “Servicer Default” column.

Page 56 of 61 Fitch Ratings Portfolio Credit Model Users Manual © Copyright Fitch Ratings Ltd 2016
Interest Rate Assumptions (IR) – The rate used to calculate the negative carry amount for each scenario. CR Tiering – Represents the proportion of the cure rate to be applied in each rating scenario. Servicer Default – Choose “Yes” or “No” to select the rating stresses under which the servicer should be assumed to default. A servicer default would lead to the application of the commingling and set loss.
Payment Order Identifier Current Balance Fixed/Floating Spread/Coupon Asset CEBest Pass - Deferral Of
All Notes
Best Pass Rating - No
Deferral TriggersRE Defers? - Yes/No
1 A 120,000,000.00 Floating 2.00% No
2 B 25,000,000.00 Fixed 10.00% No
3 C 20,000,000.00 Floating 3.00% Yes
4 D 15,000,000.00 Floating 4.00% Yes
Total Balance Payment Order – The order of seniority of the notes, the most senior should be at the top starting with one. For pro rata ranking notes please enter the same payment order value, for example if class A1 and A2 rank pro rata at the top of the capital structure the user should enter a 1 for both notes. Identifier – A unique identifier for the given class. Current Balance – The current outstanding balance of the note. Fixed/Floating – Specify whether the note has a fixed or floating interest rate. Spread/Coupon – Enter the spread or coupon of the note this is only used if the note has a fixed interest rate. Defers? – Yes/No – This indicates whether the terms and conditions of the note allow the interest to be deferred and paid at a later date. Non deferrable junior ranking notes will be considered when calculating the amount of carry interest for senior notes. For example if class B is set to no (cannot defer) than class A is only redeemed iffull interest has been paid to class B. The calculation therefore will allocate principal proceeds (recoveries and collections) to pay interest on class B before principal on class A.
B. Outputs
Tiered CRs – Tiered cure rates are calculated from the input “Cure Rate” and the “CR Tiering” for each rating stress. RDR Post Cure & RLR Post Cure – These columns show the resulting default and loss rate after accounting for cures as well as taking into account losses due to setoffs and commingled funds.
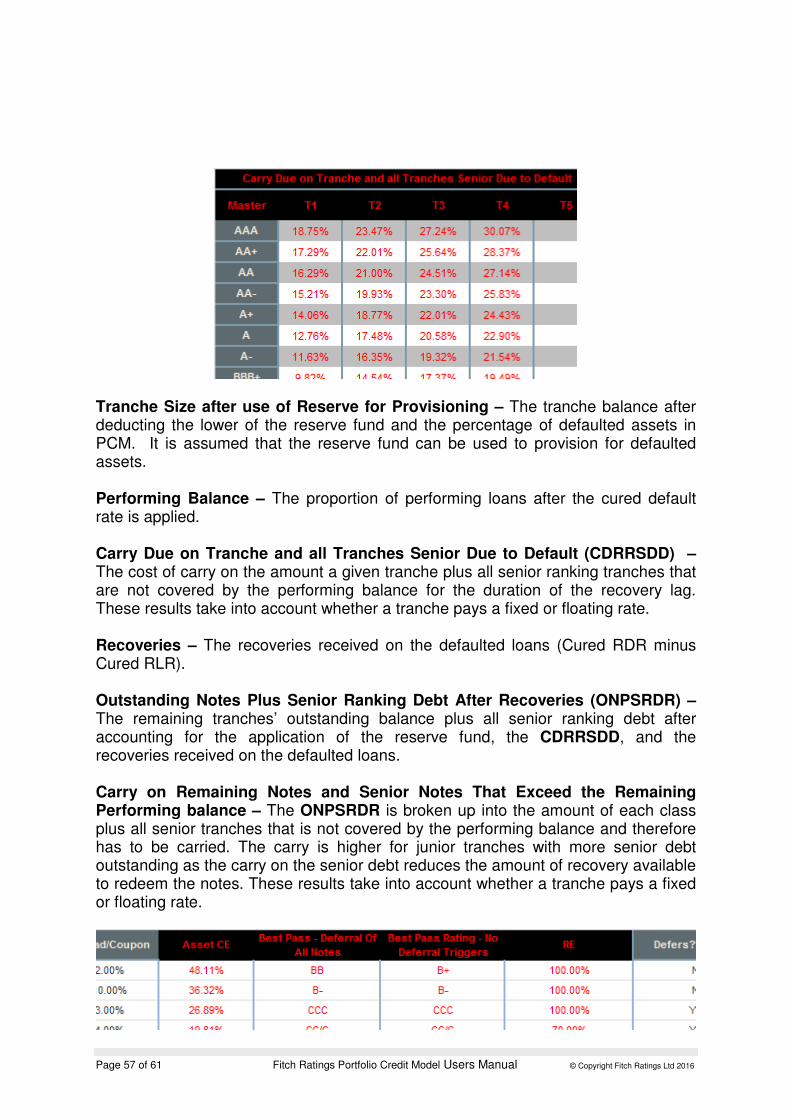
Page 57 of 61 Fitch Ratings Portfolio Credit Model Users Manual © Copyright Fitch Ratings Ltd 2016
Tranche Size after use of Reserve for Provisioning – The tranche balance after deducting the lower of the reserve fund and the percentage of defaulted assets in PCM. It is assumed that the reserve fund can be used to provision for defaulted assets. Performing Balance – The proportion of performing loans after the cured default rate is applied. Carry Due on Tranche and all Tranches Senior Due to Default (CDRRSDD) – The cost of carry on the amount a given tranche plus all senior ranking tranches that are not covered by the performing balance for the duration of the recovery lag. These results take into account whether a tranche pays a fixed or floating rate. Recoveries – The recoveries received on the defaulted loans (Cured RDR minus Cured RLR). Outstanding Notes Plus Senior Ranking Debt After Recoveries (ONPSRDR) – The remaining tranches’ outstanding balance plus all senior ranking debt after accounting for the application of the reserve fund, the CDRRSDD, and the recoveries received on the defaulted loans. Carry on Remaining Notes and Senior Notes That Exceed the Remaining Performing balance – The ONPSRDR is broken up into the amount of each class plus all senior tranches that is not covered by the performing balance and therefore has to be carried. The carry is higher for junior tranches with more senior debt outstanding as the carry on the senior debt reduces the amount of recovery available to redeem the notes. These results take into account whether a tranche pays a fixed or floating rate.

Page 58 of 61 Fitch Ratings Portfolio Credit Model Users Manual © Copyright Fitch Ratings Ltd 2016
Asset CE – Credit enhancement calculated based on the tranche notional, expressed as percentage of total risky assets. This takes into account the reserve fund. Best Pass – Optimal Deferral Triggers – The best pass rating scenario for a note accounting for carry due to default and assuming all junior notes can defer interest the moment there is an interest shortfall. In other words principal funds are applied first to redeem the tranche or any senior tranches before paying interest on junior ranking tranches. Best Pass – No deferral of non-deferrable notes– The best pass rating scenario taking into account cost of carry of non-deferrable junior ranking notes based on column “Defers?”. Here principal funds are first used to pay interest on junior ranking non deferrable notes before principal to the note and any senior ranking notes. RE – Recovery Estimate to the nearest five percent and capped at 100%. The calculation is based on the amount recovered under a B rating scenario.

Page 59 of 61 Fitch Ratings Portfolio Credit Model Users Manual © Copyright Fitch Ratings Ltd 2016
Installation
A. System Requirements
PC � 1GB Memory minimum � 1.2+ GHz Processor Speed
Operating System
� Windows NT, XP or Vista, Windows 7
� Software � Excel 2003 or Excel 2007 � Office 2003 Update; Redistributable Interop Libraries � Windows .NET 3.5 (available free from Microsoft web site) � Multilingual User Interface Pack for your version of Office (if not English language
selected). � Other Requirements � You might need to have administrator rights for the PC to which you are
downloading Fitch Ratings Portfolio Credit Model. If you do not have these rights, please contact your IT department.
B. Installation Checklist
Before installing and or downloading the Fitch Ratings Portfolio Credit Model you must: � meet the minimum requirements to access and install the model; and � Probably have administrator rights to install the Fitch Ratings Portfolio Credit
Model.
C. Downloading the Fitch Ratings Portfolio Credit Model
Before you can download and install the Fitch Ratings Portfolio Credit Model you must have access to the Internet. To download the Fitch Ratings Portfolio Credit Model:
1. open your Internet browser; 2. type www.fitchratings.com in the Address field. The Fitch Ratings website
appears; 3. Select Strutured Finance from the menu (accessed by clicking in the top left of
the page) 4. Select CLO & Structured Credit from the table on the right. 5. In the Resources table on the right of the page select the link Portfolio Credit
Model. 6. a Fitch Ratings Portfolio Credit Model description and requirements page
appears;

Page 60 of 61 Fitch Ratings Portfolio Credit Model Users Manual © Copyright Fitch Ratings Ltd 2016
7. Click the Download link for the Model 8. the Fitch Ratings Portfolio Credit Model Program Agreement page appears; 9. click ‘I Accept’ if you agree to the terms to download the model. If you do not
agree the terms indicated, you will not be able to download the application. a File Download window appears;
10. click the Save this file to disk radio button; 11. click OK. A Save As window appears; 12. select a folder location for the self extracting executable; and 13. click Save. The files are saved to the selected location.
D. Installing the Fitch Ratings Portfolio Credit Model
Once you have downloaded the file you must install the application. To install the model: 1. locate and open the self extracting application file you saved to your PC; 2. double-click the FitchCDOModel.msi file; 3. the install process will run, you will have to confirm acceptance of the licence
agreement for a second time; 4. click Next. 5. an Extracting Files window may automatically appear. A Setup Status window
appears. A message window may appear indicating the file process may take some time.
6. click Finish. Please Note: The Fitch Ratings Portfolio Credit Model’s installation wizard creates a subfolder saved in the location specified during installation. The subfolder only contains the latest version of the Fitch Ratings Portfolio Credit Model. Subsequent installations of Fitch Ratings Portfolio Credit Model will overwrite all files (including previous versions of the model) in the specified folder to assure that users have the latest version. For this reason, no working files should be stored in the specified folder.
E. Reinstalling the Fitch Ratings Portfolio Credit Model
When the Fitch Ratings Portfolio Credit Model application files are updated you must remove and reinstall the application. 1. Download the Fitch Ratings Portfolio Credit Model from the Fitch Website. 2. Double-click application. 3. Select the Remove to reinstall the application and click Next. Follow the on
screen instructions to complete reinstallation.
F. Downloading and Installing the Fitch Ratings ResiEMEA Model
Before you can download and install the Fitch Ratings ResiEMEA Model you must have access to the Internet. To download the Model:

Page 61 of 61 Fitch Ratings Portfolio Credit Model Users Manual © Copyright Fitch Ratings Ltd 2016
1. open your Internet browser; 2. type www.fitchratings.com in the Address field. The Fitch Ratings website
appears; 3. Select Strutured Finance from the menu (accessed by clicking in the top left of
the page)Select RMBS from the table on the right. 4. In the Resources table on the right of the page select the link ResiEMEA. 5. ResiEMEA Model description and requirements page appears; 6. Click the Download link for the Model 7. the Fitch Ratings Program Agreement page appears; 8. click ‘I Accept’ if you agree to the terms to download the model. If you do not
agree the terms indicated, you will not be able to download the application. a File Download window appears;
9. click the Save this file to disk radio button; 10. click OK. A Save As window appears; 11. copy the content of the compressed zip file to your local hard drive;