Embed Size (px)
Citation preview
Portfolio Facing Headwind
The Wharf (Holdings) Limited
2019 Interim Results
8 Aug 2019
1
Overview
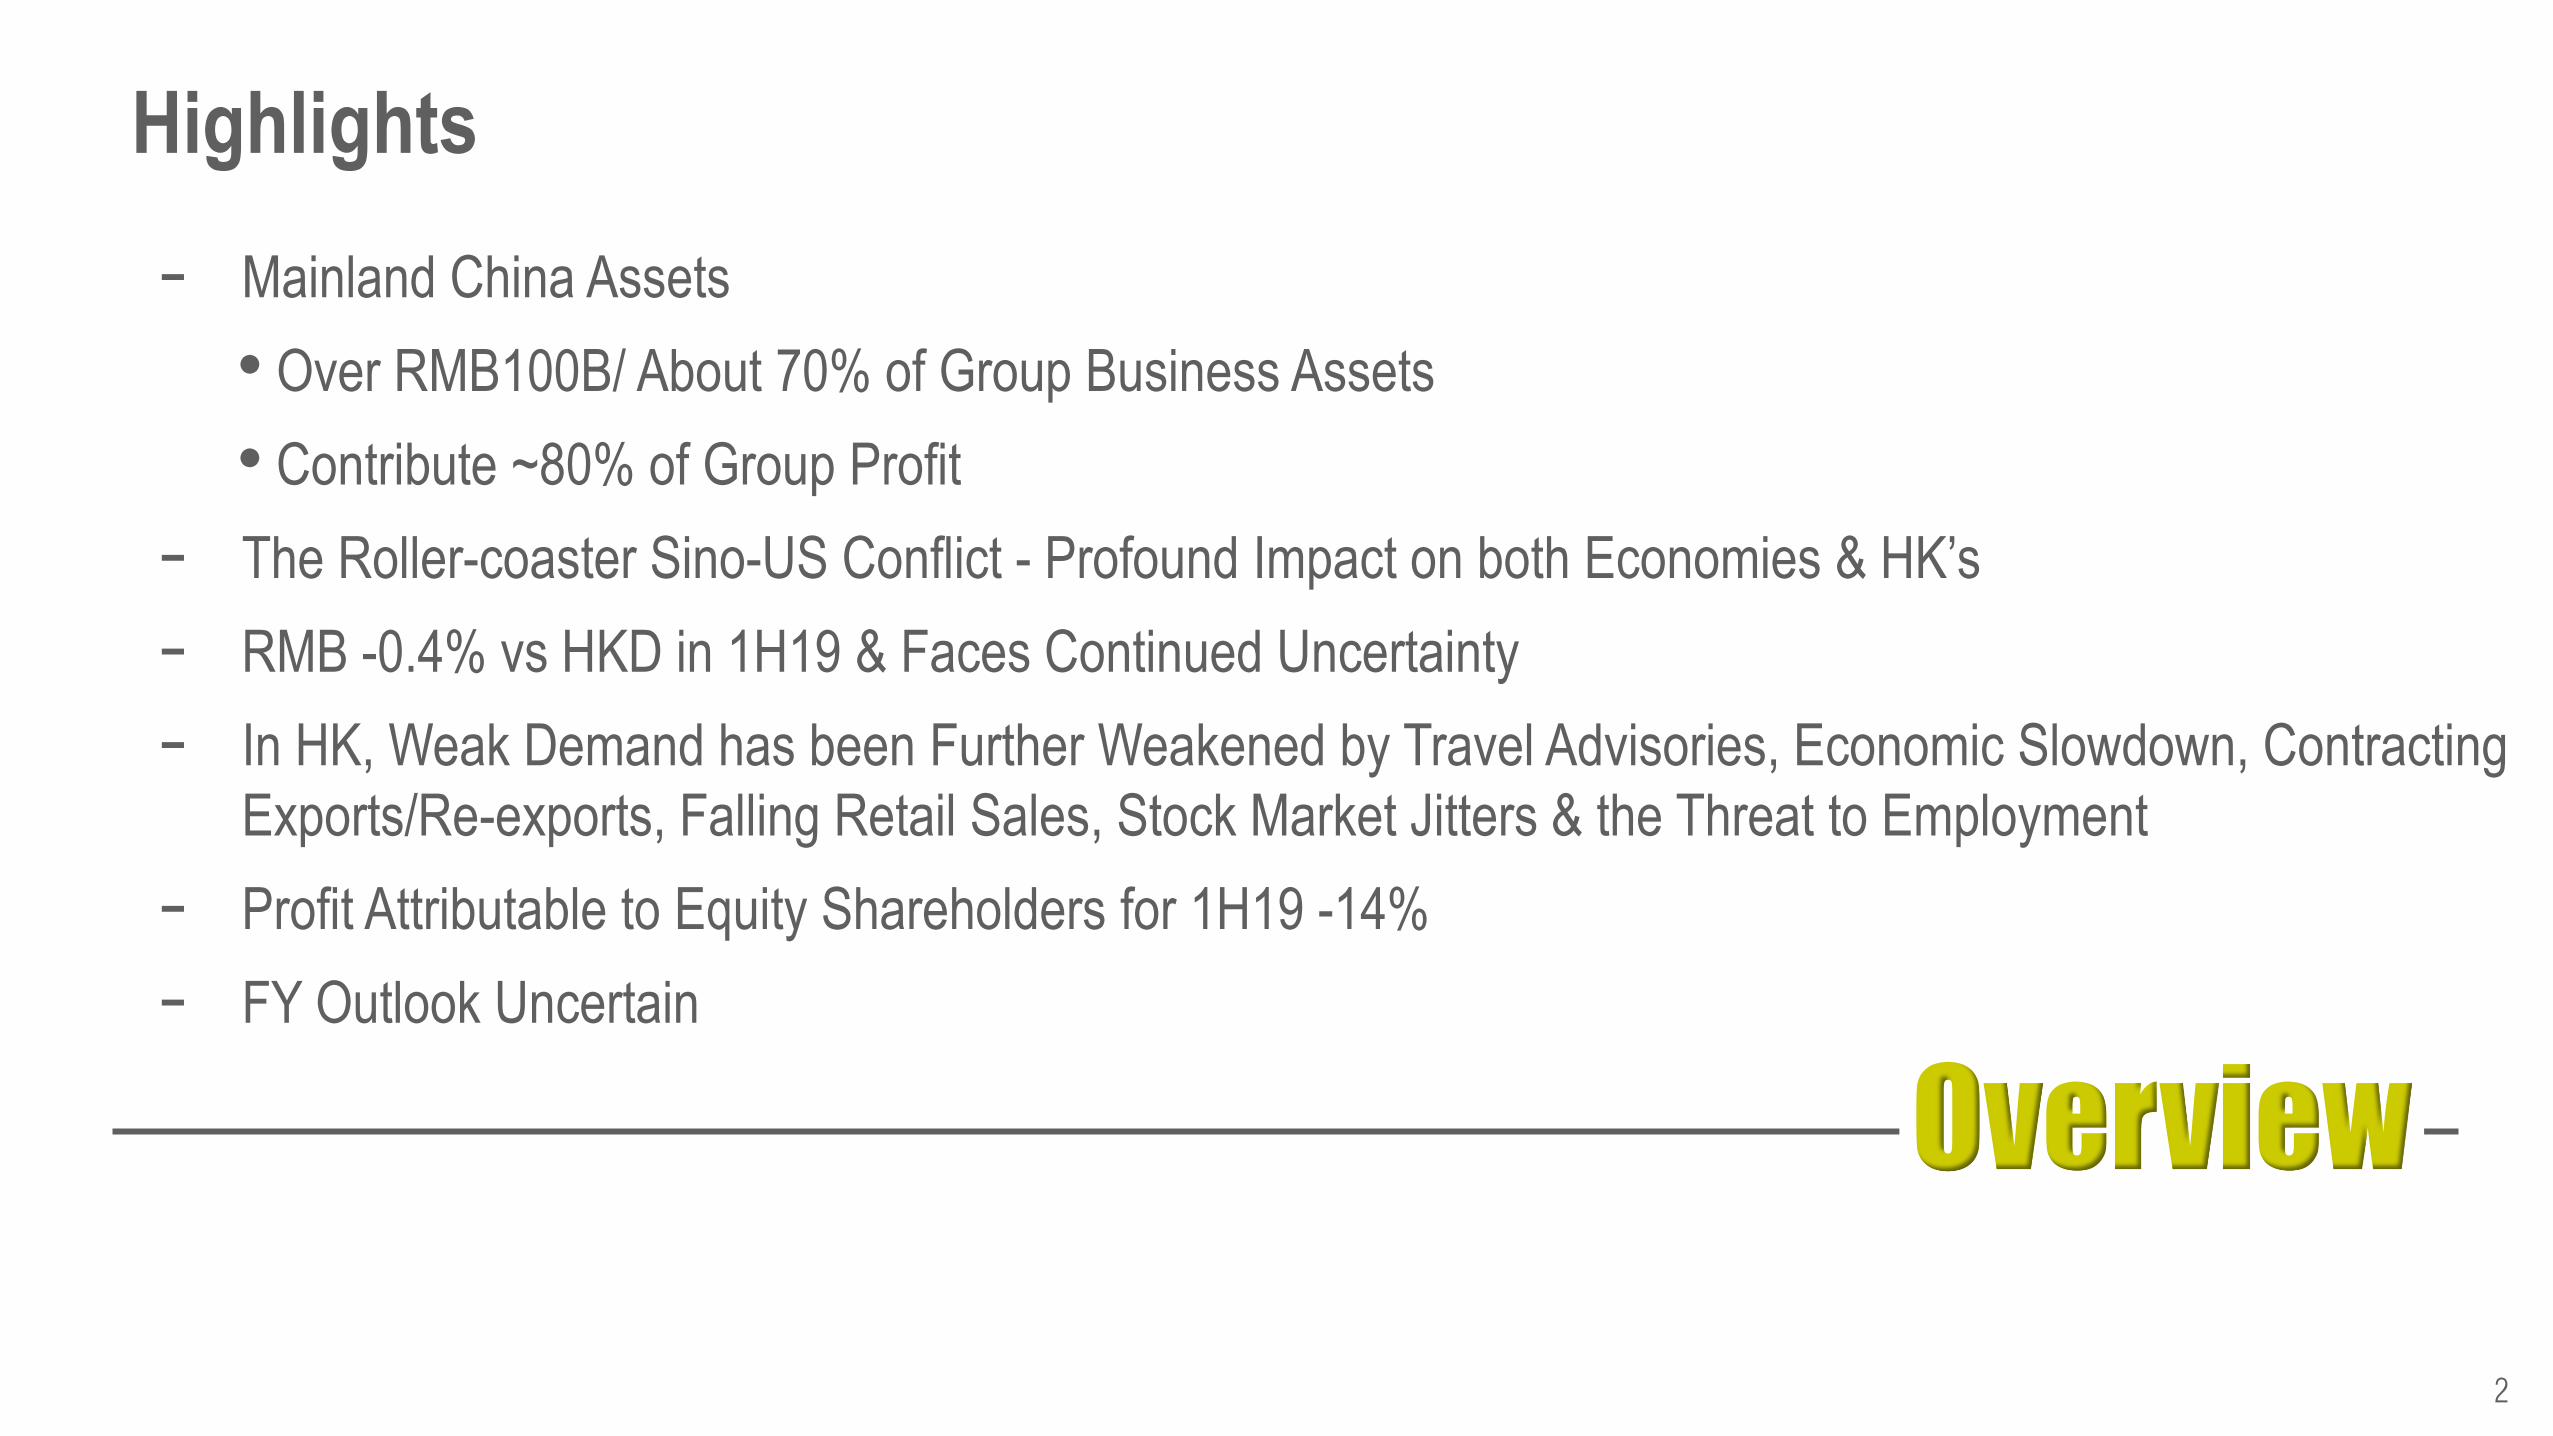
- Mainland China Assets
• Over RMB100B/ About 70% of Group Business Assets
• Contribute ~80% of Group Profit
- The Roller-coaster Sino-US Conflict - Profound Impact on both Economies & HK’s
- RMB -0.4% vs HKD in 1H19 & Faces Continued Uncertainty
- In HK, Weak Demand has been Further Weakened by Travel Advisories, Economic Slowdown, Contracting
Exports/Re-exports, Falling Retail Sales, Stock Market Jitters & the Threat to Employment
- Profit Attributable to Equity Shareholders for 1H19 -14%
- FY Outlook Uncertain
2
Highlights
Overview
3
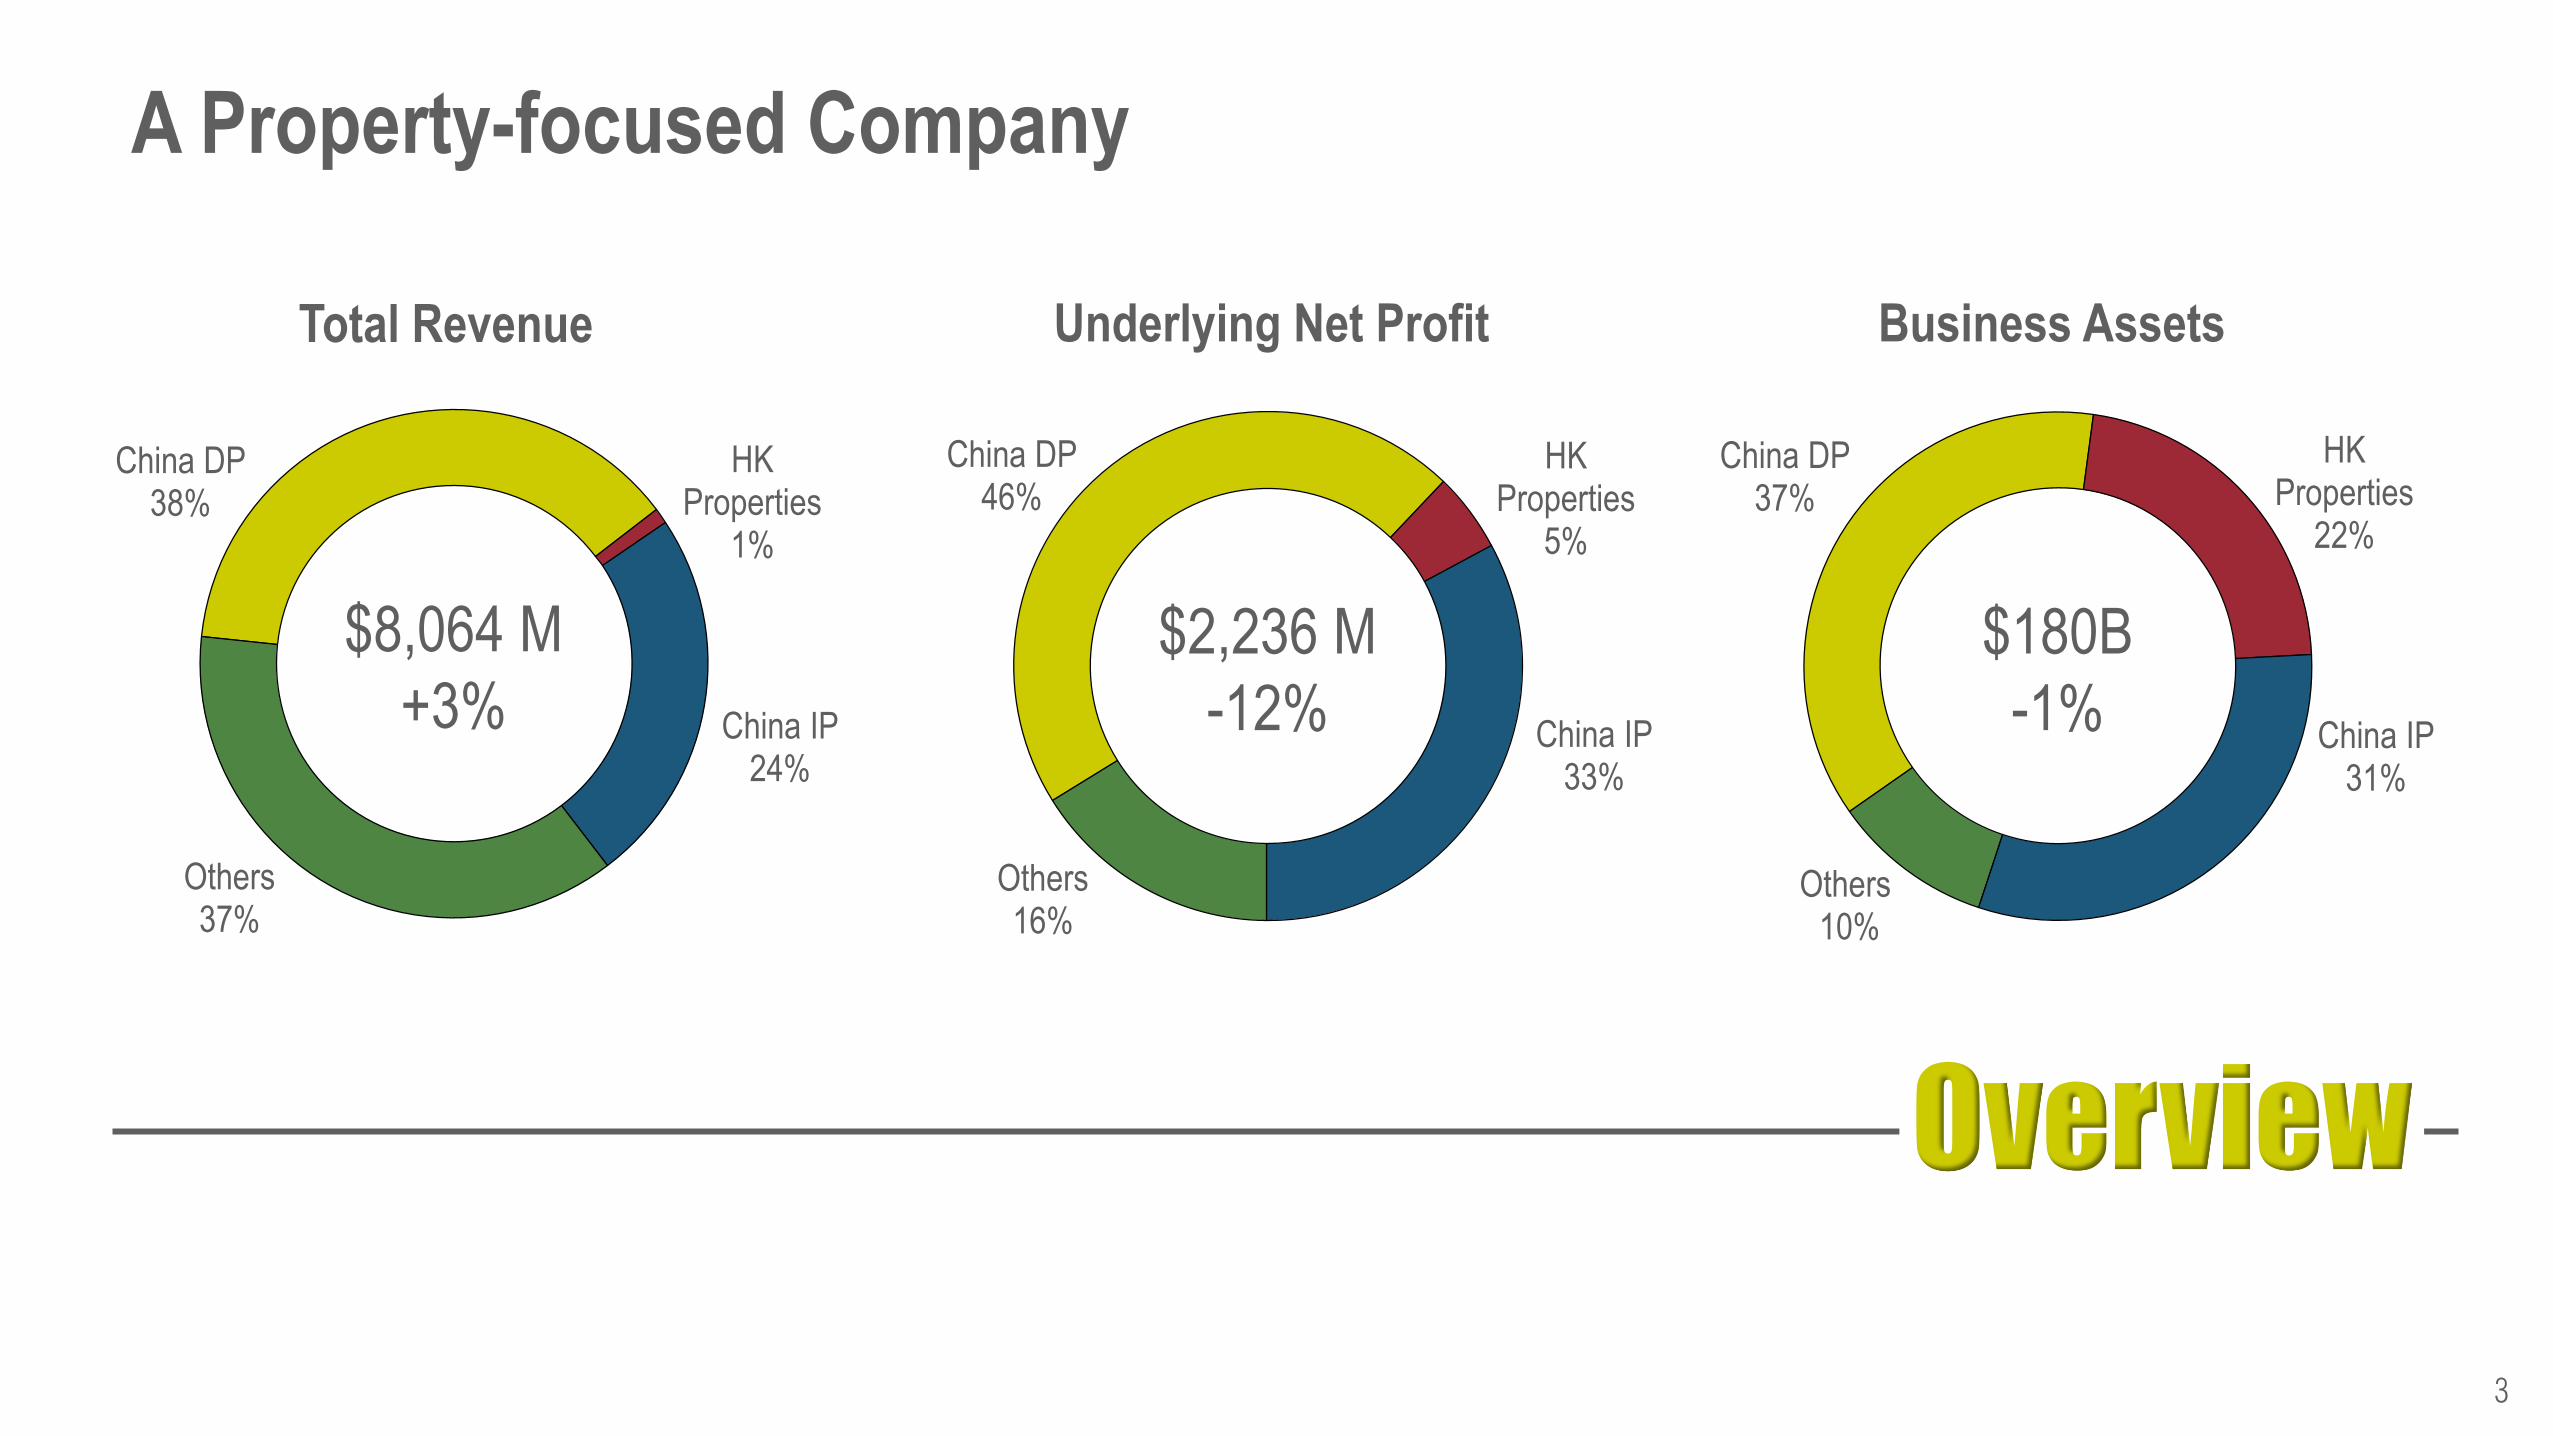
A Property-focused Company
China DP 38%
HK Properties
1%
China IP 24%
Others 37%
$8,064 M
+3%
China DP 46%
HK Properties
5%
China IP 33%
Others 16%
$2,236 M
-12%
China DP 37%
HK Properties
22%
China IP 31%
Others 10%
$180B
-1%
Total Revenue Underlying Net Profit Business Assets
Overview
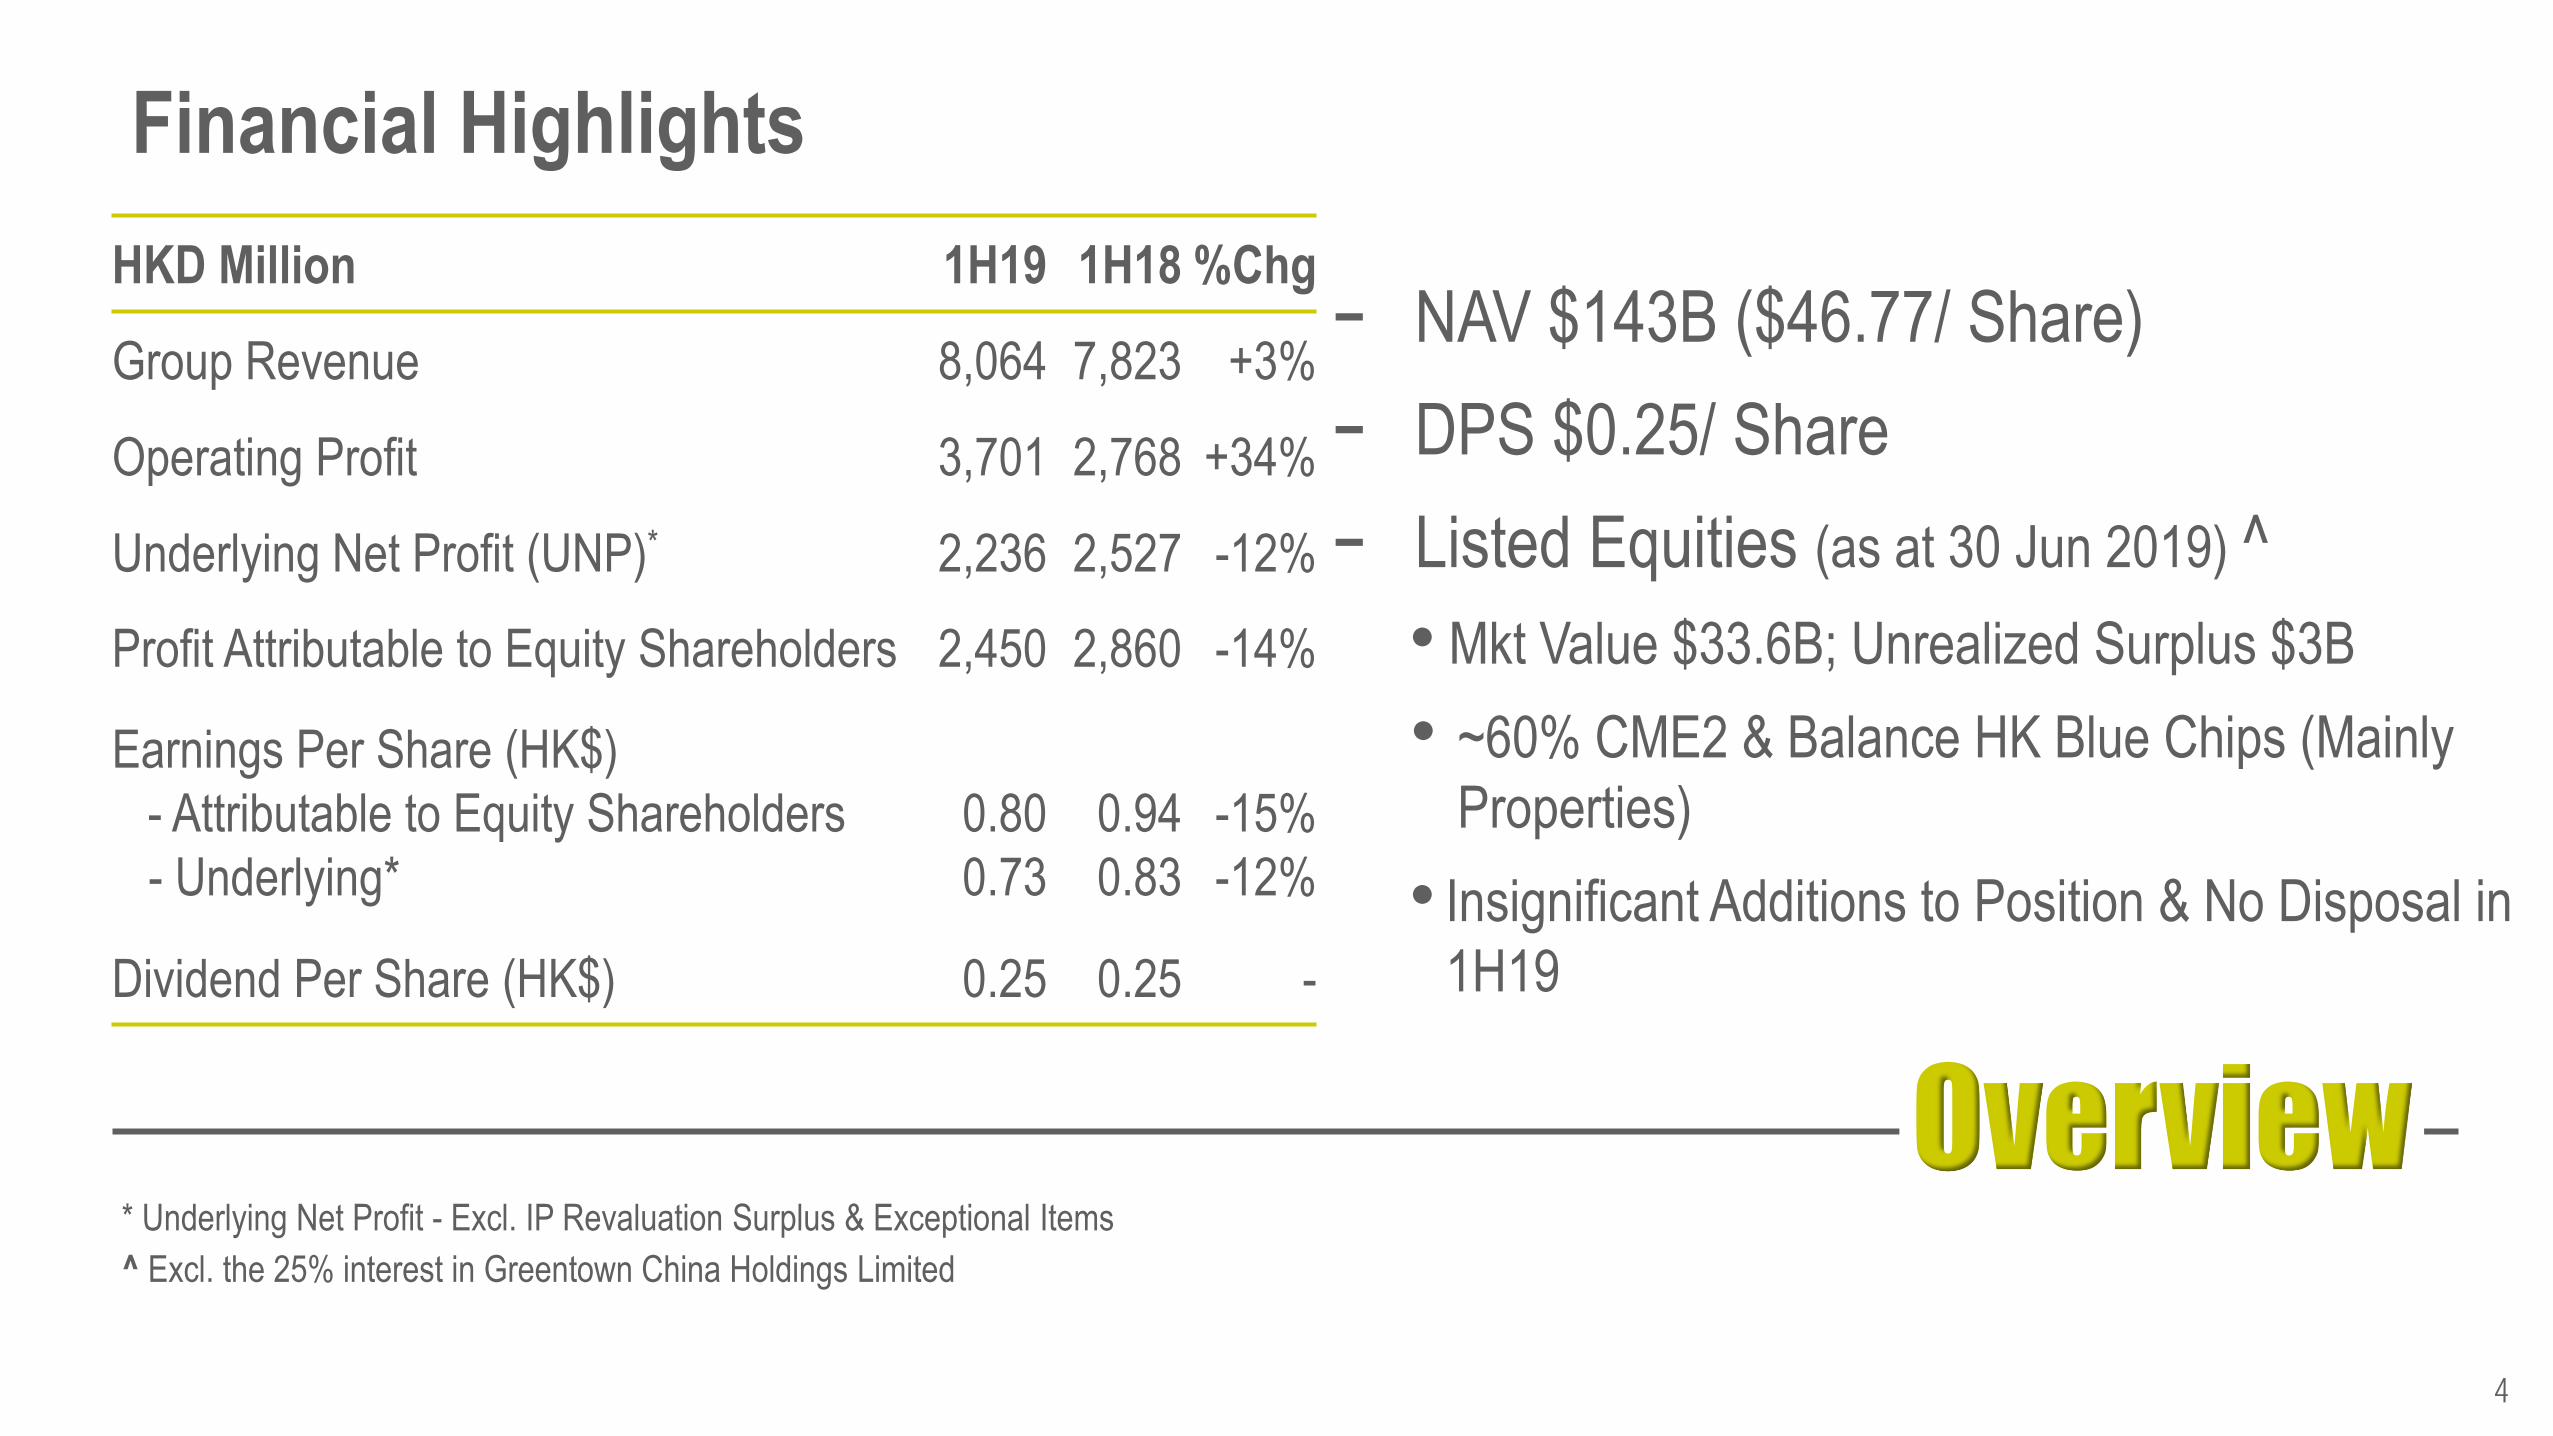
- NAV $143B ($46.77/ Share)
- DPS $0.25/ Share
- Listed Equities (as at 30 Jun 2019) ^
• Mkt Value $33.6B; Unrealized Surplus $3B
• ~60% CME2 & Balance HK Blue Chips (Mainly
Properties)
• Insignificant Additions to Position & No Disposal in
1H19
4
Financial Highlights
HKD Million 1H19 1H18 %Chg
Group Revenue 8,064 7,823 +3%
Operating Profit 3,701 2,768 +34%
Underlying Net Profit (UNP)* 2,236 2,527 -12%
Profit Attributable to Equity Shareholders 2,450 2,860 -14%
Earnings Per Share (HK$)
- Attributable to Equity Shareholders
- Underlying*
0.80
0.73
0.94
0.83
-15%
-12%
Dividend Per Share (HK$) 0.25 0.25 -
* Underlying Net Profit - Excl. IP Revaluation Surplus & Exceptional Items
^ Excl. the 25% interest in Greentown China Holdings Limited
Asset Turns
Recurring Income
Services
Financial Management
5
Asset Turns
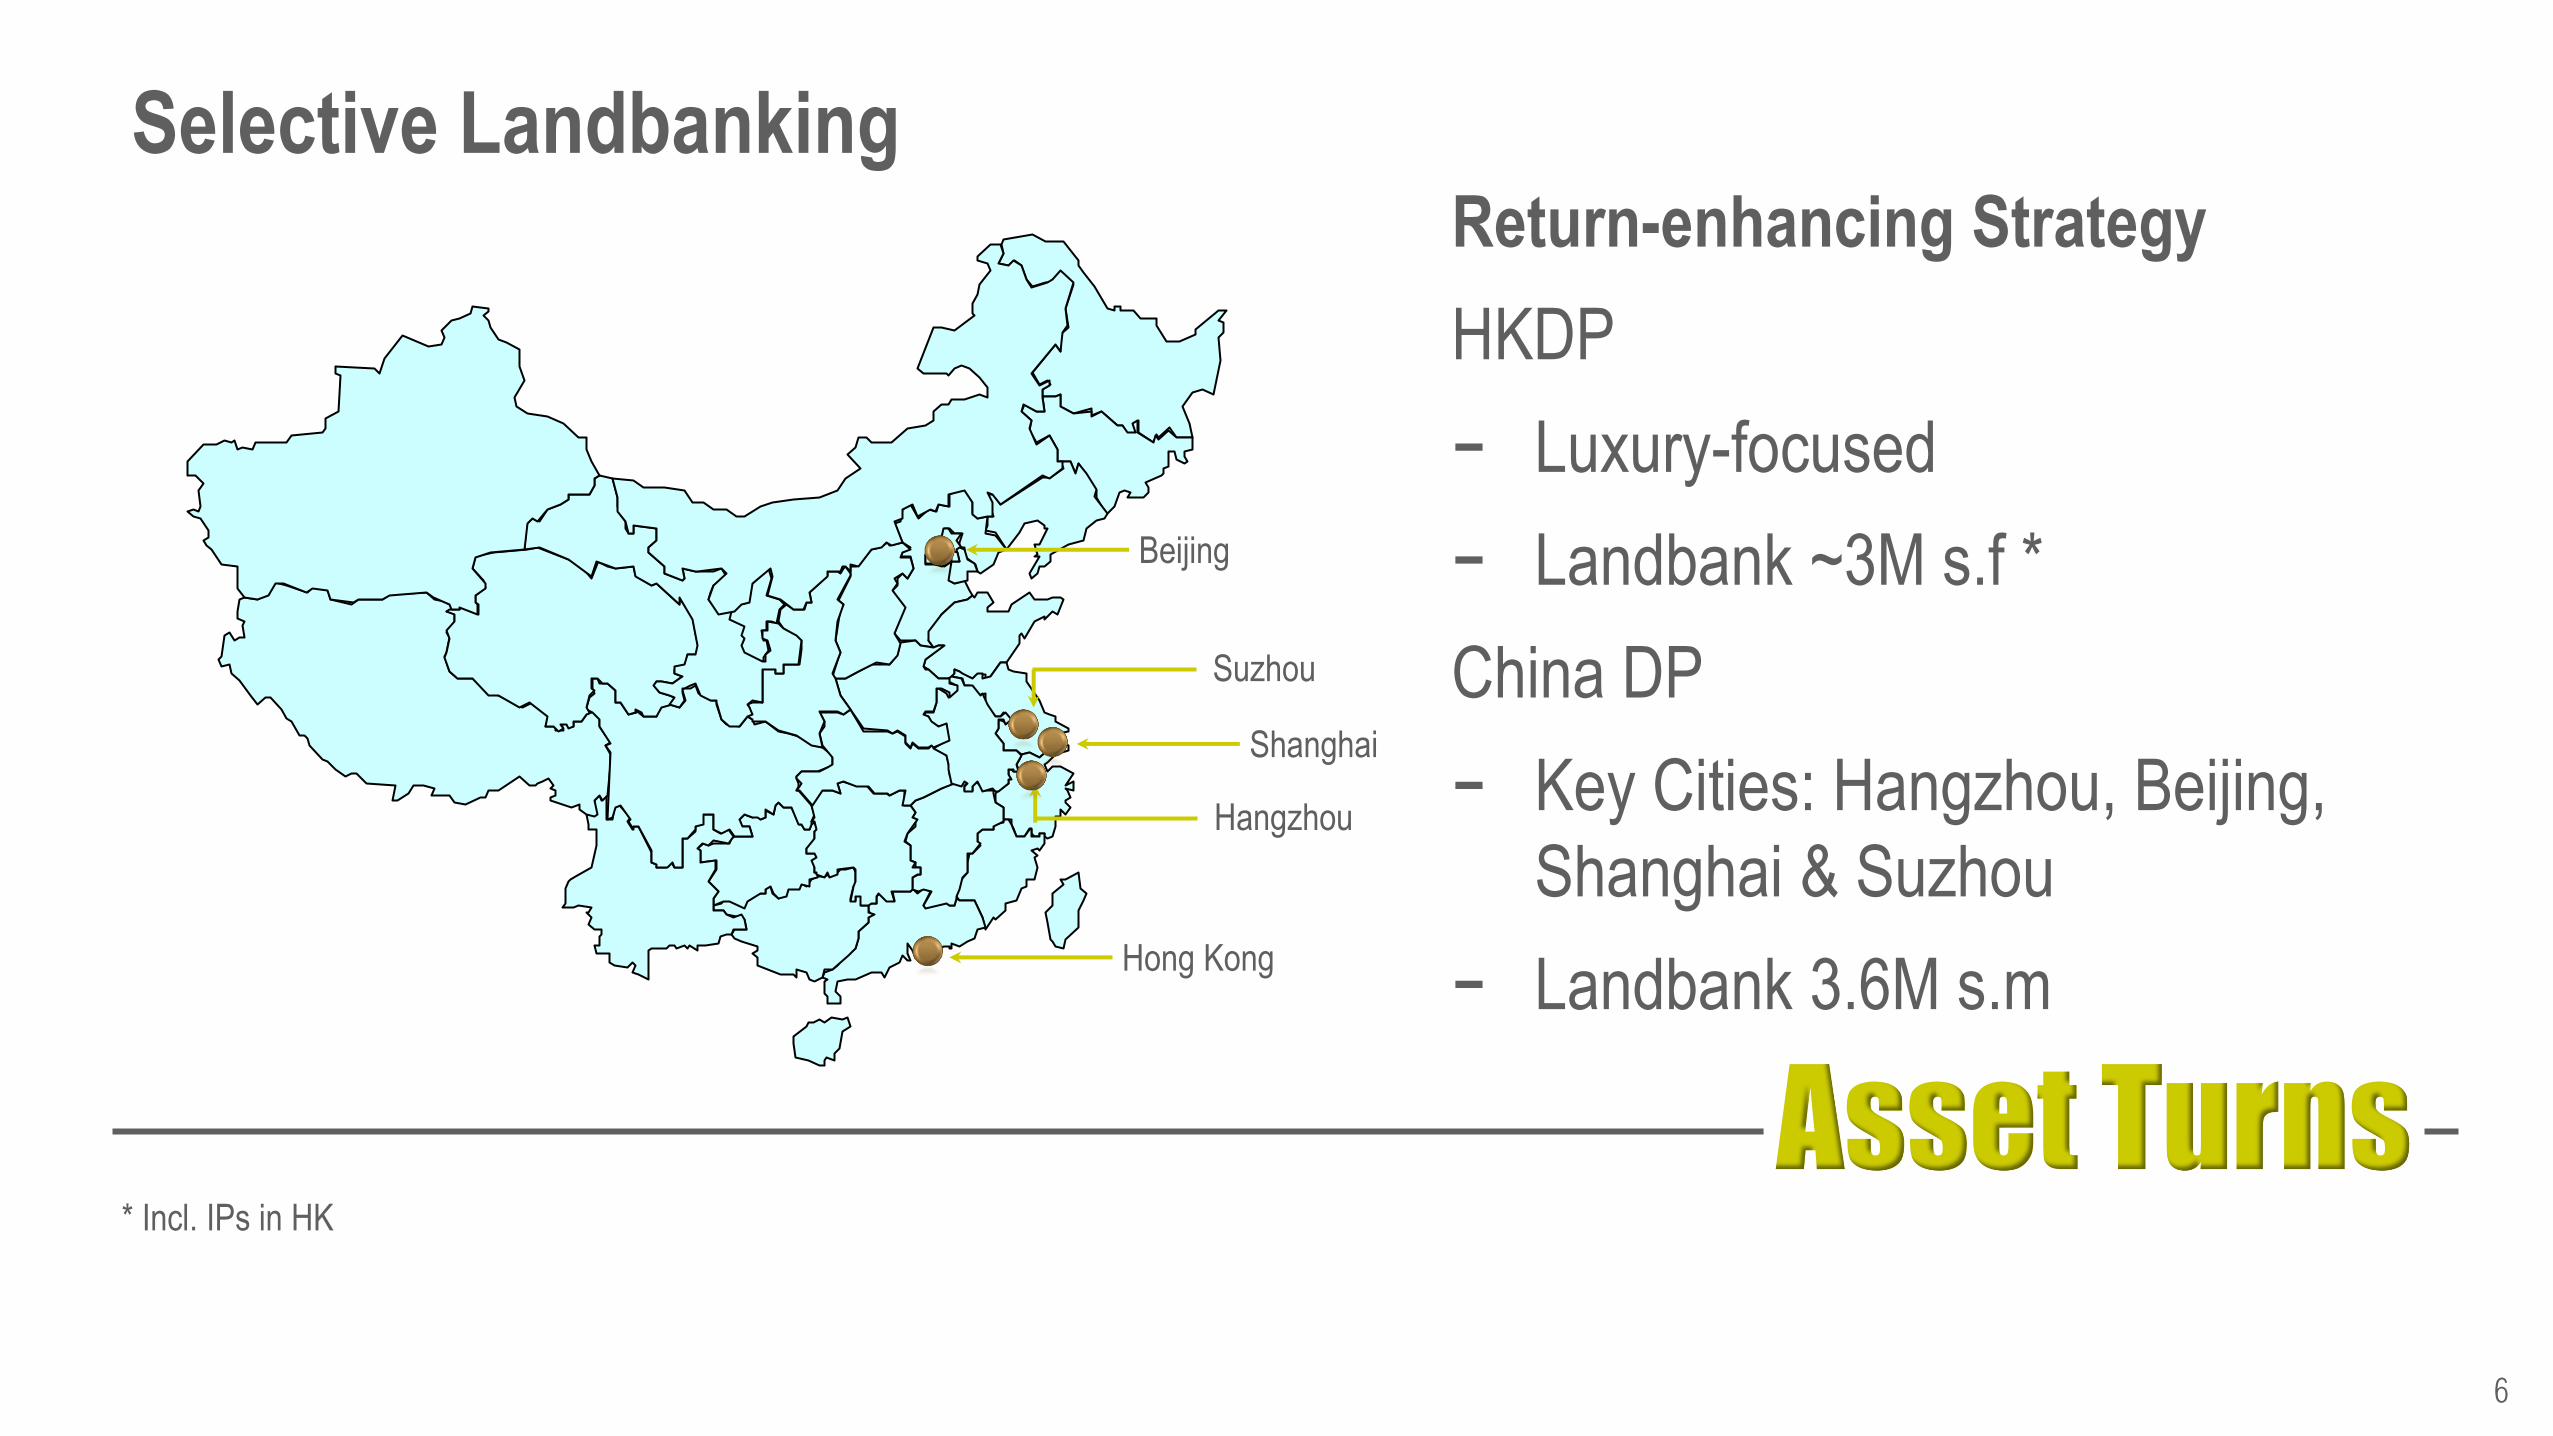
Return-enhancing Strategy
HKDP
- Luxury-focused
- Landbank ~3M s.f *
China DP
- Key Cities: Hangzhou, Beijing,
Shanghai & Suzhou
- Landbank 3.6M s.m
6
Selective Landbanking
* Incl. IPs in HK
Hong Kong
Shanghai
Suzhou
Hangzhou
Beijing
Asset Turns
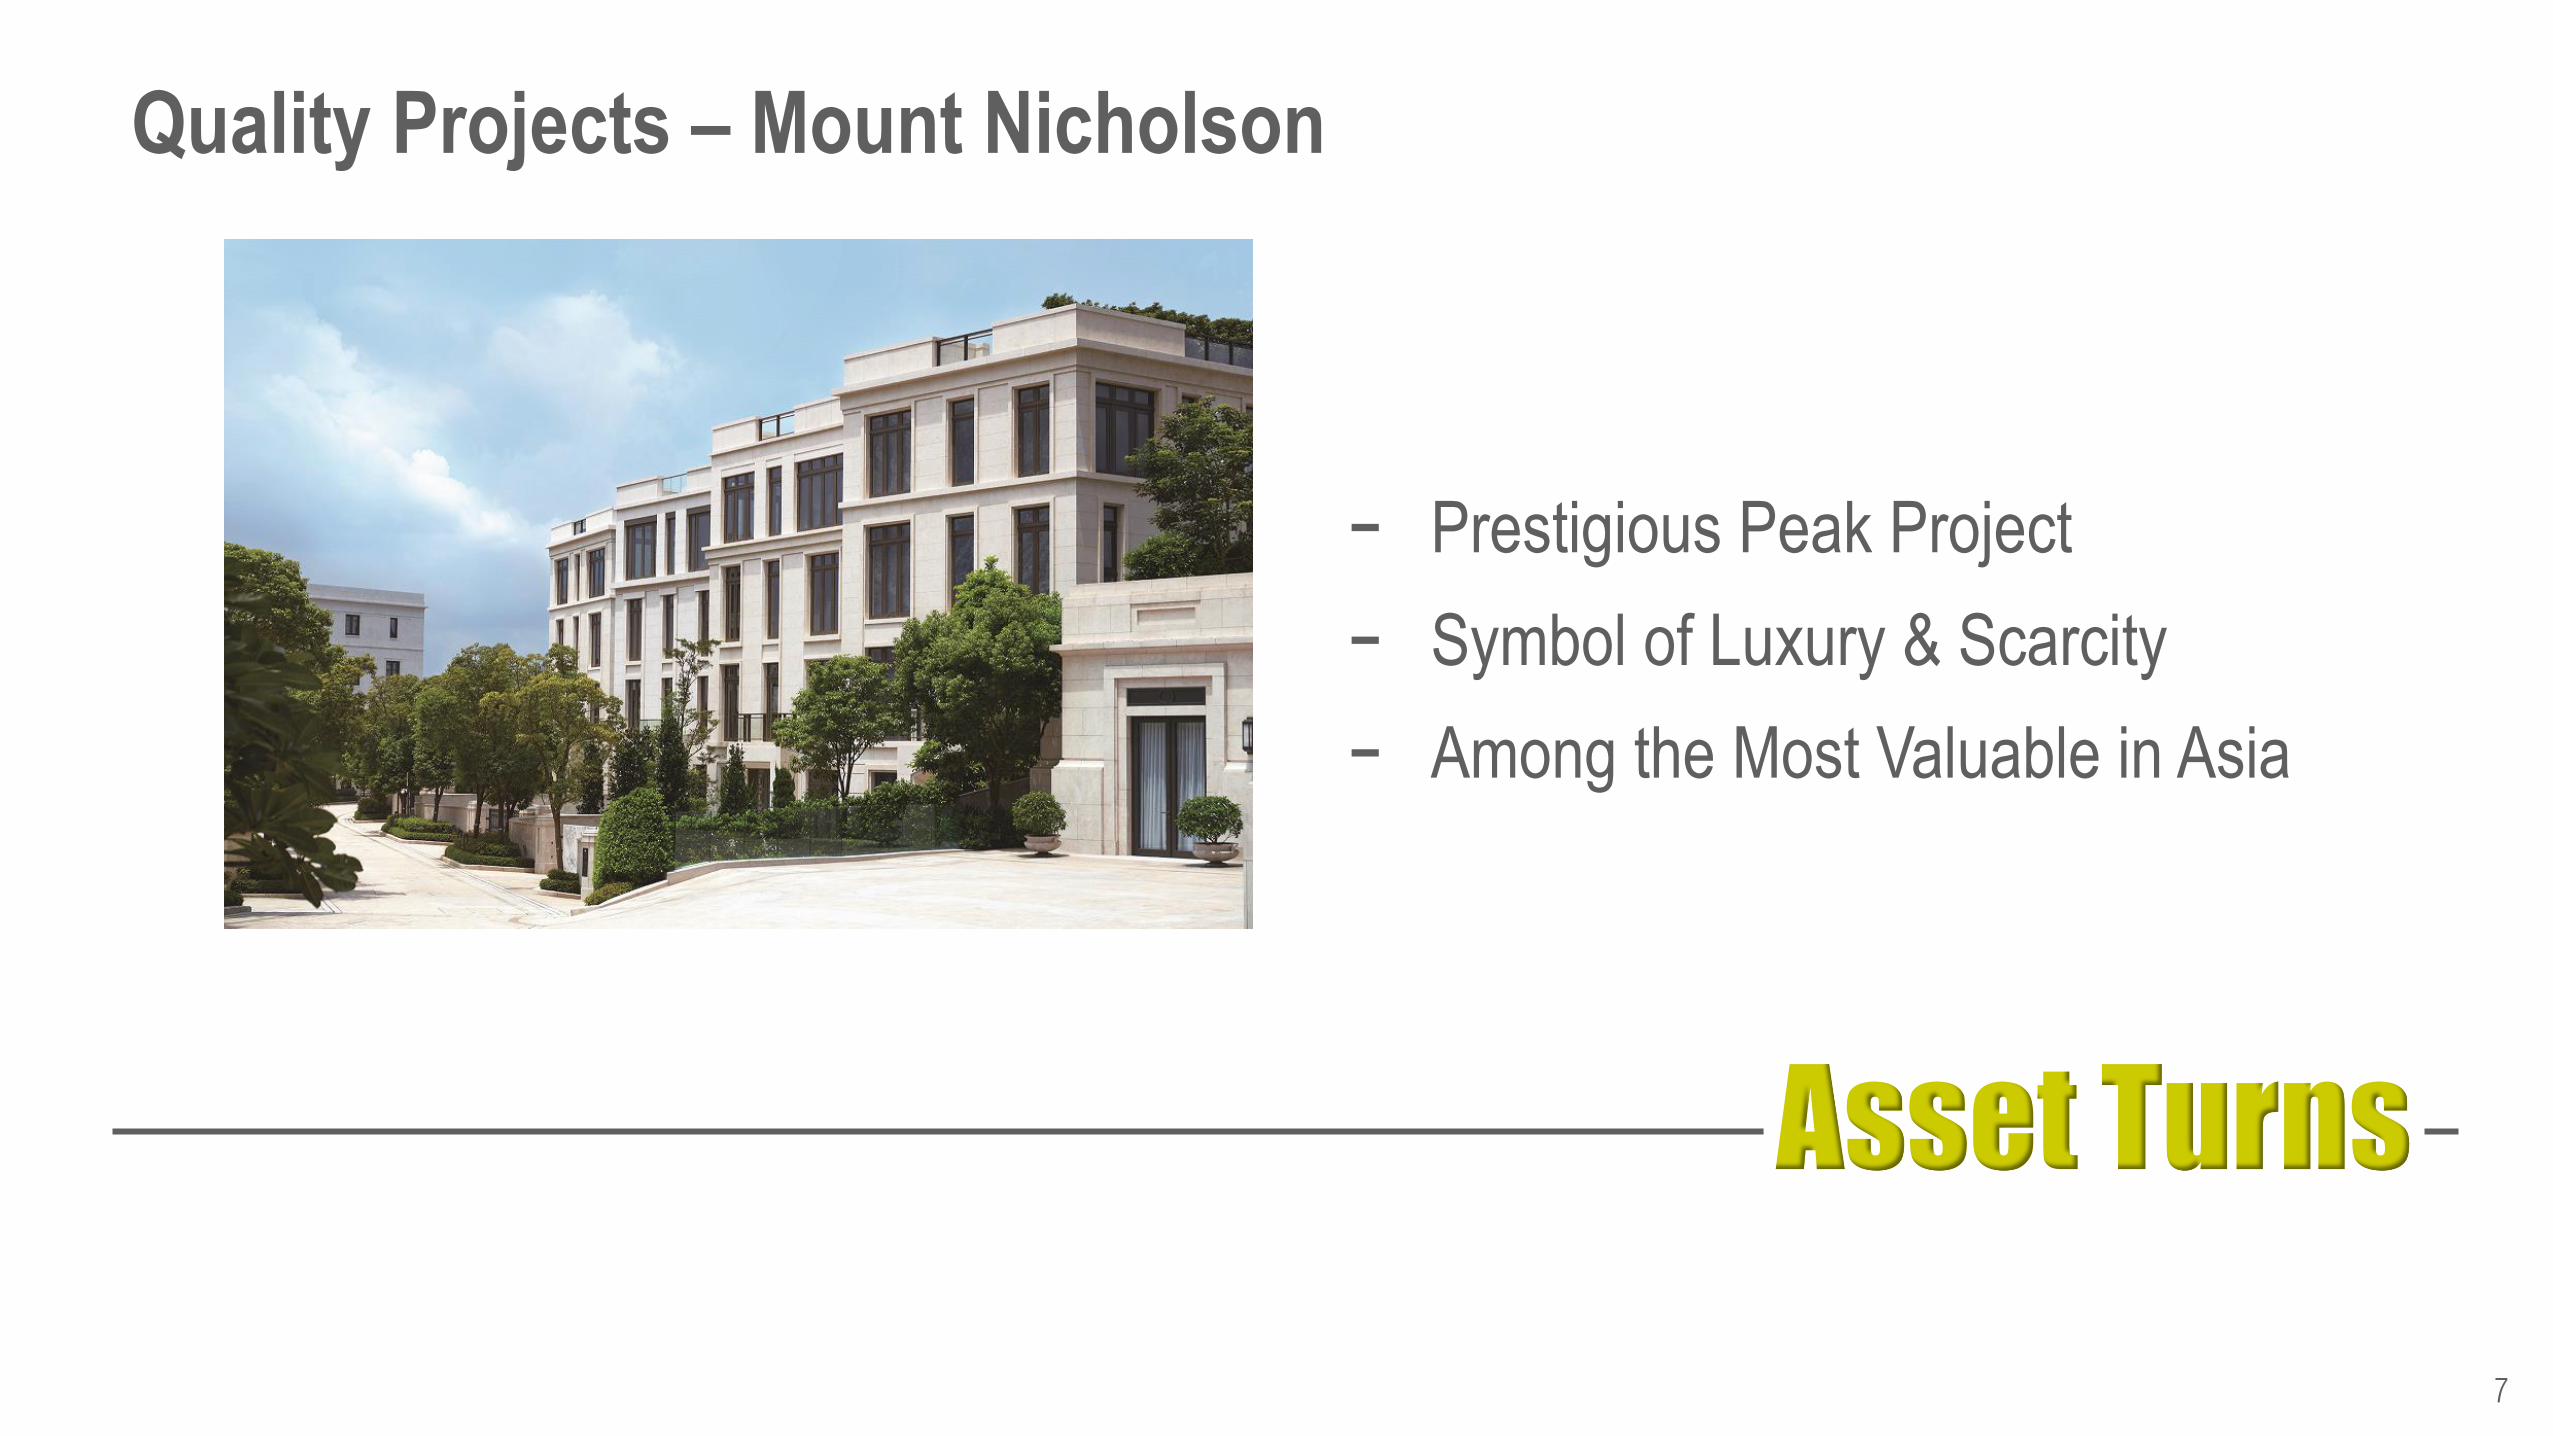
- Prestigious Peak Project
- Symbol of Luxury & Scarcity
- Among the Most Valuable in Asia
7
Quality Projects – Mount Nicholson
Asset Turns
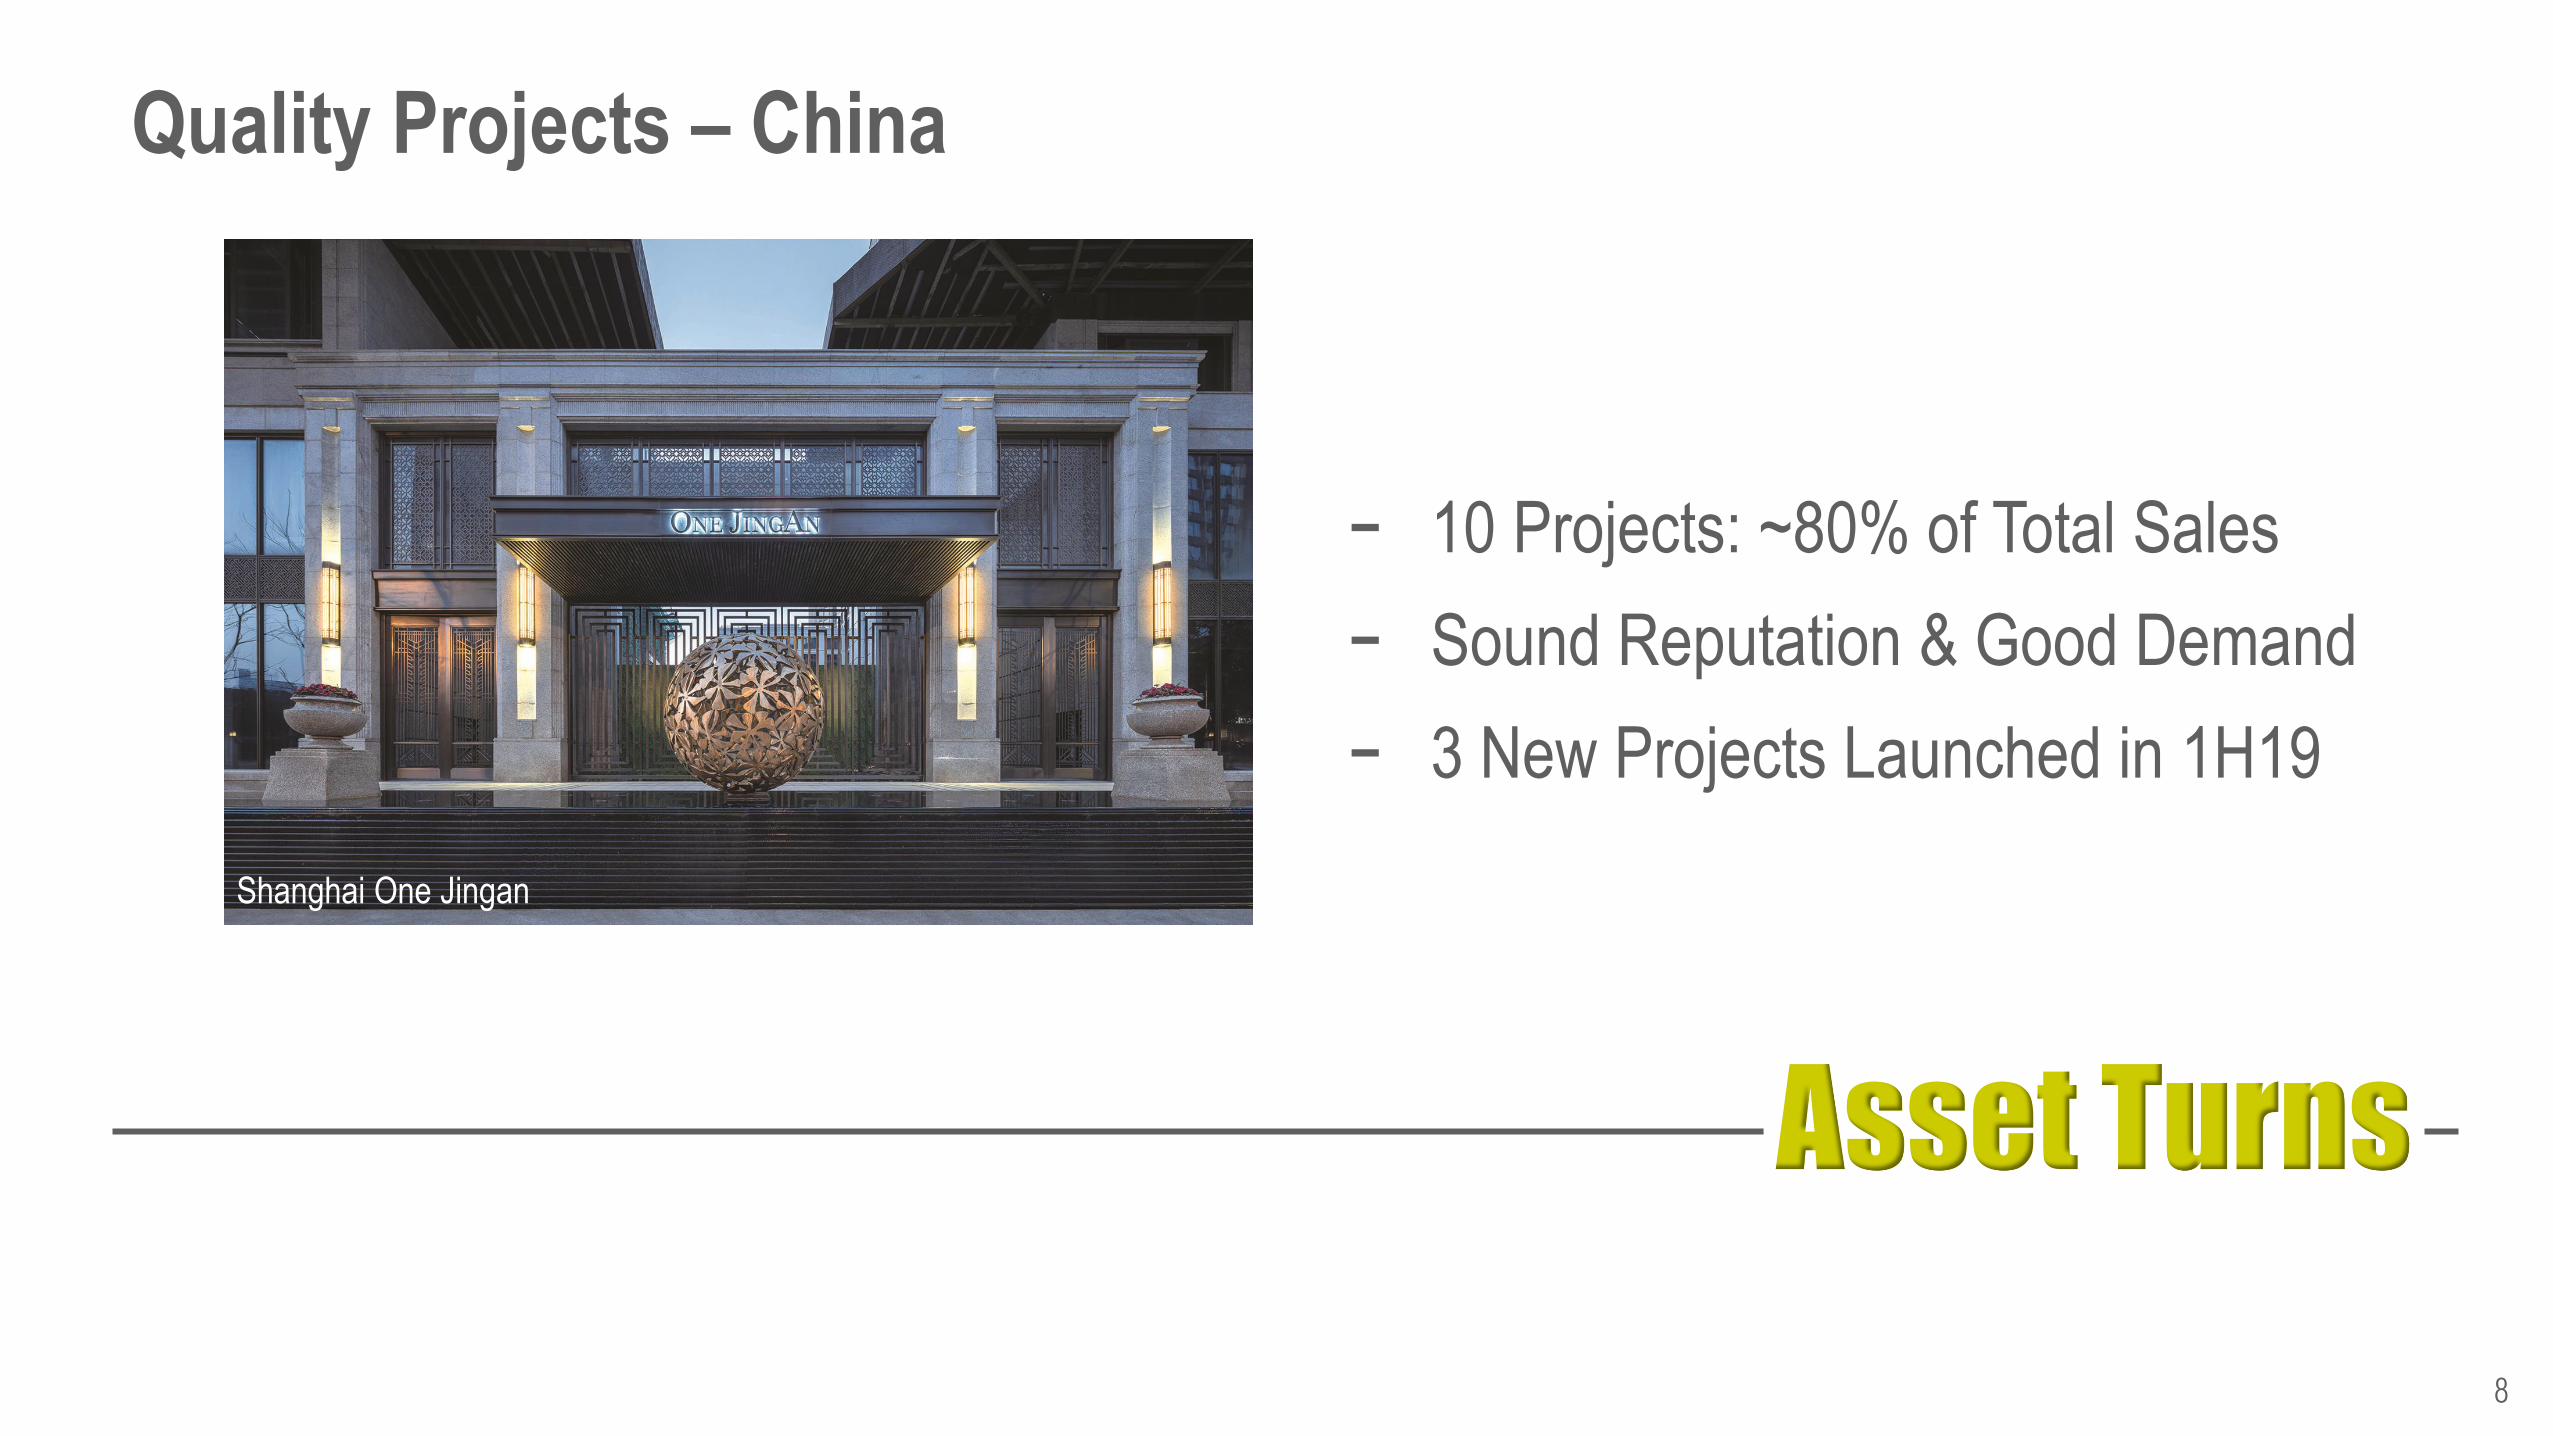
- 10 Projects: ~80% of Total Sales
- Sound Reputation & Good Demand
- 3 New Projects Launched in 1H19
8
Quality Projects – China
Shanghai One Jingan
Asset Turns
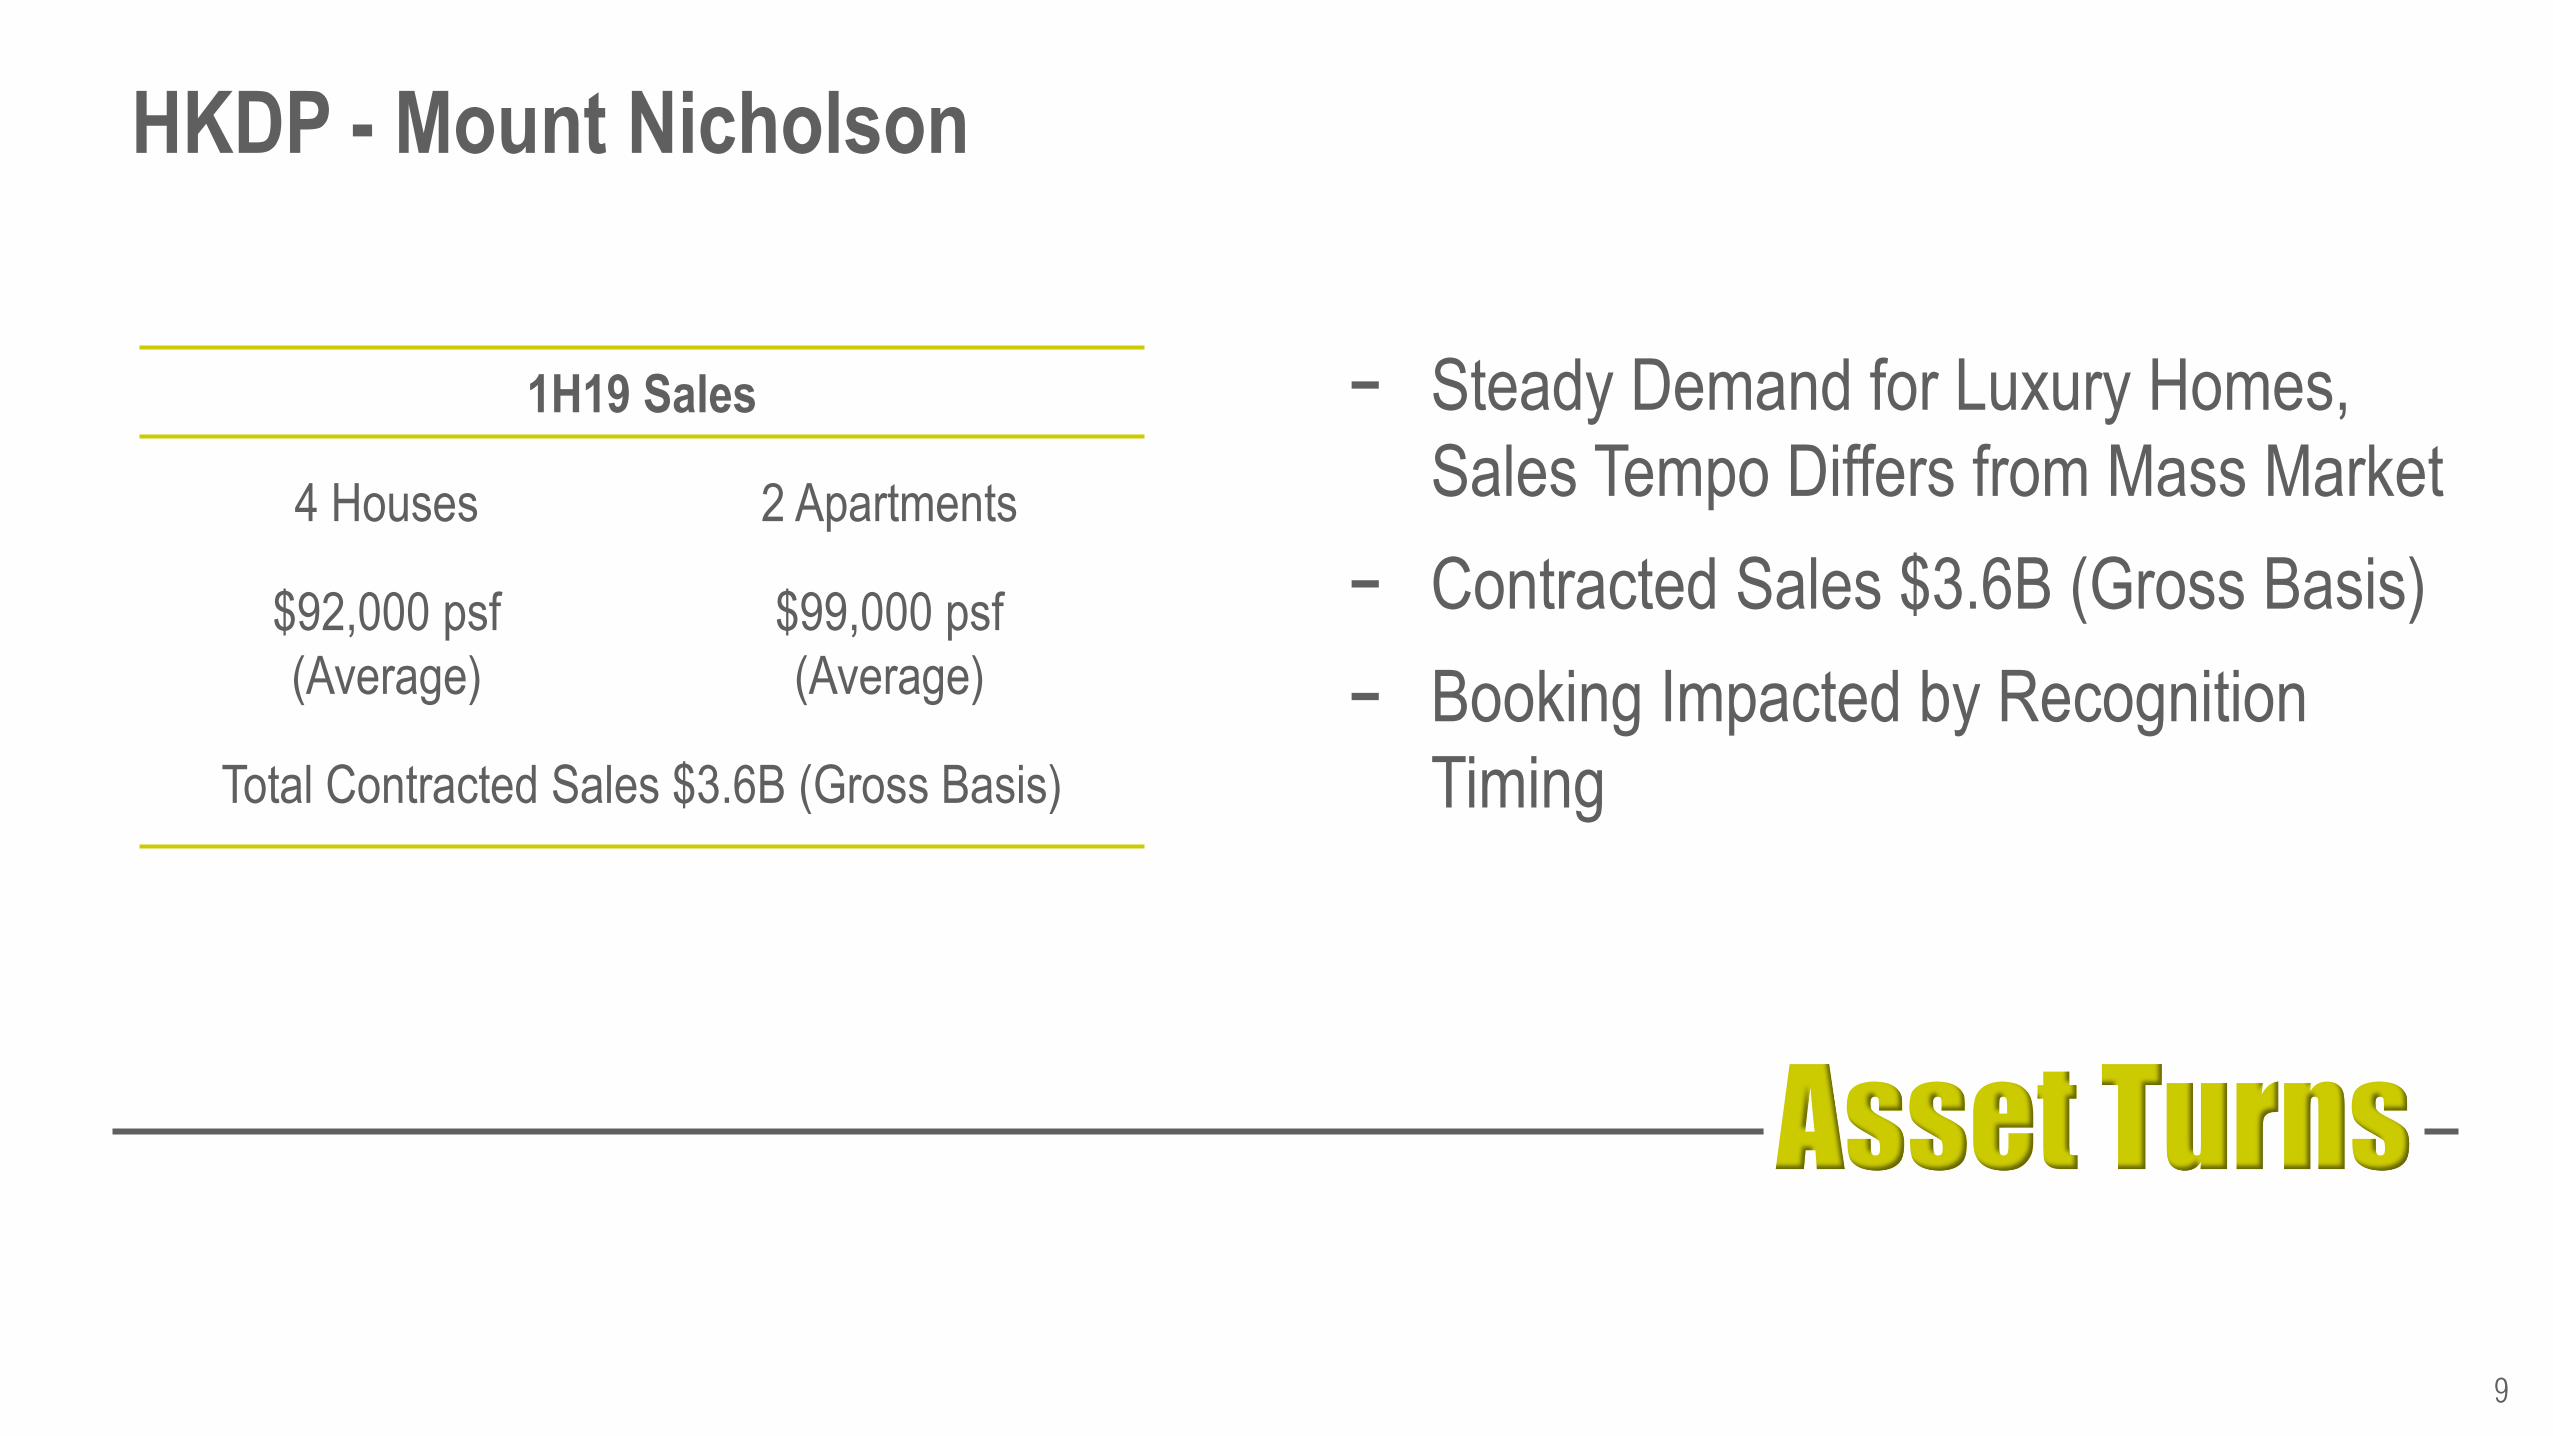
- Steady Demand for Luxury Homes,
Sales Tempo Differs from Mass Market
- Contracted Sales $3.6B (Gross Basis)
- Booking Impacted by Recognition
Timing
9
HKDP - Mount Nicholson
1H19 Sales
4 Houses 2 Apartments
$92,000 psf
(Average)
$99,000 psf
(Average)
Total Contracted Sales $3.6B (Gross Basis)
Asset Turns
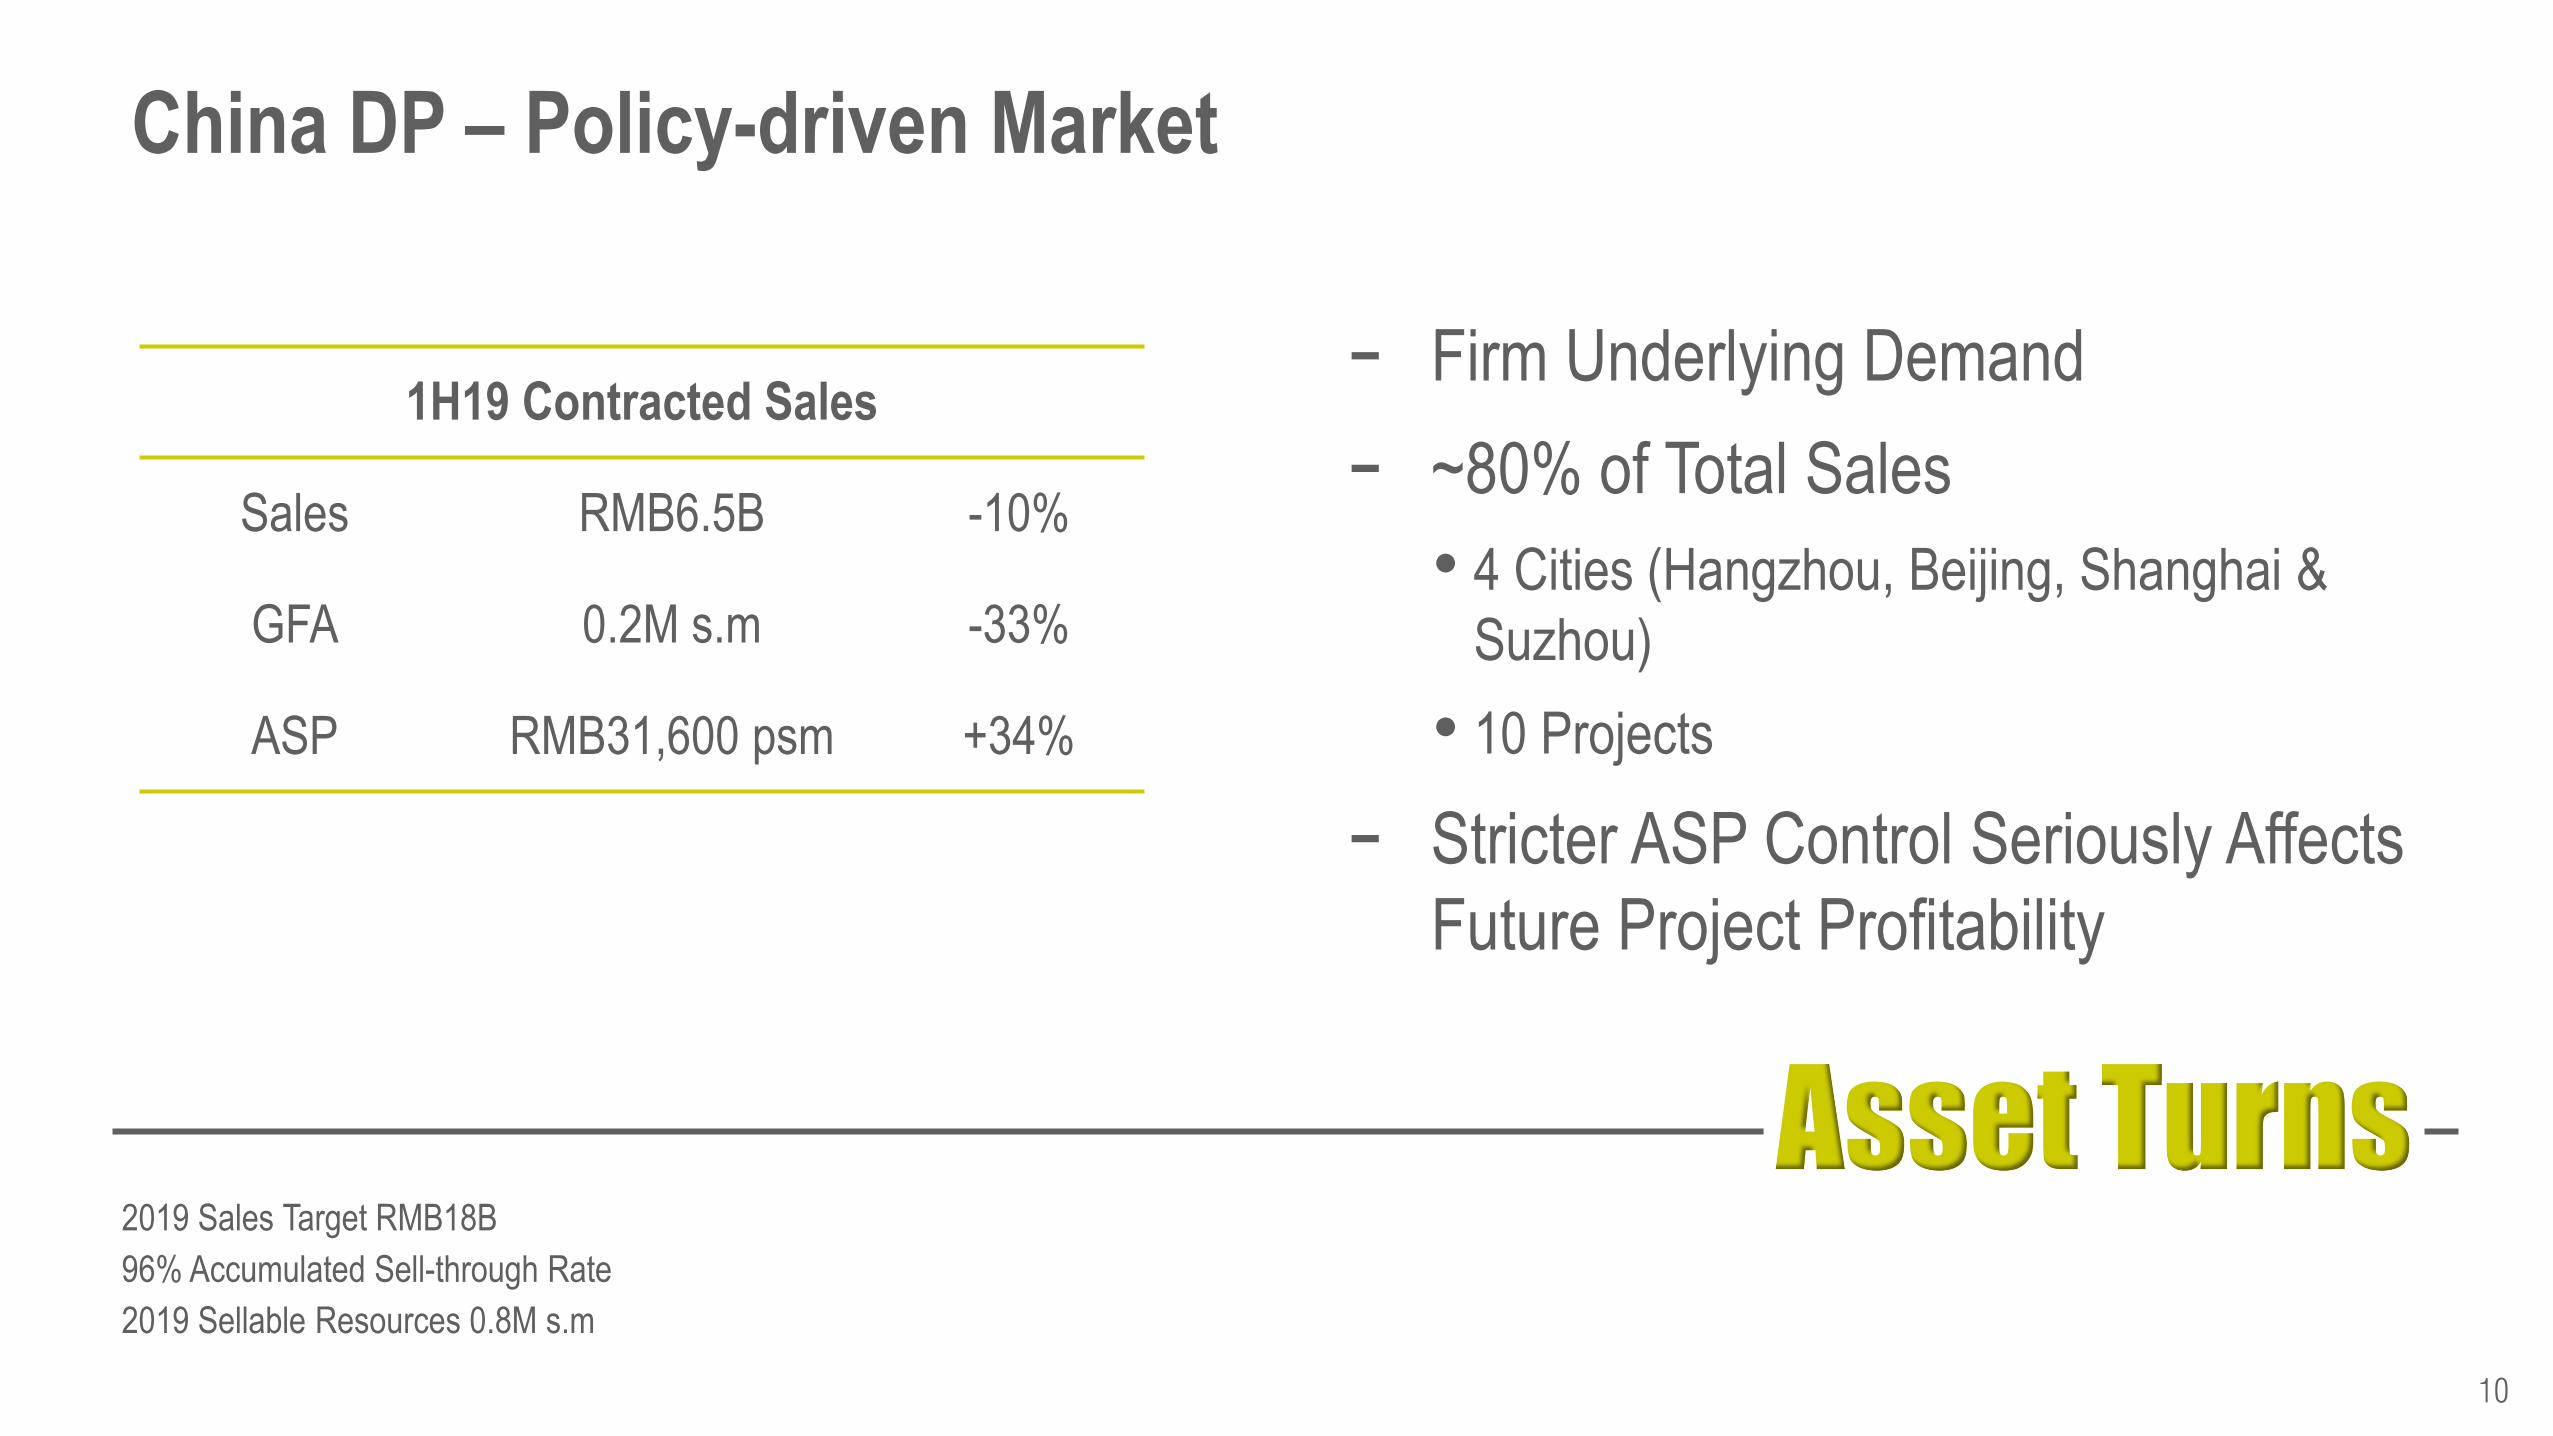
- Firm Underlying Demand
- ~80% of Total Sales
• 4 Cities (Hangzhou, Beijing, Shanghai &
Suzhou)
• 10 Projects
- Stricter ASP Control Seriously Affects
Future Project Profitability
10
China DP – Policy-driven Market
1H19 Contracted Sales
Sales RMB6.5B -10%
GFA 0.2M s.m -33%
ASP RMB31,600 psm +34%
2019 Sales Target RMB18B
96% Accumulated Sell-through Rate
2019 Sellable Resources 0.8M s.m
Asset Turns
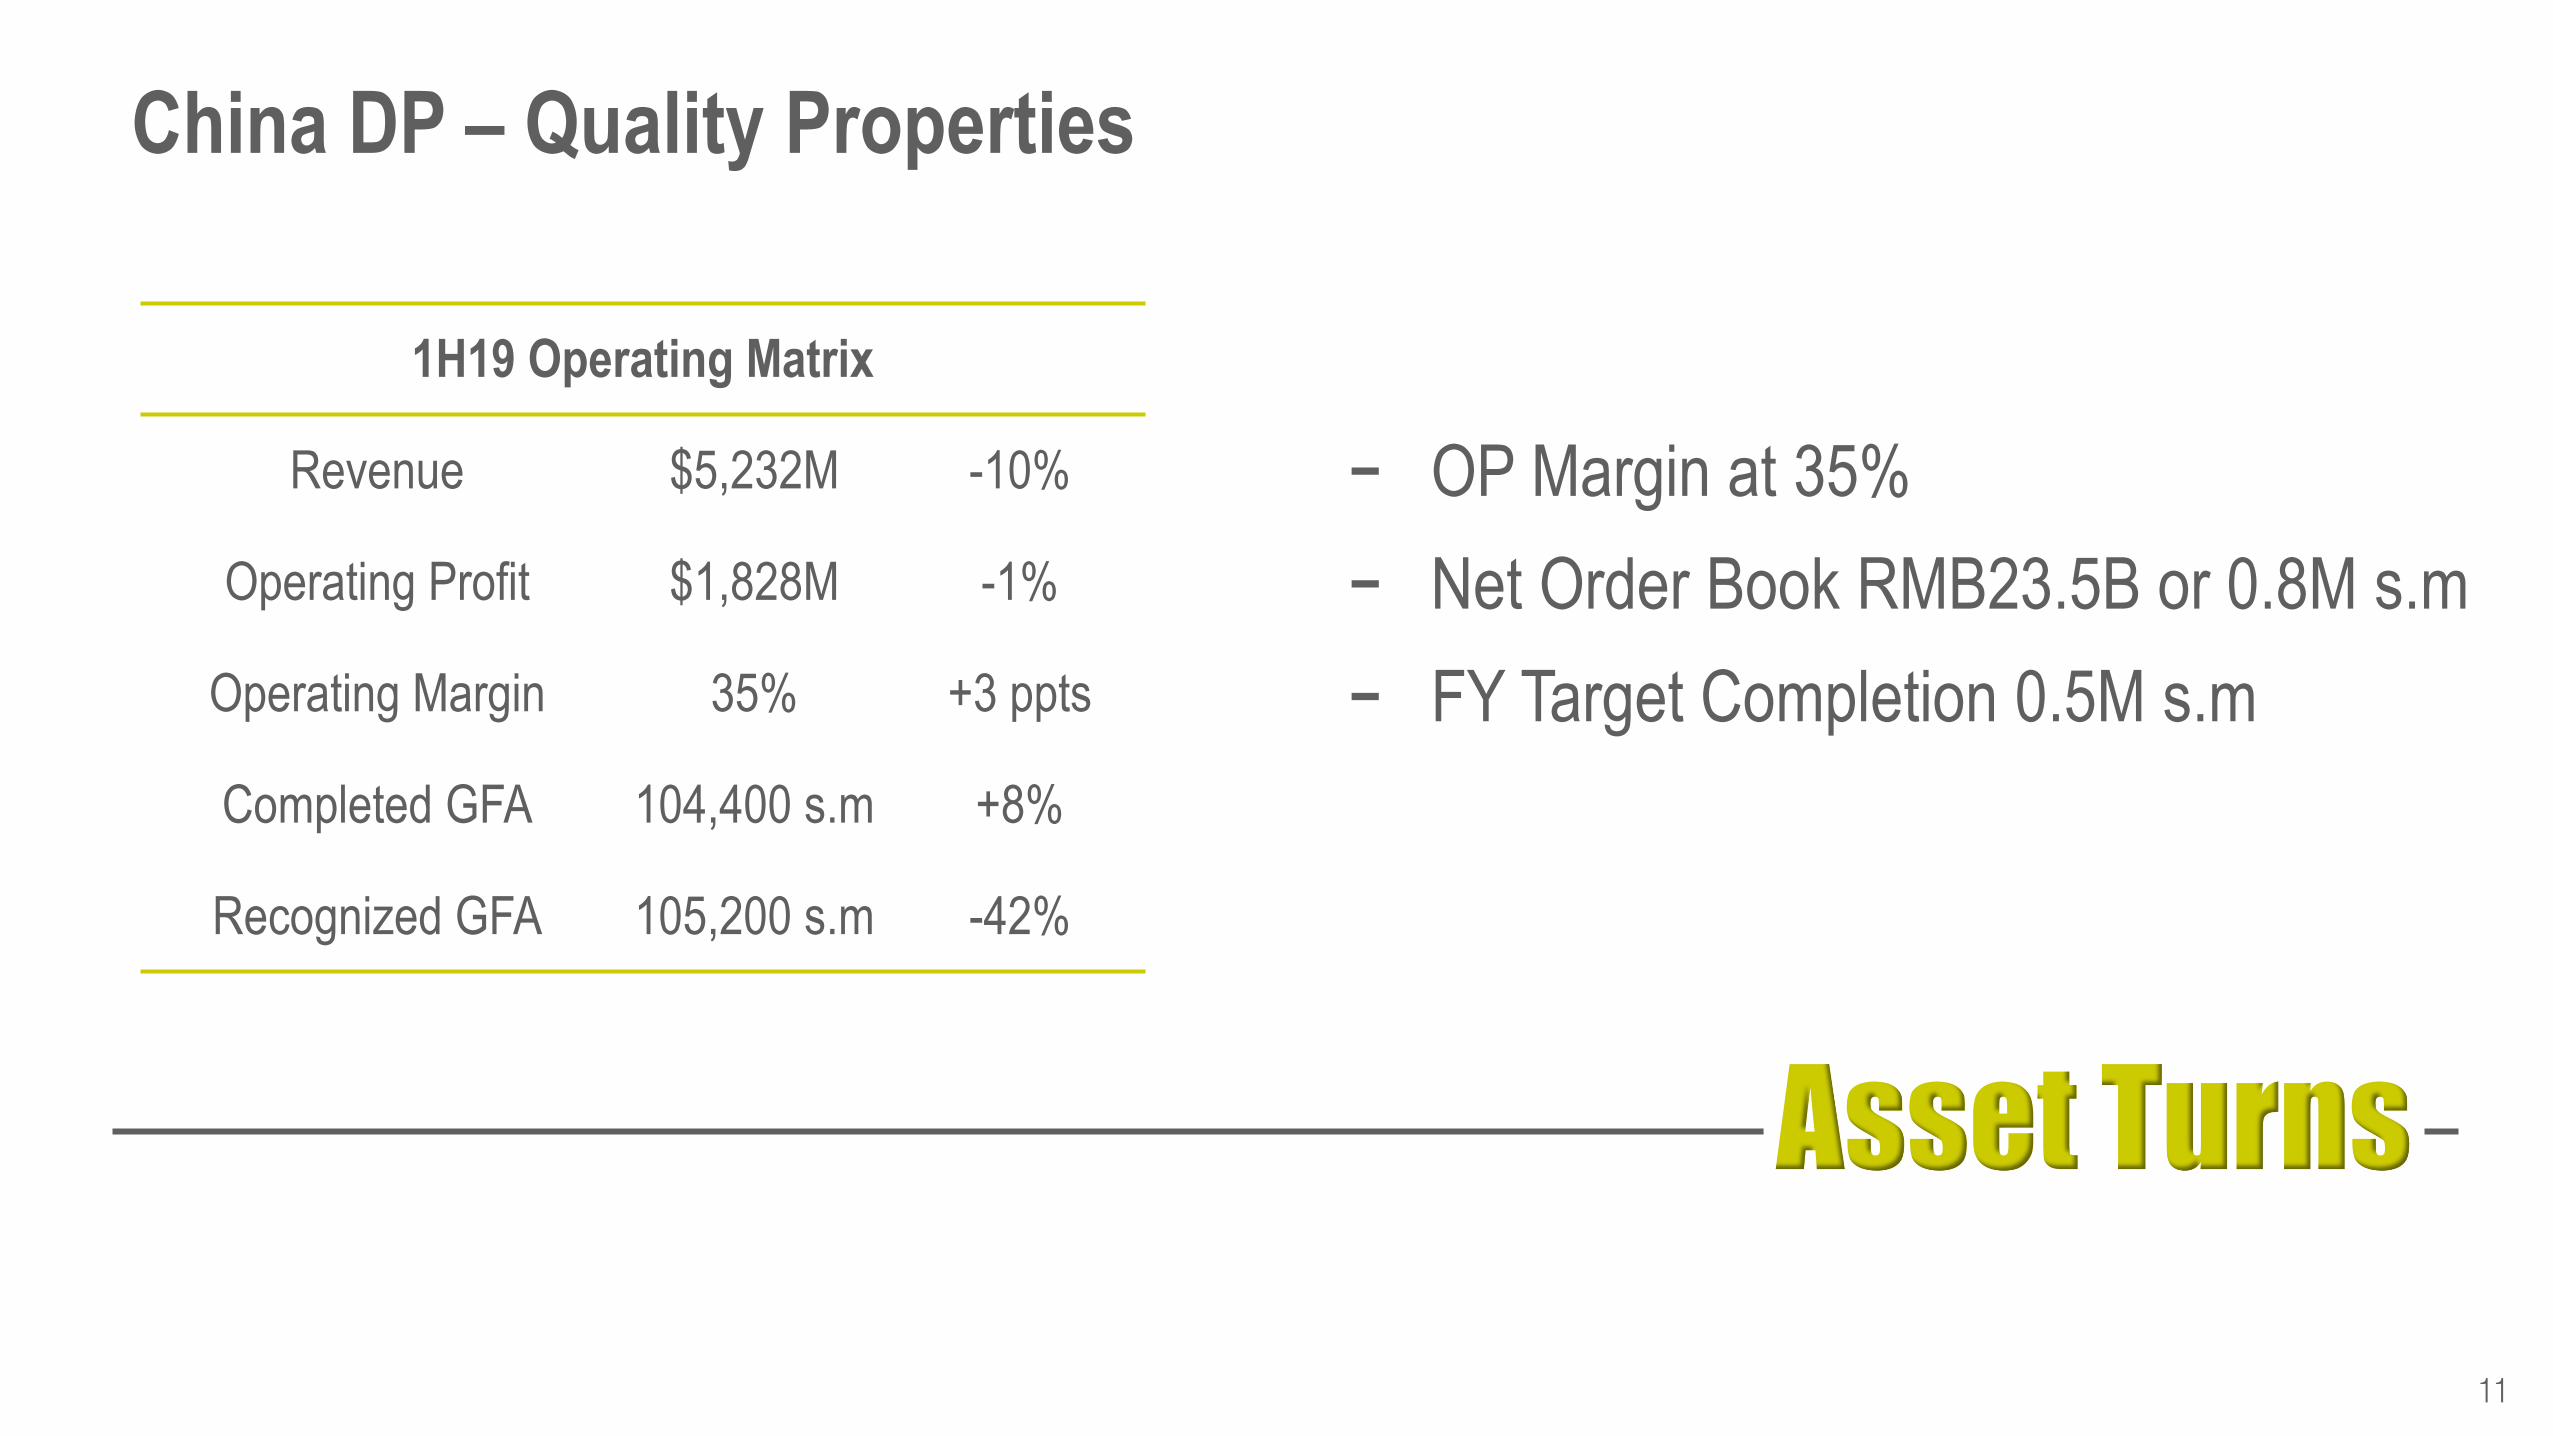
- OP Margin at 35%
- Net Order Book RMB23.5B or 0.8M s.m
- FY Target Completion 0.5M s.m
11
China DP – Quality Properties
1H19 Operating Matrix
Revenue $5,232M -10%
Operating Profit $1,828M -1%
Operating Margin 35% +3 ppts
Completed GFA 104,400 s.m +8%
Recognized GFA 105,200 s.m -42%
Asset Turns
Recurring Income
Services
Financial Management
12
Recurring Income
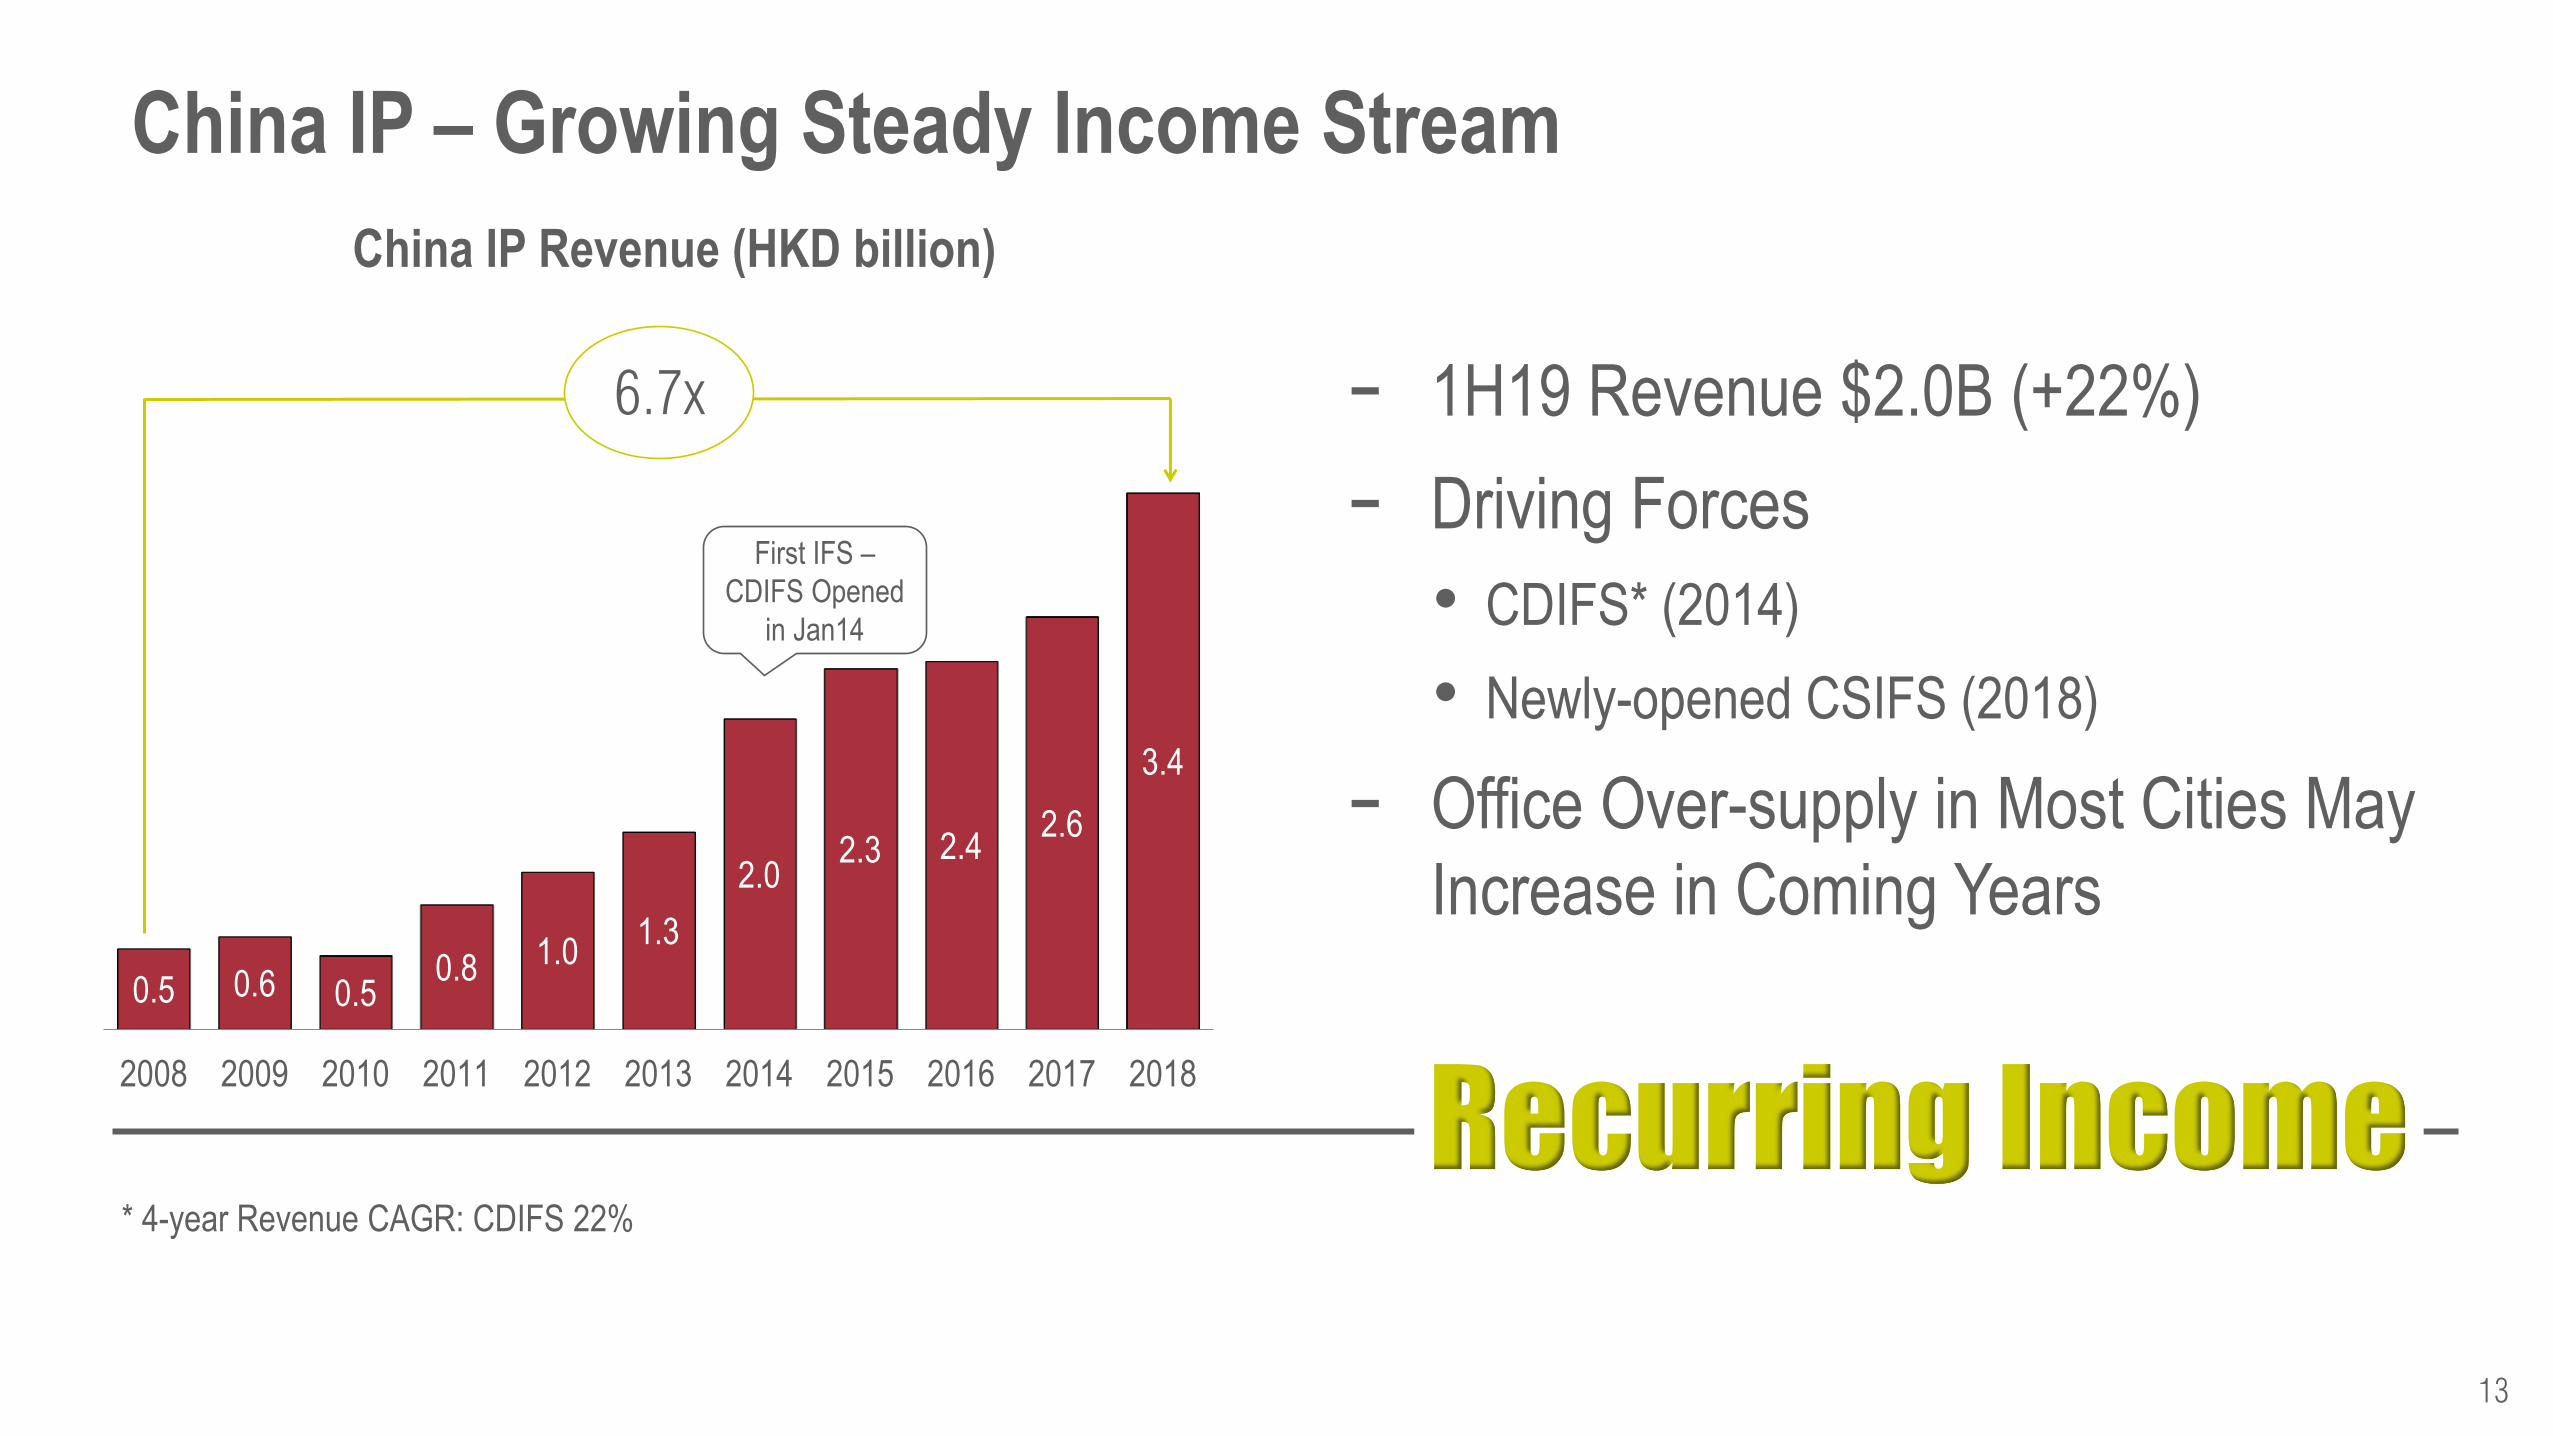
- 1H19 Revenue $2.0B (+22%)
- Driving Forces
• CDIFS* (2014)
• Newly-opened CSIFS (2018)
- Office Over-supply in Most Cities May
Increase in Coming Years
13
China IP – Growing Steady Income Stream
0.5 0.6 0.5 0.8 1.0
1.3
2.0 2.3 2.4
2.6
3.4
2008 2009 2010 2011 2012 2013 2014 2015 2016 2017 2018
China IP Revenue (HKD billion)
First IFS –
CDIFS Opened
in Jan14
6.7x
* 4-year Revenue CAGR: CDIFS 22%
Recurring Income
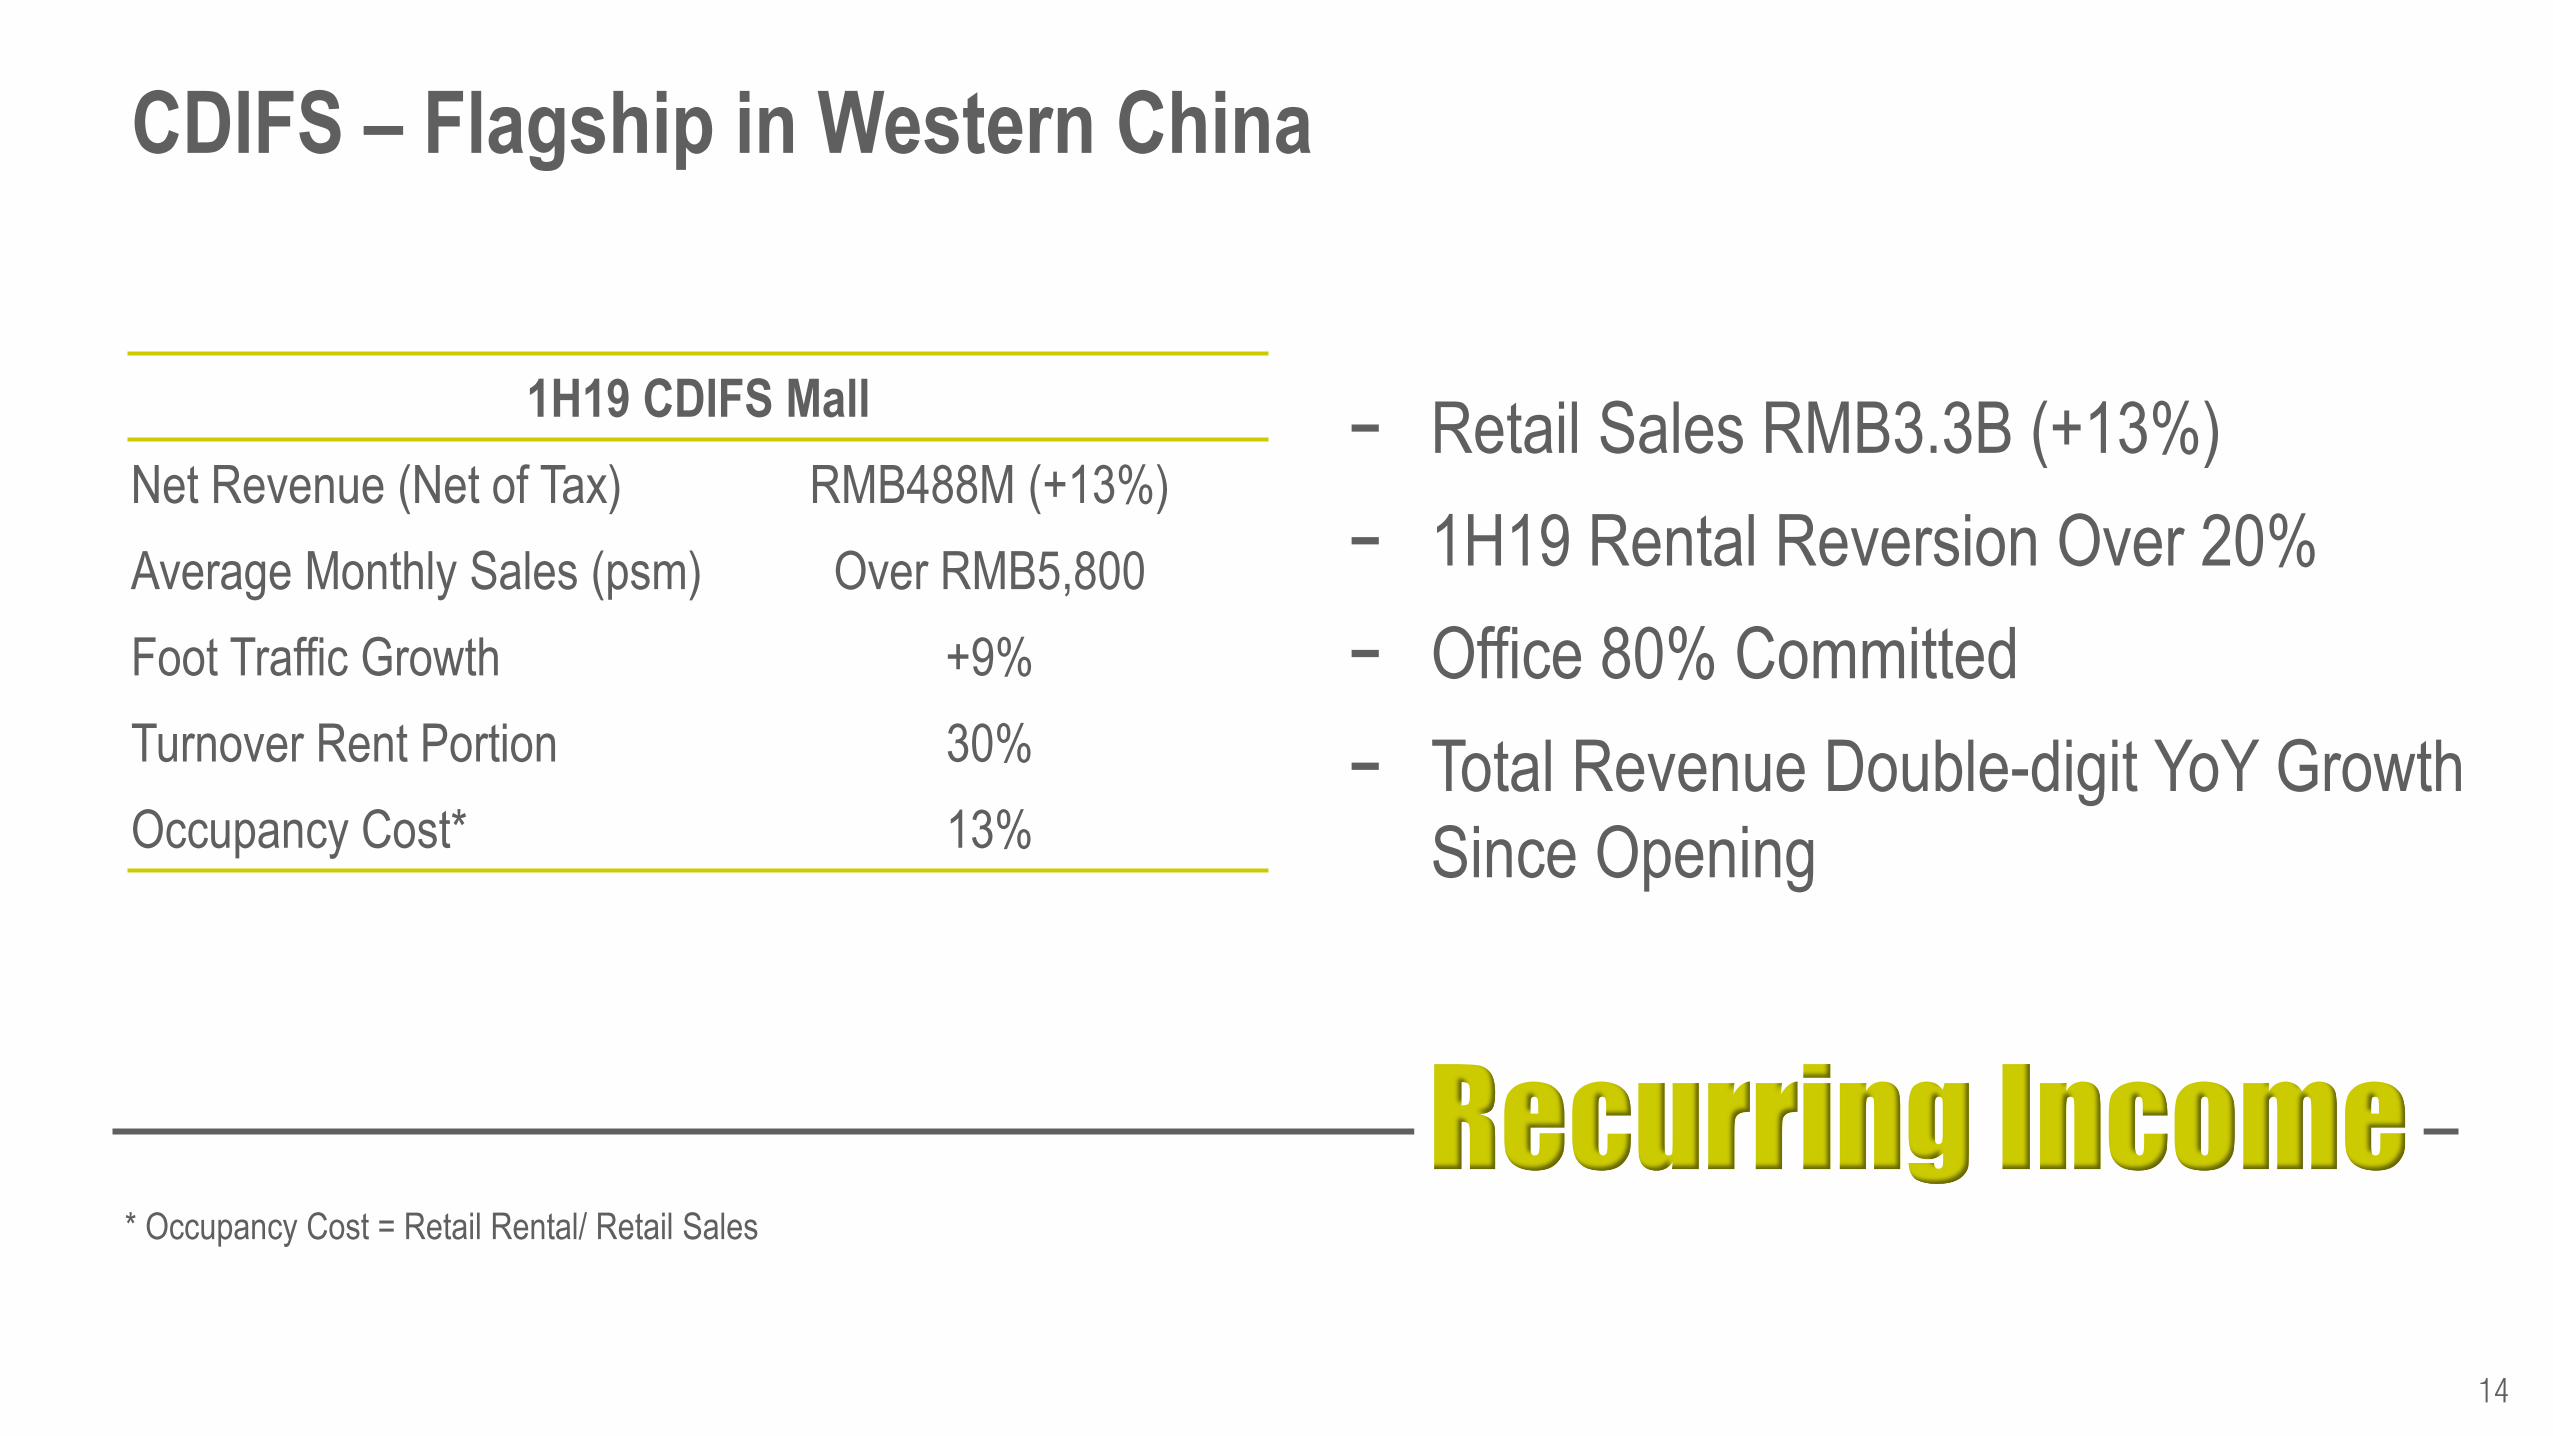
- Retail Sales RMB3.3B (+13%)
- 1H19 Rental Reversion Over 20%
- Office 80% Committed
- Total Revenue Double-digit YoY Growth
Since Opening
14
CDIFS – Flagship in Western China
1H19 CDIFS Mall
Net Revenue (Net of Tax) RMB488M (+13%)
Average Monthly Sales (psm) Over RMB5,800
Foot Traffic Growth +9%
Turnover Rent Portion 30%
Occupancy Cost* 13%
* Occupancy Cost = Retail Rental/ Retail Sales
Recurring Income
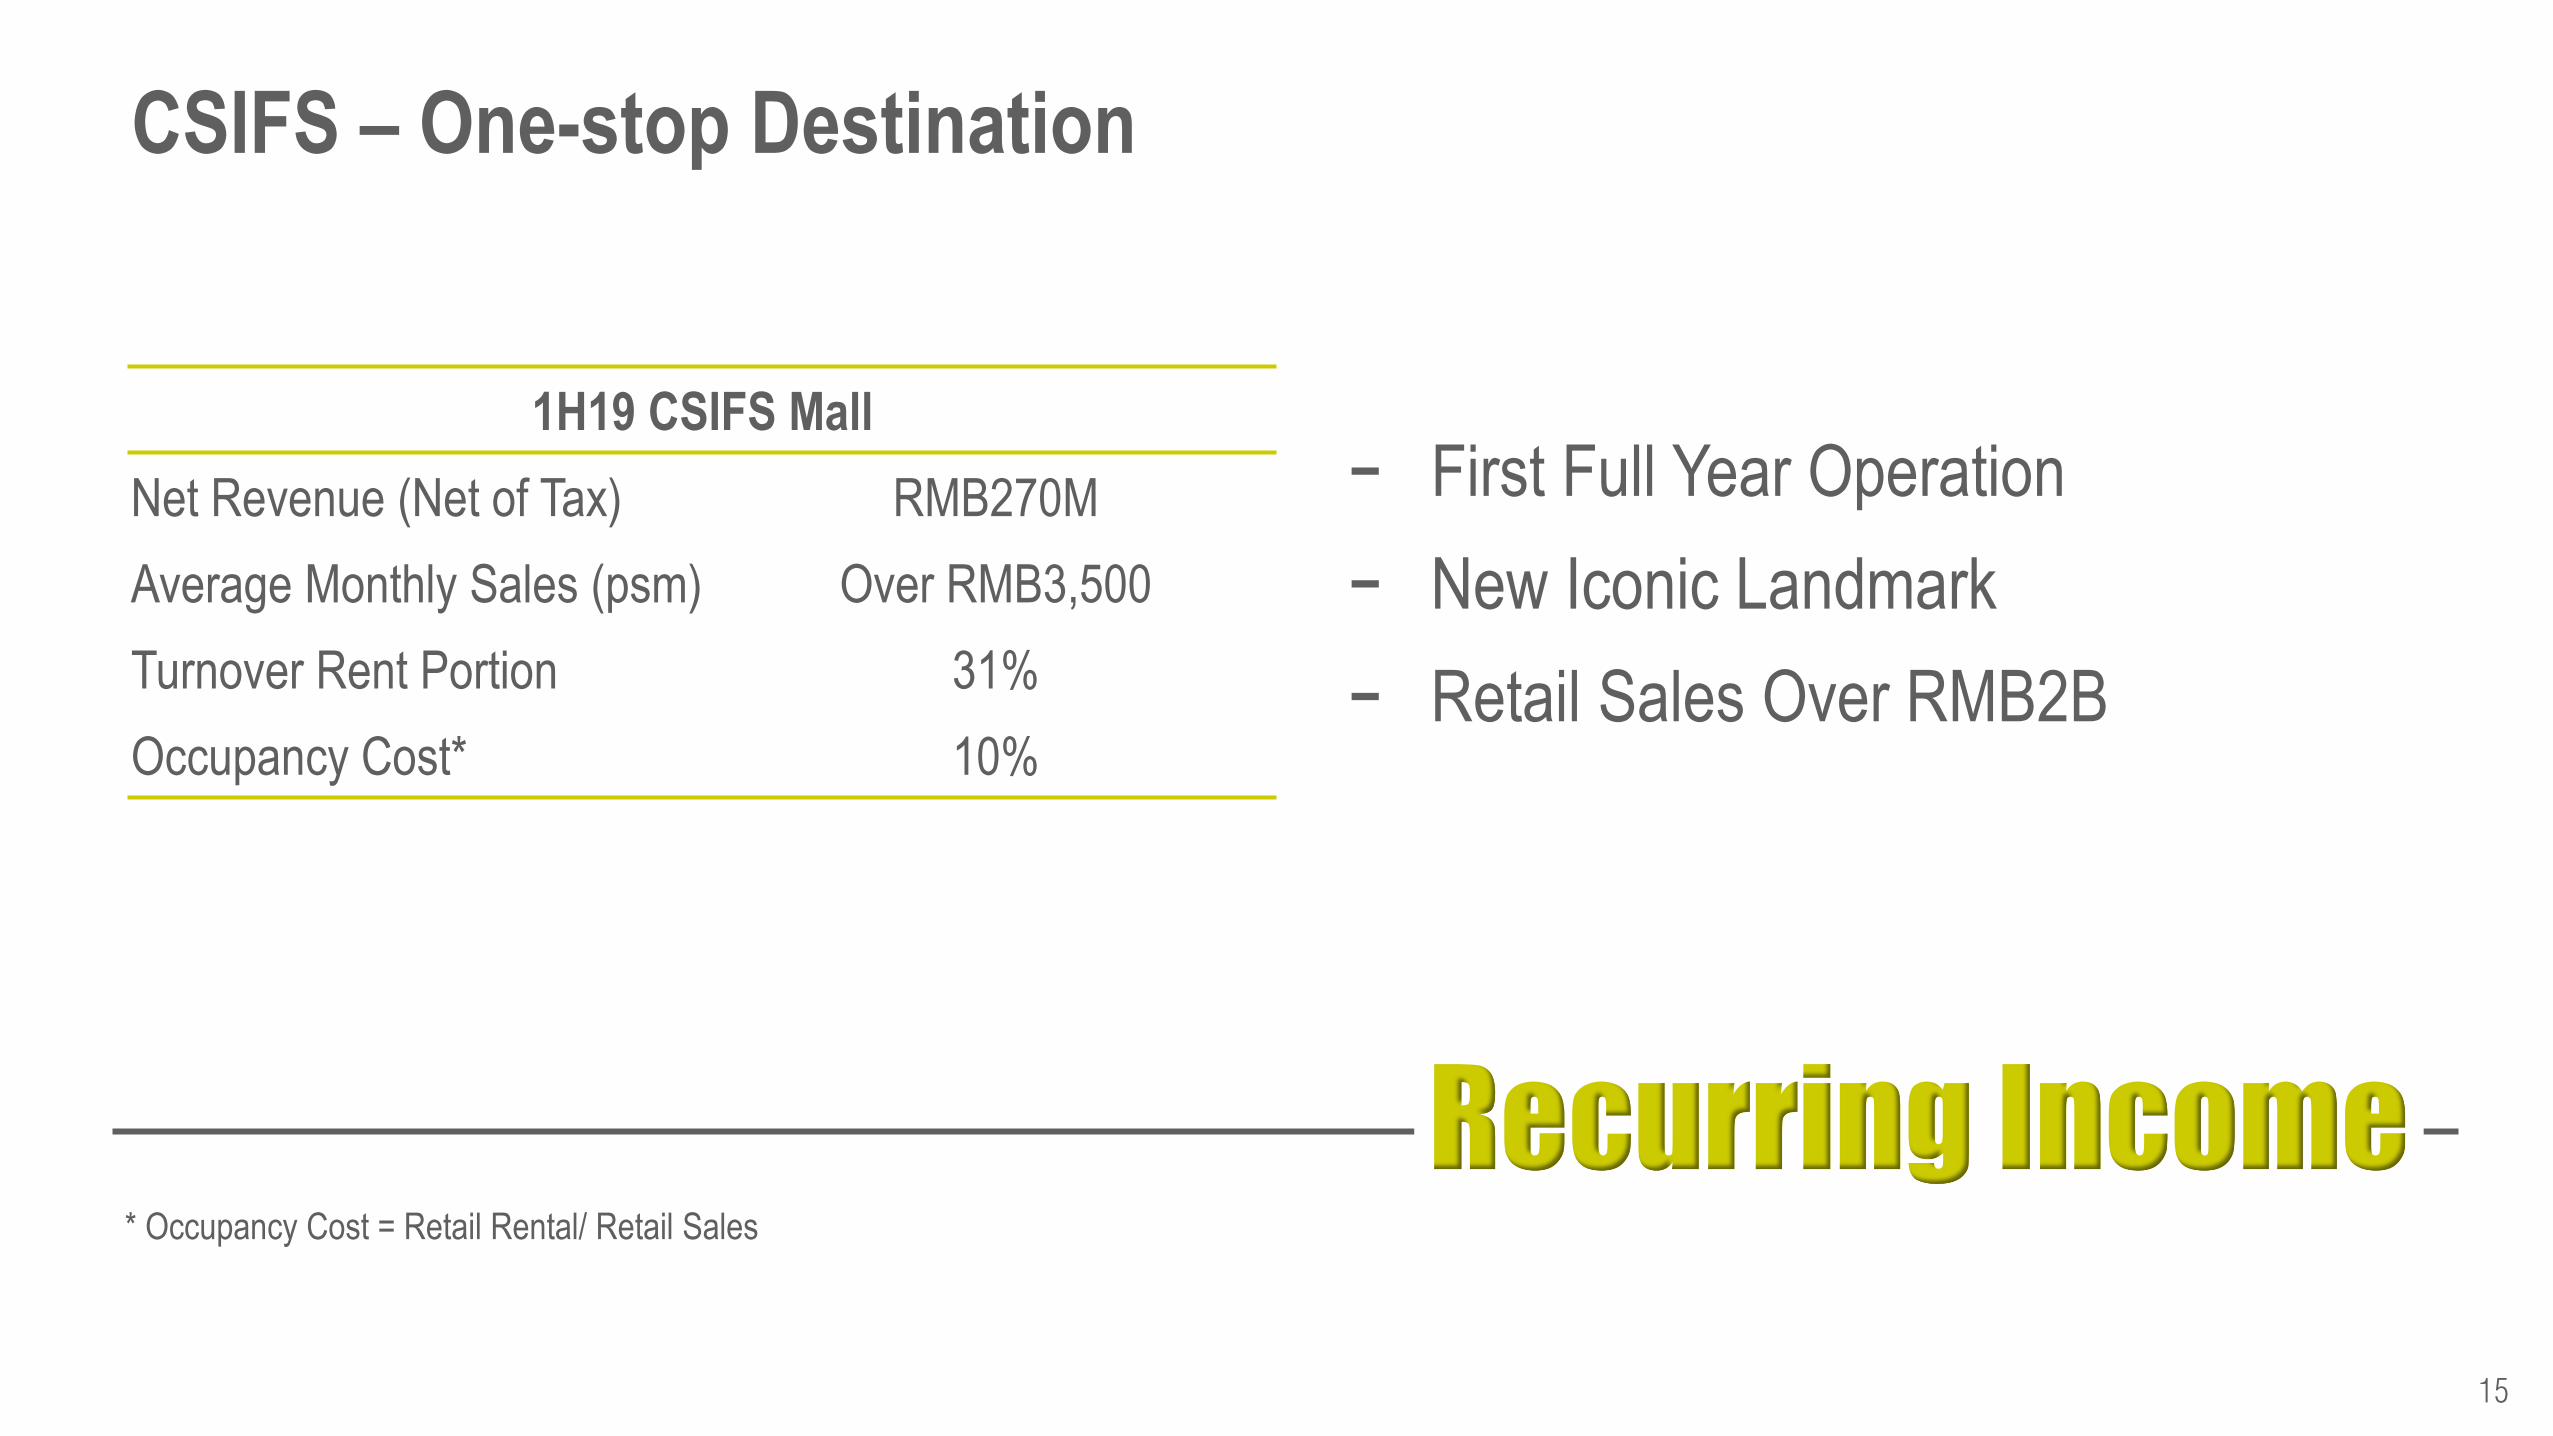
- First Full Year Operation
- New Iconic Landmark
- Retail Sales Over RMB2B
15
CSIFS – One-stop Destination
1H19 CSIFS Mall
Net Revenue (Net of Tax) RMB270M
Average Monthly Sales (psm) Over RMB3,500
Turnover Rent Portion 31%
Occupancy Cost* 10%
* Occupancy Cost = Retail Rental/ Retail Sales
Recurring Income
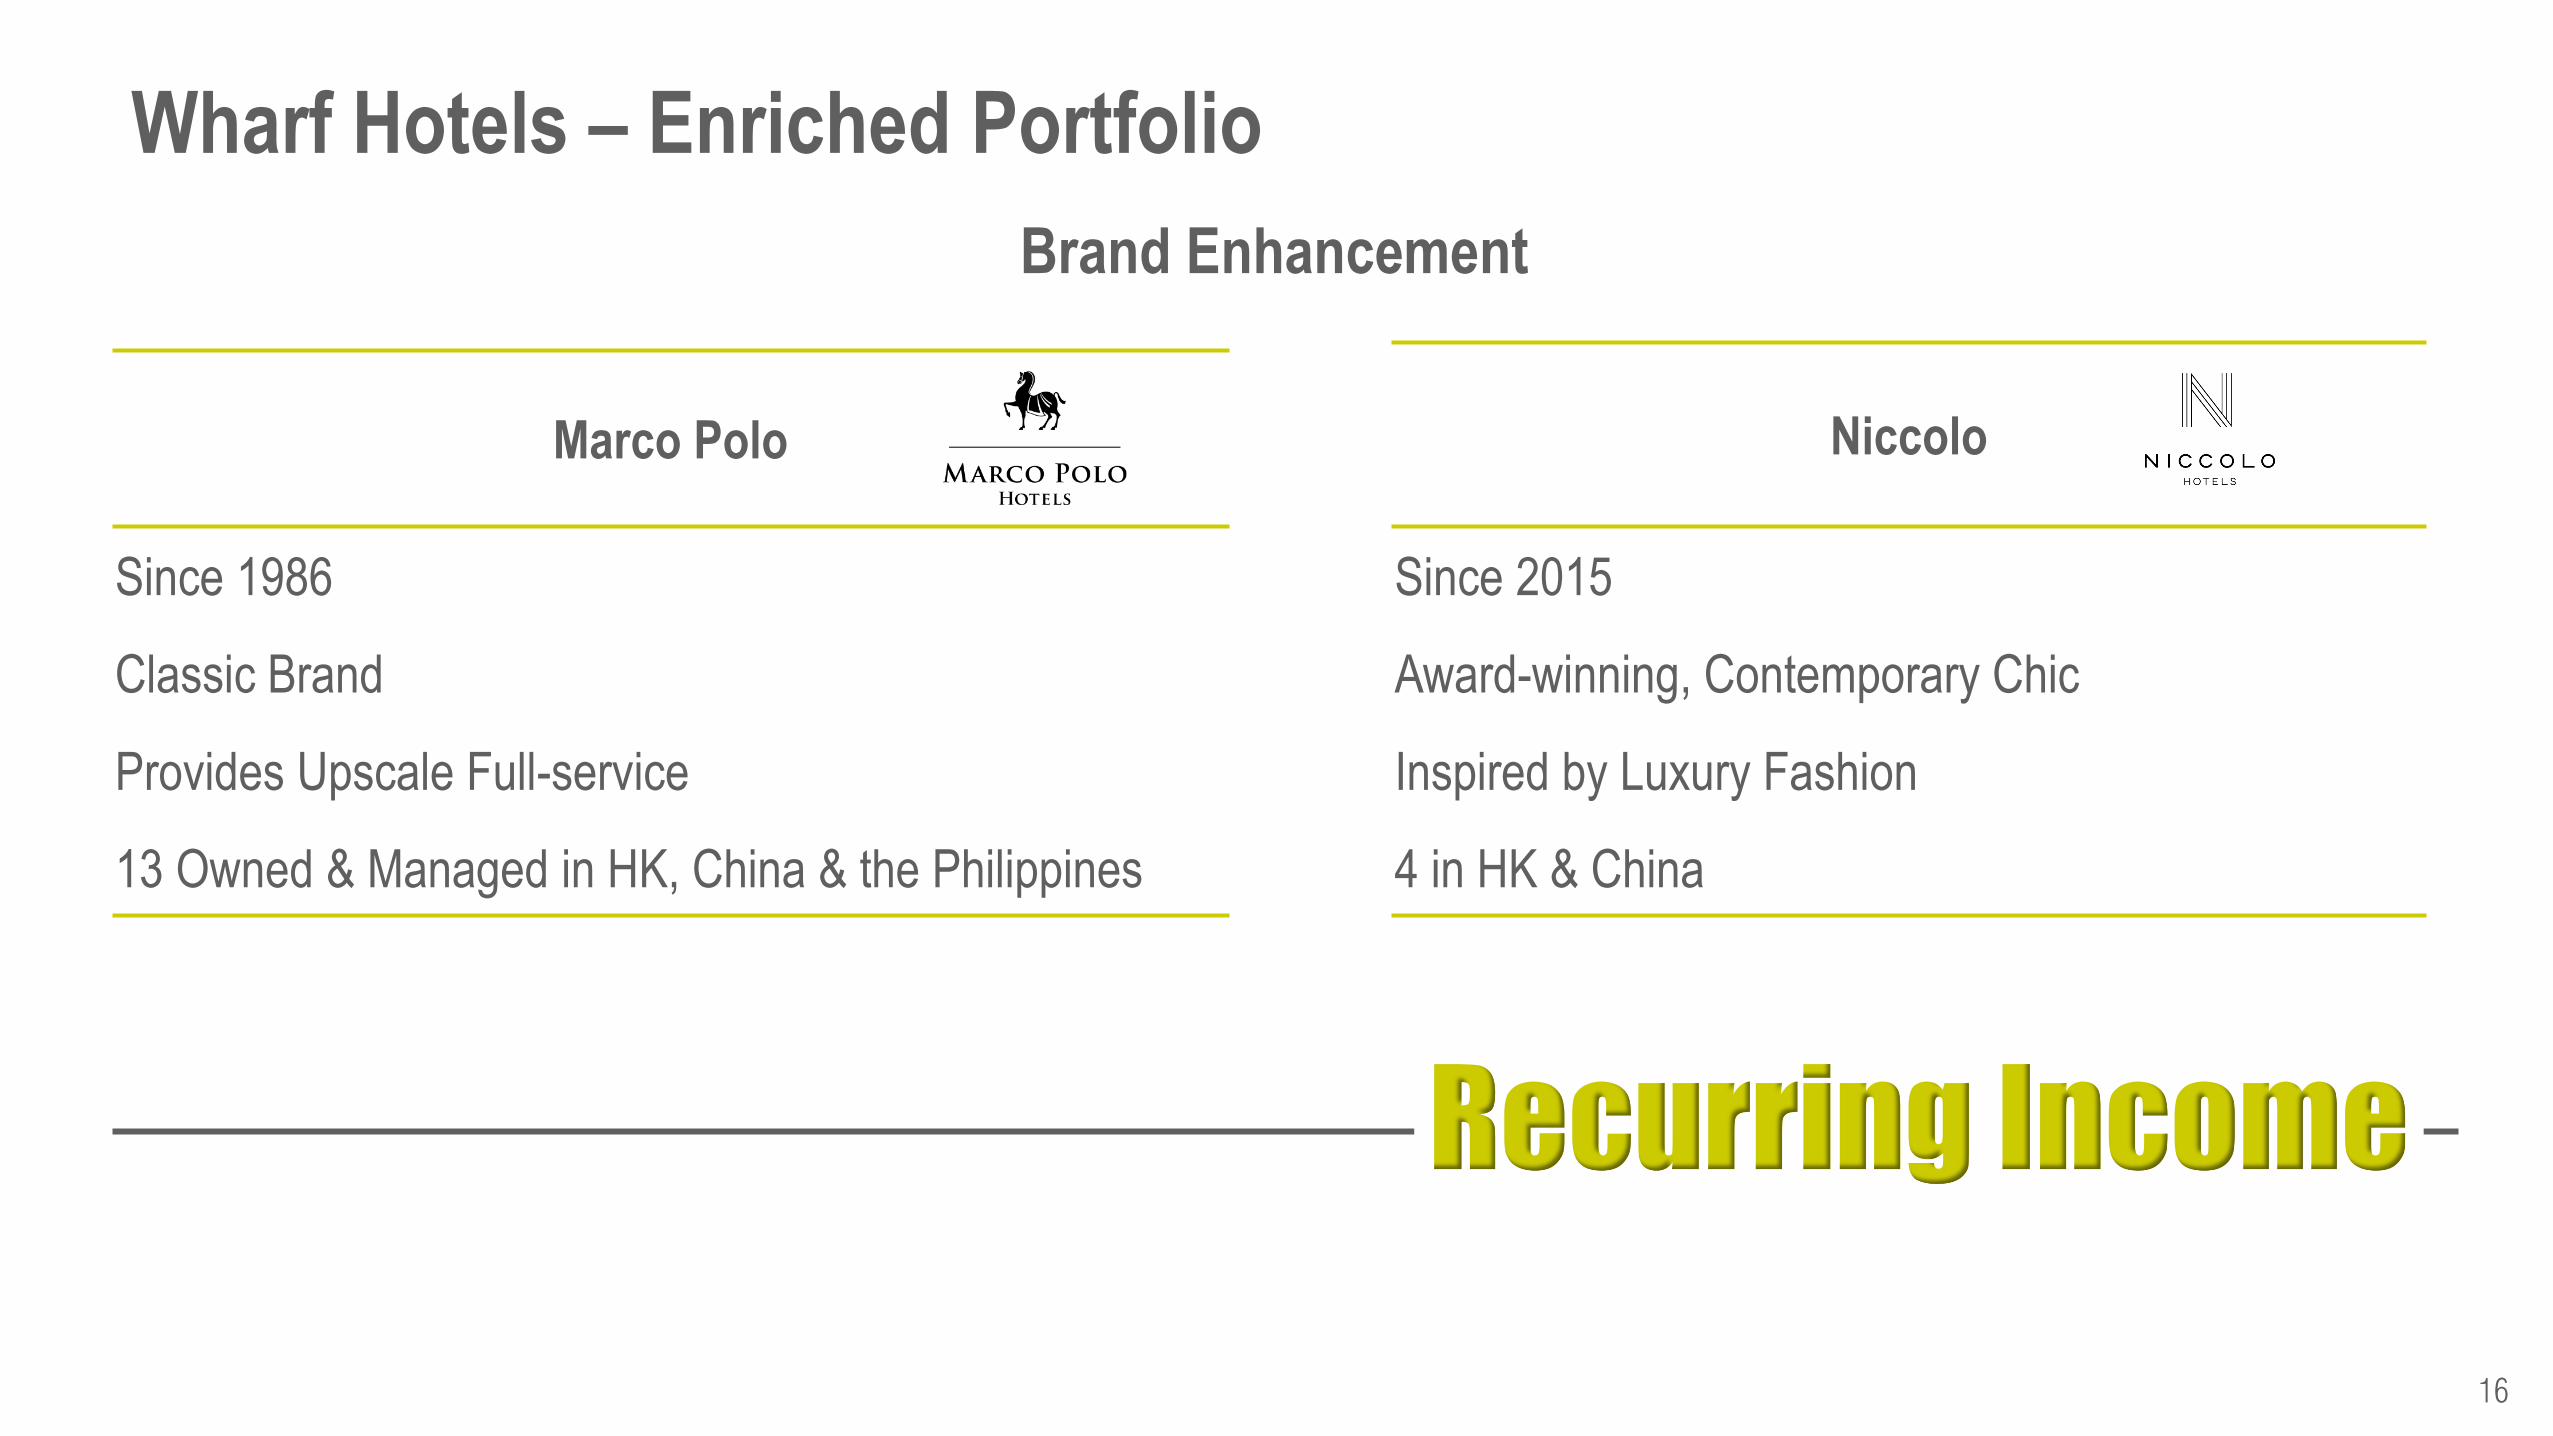
Marco Polo
Since 1986
Classic Brand
Provides Upscale Full-service
13 Owned & Managed in HK, China & the Philippines
16
Wharf Hotels – Enriched Portfolio
Niccolo
Since 2015
Award-winning, Contemporary Chic
Inspired by Luxury Fashion
4 in HK & China
Brand Enhancement
Recurring Income
17
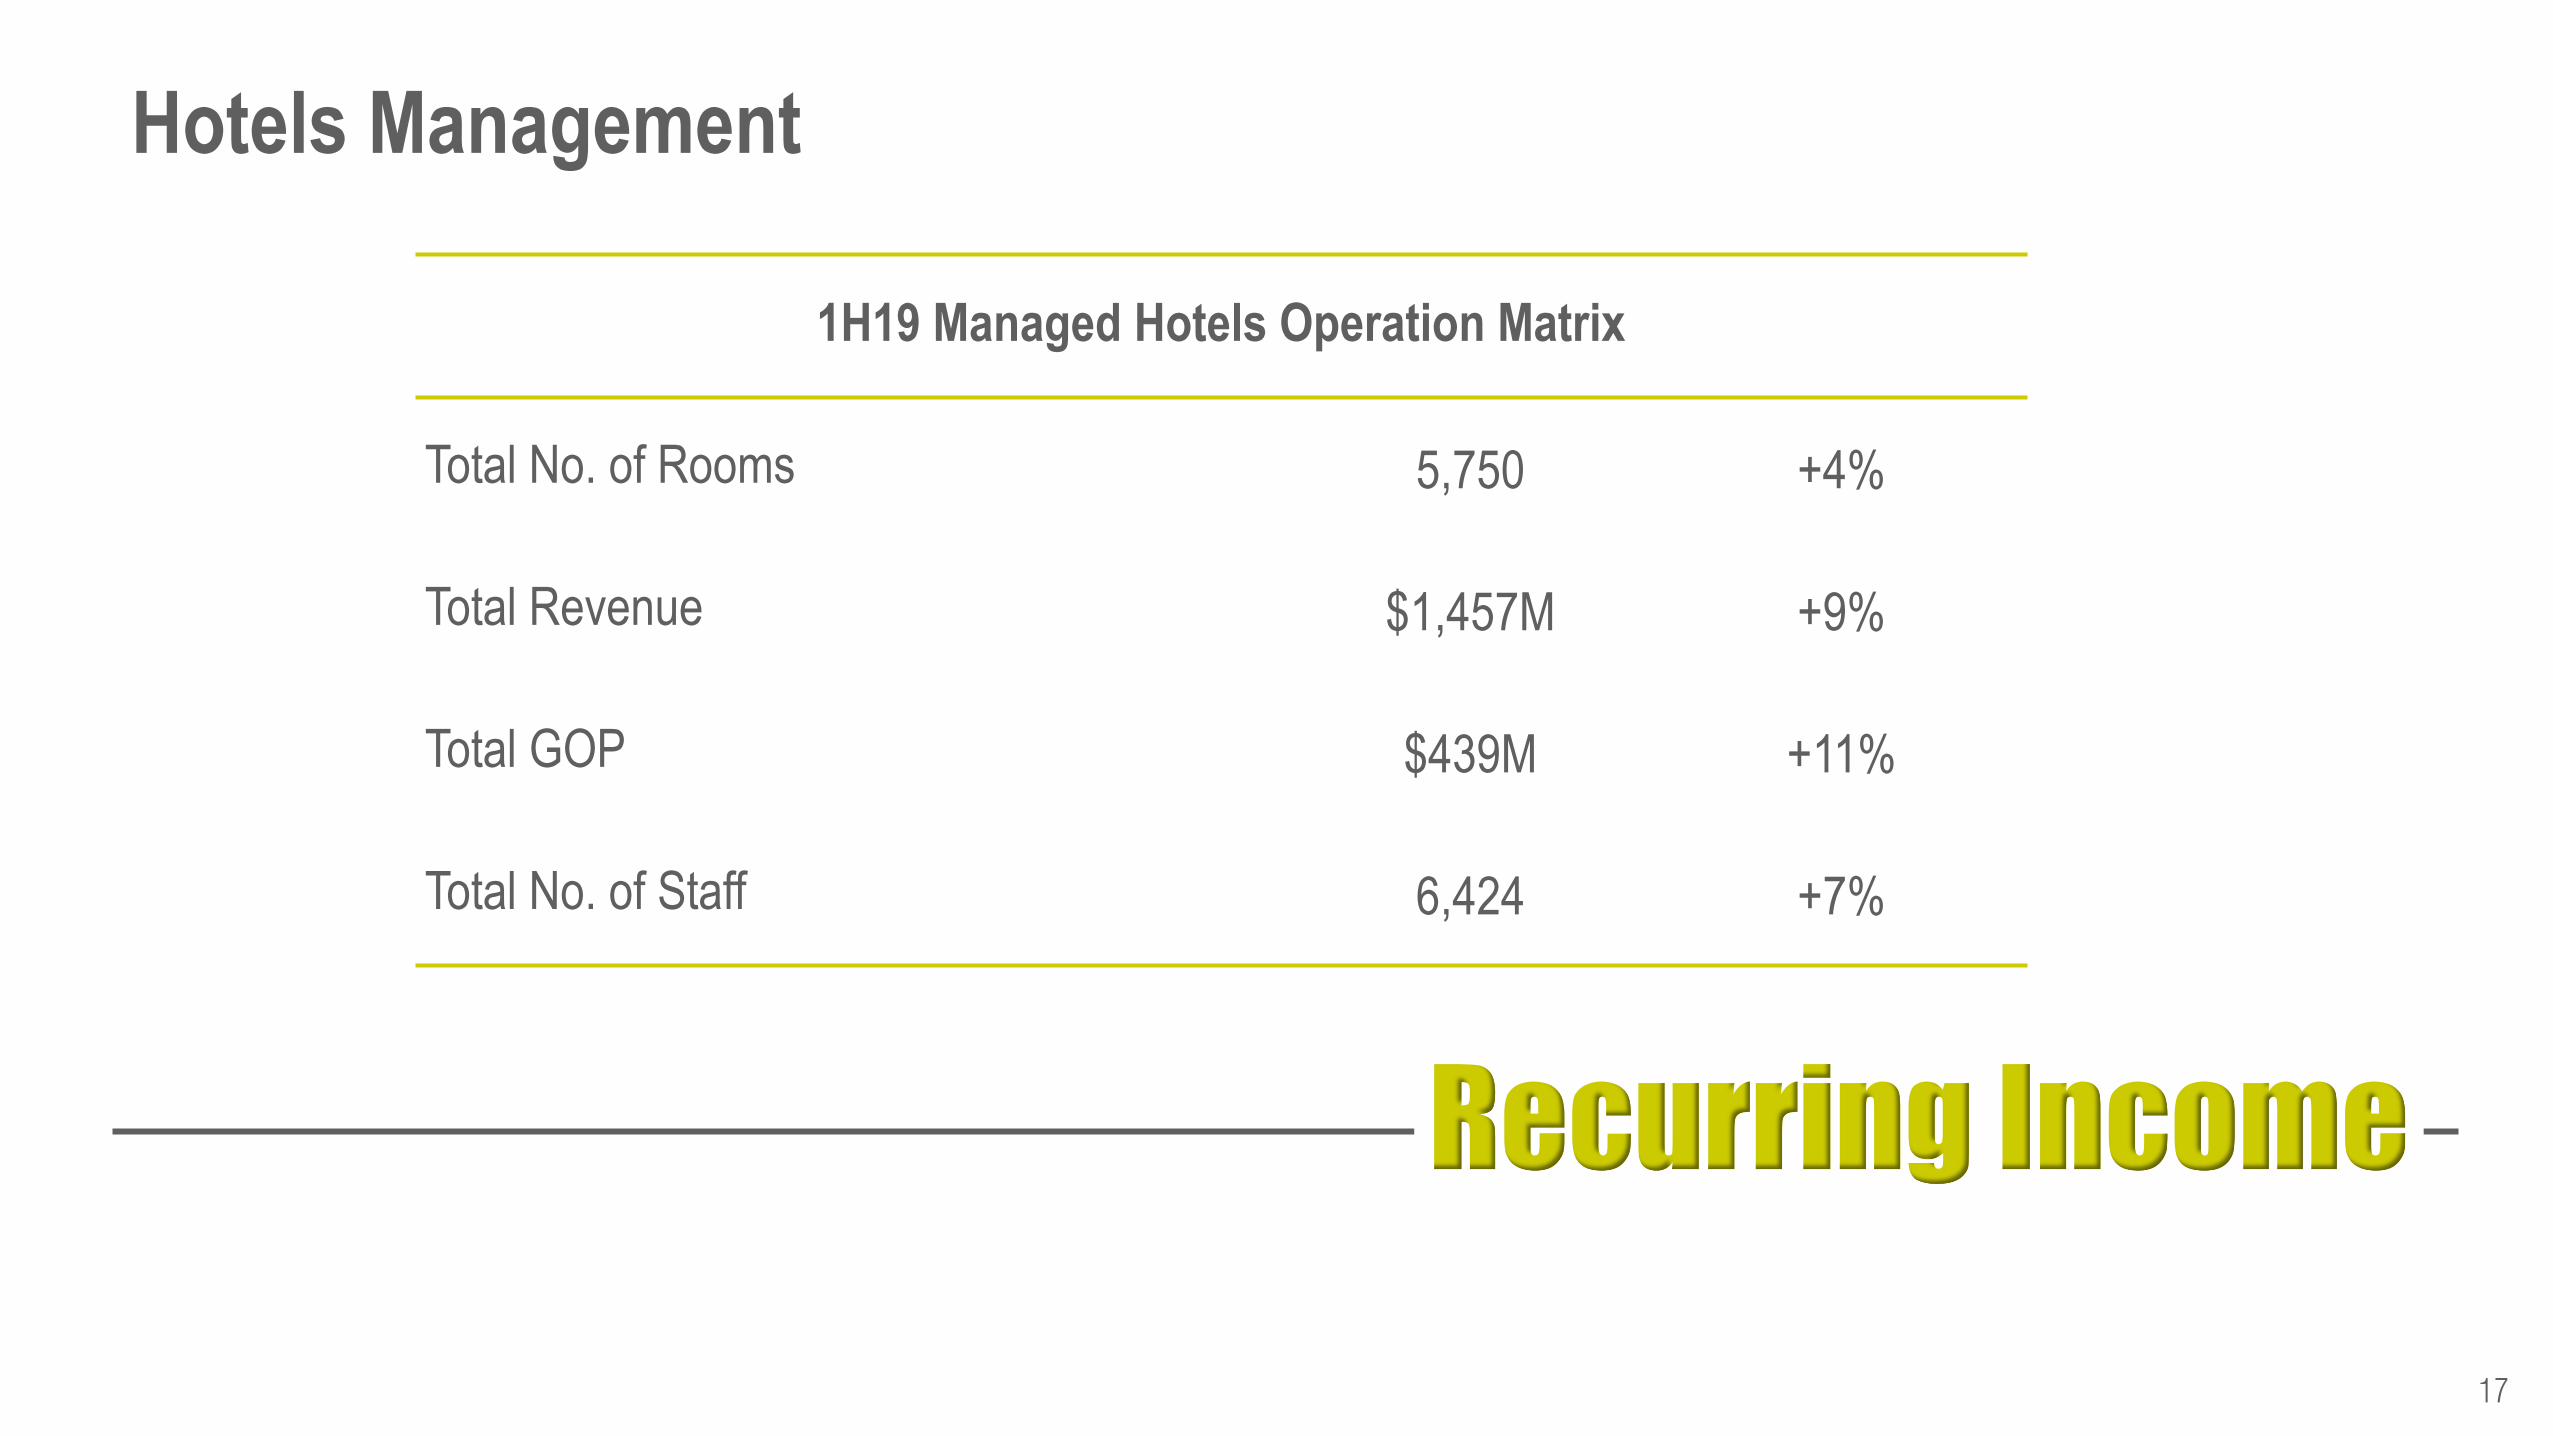
Hotels Management
1H19 Managed Hotels Operation Matrix
Total No. of Rooms 5,750 +4%
Total Revenue $1,457M +9%
Total GOP $439M +11%
Total No. of Staff 6,424 +7%
Recurring Income
18
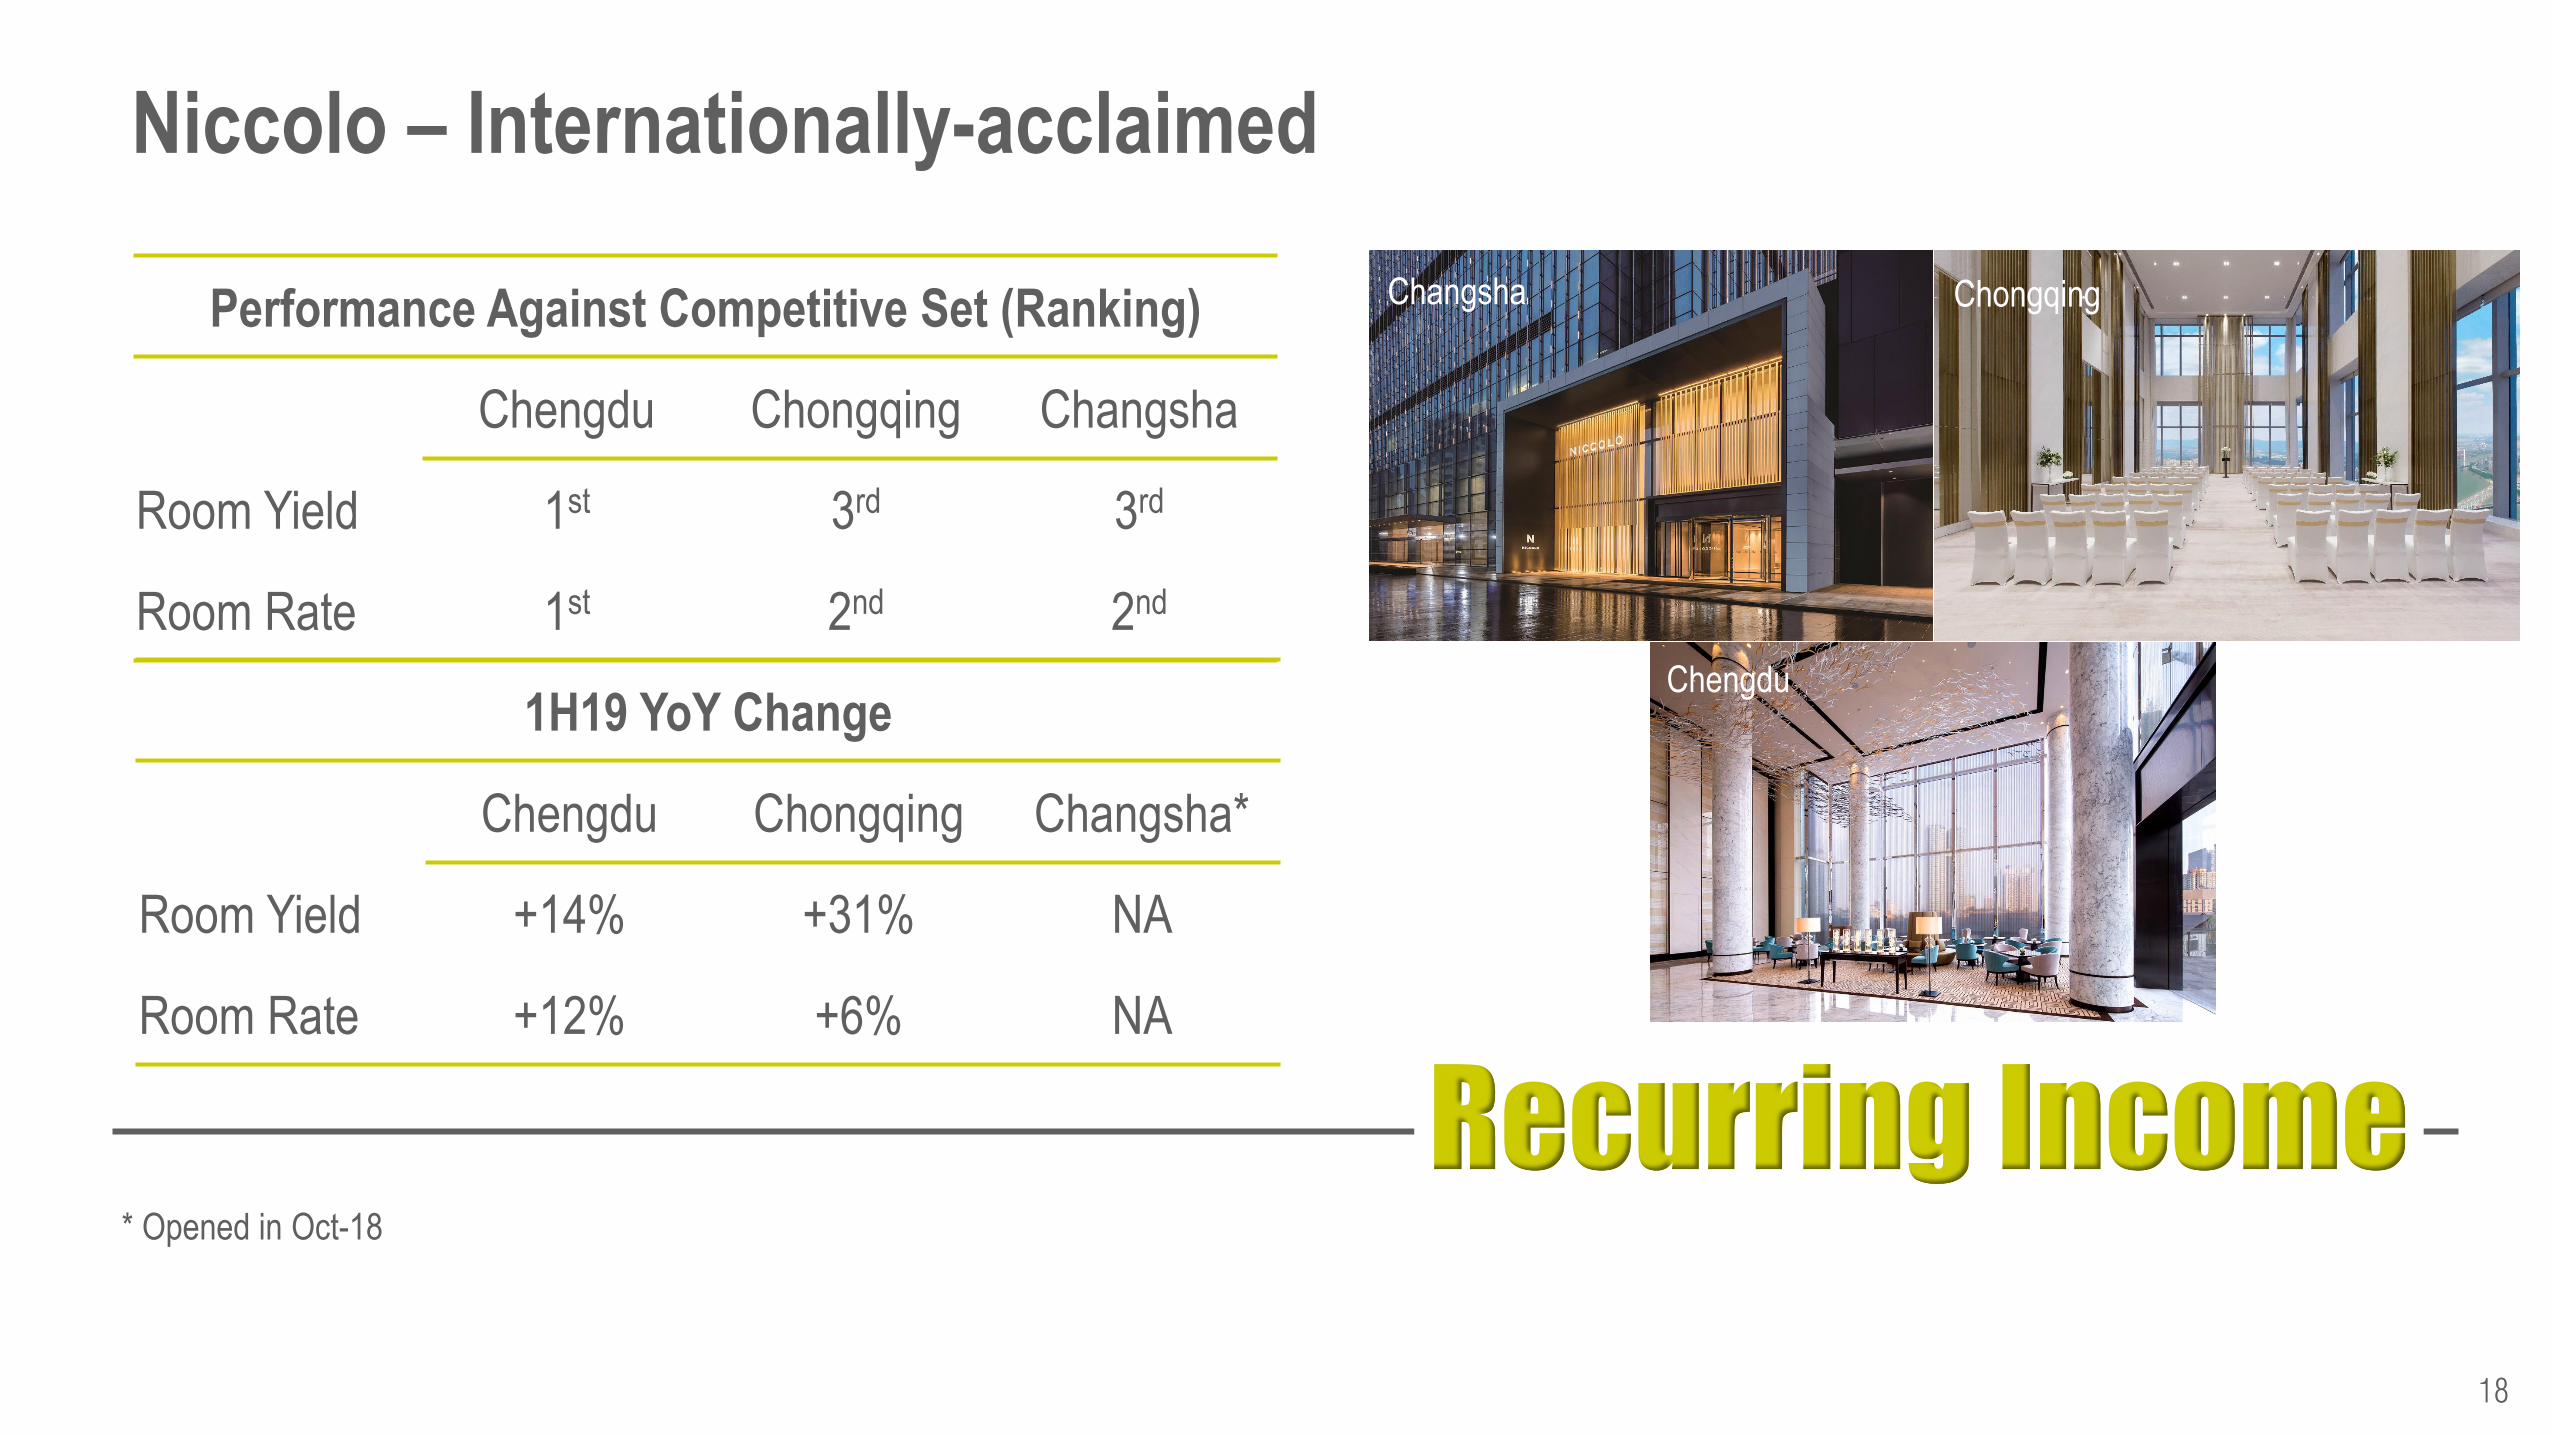
Niccolo – Internationally-acclaimed
Performance Against Competitive Set (Ranking)
Chengdu Chongqing Changsha
Room Yield 1st 3rd 3rd
Room Rate 1st 2nd 2nd
Changsha Chongqing
1H19 YoY Change
Chengdu Chongqing Changsha*
Room Yield +14% +31% NA
Room Rate +12% +6% NA
* Opened in Oct-18
Chengdu
Asset Turns
Recurring Income
Services
Financial Management
19
Services
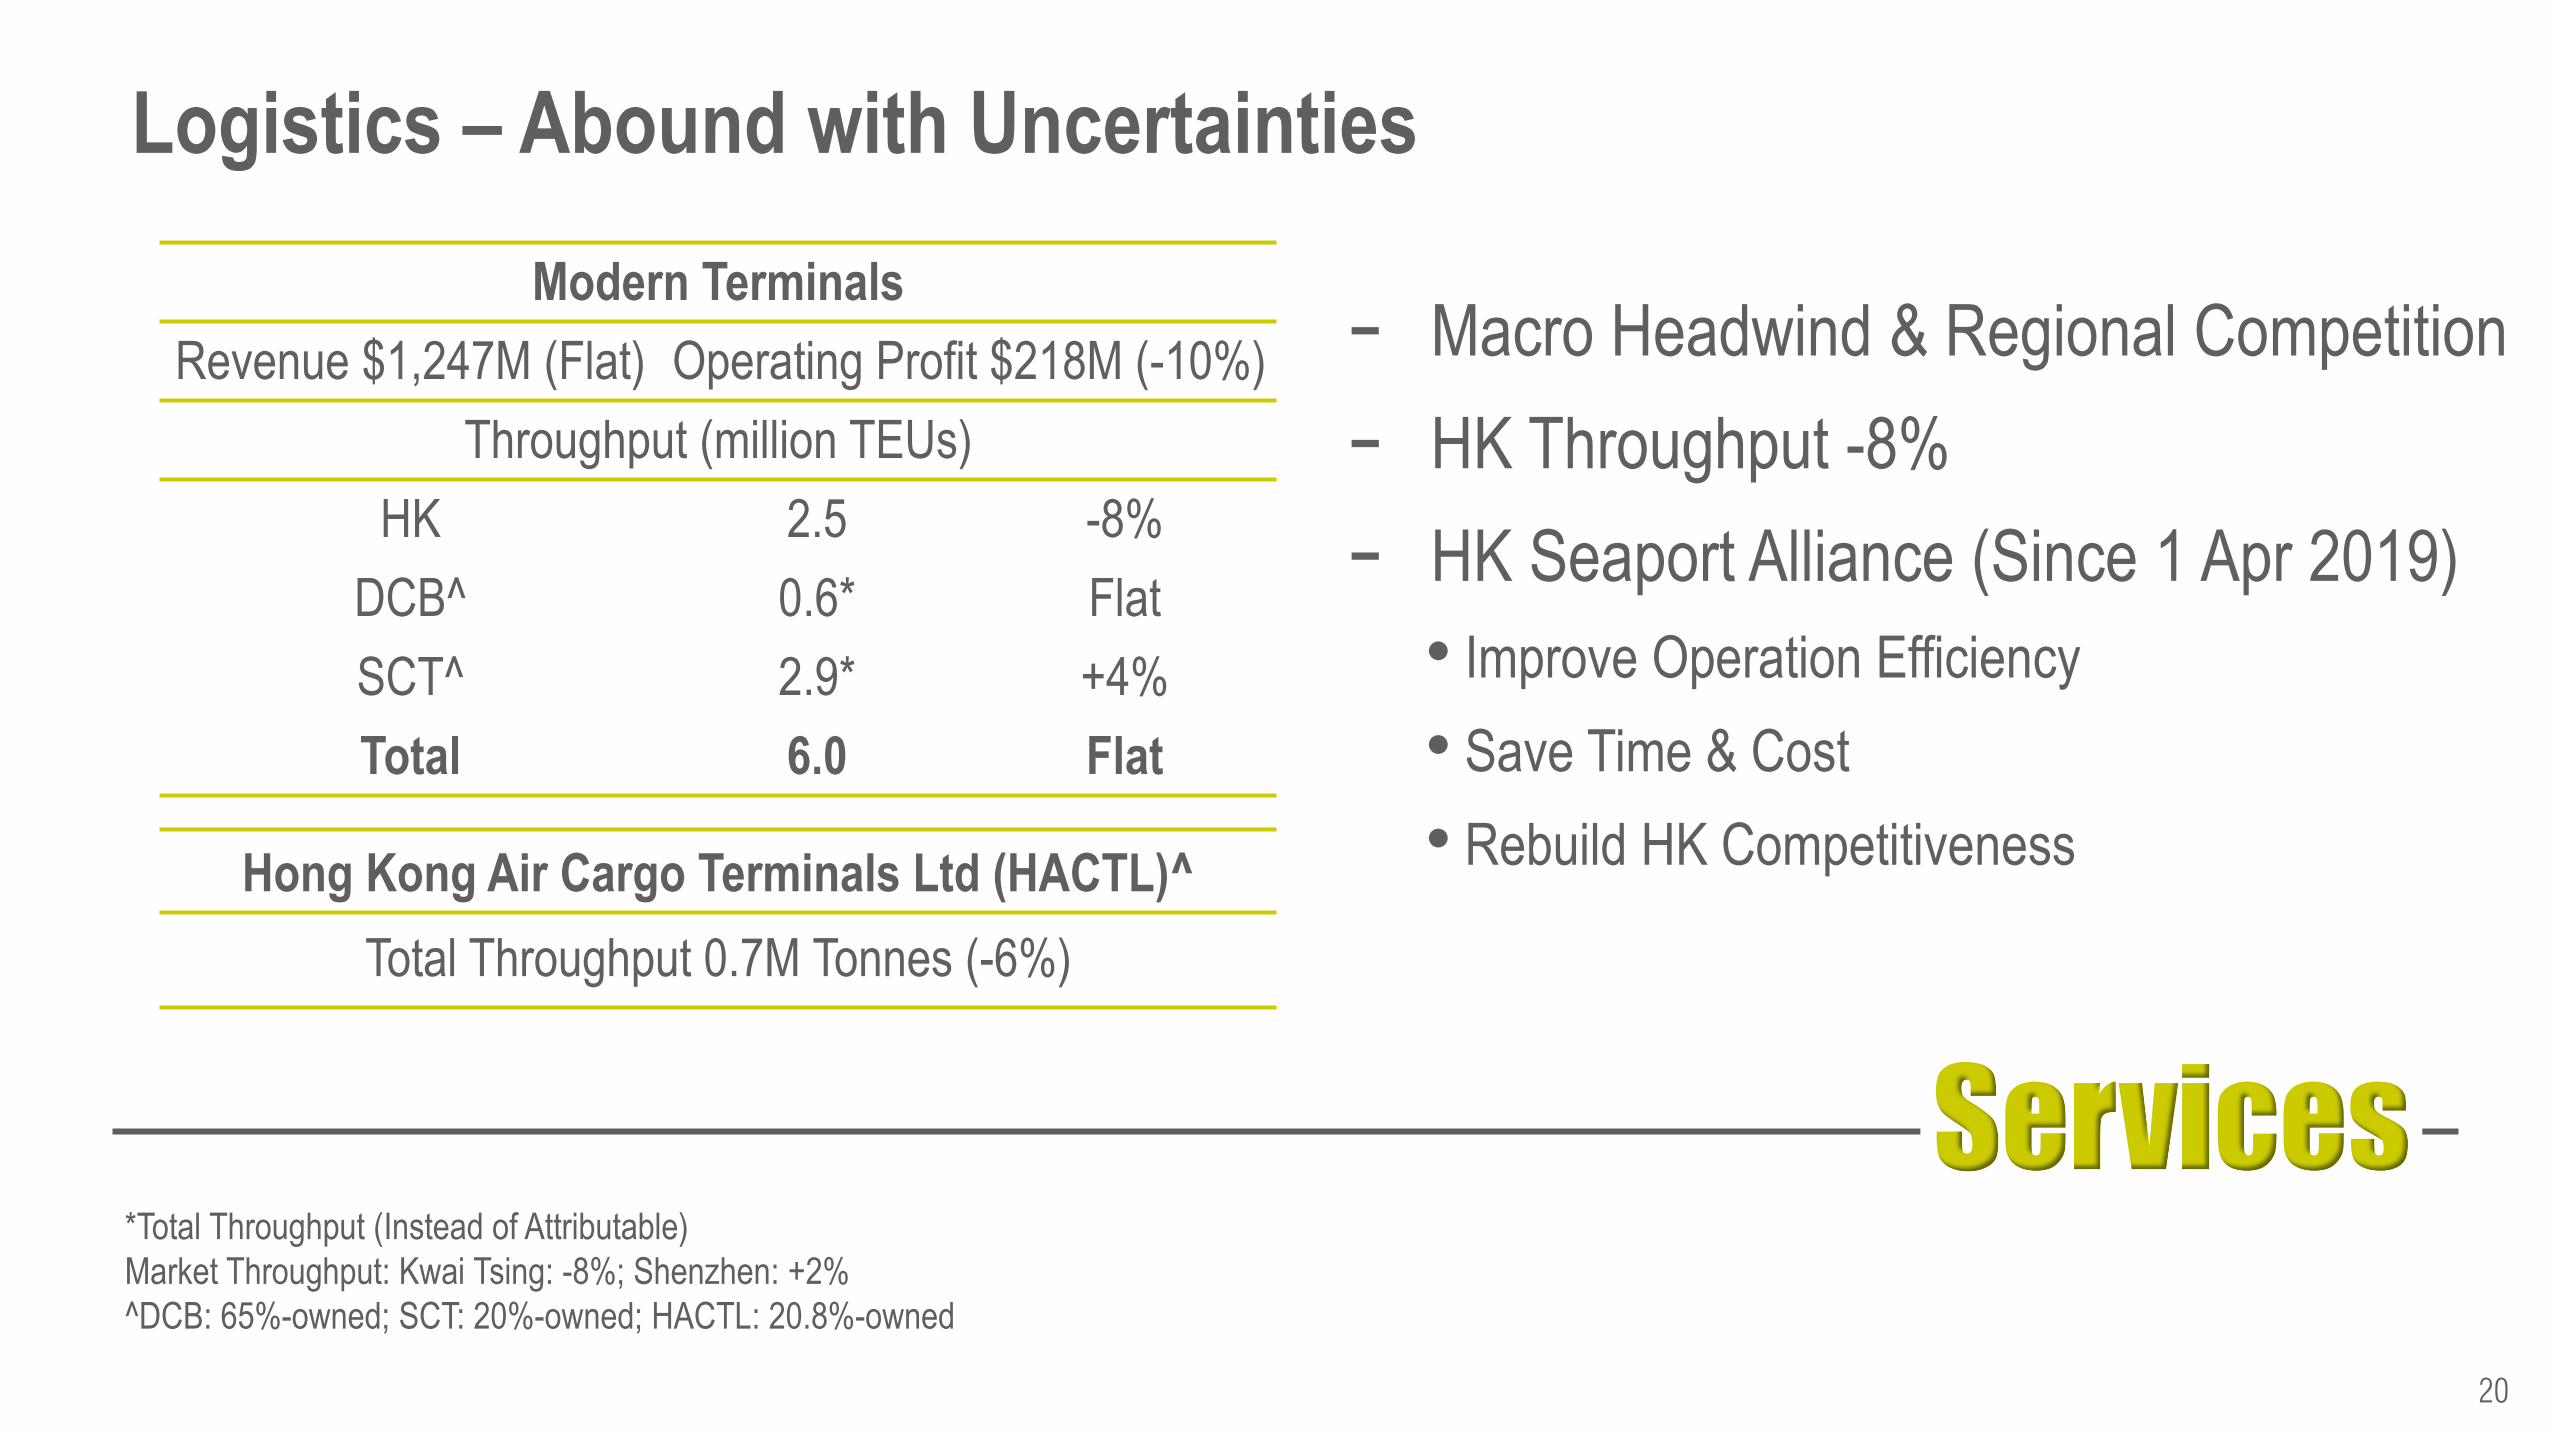
- Macro Headwind & Regional Competition
- HK Throughput -8%
- HK Seaport Alliance (Since 1 Apr 2019)
• Improve Operation Efficiency
• Save Time & Cost
• Rebuild HK Competitiveness
20
Logistics – Abound with Uncertainties
Modern Terminals
Revenue $1,247M (Flat) Operating Profit $218M (-10%)
Throughput (million TEUs)
HK 2.5 -8%
DCB^ 0.6* Flat
SCT^ 2.9* +4%
Total 6.0 Flat
Hong Kong Air Cargo Terminals Ltd (HACTL)^
Total Throughput 0.7M Tonnes (-6%)
*Total Throughput (Instead of Attributable)
Market Throughput: Kwai Tsing: -8%; Shenzhen: +2%
^DCB: 65%-owned; SCT: 20%-owned; HACTL: 20.8%-owned
Asset Turns
Recurring Income
Services
Financial Management
21
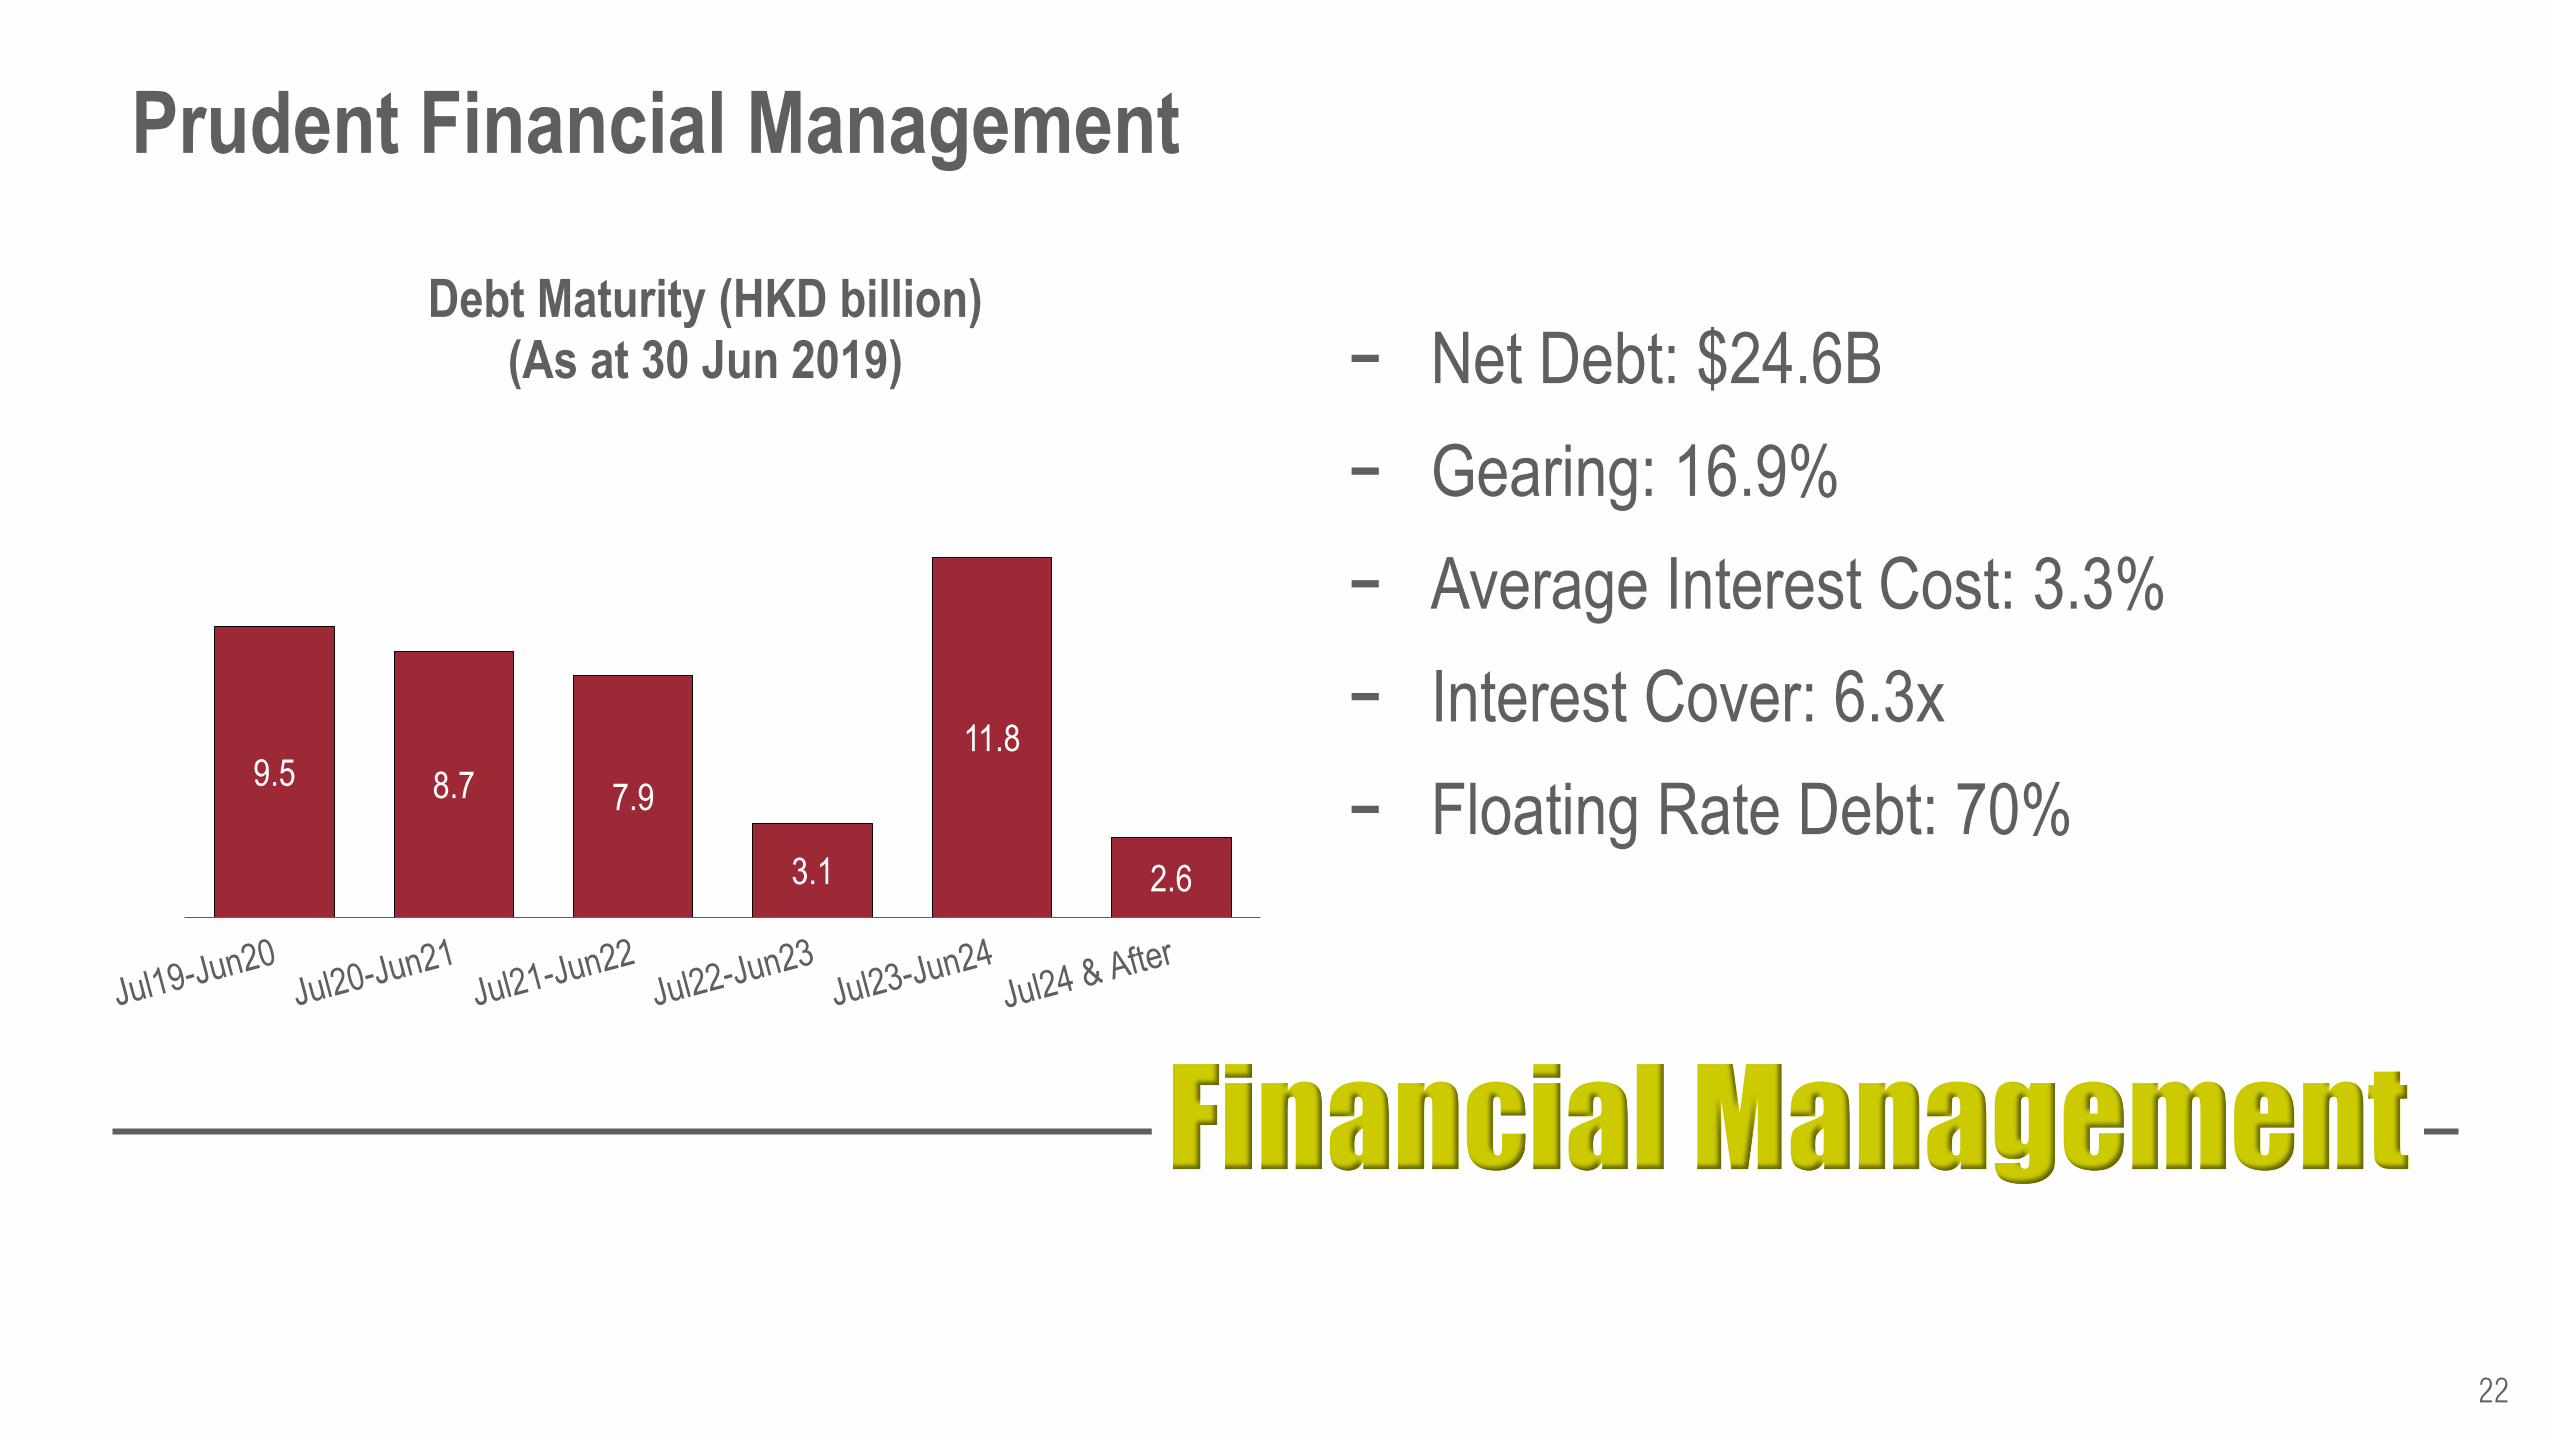
Financial Management
- Net Debt: $24.6B
- Gearing: 16.9%
- Average Interest Cost: 3.3%
- Interest Cover: 6.3x
- Floating Rate Debt: 70%
22
Prudent Financial Management
9.5 8.7 7.9
3.1
11.8
2.6
Debt Maturity (HKD billion) (As at 30 Jun 2019)

Outlook
23
Outlook
24
Cautious Outlook
- Sino-US Trade Disputes
- European Political Instability/ Brexit
- Global Currency & Interest Rate Movements
- Weak Global Demand
Sustainability
25
Sustainability
26
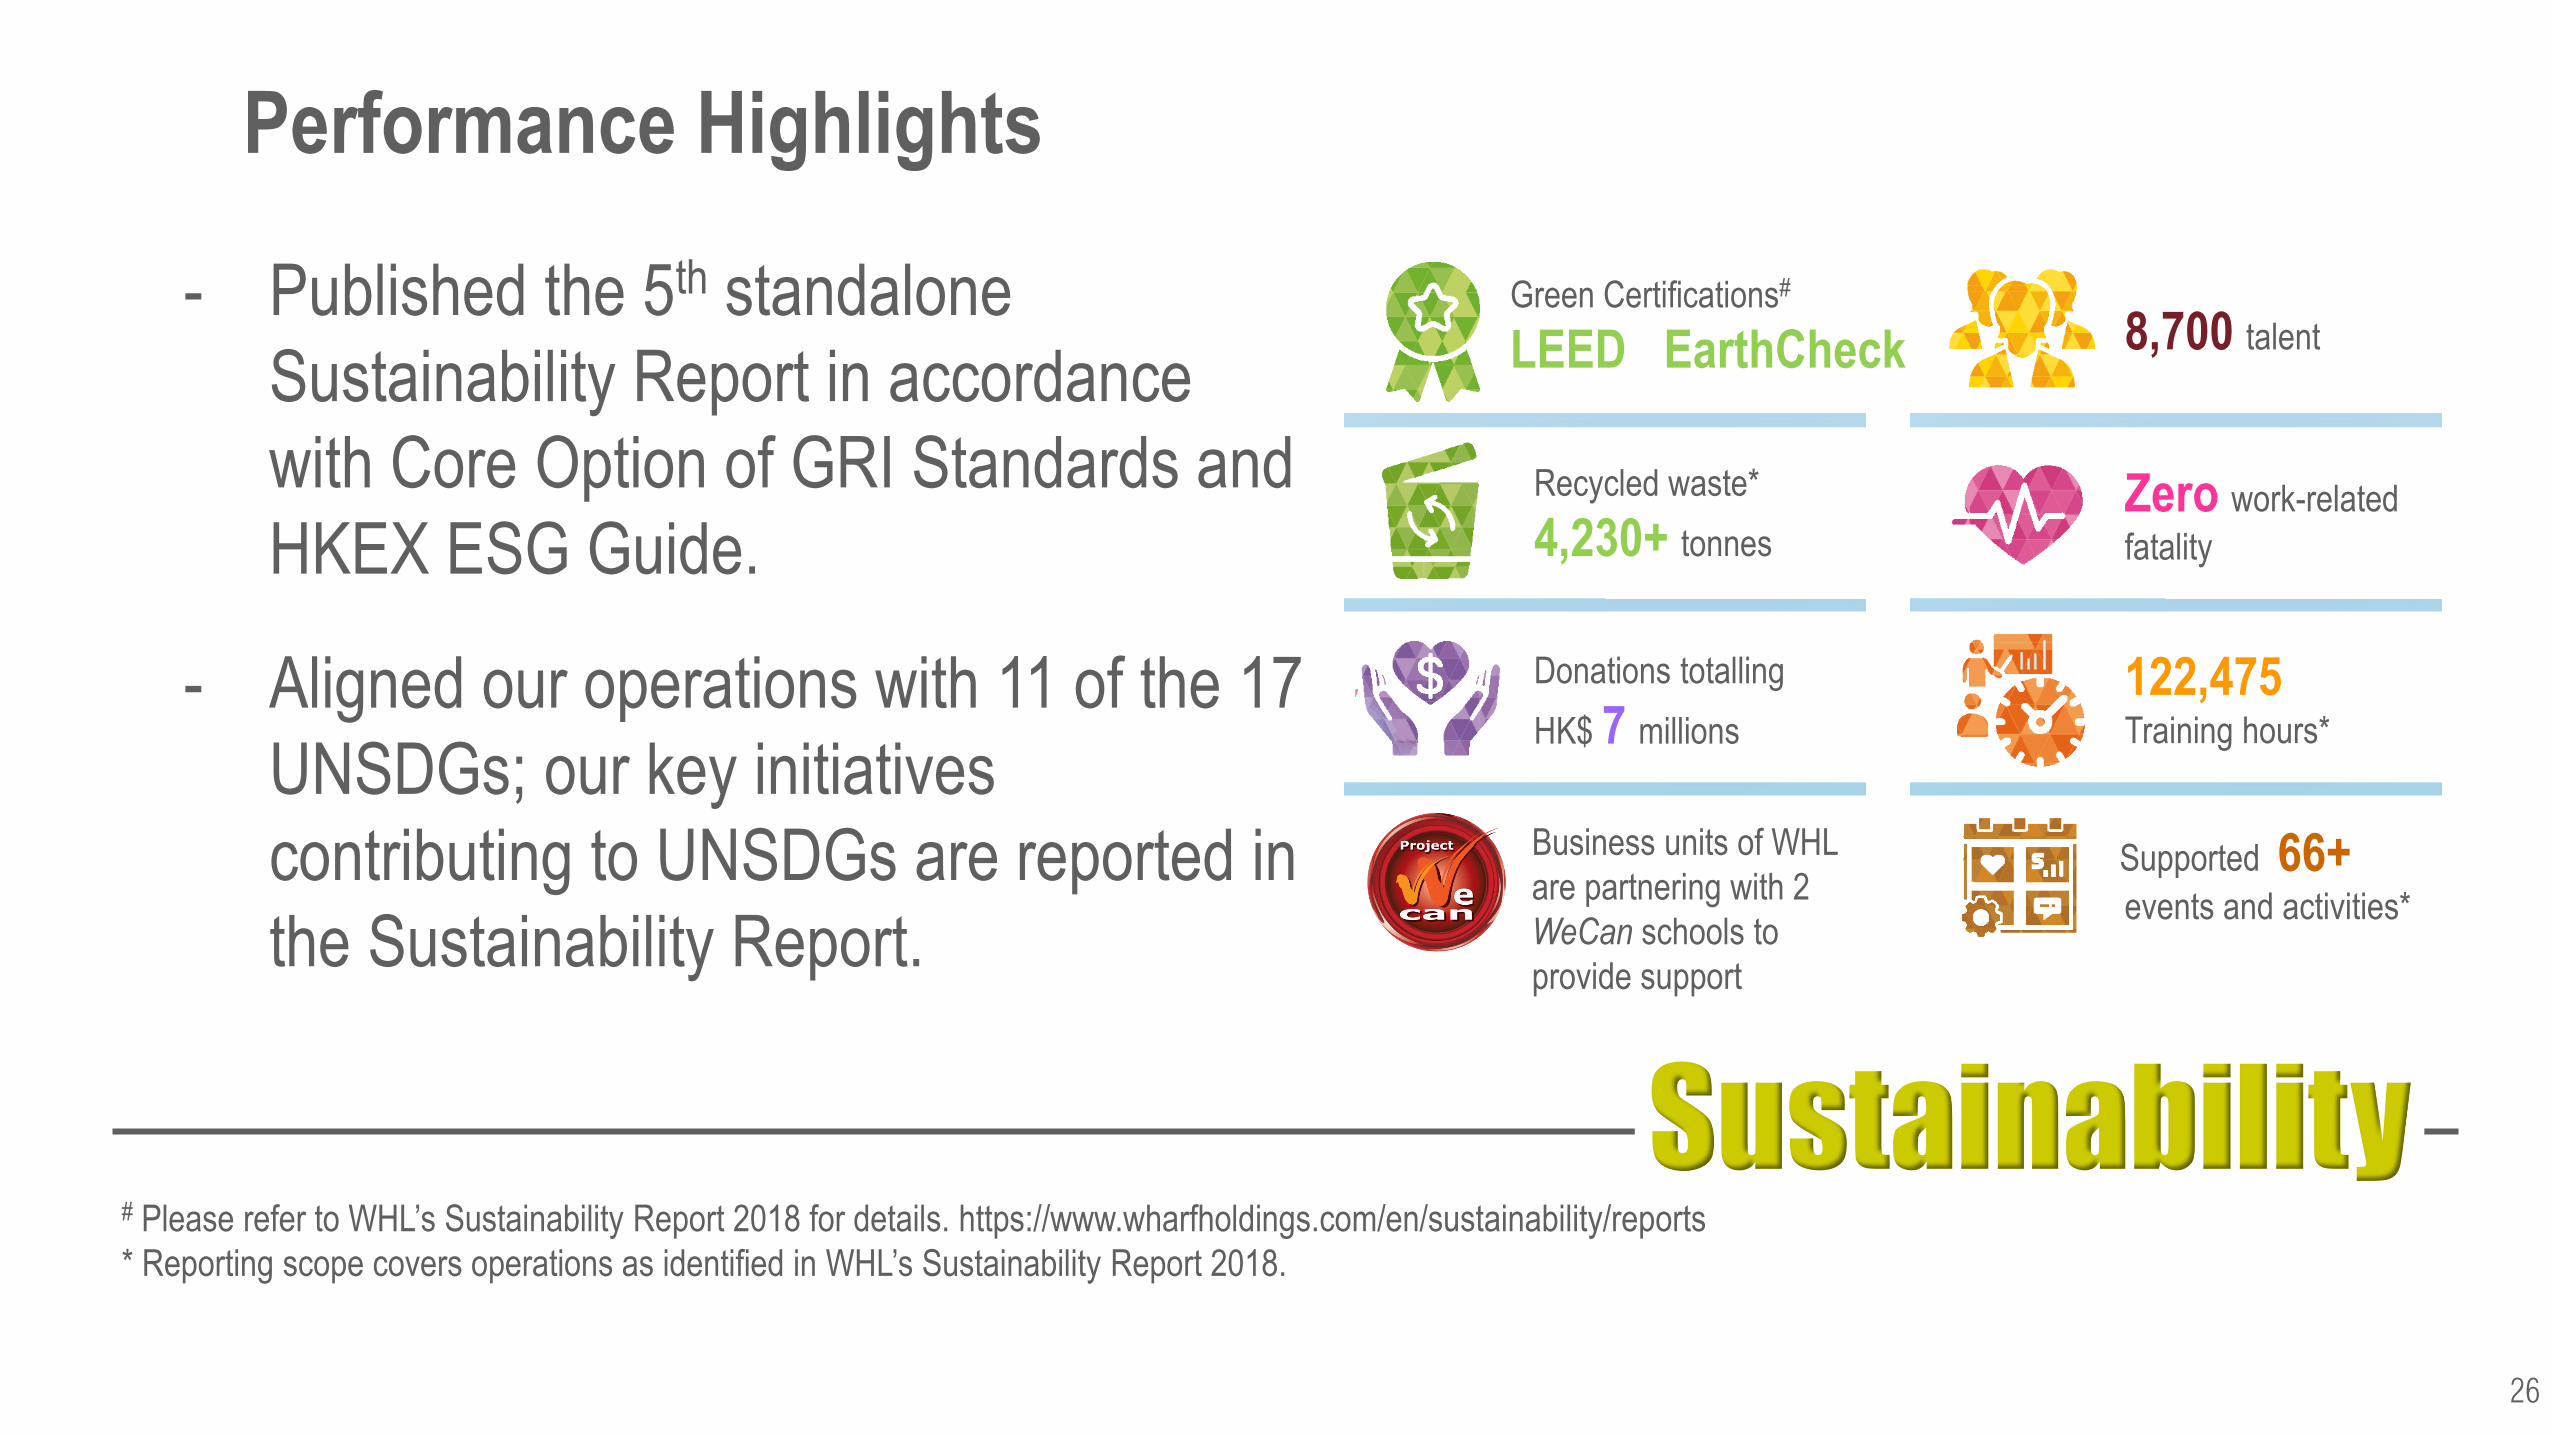
- Published the 5th standalone
Sustainability Report in accordance
with Core Option of GRI Standards and
HKEX ESG Guide.
- Aligned our operations with 11 of the 17
UNSDGs; our key initiatives
contributing to UNSDGs are reported in
the Sustainability Report.
Performance Highlights
8,700 talent
Zero work-related
fatality
122,475 Training hours*
Supported 66+ events and activities*
Recycled waste*
4,230+ tonnes
Green Certifications#
LEED & EarthCheck
Donations totalling
HK$ 7 millions
Business units of WHL
are partnering with 2
WeCan schools to
provide support
# Please refer to WHL’s Sustainability Report 2018 for details. https://www.wharfholdings.com/en/sustainability/reports
* Reporting scope covers operations as identified in WHL’s Sustainability Report 2018.
Supported
Sustainability
27
- Constituent member of Hang Seng
Corporate Sustainability Index
- CSR Index Plus
- 5 Years+ Caring Company Logo
- Has raised its first Green Loan Facility
in the amount of HK$2 billion to
refinance Chengdu IFS, the Group’s
first IFS flagship project in China.
Appendix
28
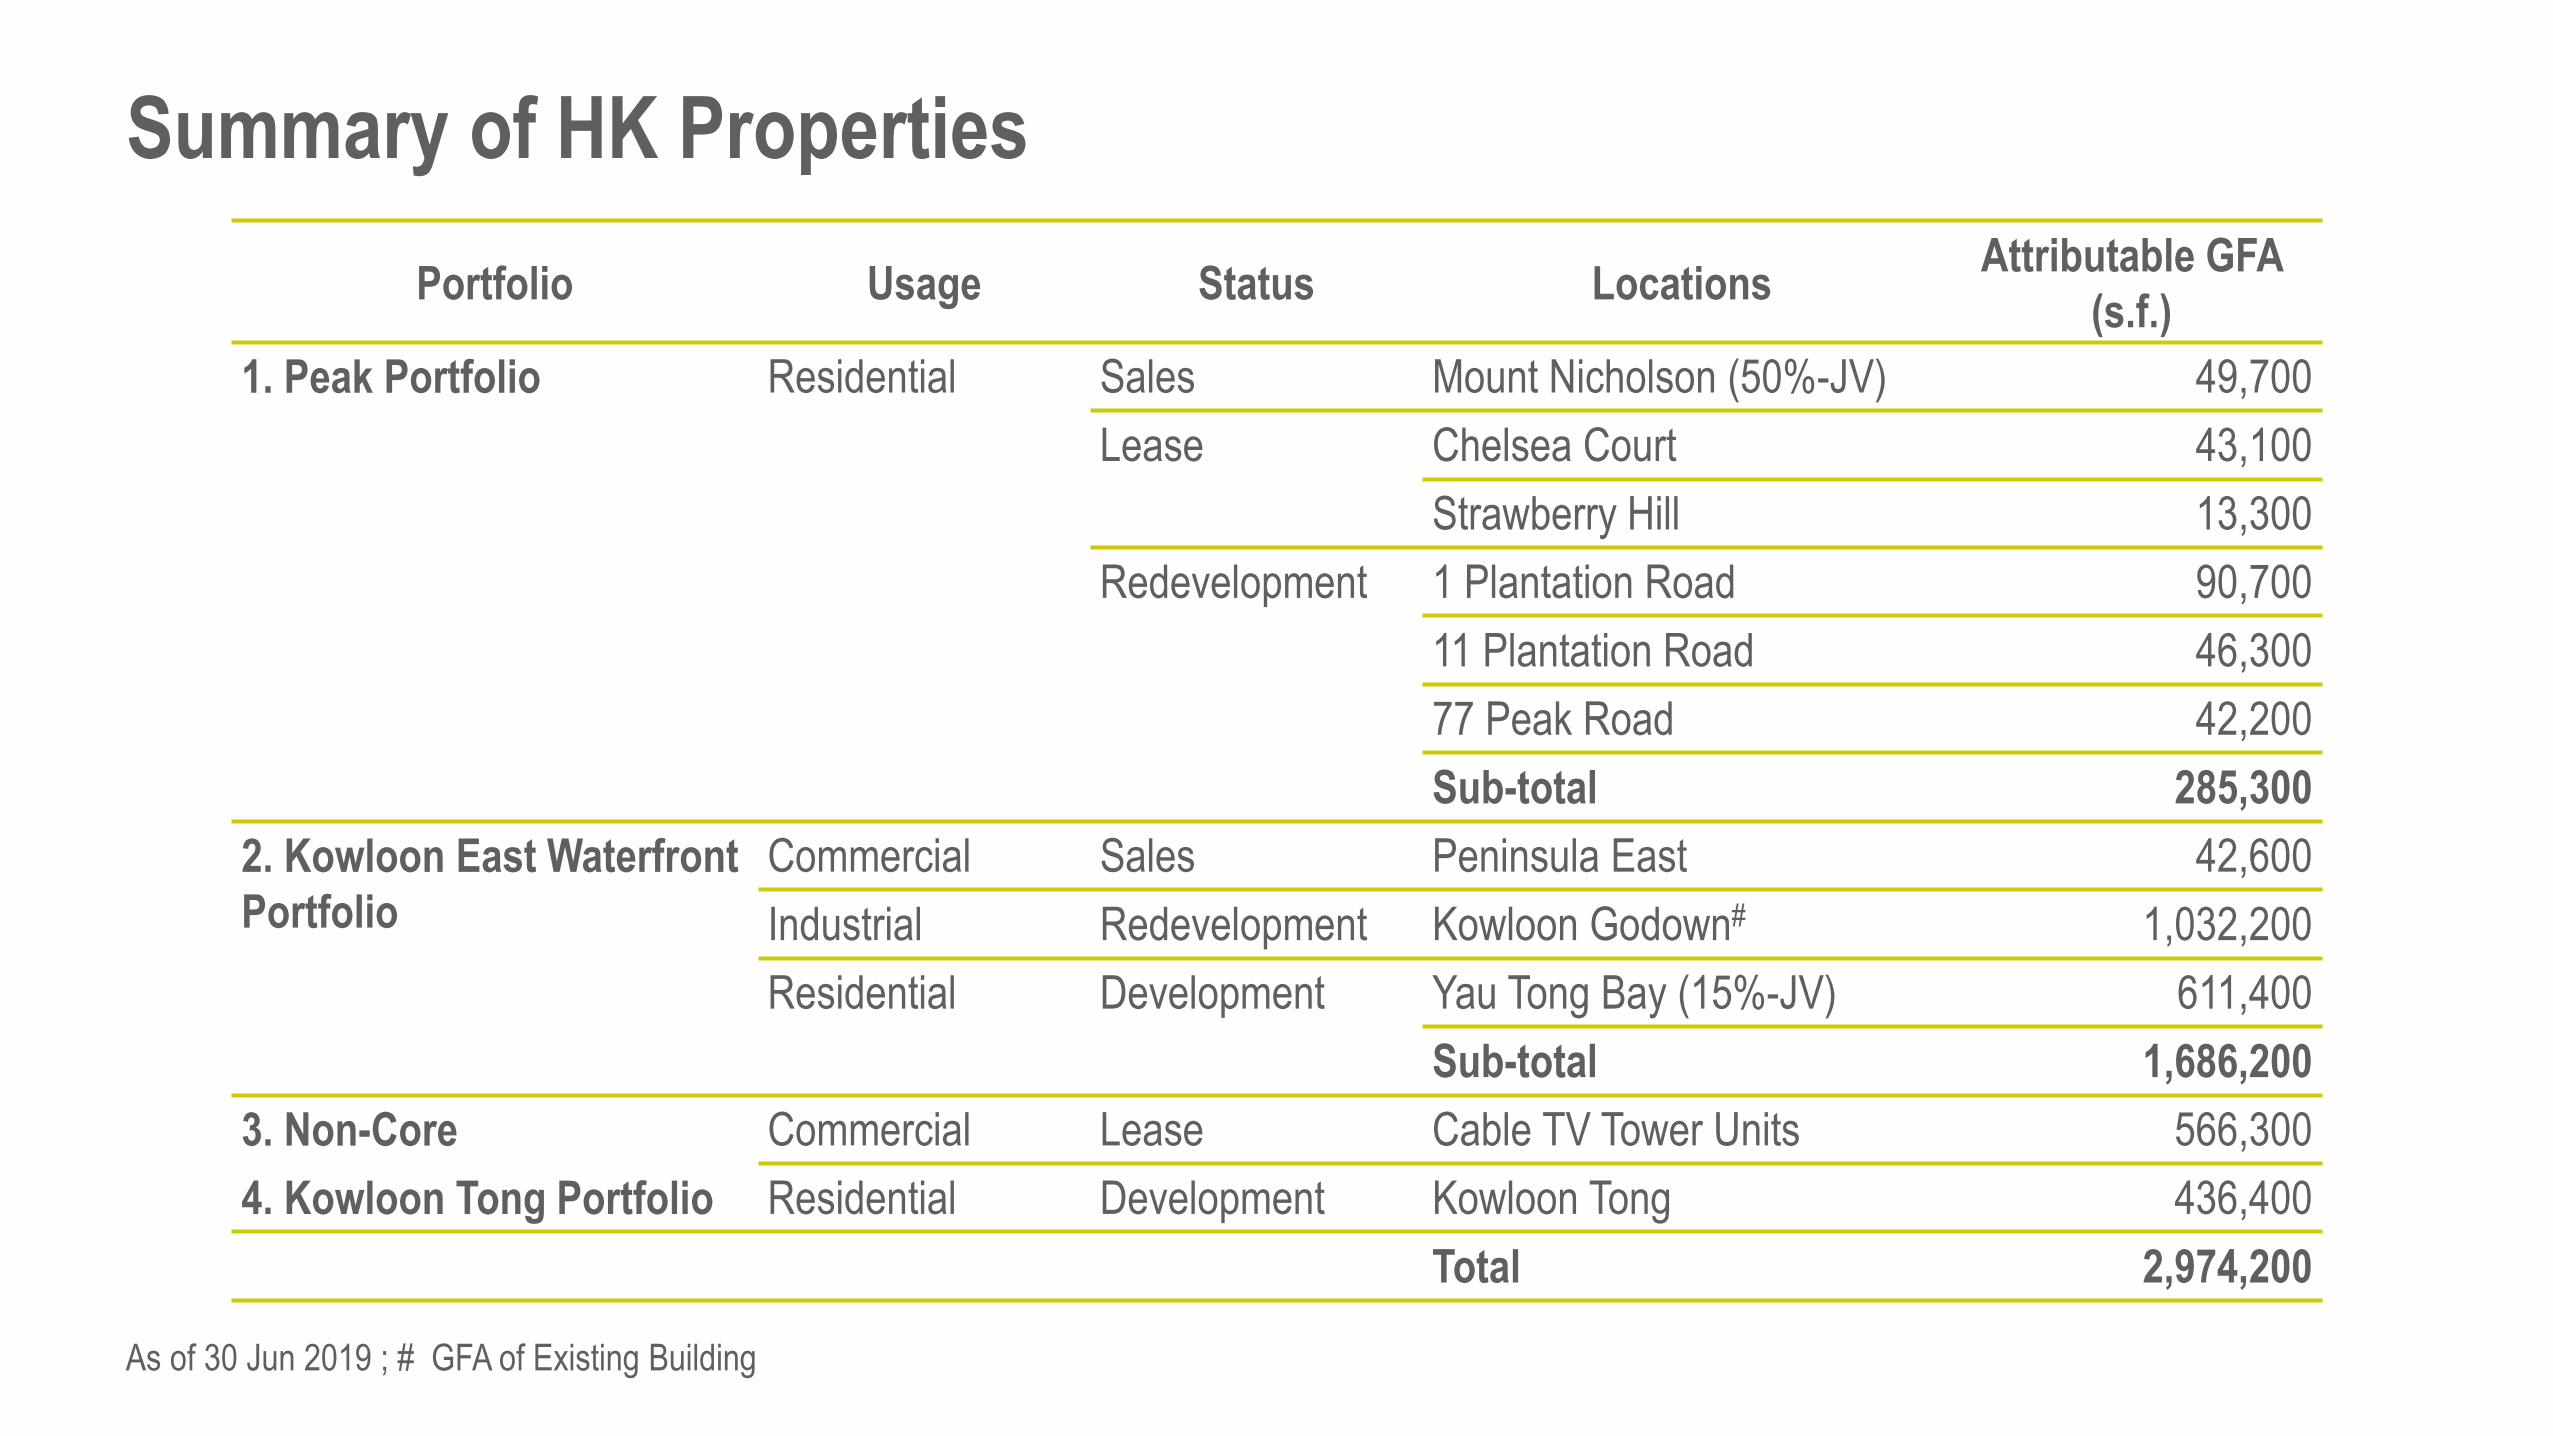
Portfolio Usage Status Locations Attributable GFA
(s.f.)
1. Peak Portfolio Residential Sales Mount Nicholson (50%-JV) 49,700
Lease Chelsea Court 43,100
Strawberry Hill 13,300
Redevelopment 1 Plantation Road 90,700
11 Plantation Road 46,300
77 Peak Road 42,200
Sub-total 285,300
2. Kowloon East Waterfront
Portfolio
Commercial Sales Peninsula East 42,600
Industrial Redevelopment Kowloon Godown# 1,032,200
Residential Development Yau Tong Bay (15%-JV) 611,400
Sub-total 1,686,200
3. Non-Core Commercial Lease Cable TV Tower Units 566,300
4. Kowloon Tong Portfolio Residential Development Kowloon Tong 436,400
Total 2,974,200
As of 30 Jun 2019 ; # GFA of Existing Building
Summary of HK Properties
30
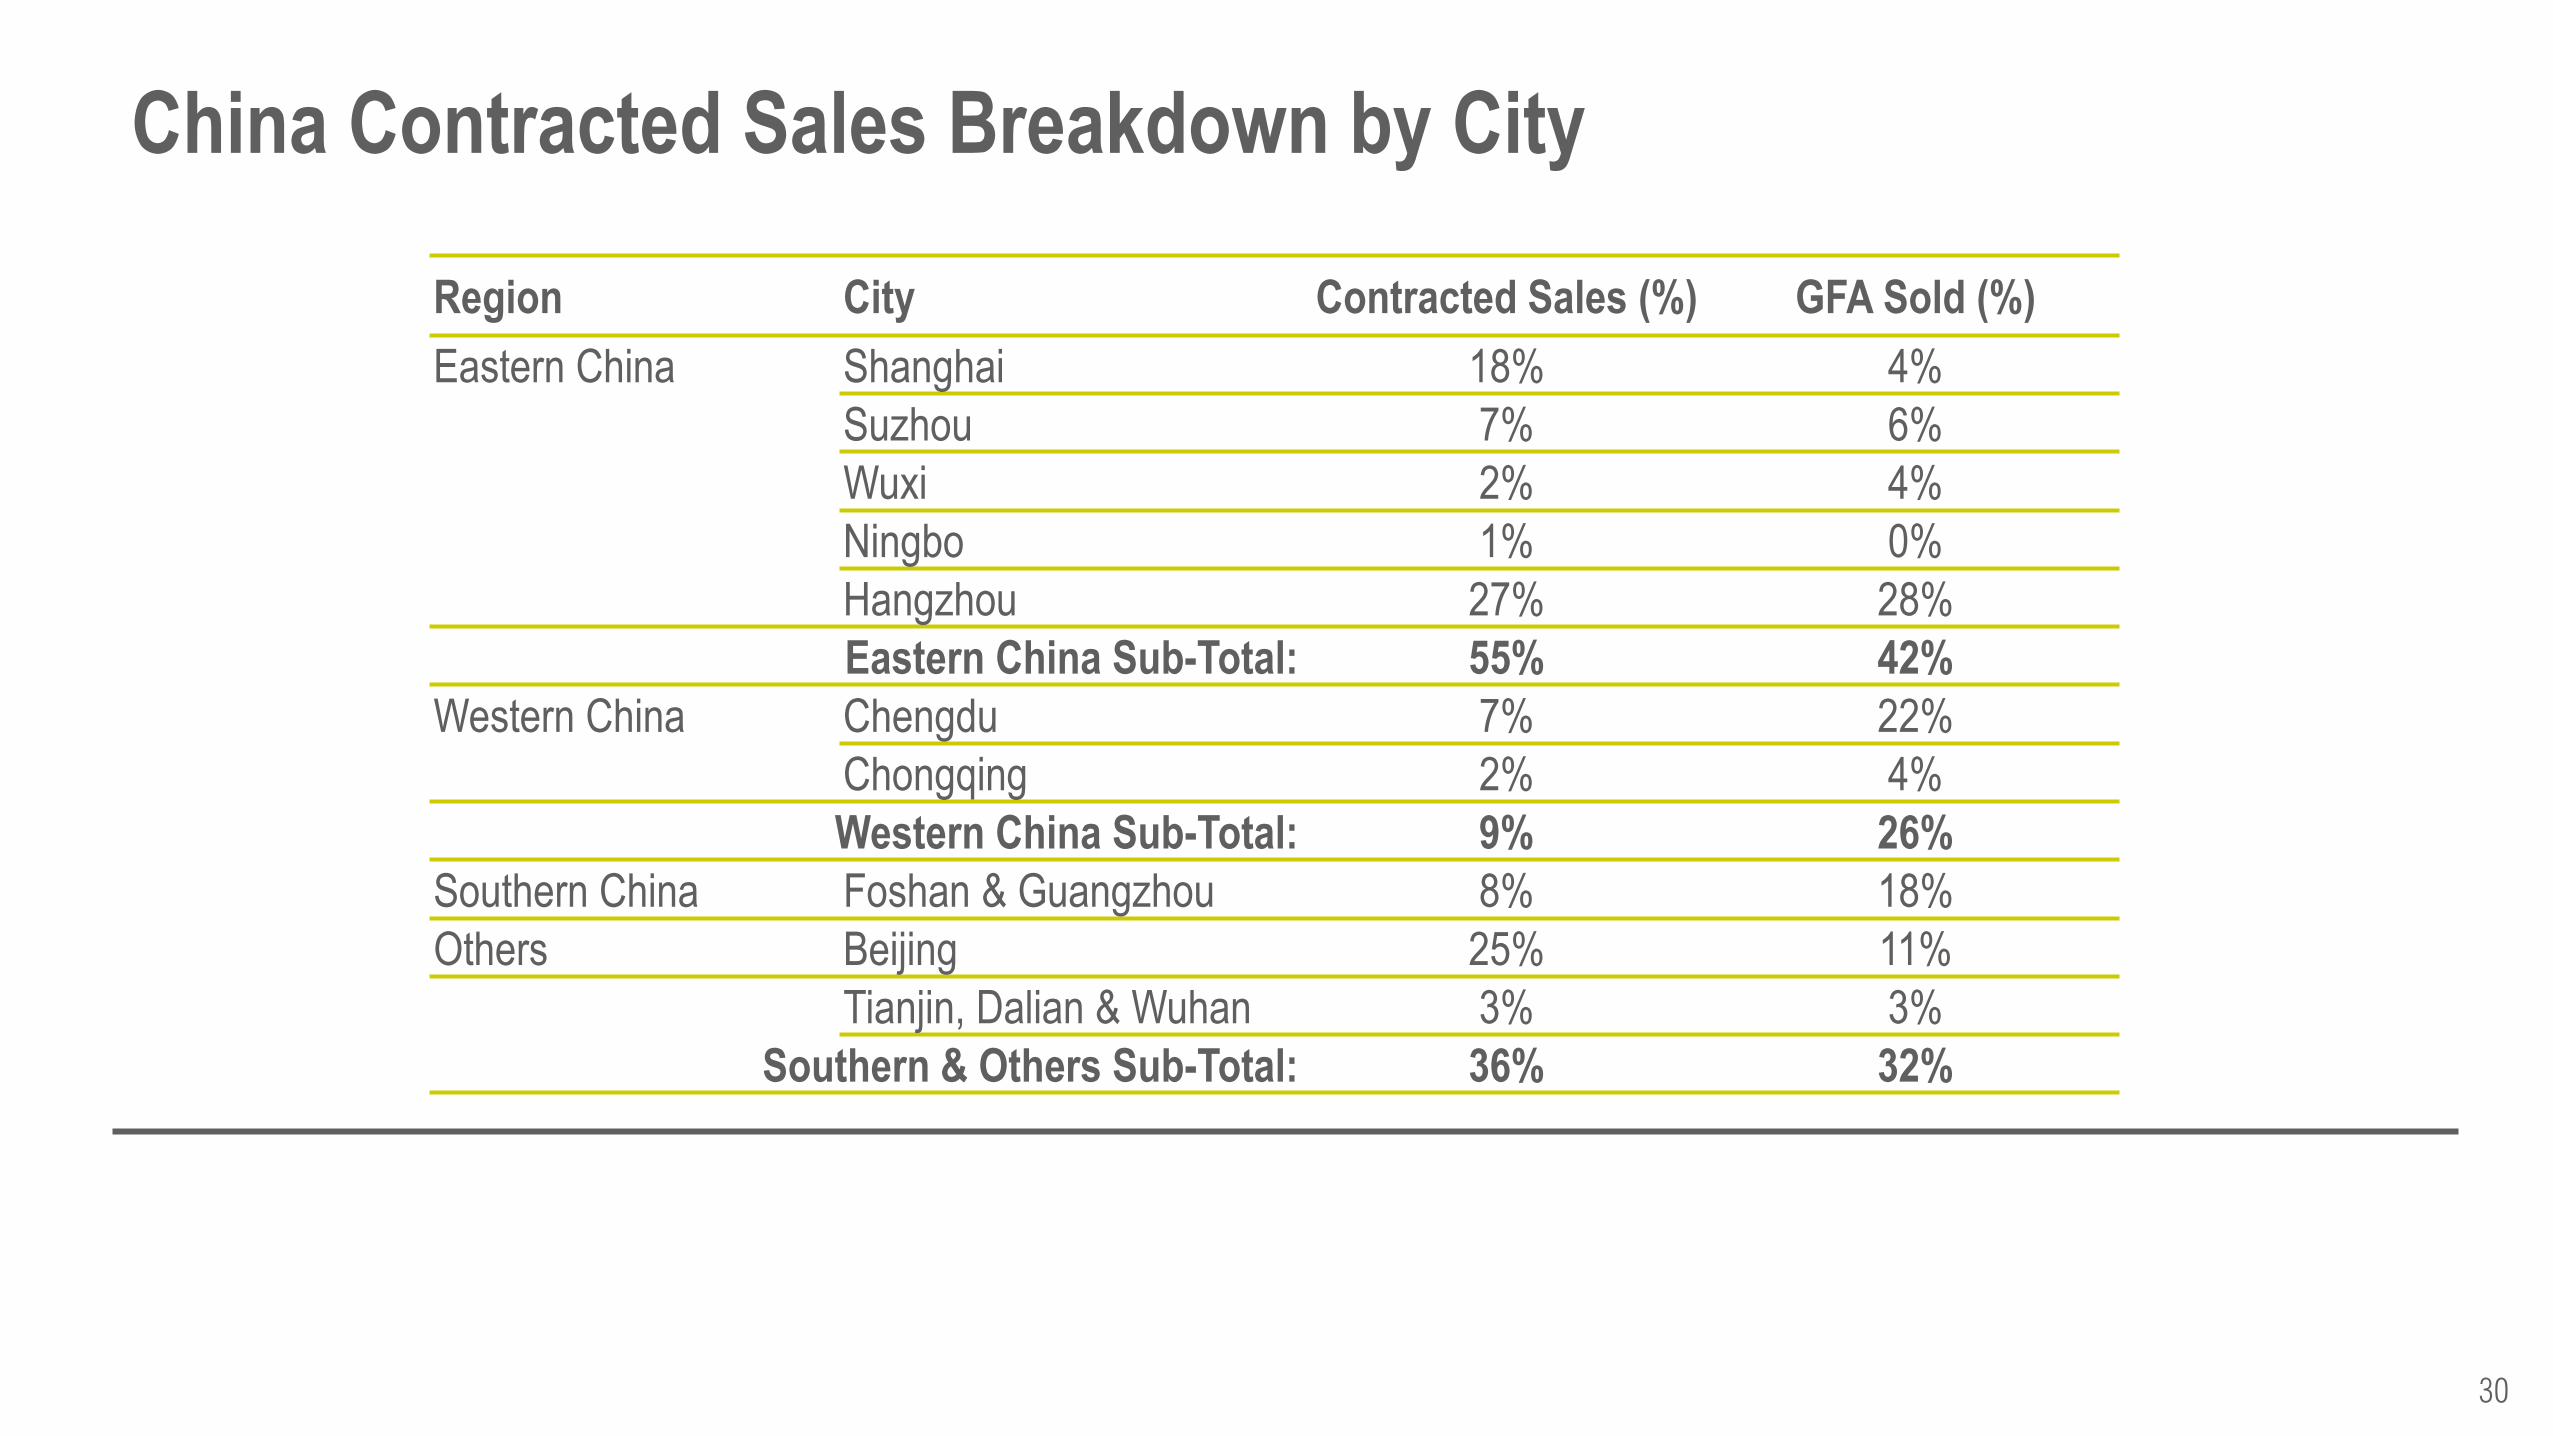
China Contracted Sales Breakdown by City
Region City Contracted Sales (%) GFA Sold (%)
Eastern China Shanghai 18% 4%
Suzhou 7% 6%
Wuxi 2% 4%
Ningbo 1% 0%
Hangzhou 27% 28%
Eastern China Sub-Total: 55% 42%
Western China Chengdu 7% 22%
Chongqing 2% 4%
Western China Sub-Total: 9% 26%
Southern China Foshan & Guangzhou 8% 18%
Others Beijing 25% 11%
Tianjin, Dalian & Wuhan 3% 3%
Southern & Others Sub-Total: 36% 32%
31
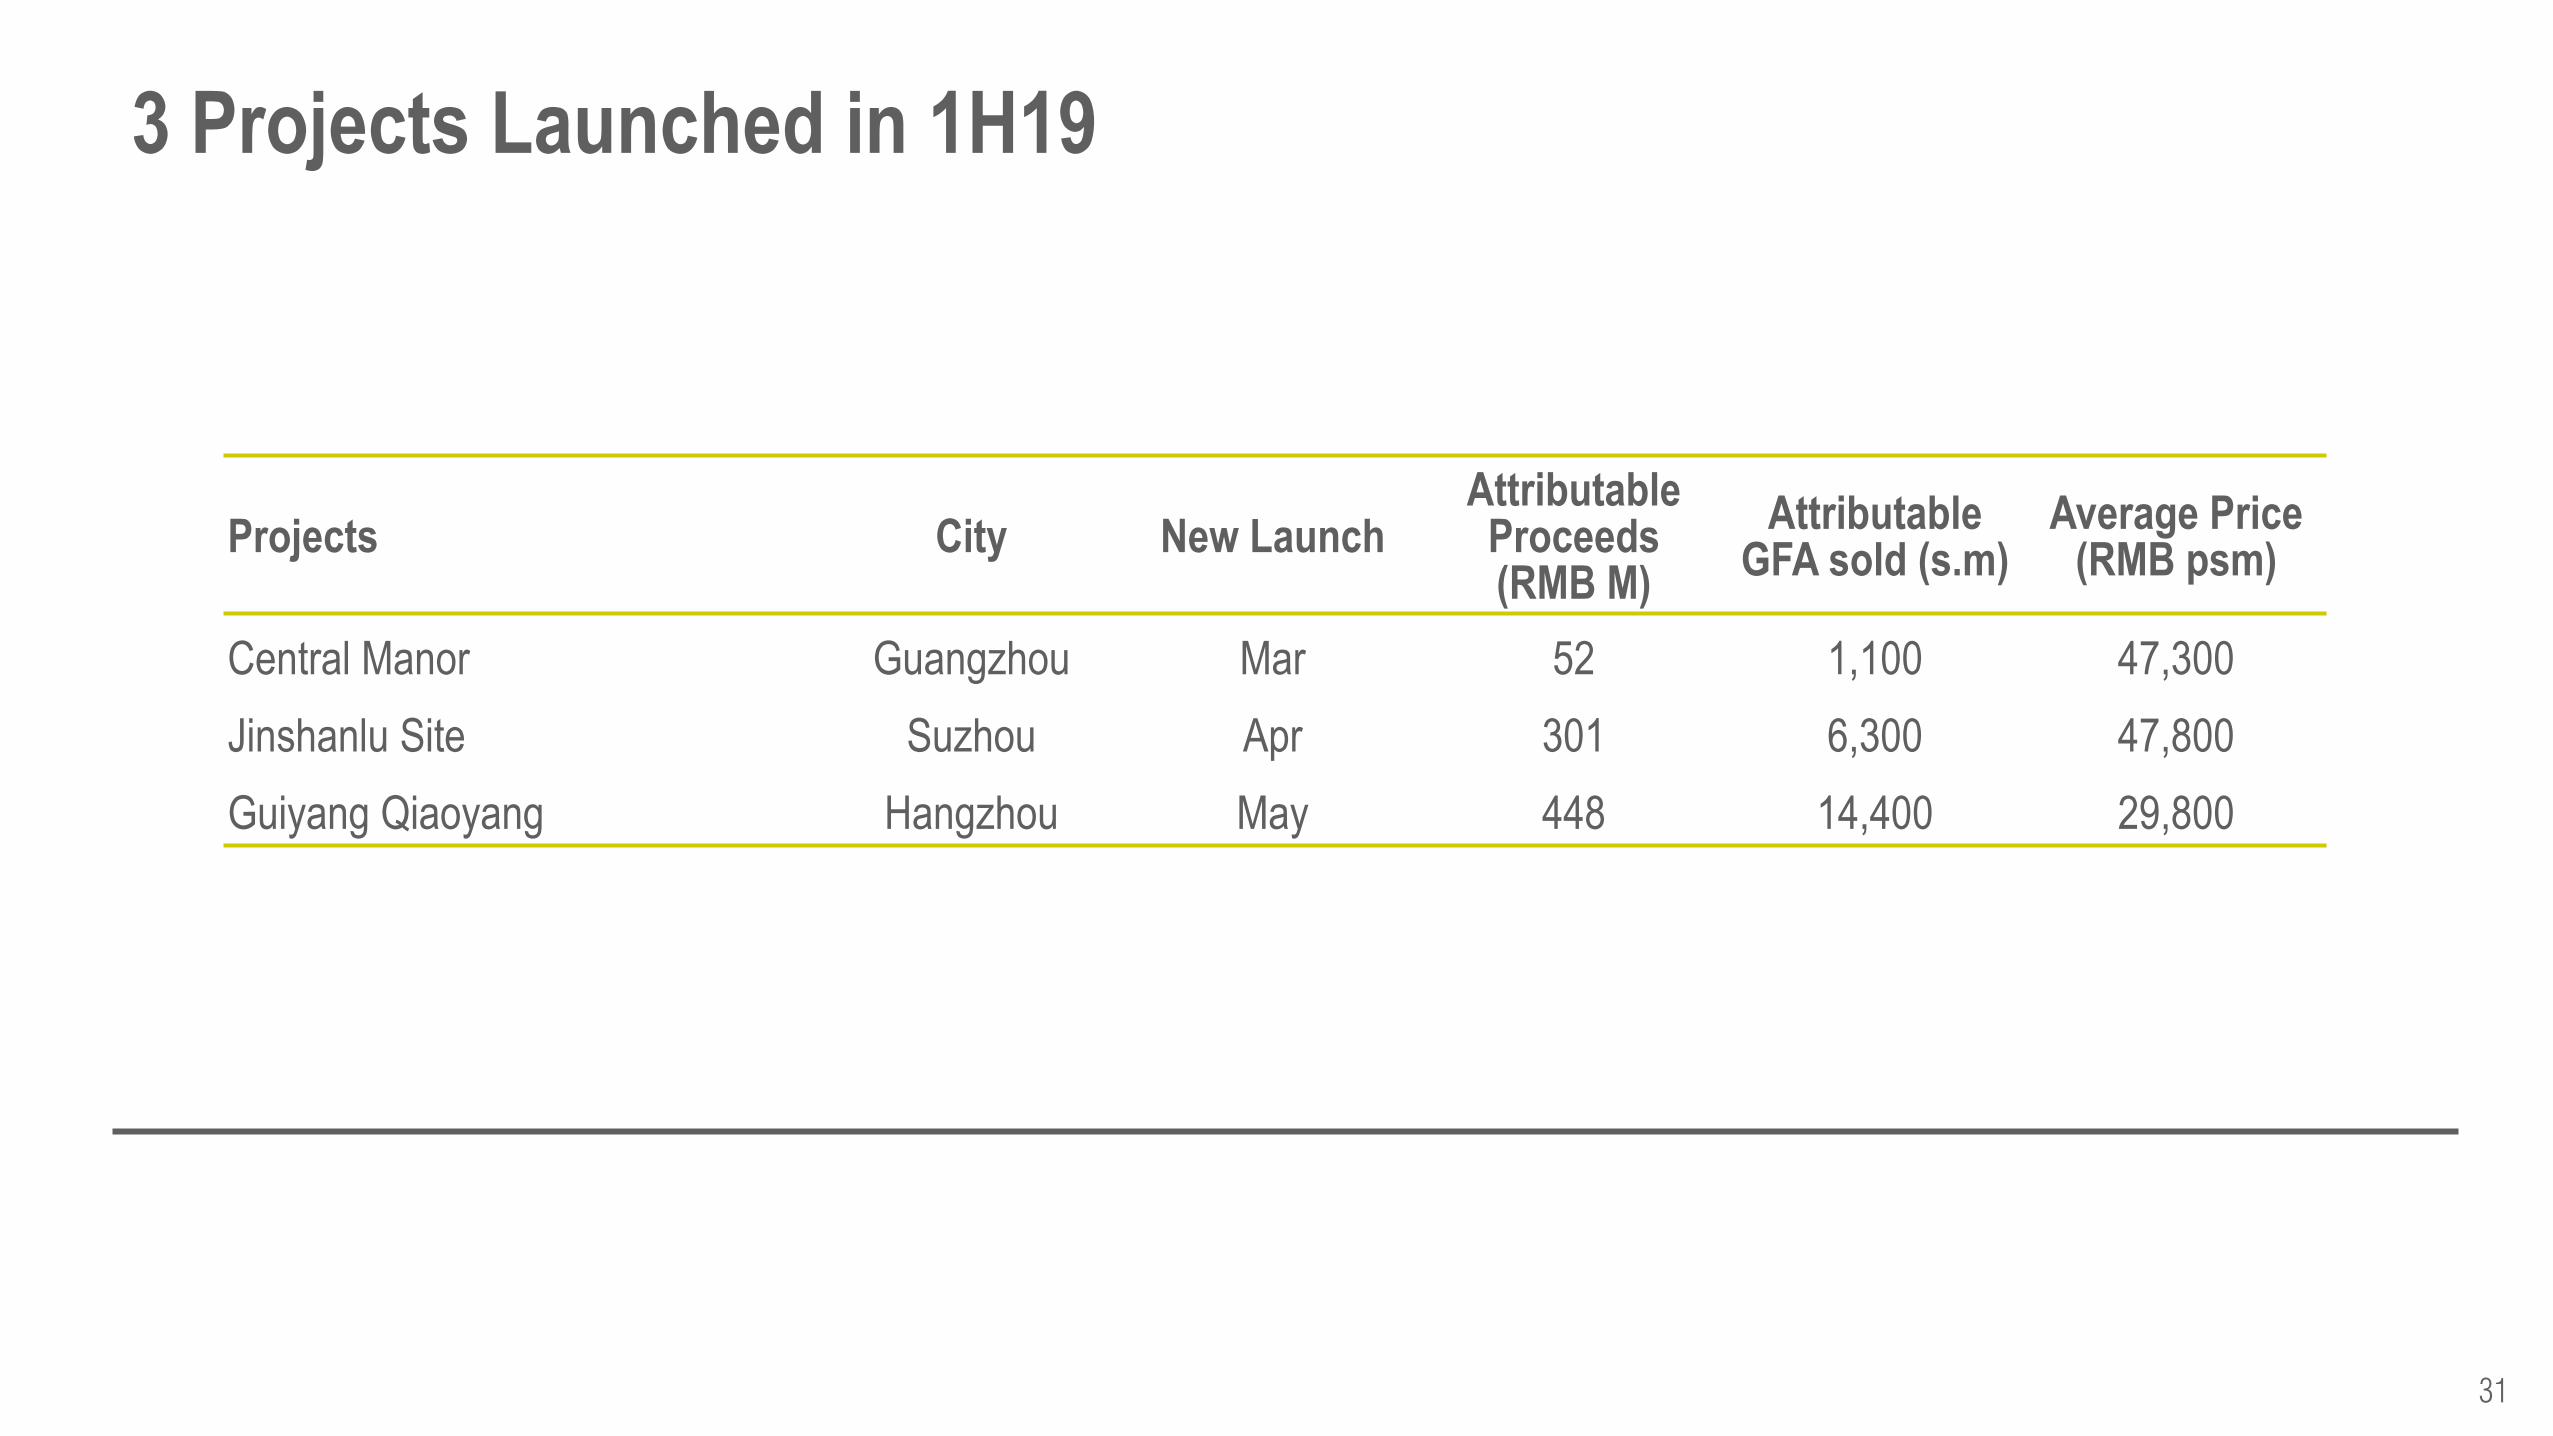
3 Projects Launched in 1H19
Projects City New Launch Attributable
Proceeds (RMB M)
Attributable GFA sold (s.m)
Average Price (RMB psm)
Central Manor Guangzhou Mar 52 1,100 47,300
Jinshanlu Site Suzhou Apr 301 6,300 47,800
Guiyang Qiaoyang Hangzhou May 448 14,400 29,800
32
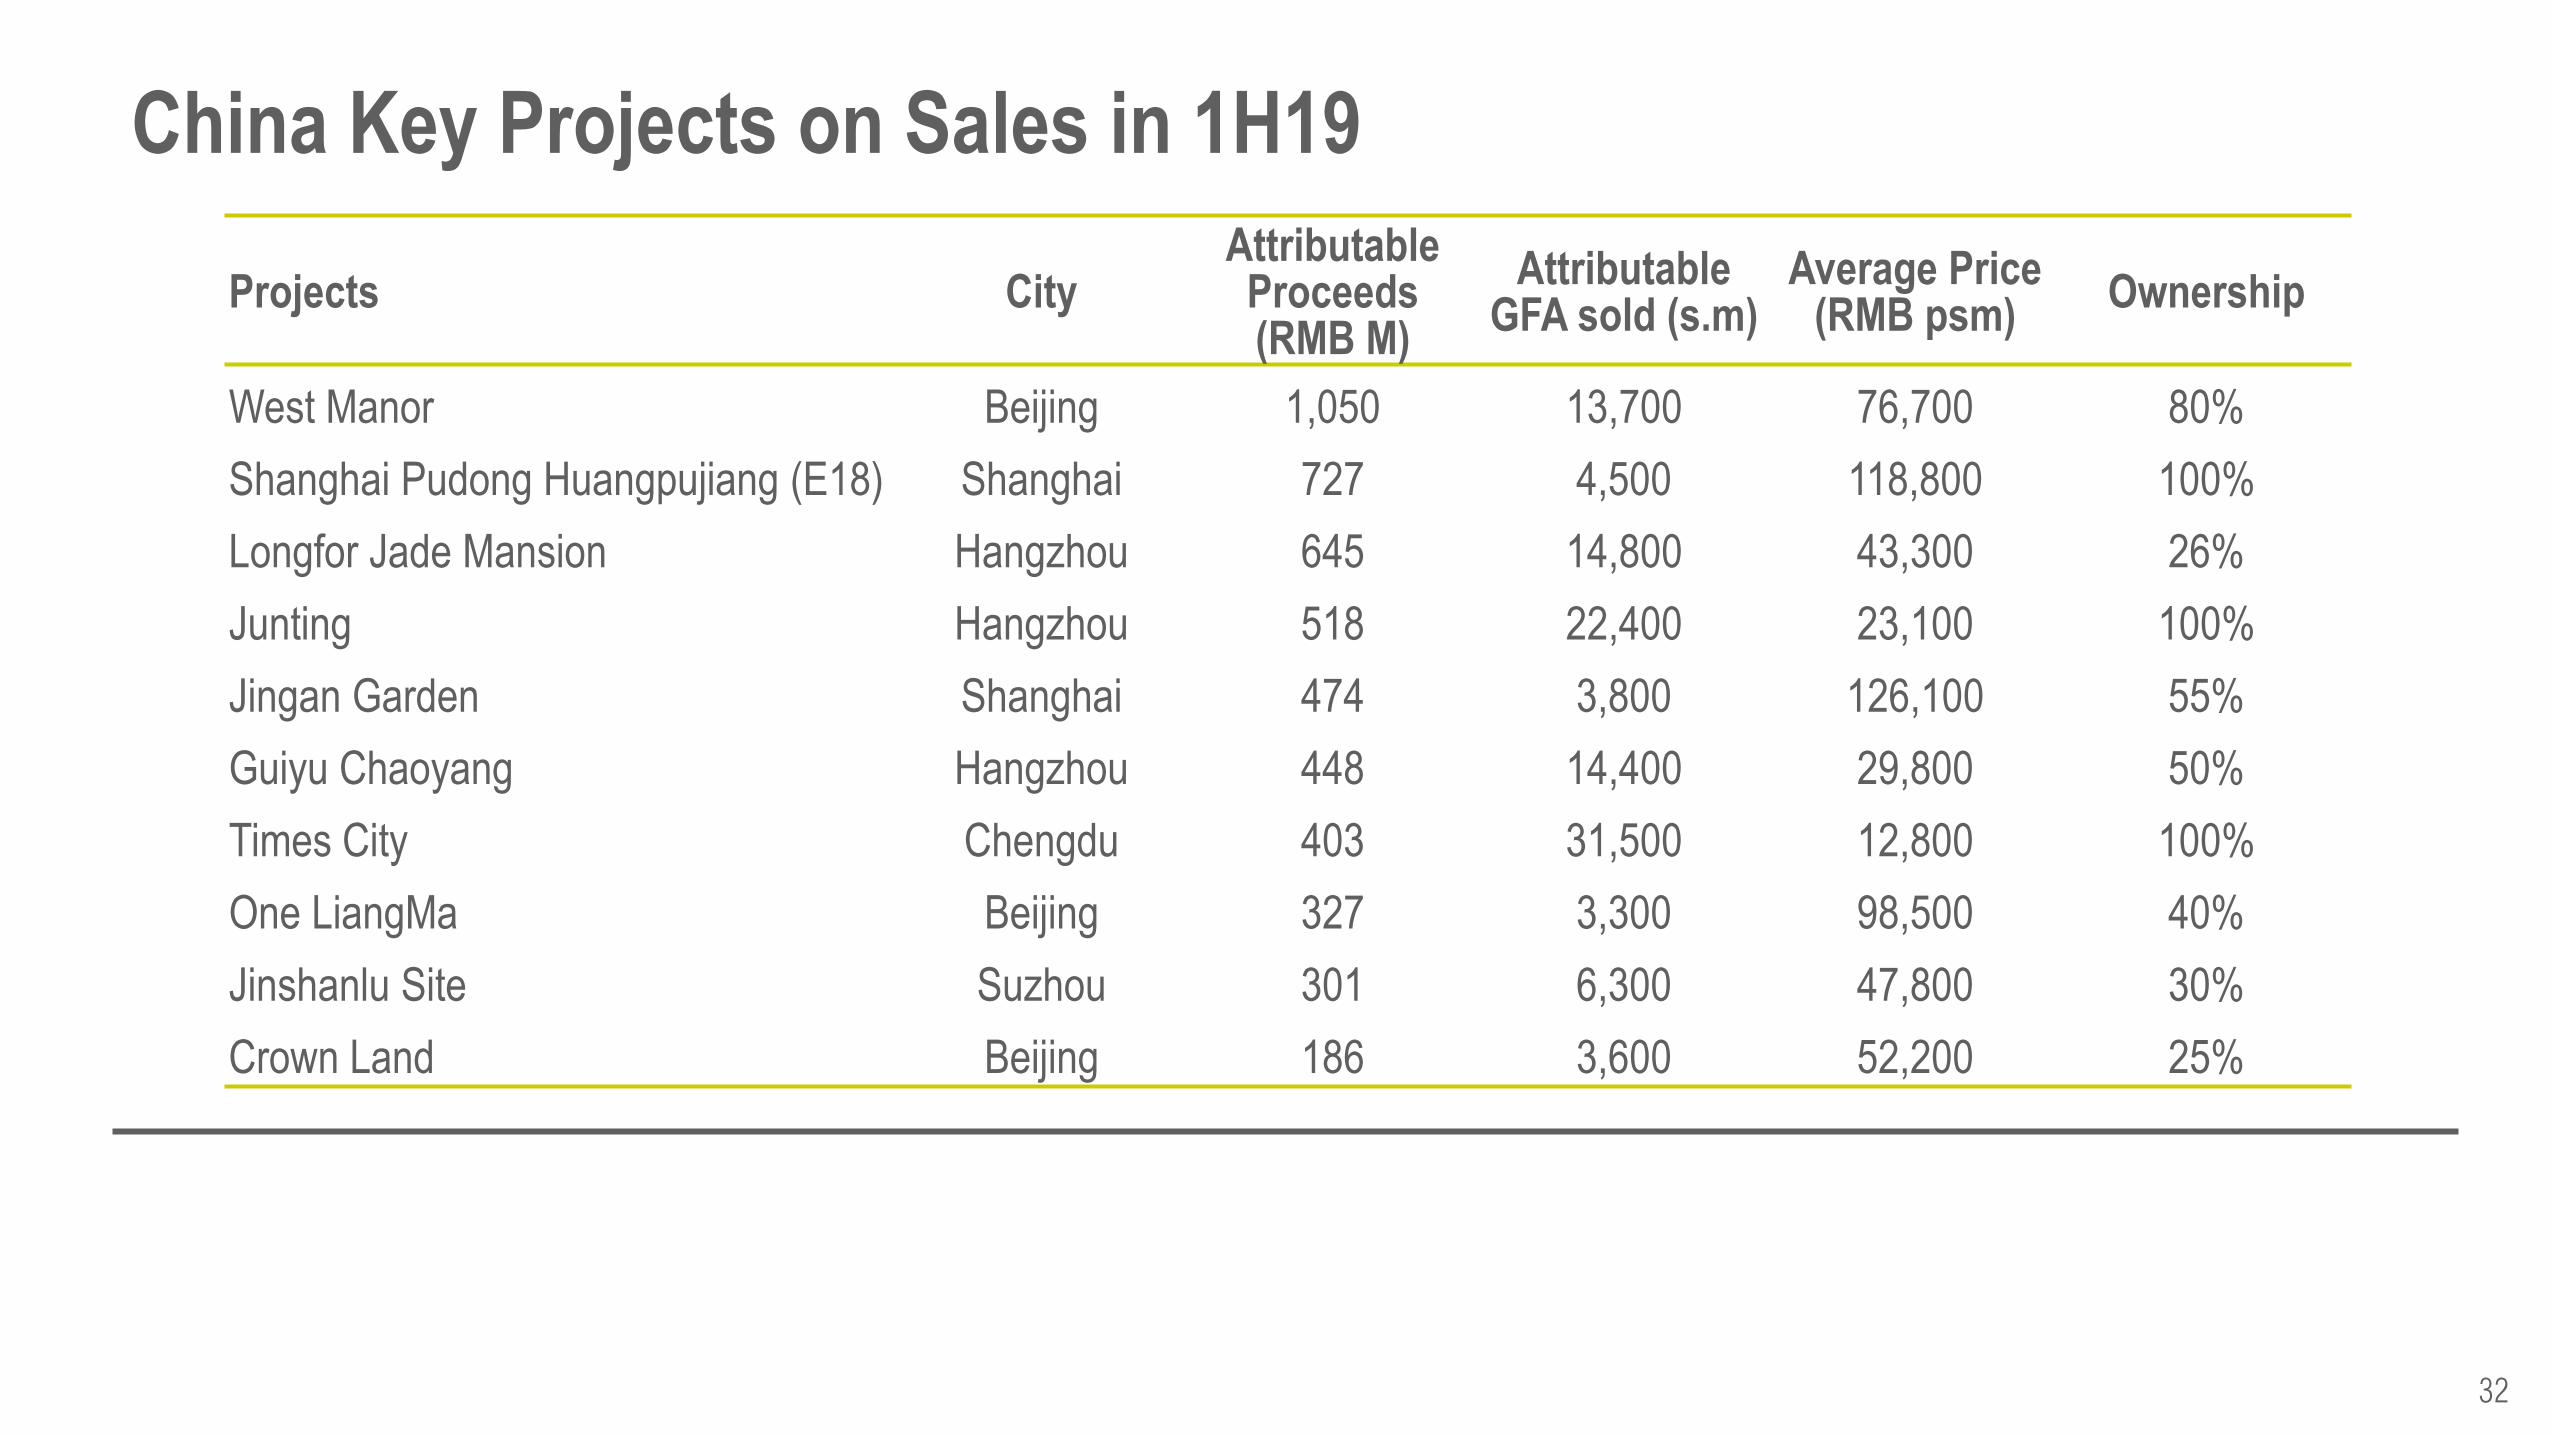
China Key Projects on Sales in 1H19
Projects City Attributable Proceeds (RMB M)
Attributable GFA sold (s.m)
Average Price (RMB psm)
Ownership
West Manor Beijing 1,050 13,700 76,700 80%
Shanghai Pudong Huangpujiang (E18) Shanghai 727 4,500 118,800 100%
Longfor Jade Mansion Hangzhou 645 14,800 43,300 26%
Junting Hangzhou 518 22,400 23,100 100%
Jingan Garden Shanghai 474 3,800 126,100 55%
Guiyu Chaoyang Hangzhou 448 14,400 29,800 50%
Times City Chengdu 403 31,500 12,800 100%
One LiangMa Beijing 327 3,300 98,500 40%
Jinshanlu Site Suzhou 301 6,300 47,800 30%
Crown Land Beijing 186 3,600 52,200 25%
33
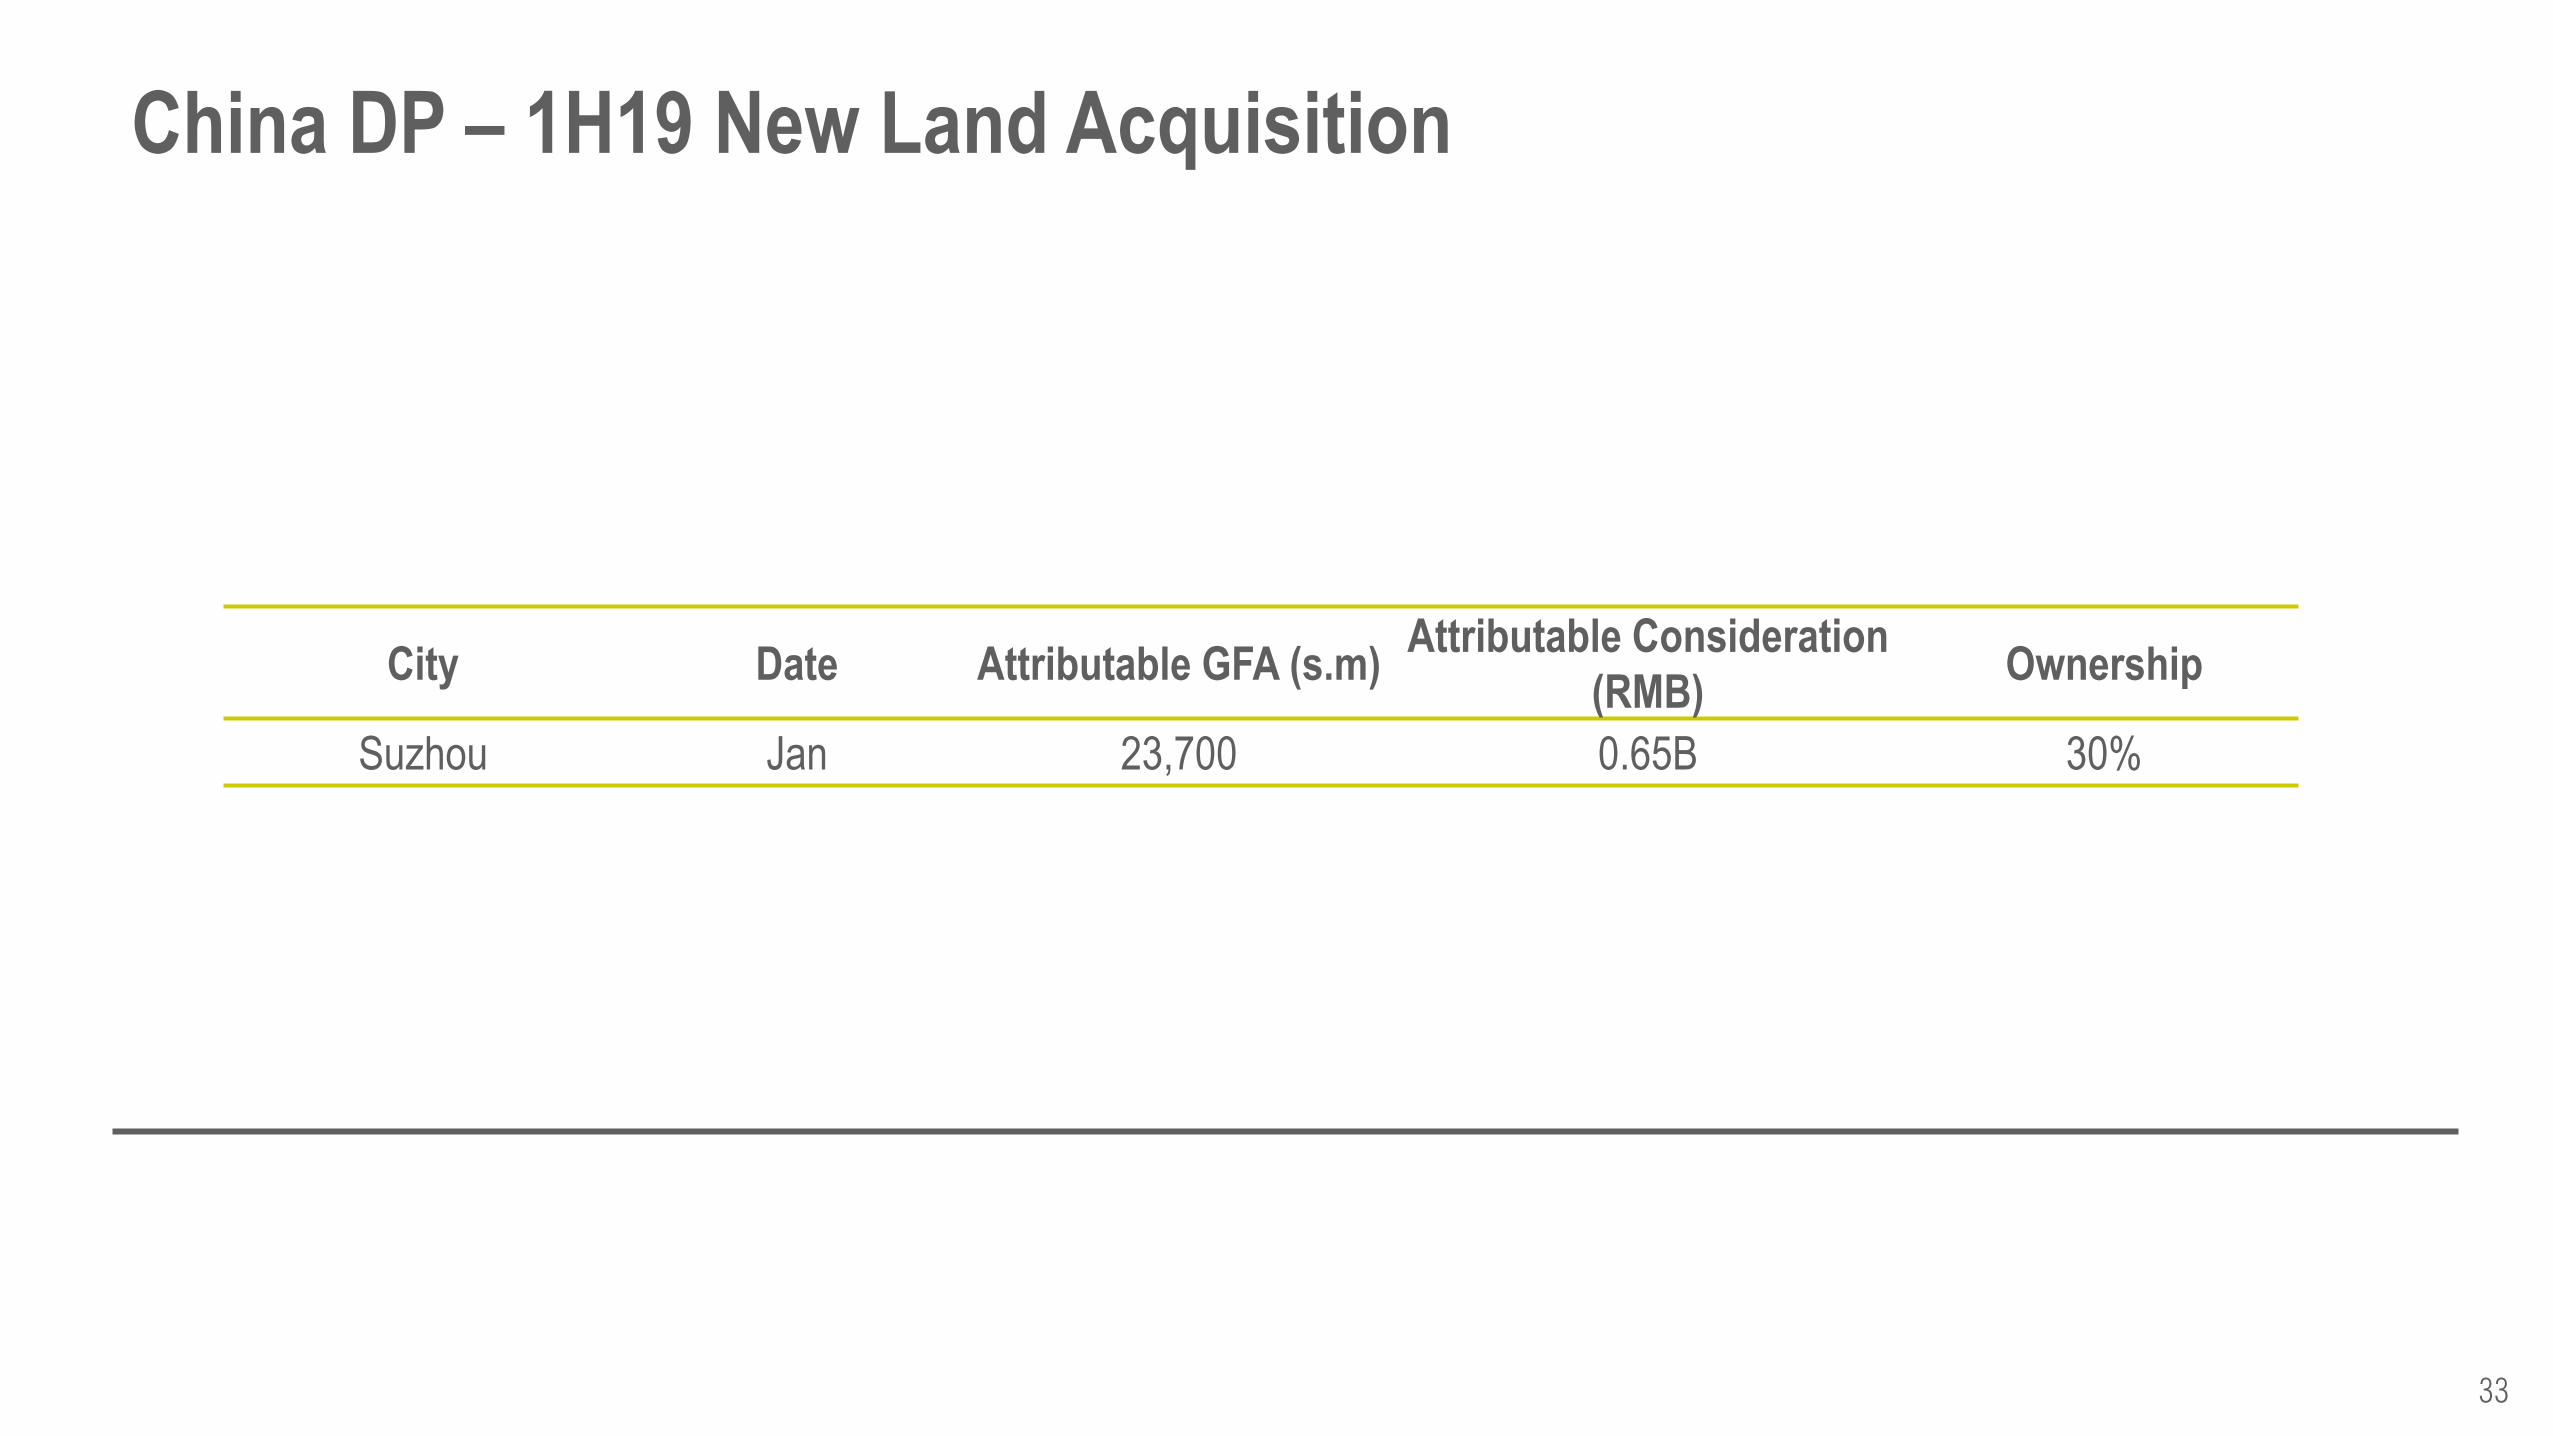
China DP – 1H19 New Land Acquisition
City Date Attributable GFA (s.m) Attributable Consideration
(RMB) Ownership
Suzhou Jan 23,700 0.65B 30%
34
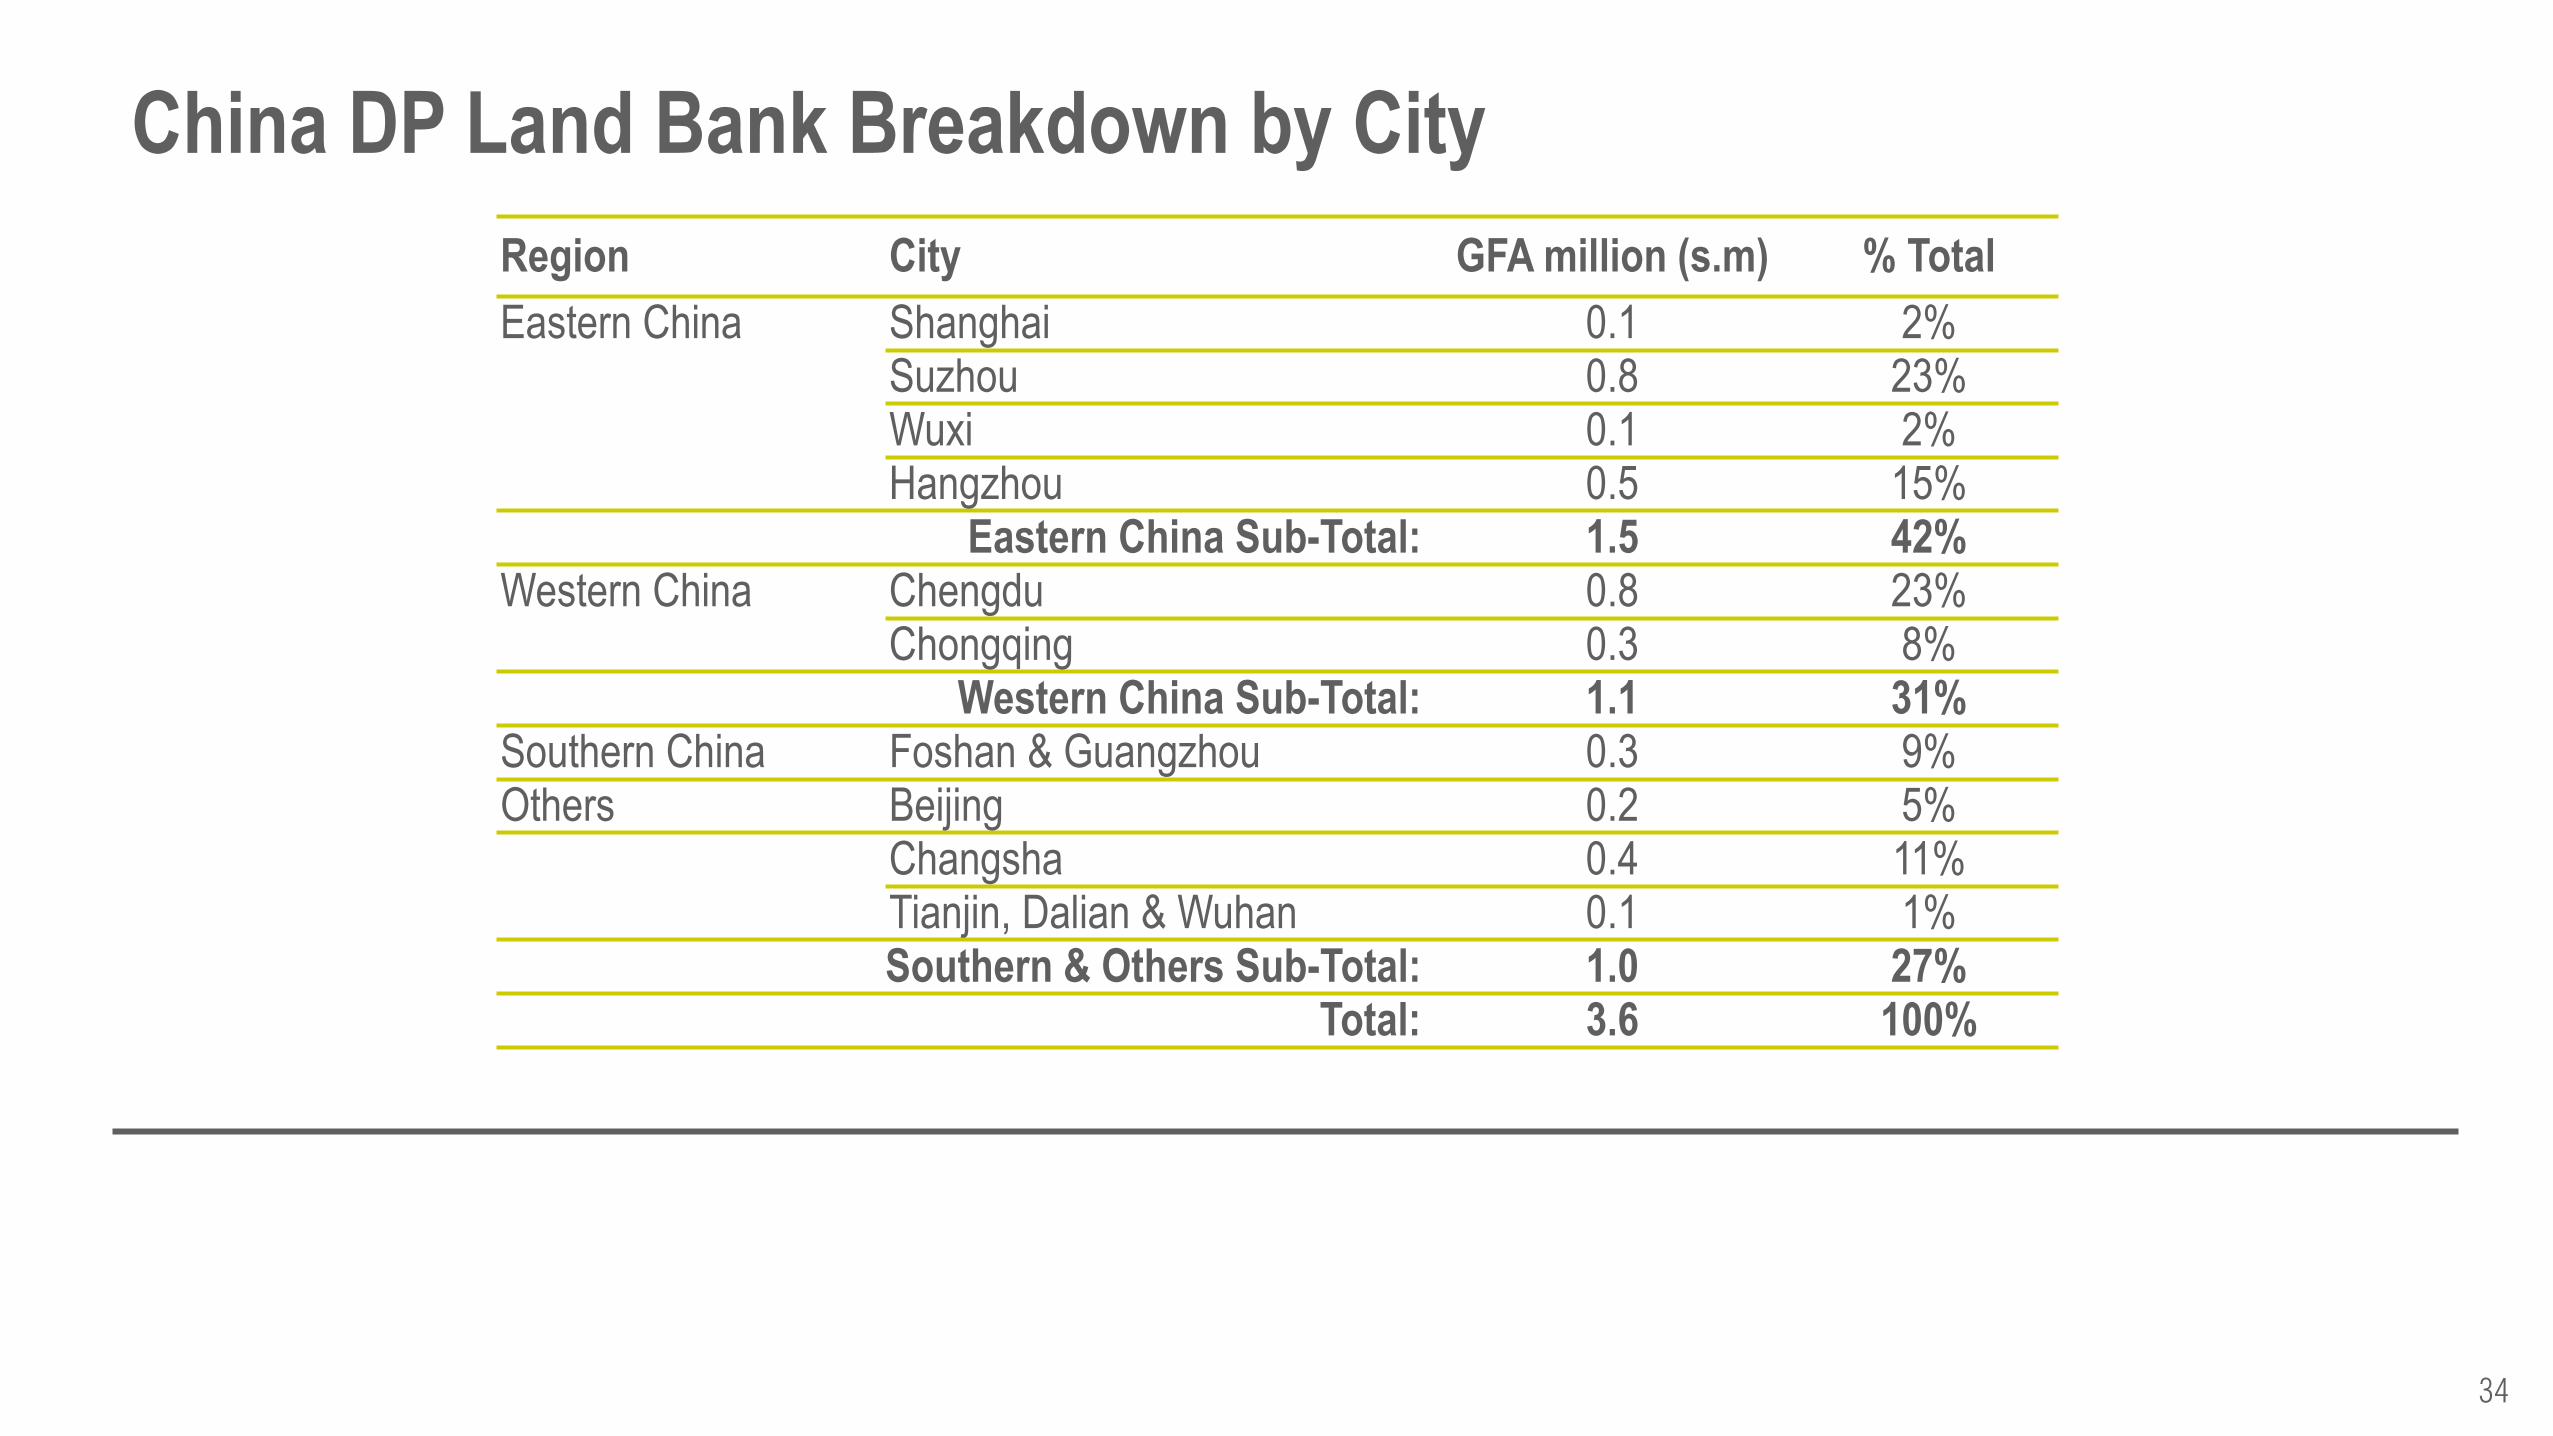
China DP Land Bank Breakdown by City
Region City GFA million (s.m) % Total
Eastern China Shanghai 0.1 2% Suzhou 0.8 23% Wuxi 0.1 2% Hangzhou 0.5 15%
Eastern China Sub-Total: 1.5 42% Western China Chengdu 0.8 23%
Chongqing 0.3 8% Western China Sub-Total: 1.1 31%
Southern China Foshan & Guangzhou 0.3 9% Others Beijing 0.2 5%
Changsha 0.4 11% Tianjin, Dalian & Wuhan 0.1 1% Southern & Others Sub-Total: 1.0 27%
Total: 3.6 100%
35
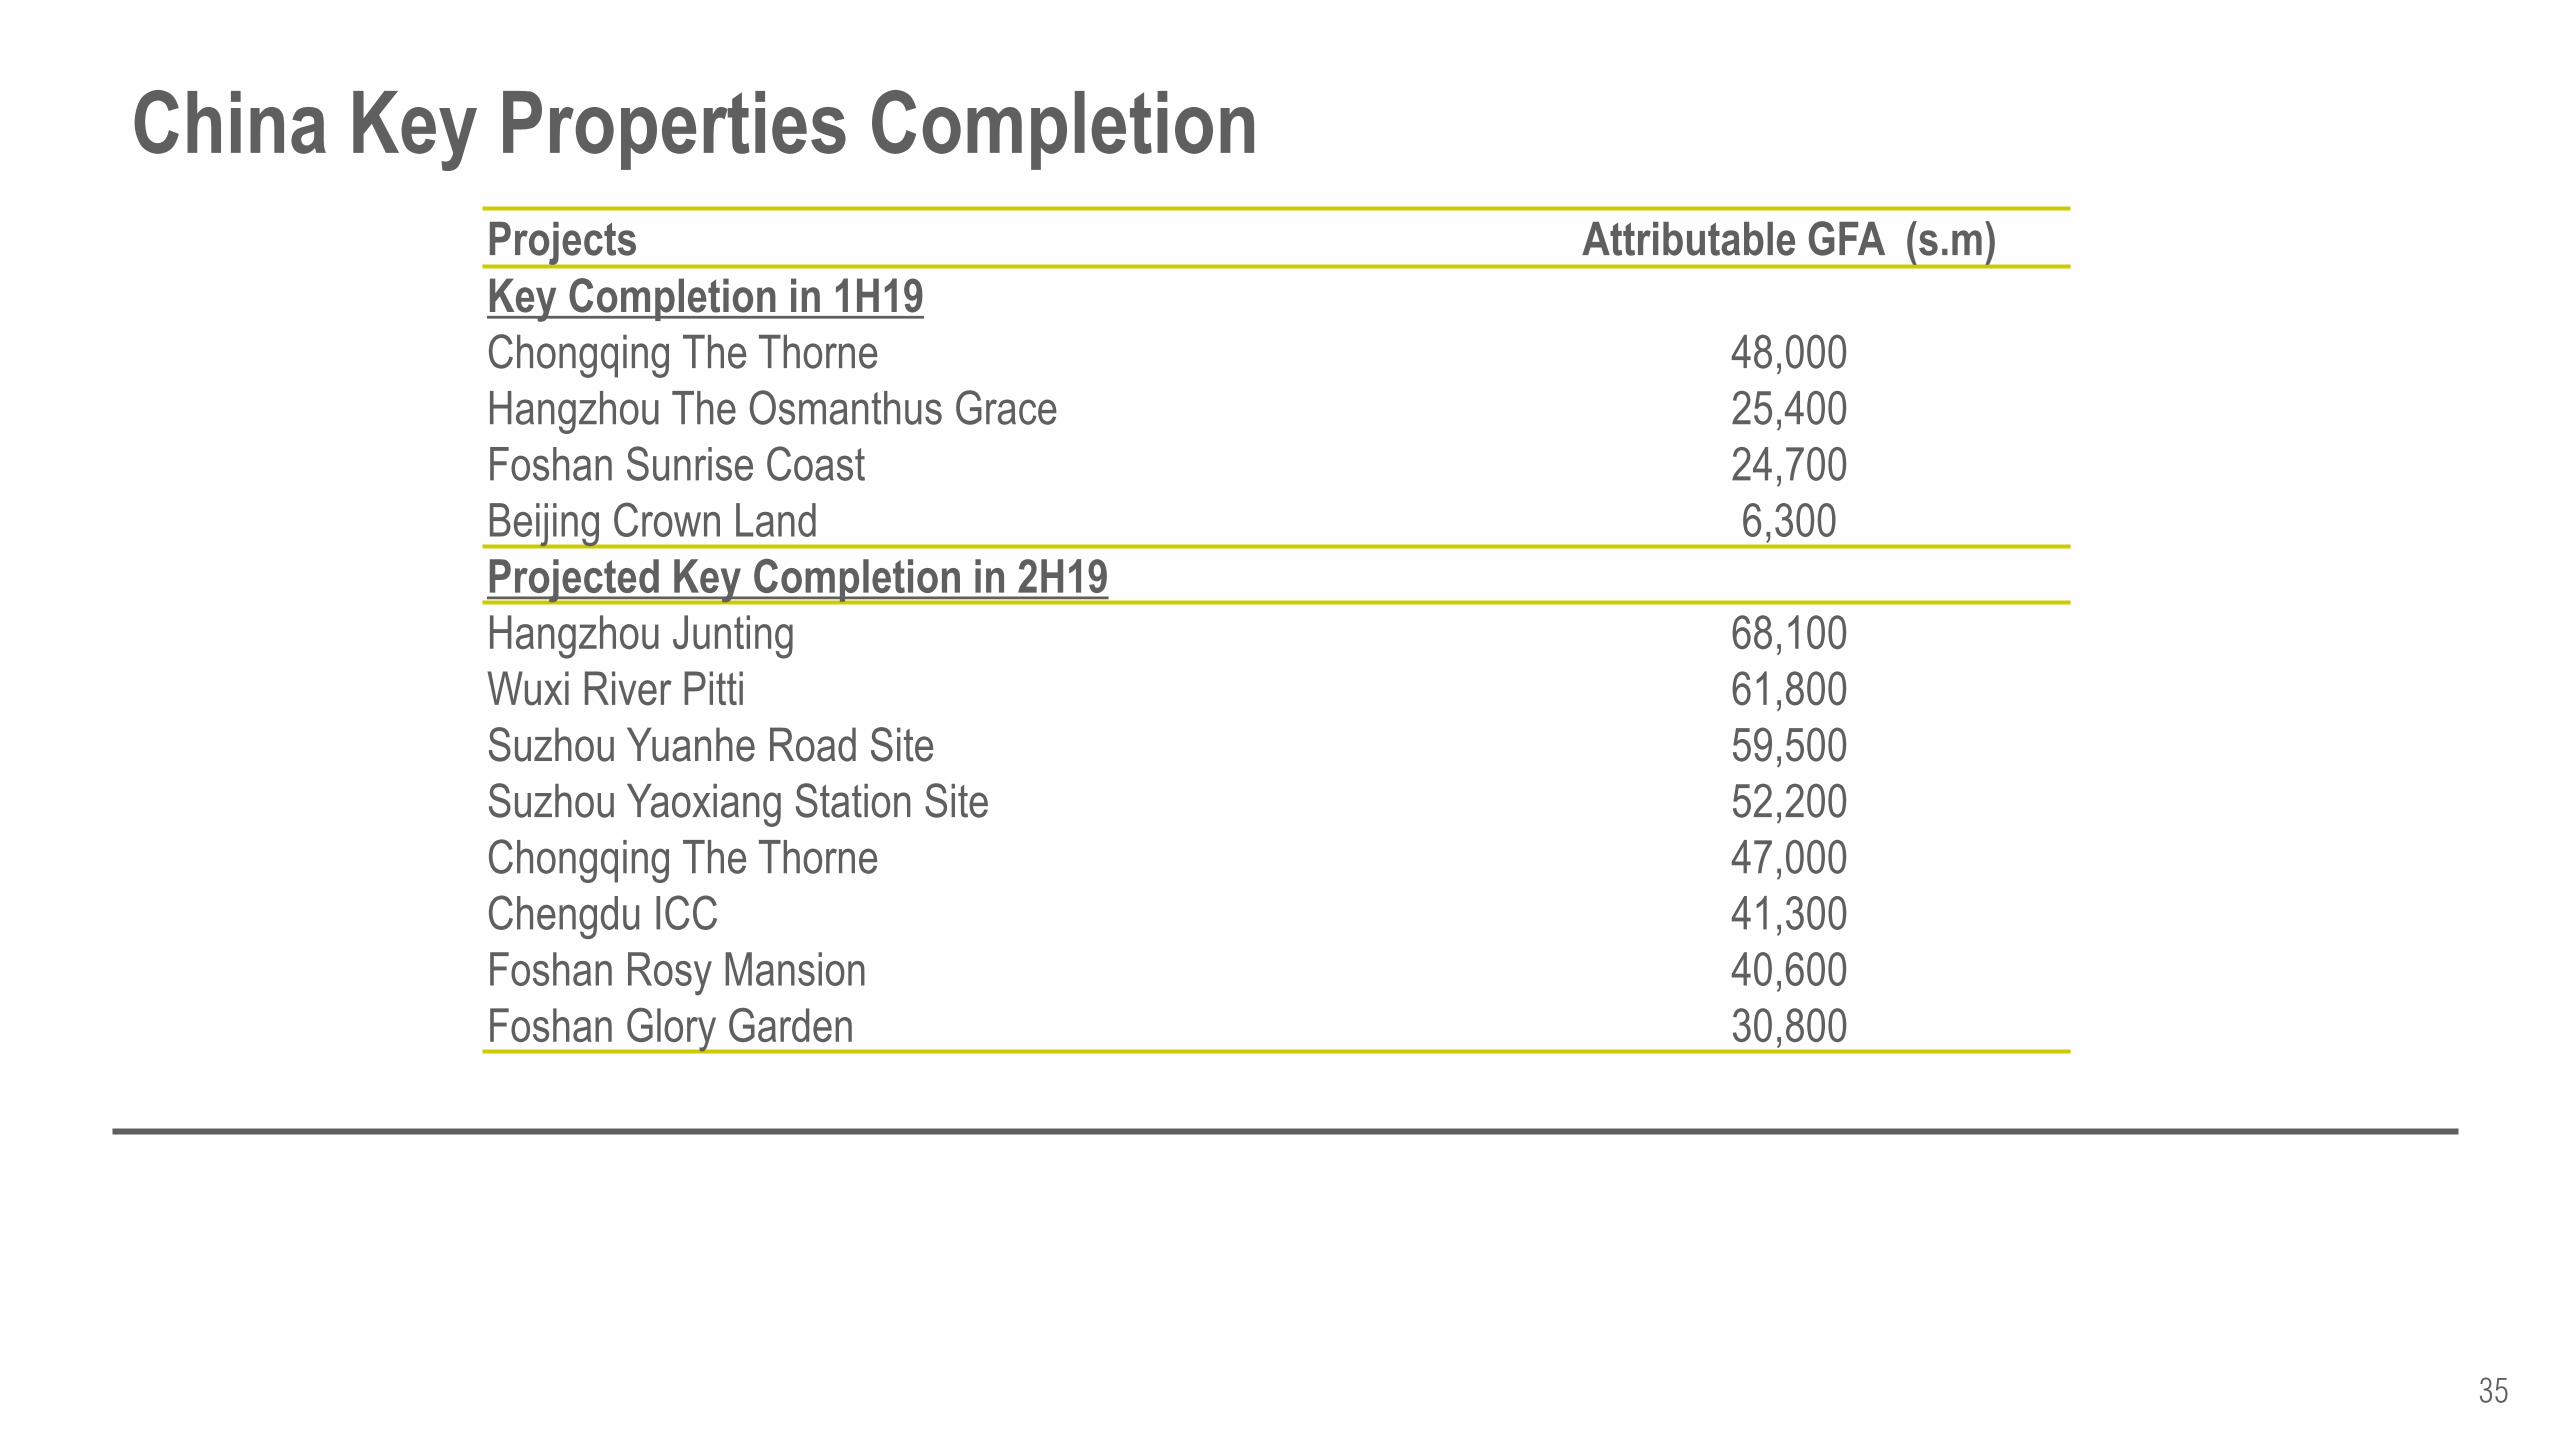
China Key Properties Completion
Projects Attributable GFA (s.m)
Key Completion in 1H19
Chongqing The Thorne 48,000
Hangzhou The Osmanthus Grace 25,400
Foshan Sunrise Coast 24,700
Beijing Crown Land 6,300
Projected Key Completion in 2H19
Hangzhou Junting 68,100
Wuxi River Pitti 61,800
Suzhou Yuanhe Road Site 59,500
Suzhou Yaoxiang Station Site 52,200
Chongqing The Thorne 47,000
Chengdu ICC 41,300
Foshan Rosy Mansion 40,600
Foshan Glory Garden 30,800
36
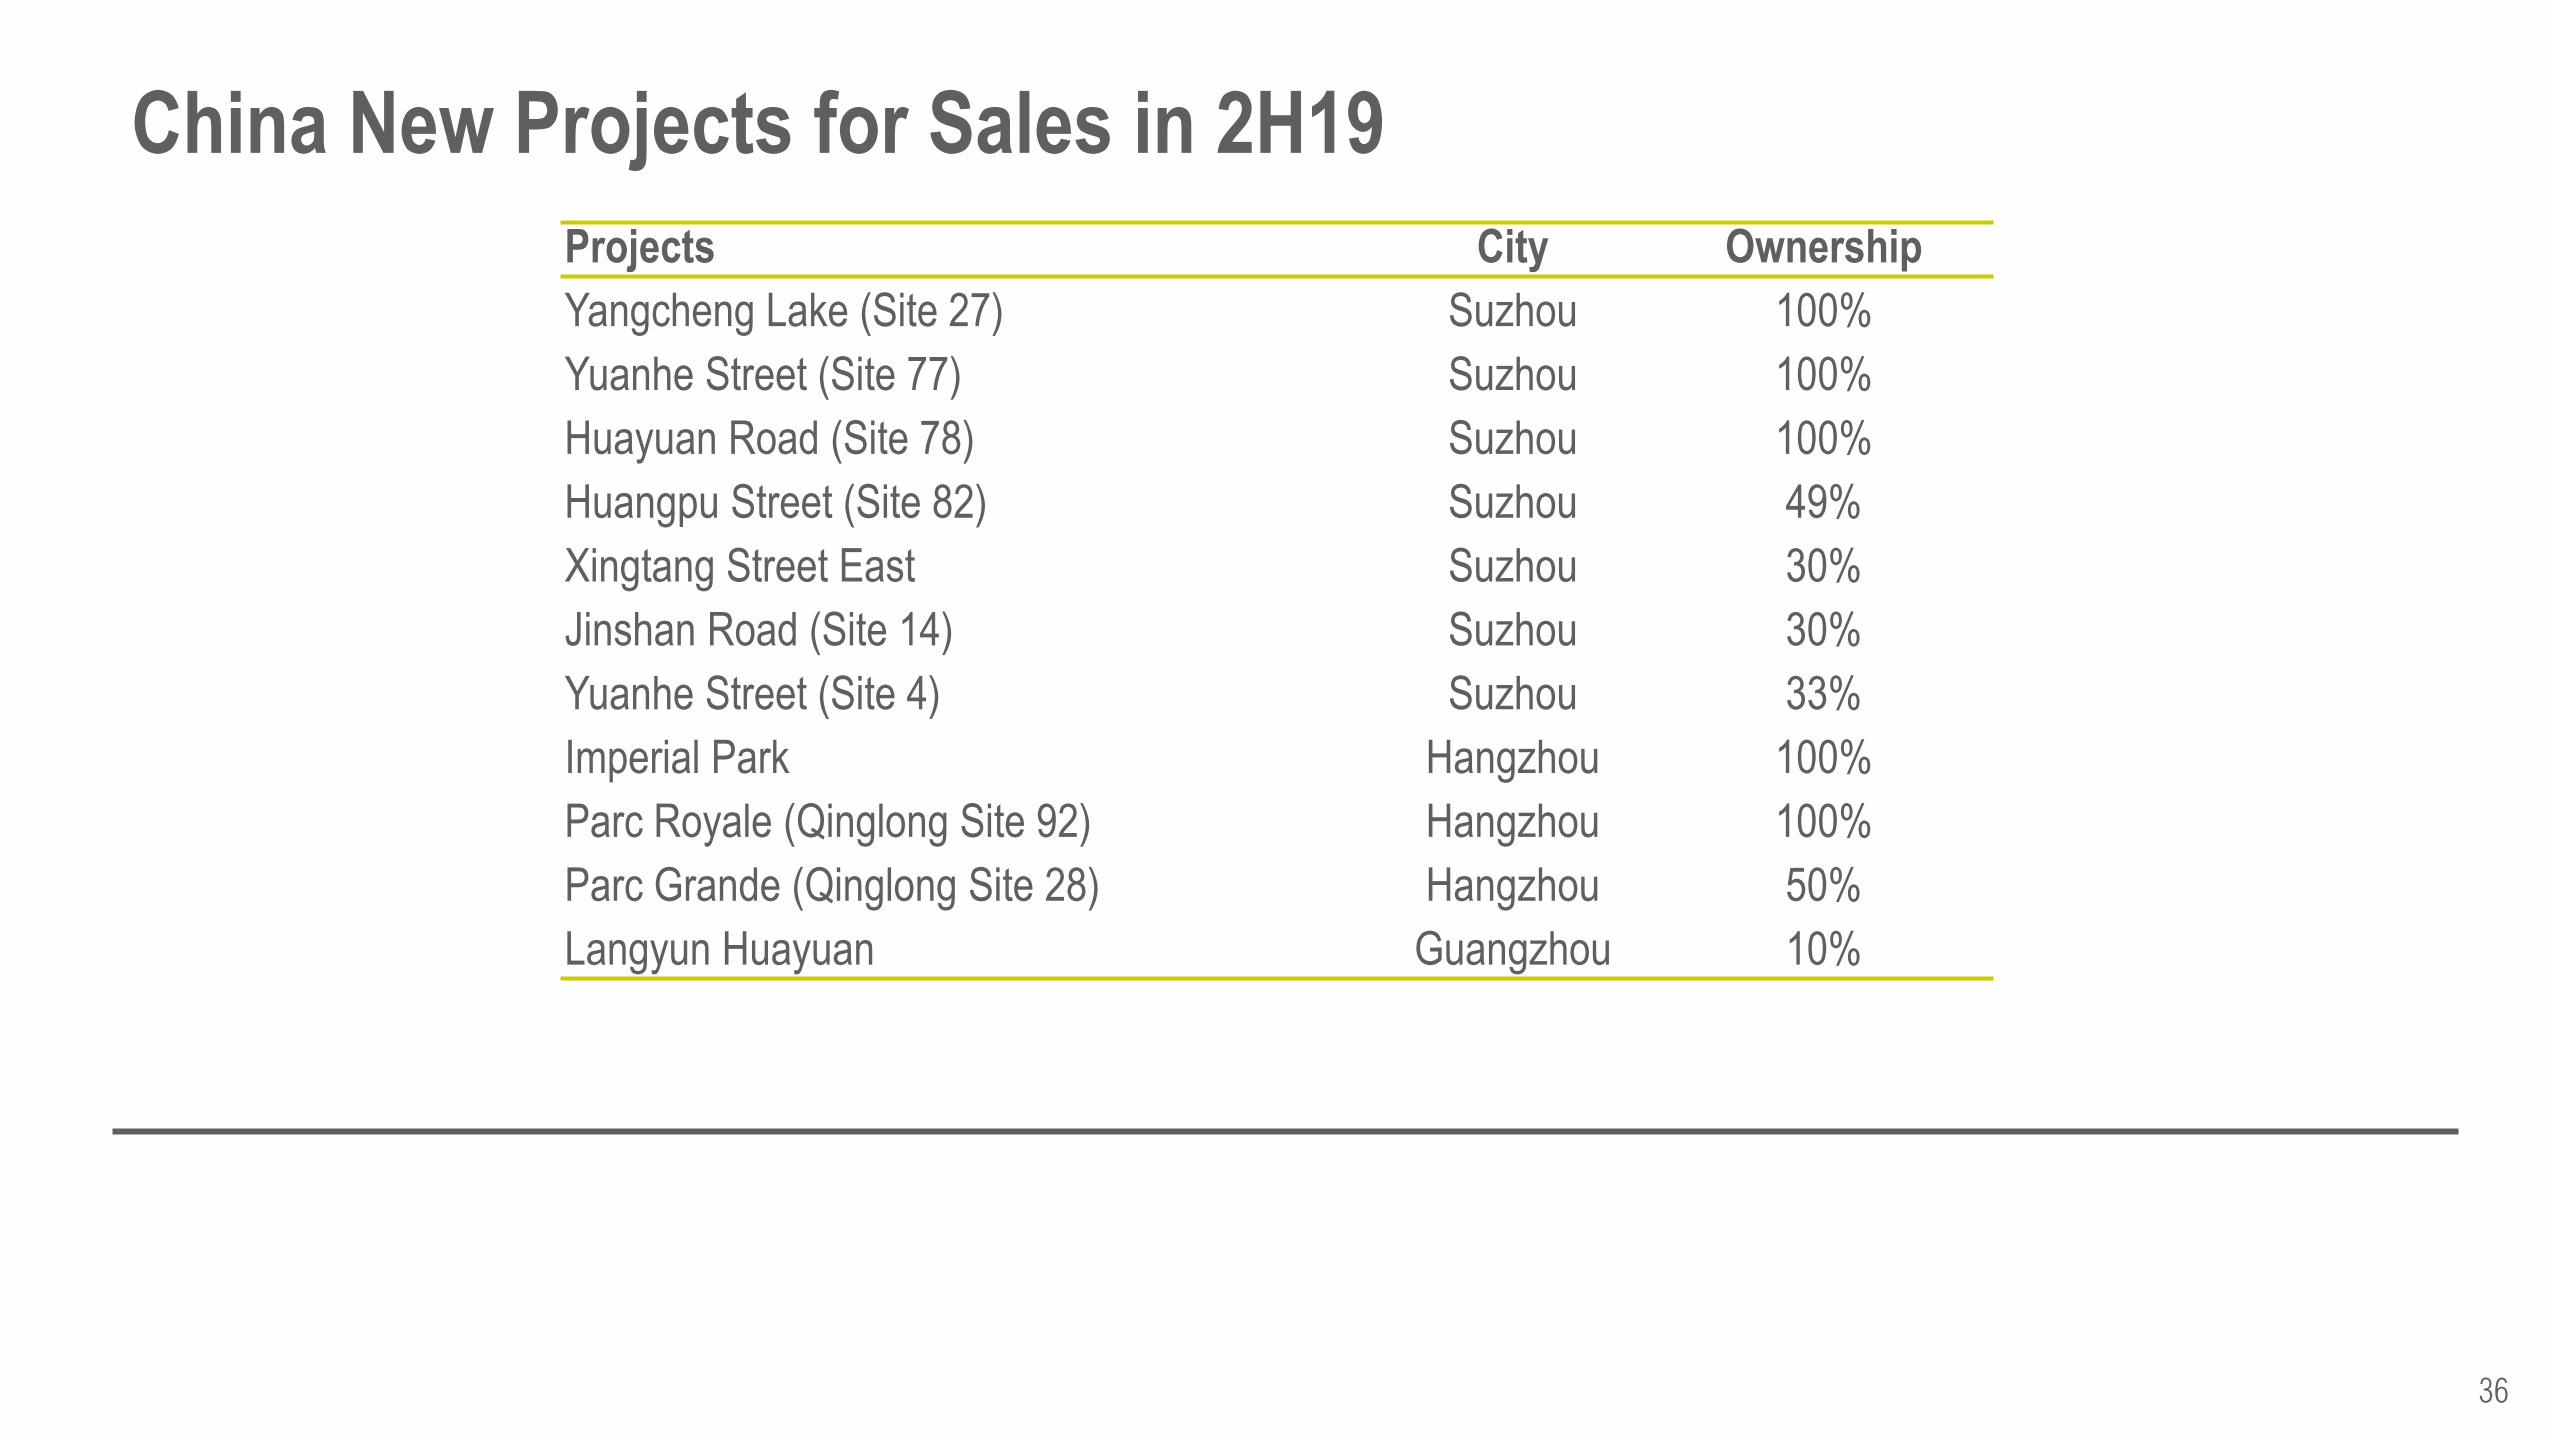
China New Projects for Sales in 2H19
Projects City Ownership
Yangcheng Lake (Site 27) Suzhou 100%
Yuanhe Street (Site 77) Suzhou 100%
Huayuan Road (Site 78) Suzhou 100%
Huangpu Street (Site 82) Suzhou 49%
Xingtang Street East Suzhou 30%
Jinshan Road (Site 14) Suzhou 30%
Yuanhe Street (Site 4) Suzhou 33%
Imperial Park Hangzhou 100%
Parc Royale (Qinglong Site 92) Hangzhou 100%
Parc Grande (Qinglong Site 28) Hangzhou 50%
Langyun Huayuan Guangzhou 10%
37
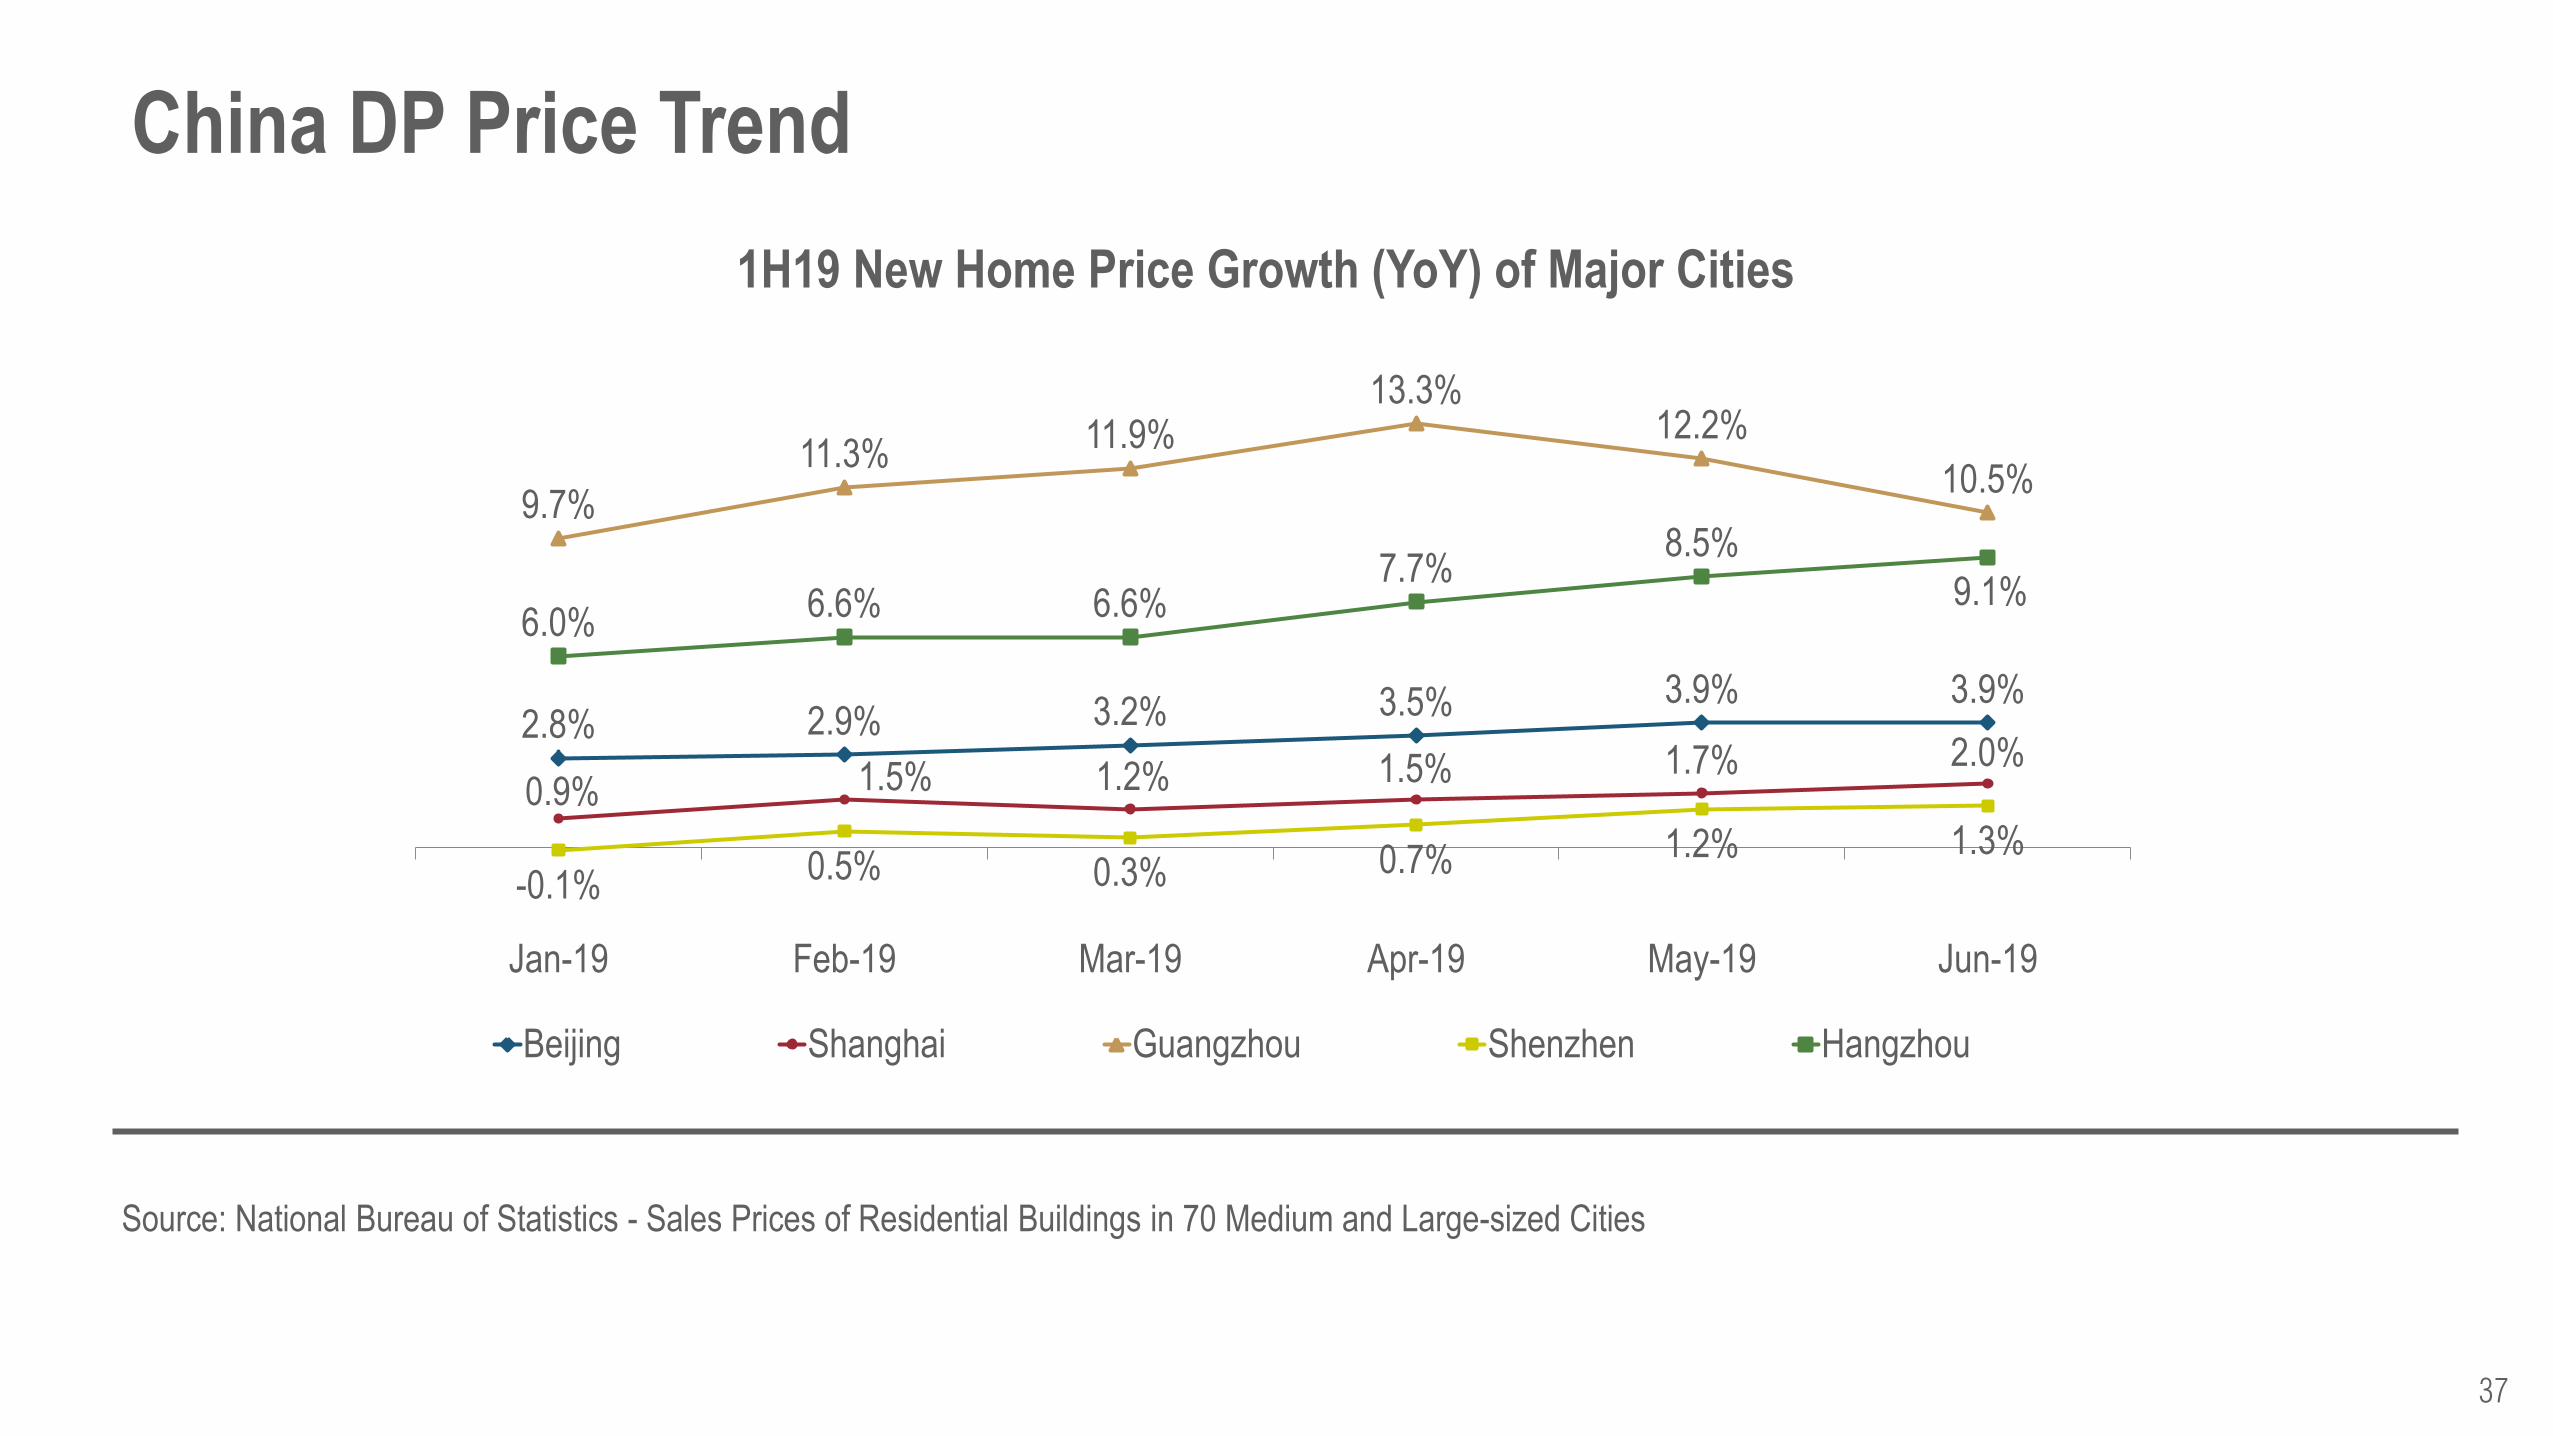
China DP Price Trend
2.8% 2.9% 3.2% 3.5% 3.9% 3.9%
0.9% 1.5% 1.2% 1.5% 1.7% 2.0%
9.7%
11.3% 11.9%
13.3% 12.2%
10.5%
-0.1% 0.5% 0.3% 0.7% 1.2% 1.3%
6.0% 6.6% 6.6%
7.7% 8.5%
9.1%
Jan-19 Feb-19 Mar-19 Apr-19 May-19 Jun-19
1H19 New Home Price Growth (YoY) of Major Cities
Beijing Shanghai Guangzhou Shenzhen Hangzhou
Source: National Bureau of Statistics - Sales Prices of Residential Buildings in 70 Medium and Large-sized Cities
38
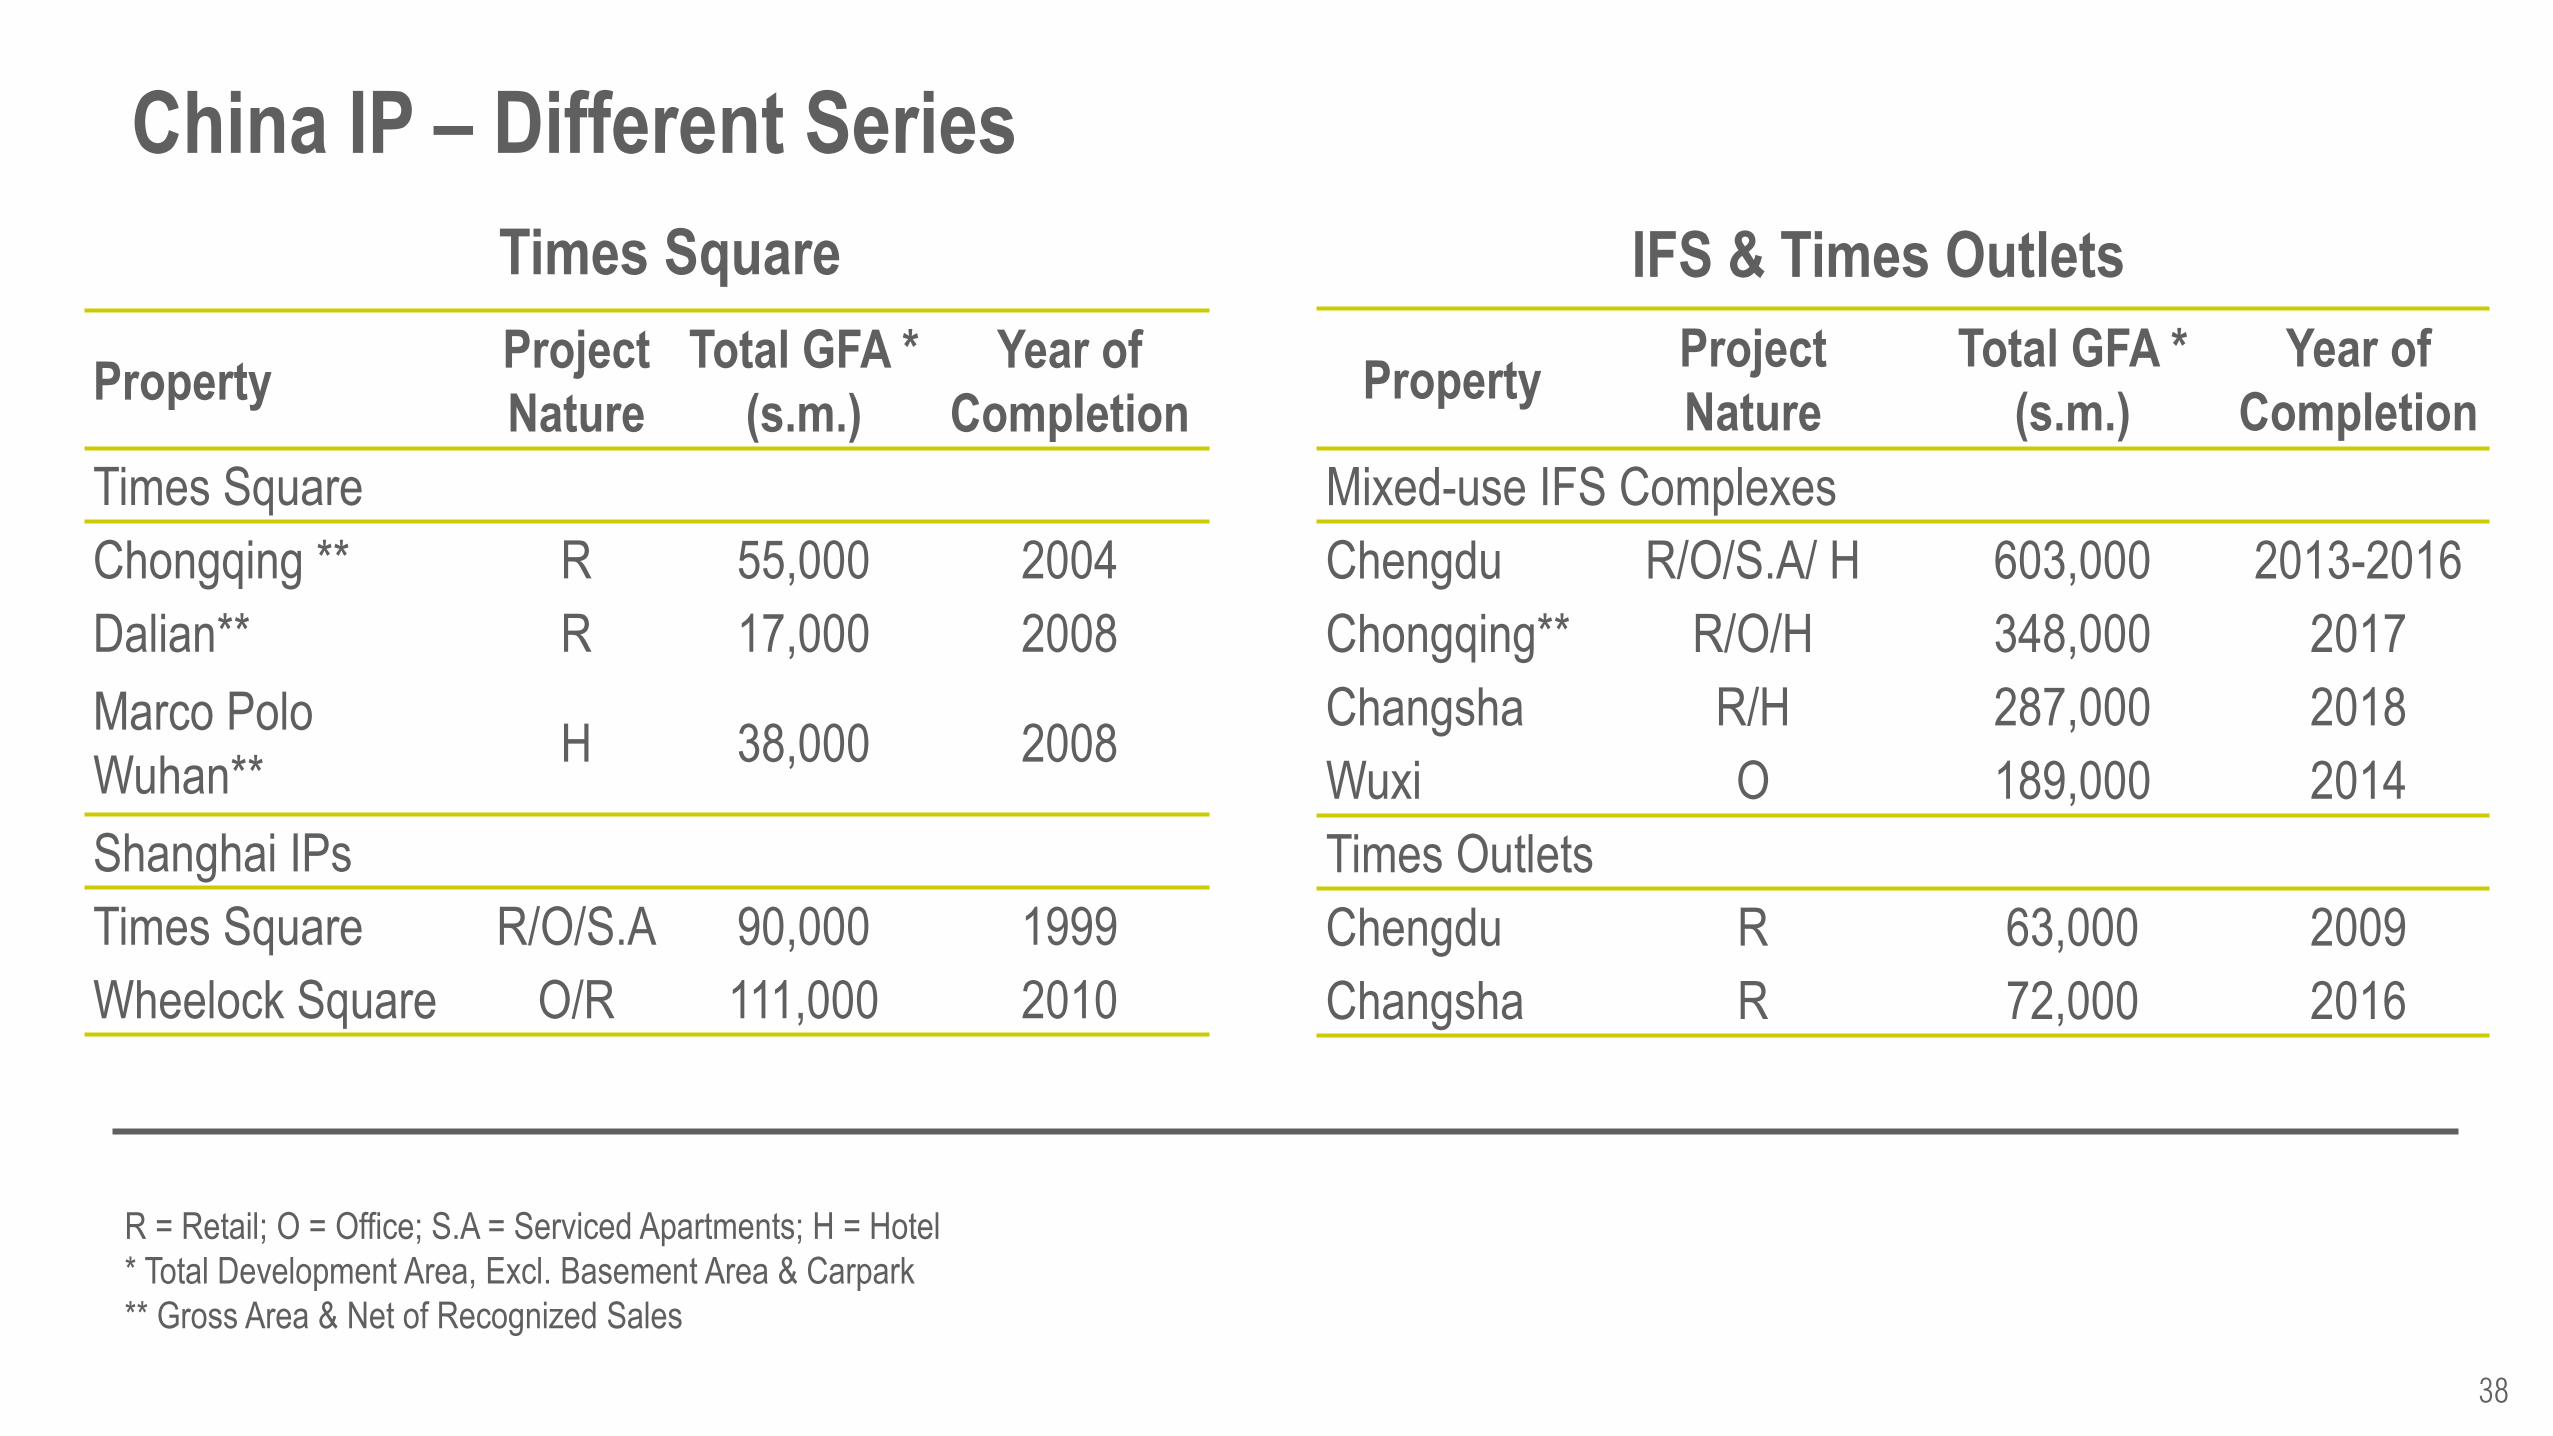
China IP – Different Series
Property Project
Nature
Total GFA *
(s.m.)
Year of
Completion
Times Square
Chongqing ** R 55,000 2004
Dalian** R 17,000 2008
Marco Polo
Wuhan** H 38,000 2008
Shanghai IPs
Times Square R/O/S.A 90,000 1999
Wheelock Square O/R 111,000 2010
R = Retail; O = Office; S.A = Serviced Apartments; H = Hotel
* Total Development Area, Excl. Basement Area & Carpark
** Gross Area & Net of Recognized Sales
Times Square
Property Project
Nature
Total GFA *
(s.m.)
Year of
Completion
Mixed-use IFS Complexes
Chengdu R/O/S.A/ H 603,000 2013-2016
Chongqing** R/O/H 348,000 2017
Changsha R/H 287,000 2018
Wuxi O 189,000 2014
Times Outlets
Chengdu R 63,000 2009
Changsha R 72,000 2016
IFS & Times Outlets
39
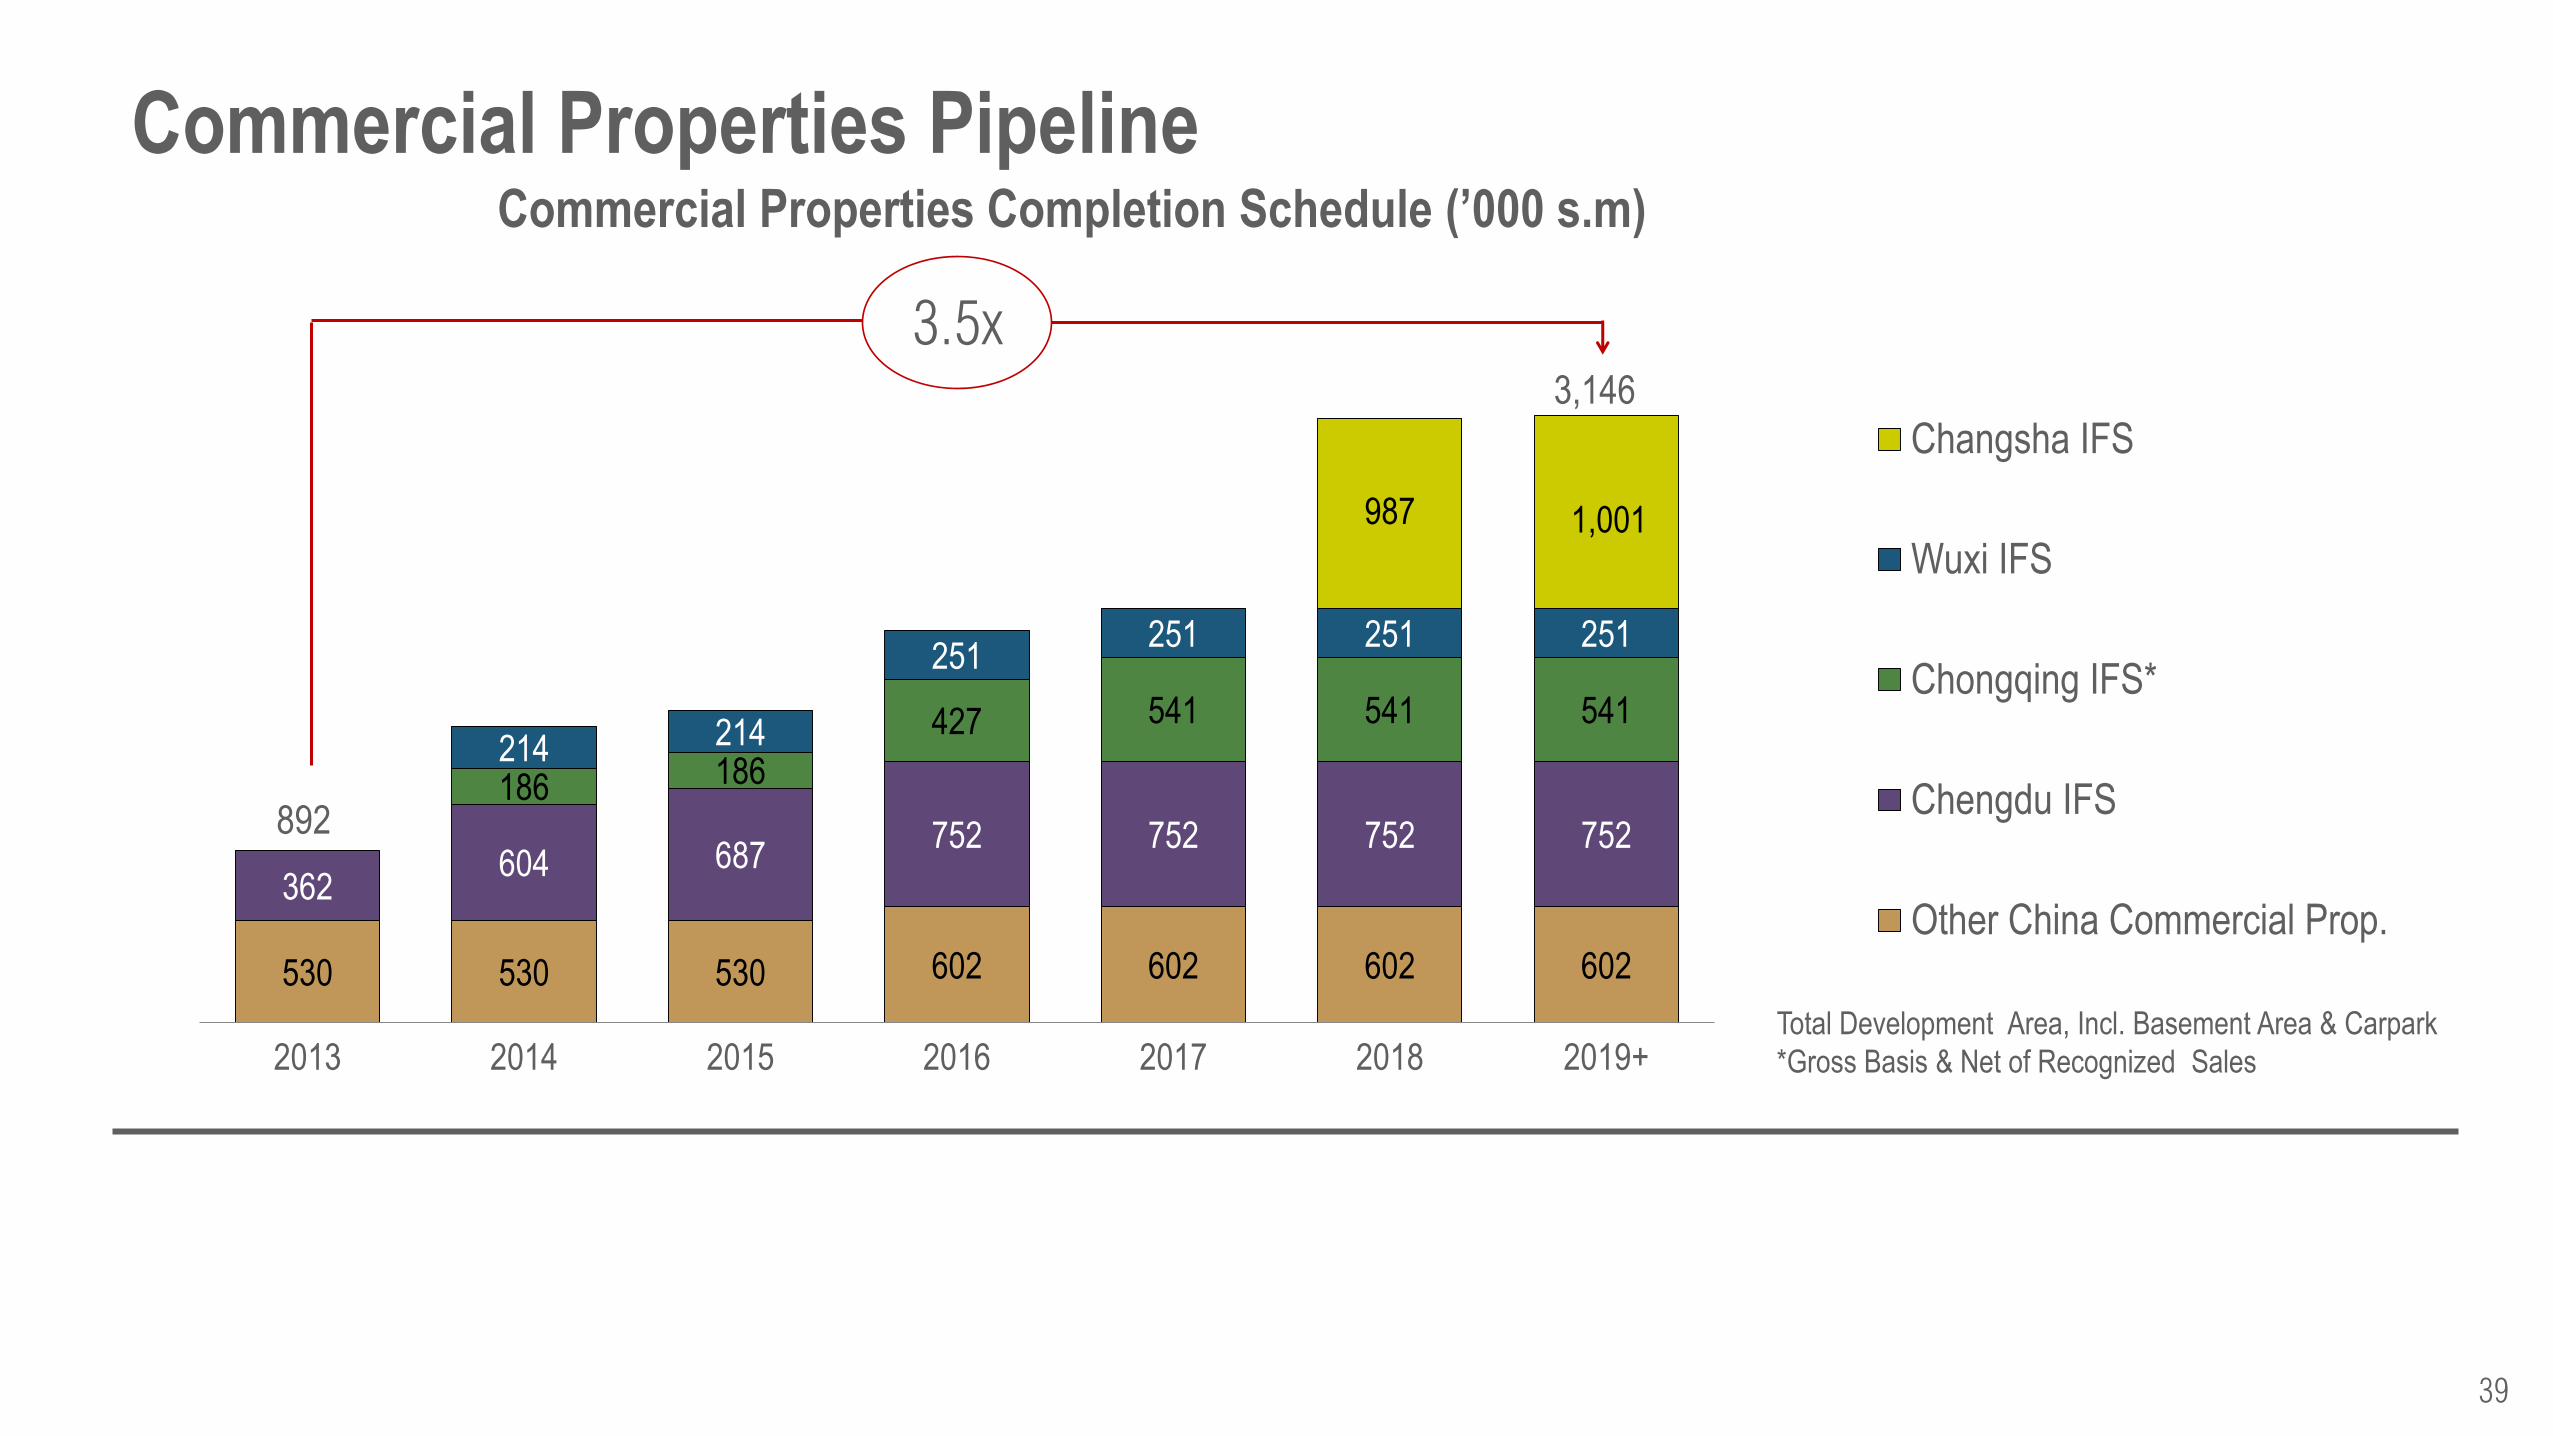
Commercial Properties Pipeline
530 530 530 602 602 602 602
362 604 687
752 752 752 752
186 186
427 541 541 541 214 214
251 251 251 251
987 1,001
2013 2014 2015 2016 2017 2018 2019+
Commercial Properties Completion Schedule (’000 s.m)
Changsha IFS
Wuxi IFS
Chongqing IFS*
Chengdu IFS
Other China Commercial Prop.
3,146
Total Development Area, Incl. Basement Area & Carpark
*Gross Basis & Net of Recognized Sales
892
3.5x
40
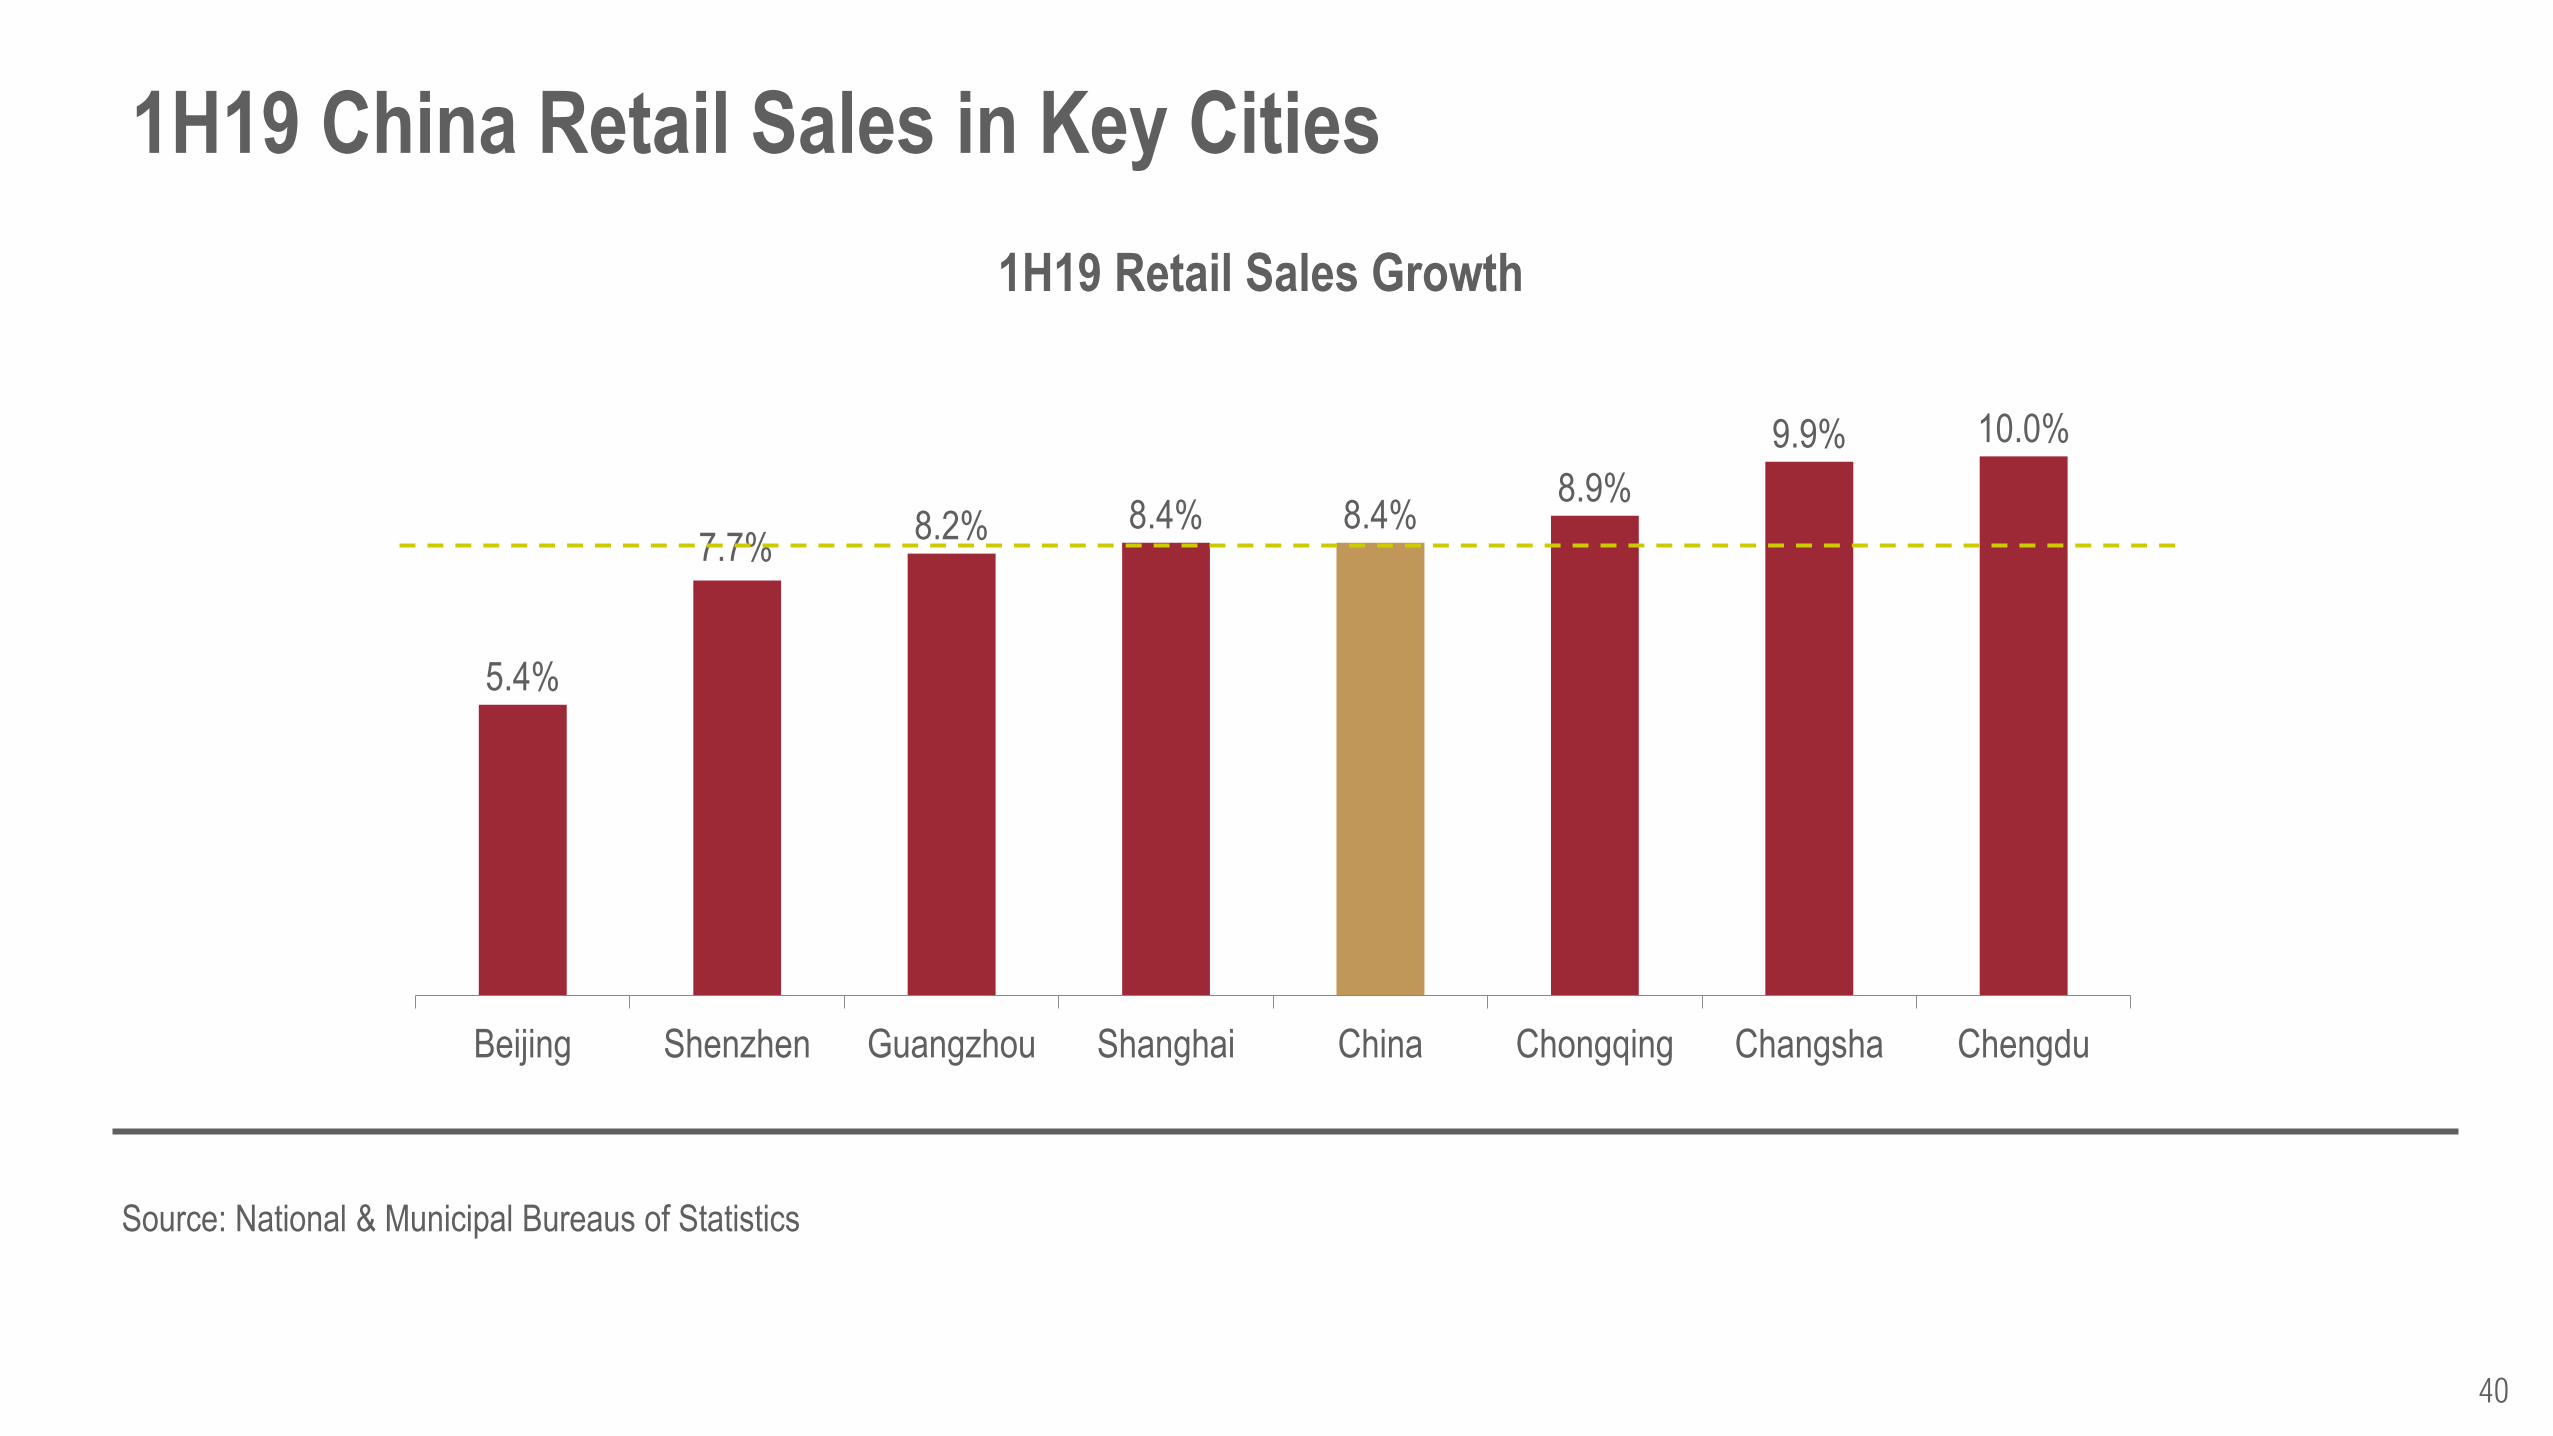
1H19 China Retail Sales in Key Cities
5.4%
7.7% 8.2% 8.4% 8.4%
8.9%
9.9% 10.0%
Beijing Shenzhen Guangzhou Shanghai China Chongqing Changsha Chengdu
1H19 Retail Sales Growth
Source: National & Municipal Bureaus of Statistics
41
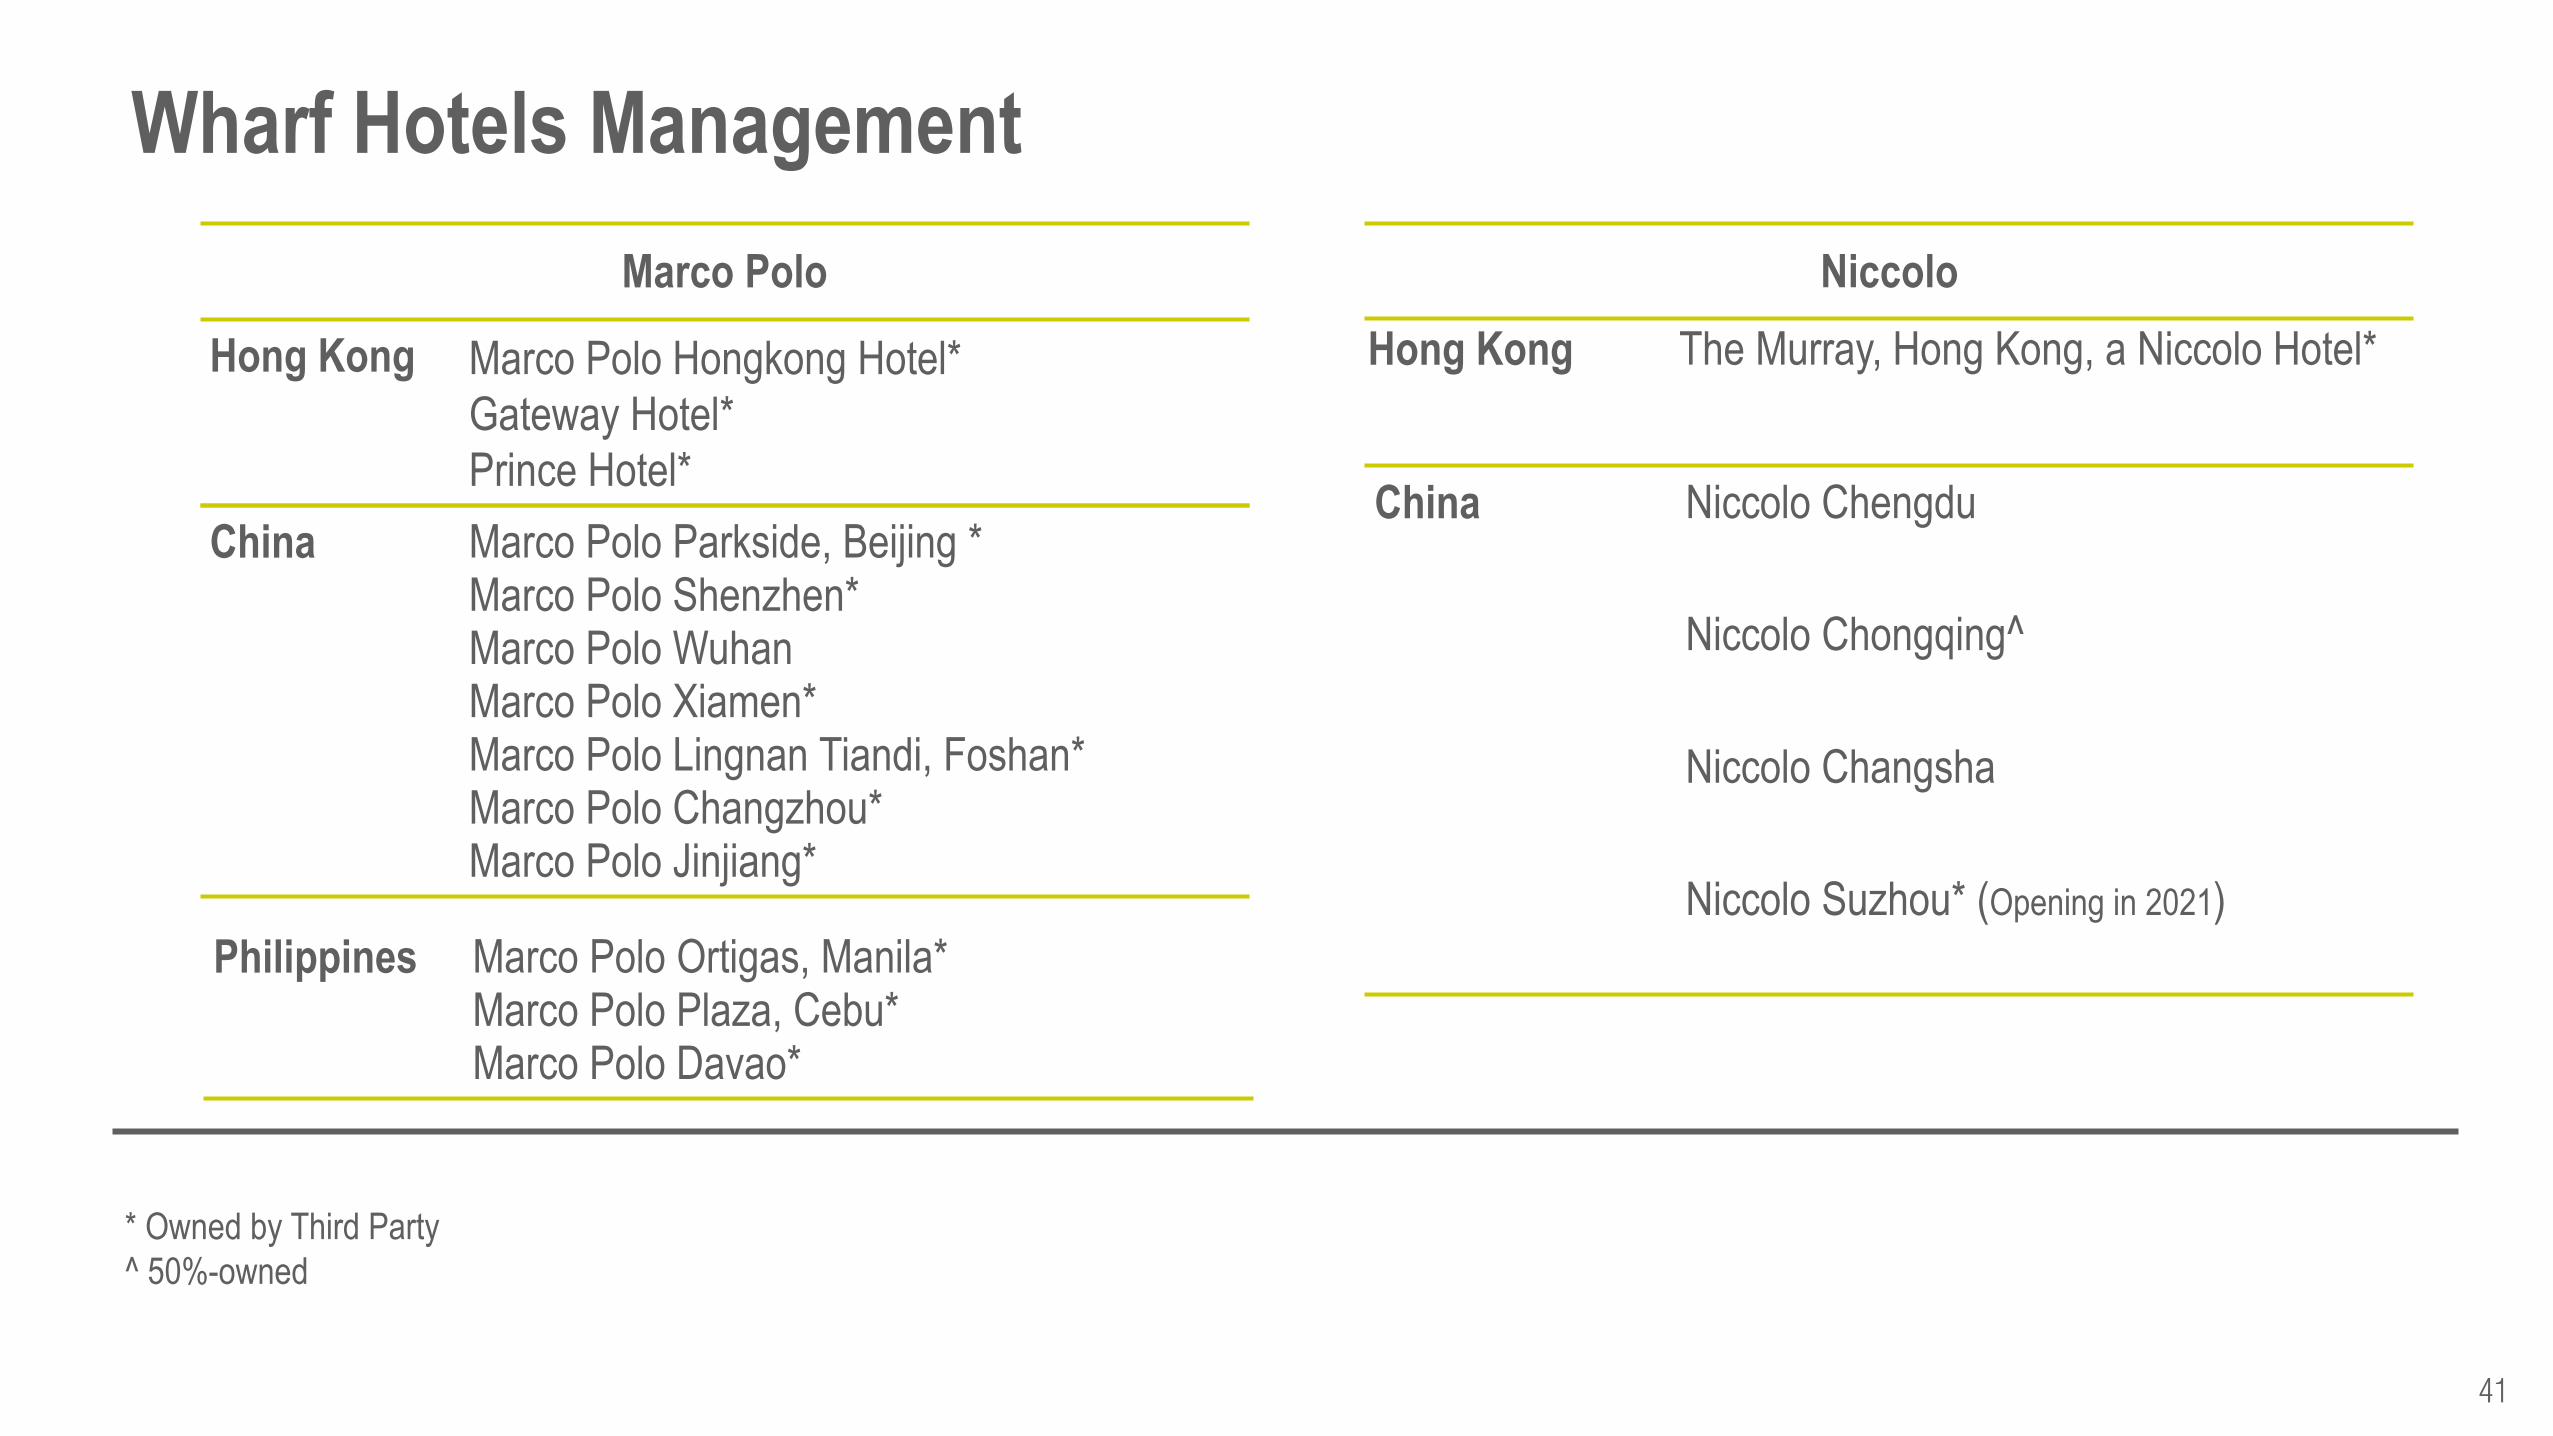
Wharf Hotels Management
Niccolo
Hong Kong The Murray, Hong Kong, a Niccolo Hotel*
China Niccolo Chengdu
Niccolo Chongqing^
Niccolo Changsha
Niccolo Suzhou* (Opening in 2021)
Marco Polo
Hong Kong Marco Polo Hongkong Hotel*
Gateway Hotel*
Prince Hotel*
China Marco Polo Parkside, Beijing * Marco Polo Shenzhen* Marco Polo Wuhan Marco Polo Xiamen* Marco Polo Lingnan Tiandi, Foshan* Marco Polo Changzhou* Marco Polo Jinjiang*
Philippines Marco Polo Ortigas, Manila* Marco Polo Plaza, Cebu* Marco Polo Davao*
* Owned by Third Party
^ 50%-owned
42
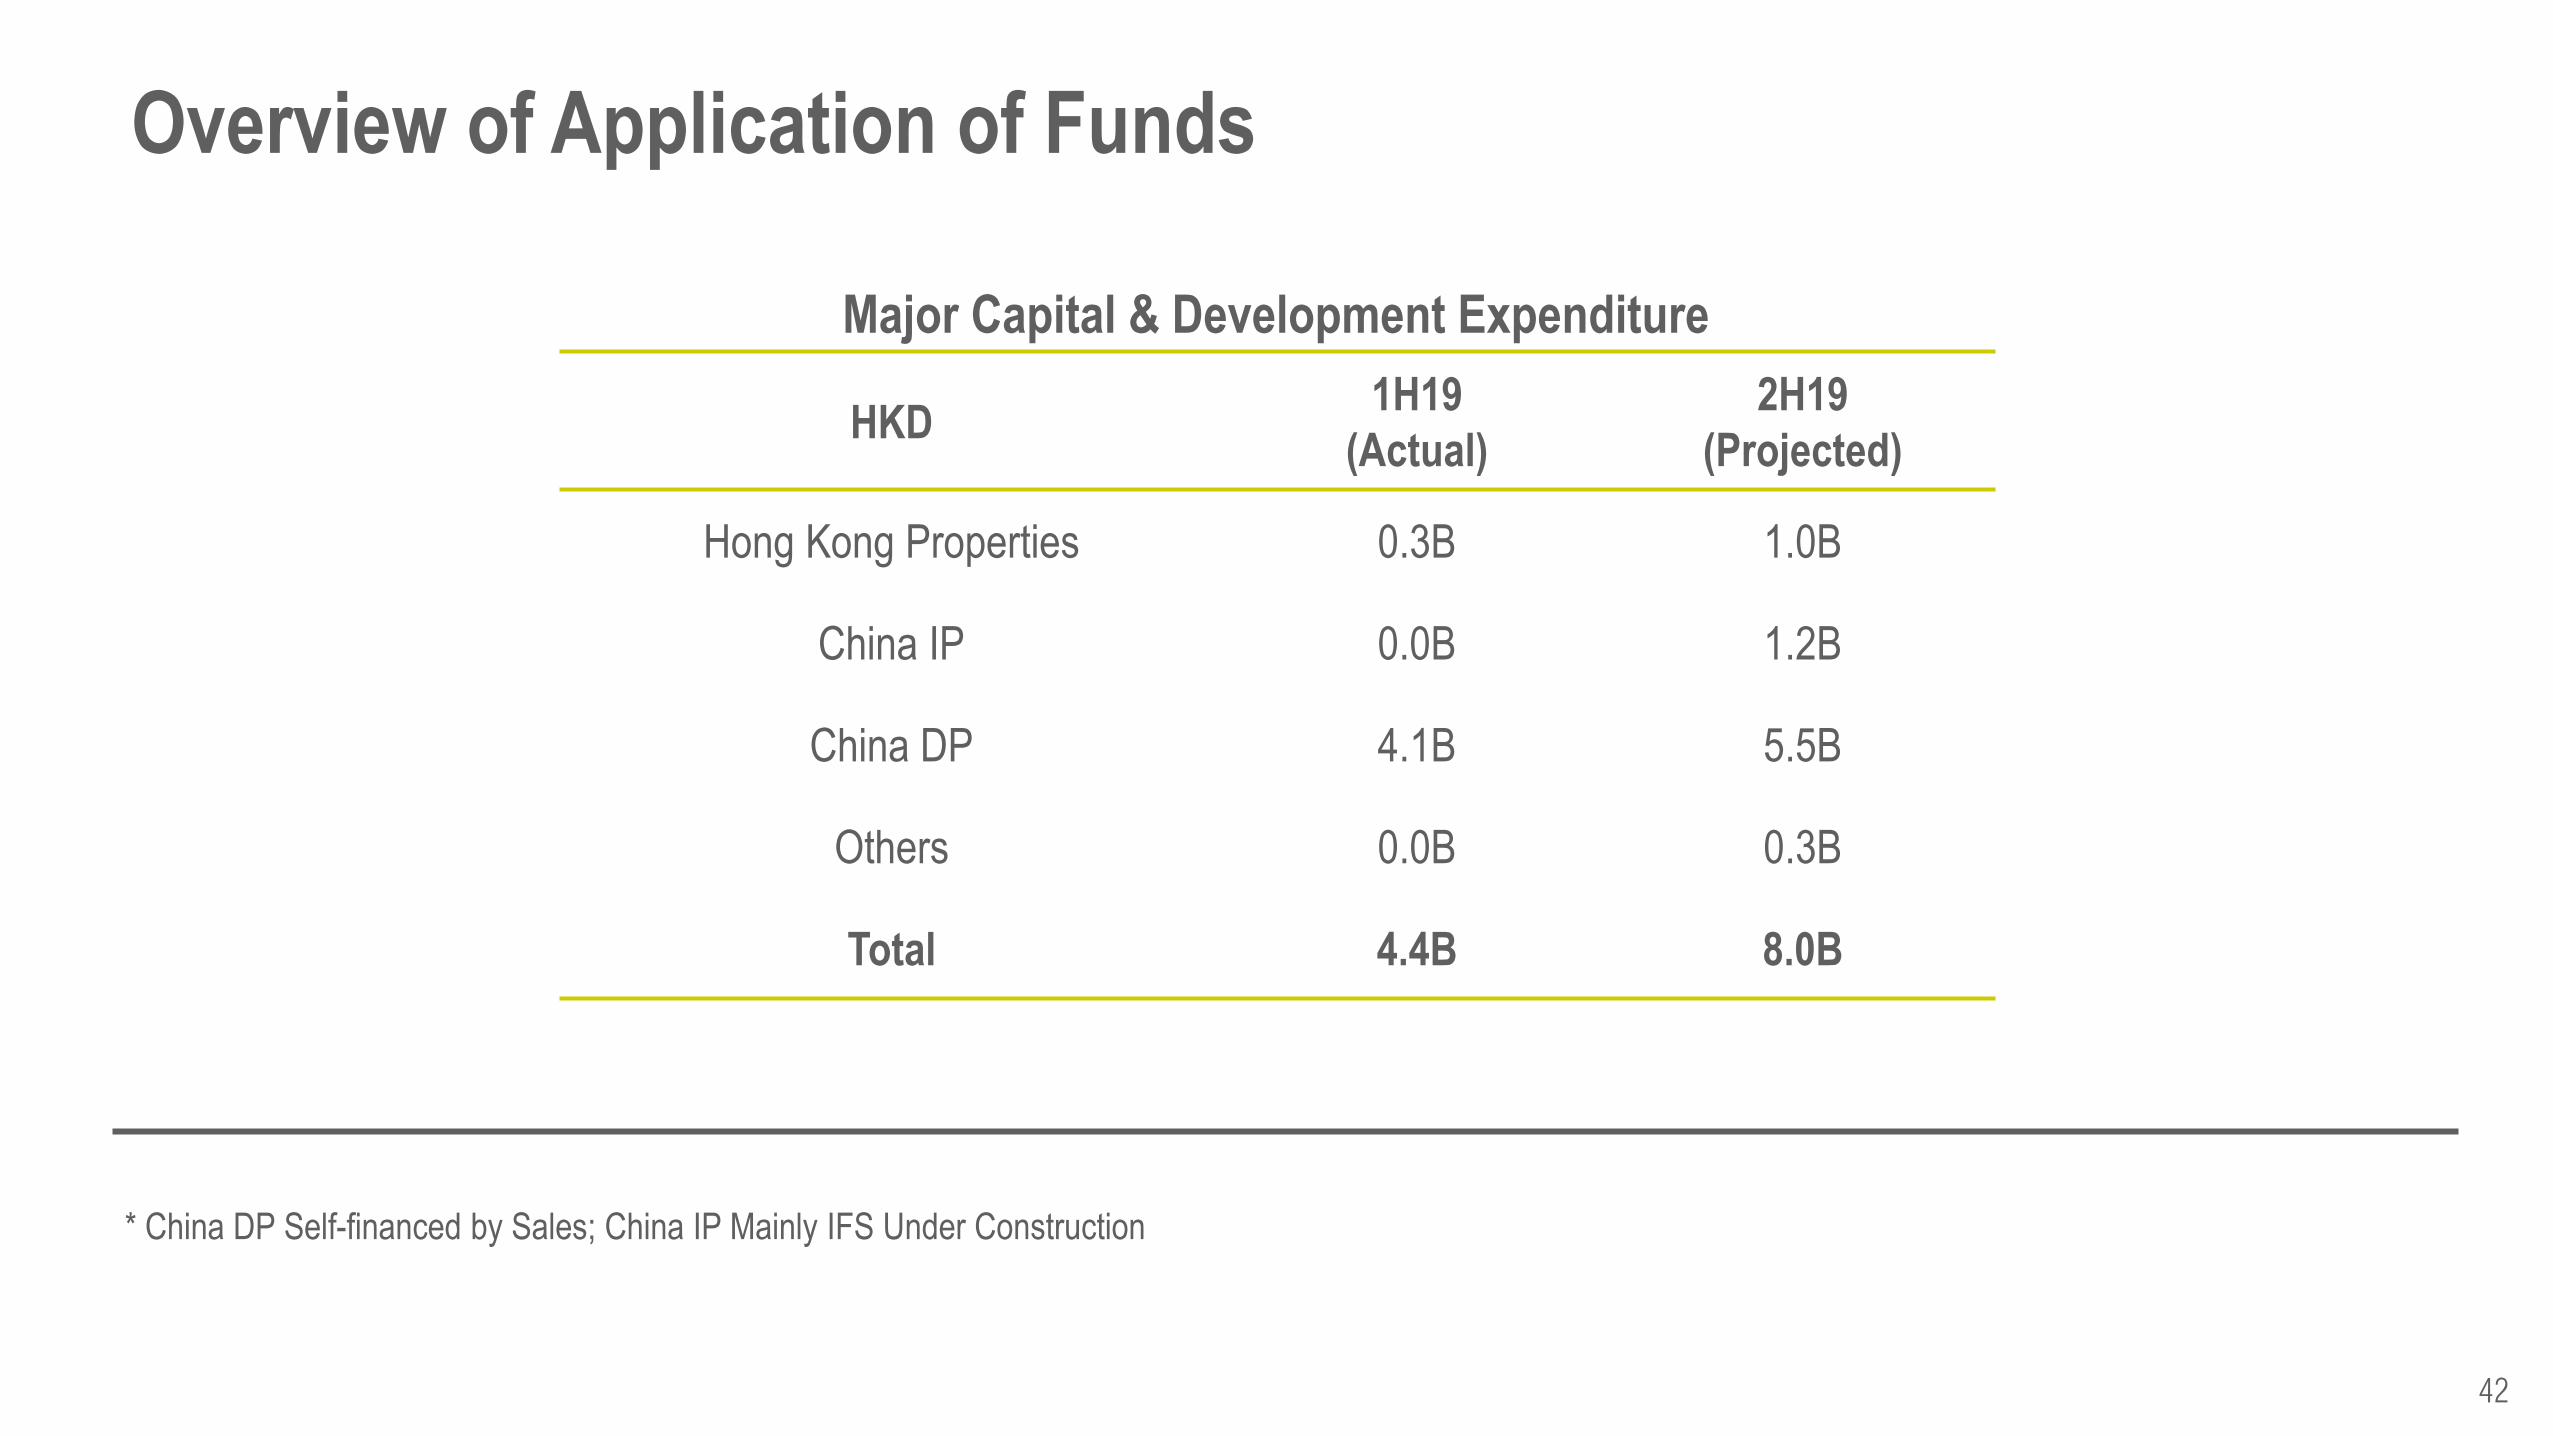
Overview of Application of Funds
HKD 1H19
(Actual)
2H19
(Projected)
Hong Kong Properties 0.3B 1.0B
China IP 0.0B 1.2B
China DP 4.1B 5.5B
Others 0.0B 0.3B
Total 4.4B 8.0B
* China DP Self-financed by Sales; China IP Mainly IFS Under Construction
Major Capital & Development Expenditure
43
Portfolio Facing Headwind
Thank You
44
End of Presentation
The Wharf (Holdings) Limited [HKEx Stock Code: 0004.HK]
Disclaimer
1) All information and data are provided for information purposes only. All opinions included herein constitute
Wharf’s judgment as of the date hereof and are subject to change without notice. The Group, its subsidiaries
and affiliates hereby disclaim (i) all express, implied, and statutory warranties of any kind to user and/or any
third party including warranties as to accuracy, timeliness, completeness, or fitness for any particular
purpose; and (ii) any liability whatsoever for any loss howsoever arising from or in reliance upon the whole or
any part of the information and data contained herein.
2) The full-year statutory financial information of preceding financial years quoted in this presentation are
derived from statutory annual financial statements for that relevant financial years, each of which had been
delivered to Registrar of Companies in accordance with the prevailing Companies Ordinance and were
reported on by the auditors with relevant auditors’ reports without qualification or modification.