Embed Size (px)
Citation preview
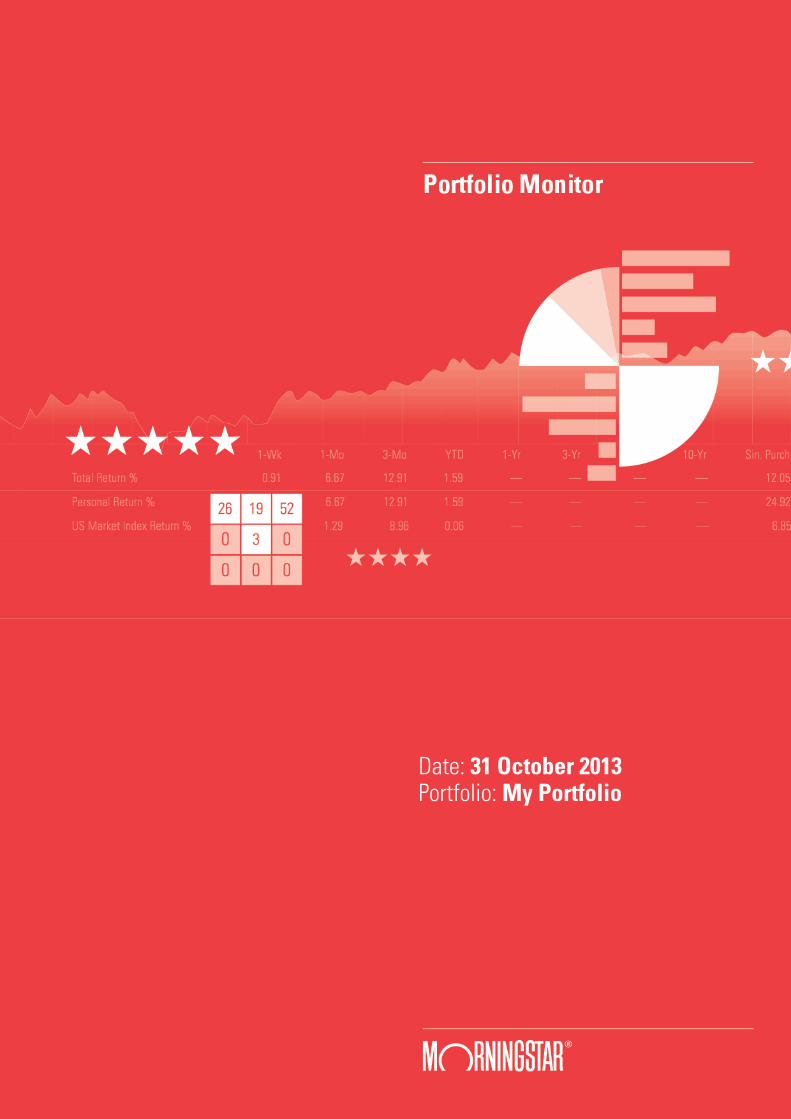
Date: 31 October 2013Portfolio: My Portfolio
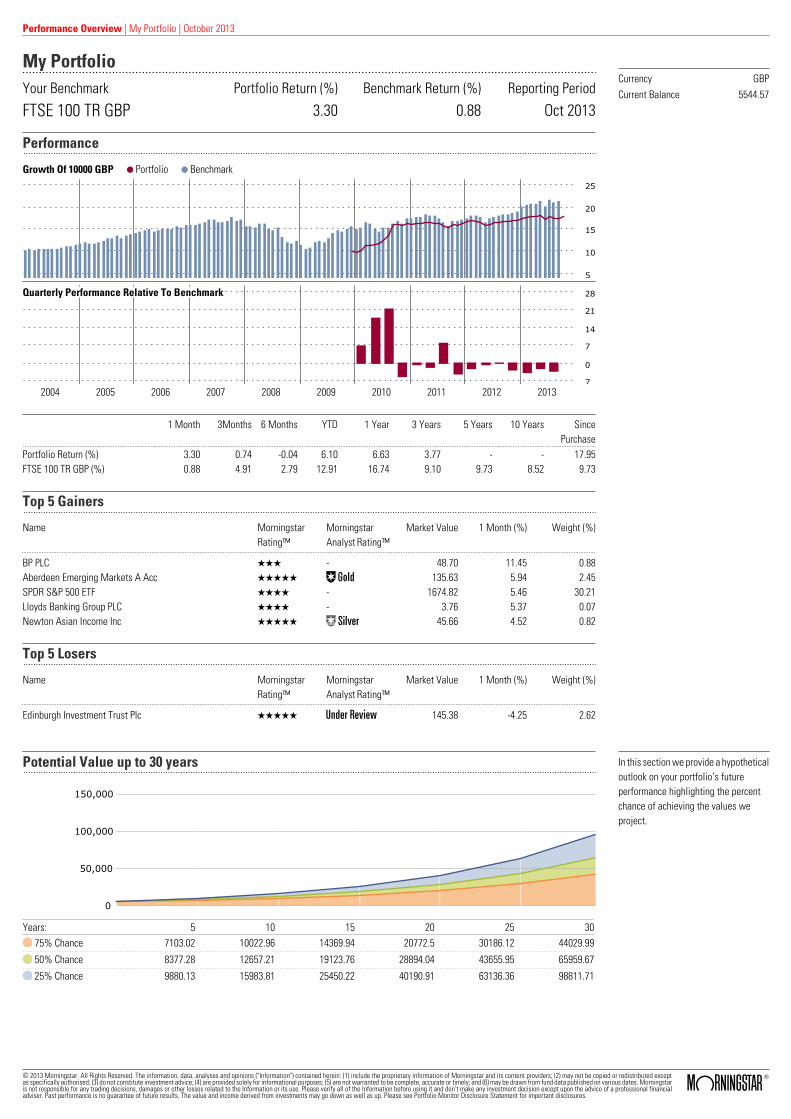
Performance Overview | My Portfolio | October 2013
My PortfolioYour Benchmark Portfolio Return (%) Benchmark Return (%) Reporting Period
FTSE 100 TR GBP 3.30 0.88 Oct 2013
Performance
Growth Of 10000 GBP Portfolio Benchmark
5
10
15
20
25
Quarterly Performance Relative To Benchmark
2004 2005 2006 2007 2008 2009 2010 2011 2012 2013
1 Month 3Months 6 Months YTD 1 Year 3 Years 5 Years 10 Years SincePurchase
Portfolio Return (%) 3.30 0.74 -0.04 6.10 6.63 3.77 - - 17.95FTSE 100 TR GBP (%) 0.88 4.91 2.79 12.91 16.74 9.10 9.73 8.52 9.73
Currency GBPCurrent Balance 5544.57
Top 5 Gainers
Name MorningstarRating™
MorningstarAnalyst Rating™
Market Value 1 Month (%) Weight (%)
BP PLC QQQ - 48.70 11.45 0.88Aberdeen Emerging Markets A Acc QQQQQ Œ 135.63 5.94 2.45SPDR S&P 500 ETF QQQQ - 1674.82 5.46 30.21Lloyds Banking Group PLC QQQQ - 3.76 5.37 0.07Newton Asian Income Inc QQQQQ „ 45.66 4.52 0.82
Top 5 Losers
Name MorningstarRating™
MorningstarAnalyst Rating™
Market Value 1 Month (%) Weight (%)
Edinburgh Investment Trust Plc QQQQQ ˆ 145.38 -4.25 2.62
Potential Value up to 30 years
0
50,000
100,000
150,000
Years: 5 10 15 20 25 3075% Chance 7103.02 10022.96 14369.94 20772.5 30186.12 44029.99
50% Chance 8377.28 12657.21 19123.76 28894.04 43655.95 65959.67
25% Chance 9880.13 15983.81 25450.22 40190.91 63136.36 98811.71
In this section we provide a hypotheticaloutlook on your portfolio’s futureperformance highlighting the percentchance of achieving the values weproject.
© 2013 Morningstar. All Rights Reserved. The information, data, analyses and opinions ("Information") contained herein: (1) include the proprietary information of Morningstar and its content providers; (2) may not be copied or redistributed exceptas specifically authorised; (3) do not constitute investment advice; (4) are provided solely for informational purposes; (5) are not warranted to be complete, accurate or timely; and (6) may be drawn from fund data published on various dates. Morningstaris not responsible for any trading decisions, damages or other losses related to the Information or its use. Please verify all of the Information before using it and don’t make any investment decision except upon the advice of a professional financialadviser. Past performance is no guarantee of future results. The value and income derived from investments may go down as well as up. Please see Portfolio Monitor Disclosure Statement for important disclosures.
ß®
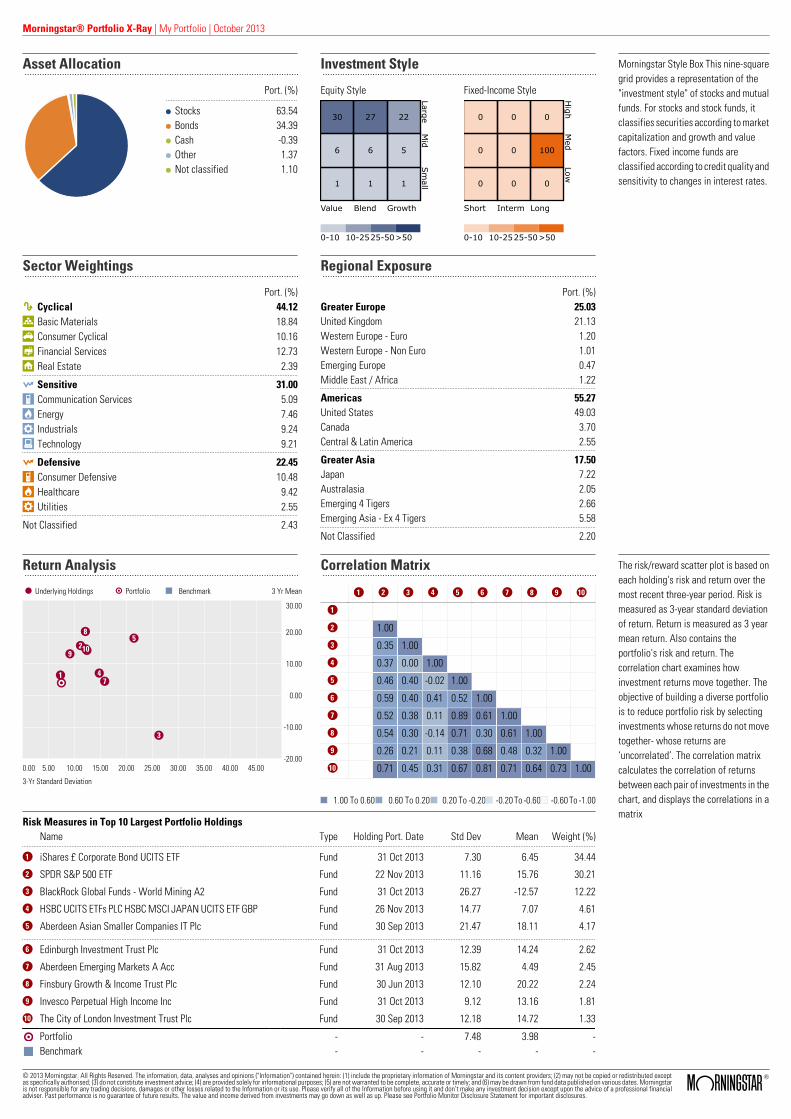
Morningstar® Portfolio X-Ray | My Portfolio | October 2013
Asset Allocation Investment Style
Port. (%)
Stocks 63.54 Bonds 34.39 Cash -0.39 Other 1.37 Not classified 1.10
Equity Style
30 27 22
6 6 5
1 1 1
Value Blend Growth
LargeM
idSm
all
0-10 10-2525-50>50
Fixed-Income Style
0 0 0
0 0 100
0 0 0
Short Interm Long
High
Med
Low
0-10 10-2525-50>50
Morningstar Style Box This nine-squaregrid provides a representation of the"investment style" of stocks and mutualfunds. For stocks and stock funds, itclassifies securities according to marketcapitalization and growth and valuefactors. Fixed income funds areclassified according to credit quality andsensitivity to changes in interest rates.
Sector Weightings Regional Exposure
Port. (%)h Cyclical 44.12r Basic Materials 18.84t Consumer Cyclical 10.16y Financial Services 12.73u Real Estate 2.39
j Sensitive 31.00i Communication Services 5.09o Energy 7.46p Industrials 9.24a Technology 9.21
j Defensive 22.45i Consumer Defensive 10.48o Healthcare 9.42p Utilities 2.55
Not Classified 2.43
Port. (%)Greater Europe 25.03United Kingdom 21.13Western Europe - Euro 1.20Western Europe - Non Euro 1.01Emerging Europe 0.47Middle East / Africa 1.22
Americas 55.27United States 49.03Canada 3.70Central & Latin America 2.55
Greater Asia 17.50Japan 7.22Australasia 2.05Emerging 4 Tigers 2.66Emerging Asia - Ex 4 Tigers 5.58
Not Classified 2.20
Return Analysis Correlation Matrix
Underlying Holdings Portfolio Benchmark 3 Yr Mean
3-Yr Standard Deviation
0.00 5.00 10.00 15.00 20.00 25.00 30.00 35.00 40.00 45.00-20.00
-10.00
0.00
10.00
20.00
30.00
1
2
3
4
5
6
7
8
910
1 2 3 4 5 6 7 8 9 10
1
2 1.00
3 0.35 1.00
4 0.37 0.00 1.00
5 0.46 0.40 -0.02 1.00
6 0.59 0.40 0.41 0.52 1.00
7 0.52 0.38 0.11 0.89 0.61 1.00
8 0.54 0.30 -0.14 0.71 0.30 0.61 1.00
9 0.26 0.21 0.11 0.38 0.68 0.48 0.32 1.00
10 0.71 0.45 0.31 0.67 0.81 0.71 0.64 0.73 1.00
1.00 To 0.60 0.60 To 0.20 0.20 To -0.20 -0.20 To -0.60 -0.60 To -1.00
Risk Measures in Top 10 Largest Portfolio HoldingsName Type Holding Port. Date Std Dev Mean Weight (%)
1 iShares £ Corporate Bond UCITS ETF Fund 31 Oct 2013 7.30 6.45 34.44
2 SPDR S&P 500 ETF Fund 22 Nov 2013 11.16 15.76 30.21
3 BlackRock Global Funds - World Mining A2 Fund 31 Oct 2013 26.27 -12.57 12.22
4 HSBC UCITS ETFs PLC HSBC MSCI JAPAN UCITS ETF GBP Fund 26 Nov 2013 14.77 7.07 4.61
5 Aberdeen Asian Smaller Companies IT Plc Fund 30 Sep 2013 21.47 18.11 4.17
6 Edinburgh Investment Trust Plc Fund 31 Oct 2013 12.39 14.24 2.62
7 Aberdeen Emerging Markets A Acc Fund 31 Aug 2013 15.82 4.49 2.45
8 Finsbury Growth & Income Trust Plc Fund 30 Jun 2013 12.10 20.22 2.24
9 Invesco Perpetual High Income Inc Fund 31 Oct 2013 9.12 13.16 1.81
10 The City of London Investment Trust Plc Fund 30 Sep 2013 12.18 14.72 1.33
Portfolio - - 7.48 3.98 -Benchmark - - - - -
The risk/reward scatter plot is based oneach holding's risk and return over themost recent three-year period. Risk ismeasured as 3-year standard deviationof return. Return is measured as 3 yearmean return. Also contains theportfolio's risk and return. Thecorrelation chart examines howinvestment returns move together. Theobjective of building a diverse portfoliois to reduce portfolio risk by selectinginvestments whose returns do not movetogether- whose returns are‘uncorrelated’. The correlation matrixcalculates the correlation of returnsbetween each pair of investments in thechart, and displays the correlations in amatrix
© 2013 Morningstar. All Rights Reserved. The information, data, analyses and opinions ("Information") contained herein: (1) include the proprietary information of Morningstar and its content providers; (2) may not be copied or redistributed exceptas specifically authorised; (3) do not constitute investment advice; (4) are provided solely for informational purposes; (5) are not warranted to be complete, accurate or timely; and (6) may be drawn from fund data published on various dates. Morningstaris not responsible for any trading decisions, damages or other losses related to the Information or its use. Please verify all of the Information before using it and don’t make any investment decision except upon the advice of a professional financialadviser. Past performance is no guarantee of future results. The value and income derived from investments may go down as well as up. Please see Portfolio Monitor Disclosure Statement for important disclosures.
ß®
Holding Details | My Portfolio | October 2013
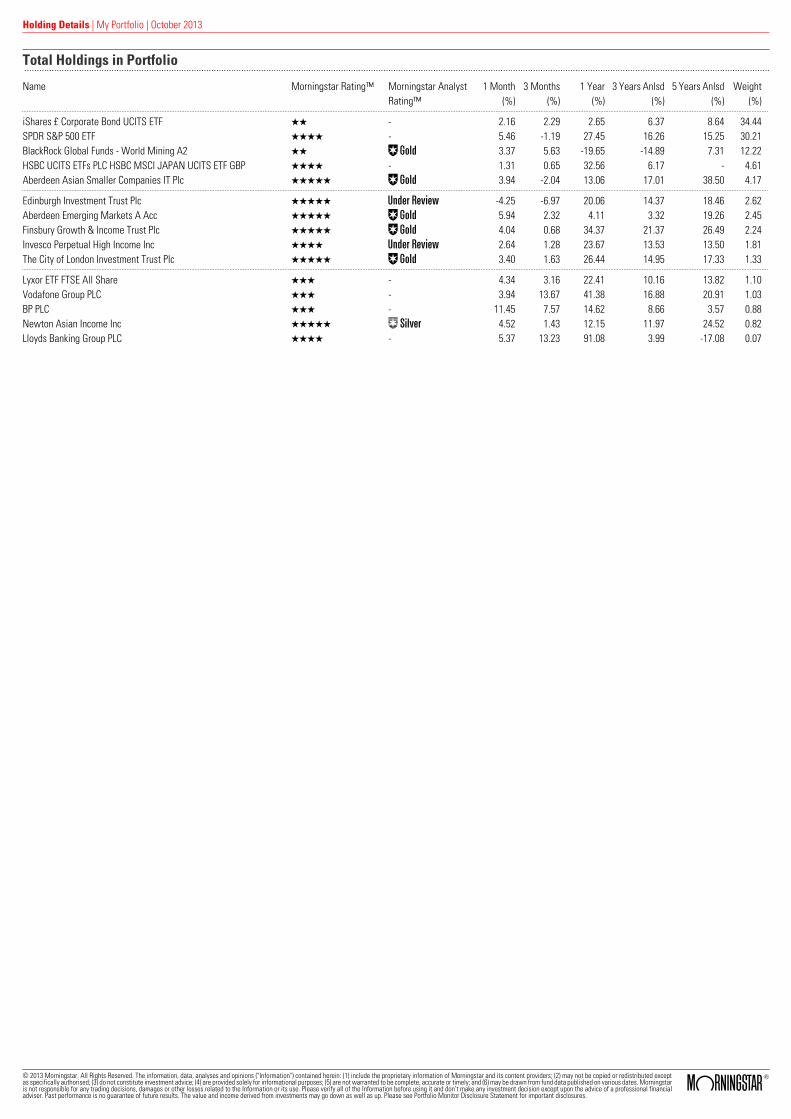
Total Holdings in Portfolio
Name Morningstar Rating™ Morningstar AnalystRating™
1 Month(%)
3 Months(%)
1 Year(%)
3 Years Anlsd(%)
5 Years Anlsd(%)
Weight(%)
iShares £ Corporate Bond UCITS ETF QQ - 2.16 2.29 2.65 6.37 8.64 34.44SPDR S&P 500 ETF QQQQ - 5.46 -1.19 27.45 16.26 15.25 30.21BlackRock Global Funds - World Mining A2 QQ Œ 3.37 5.63 -19.65 -14.89 7.31 12.22HSBC UCITS ETFs PLC HSBC MSCI JAPAN UCITS ETF GBP QQQQ - 1.31 0.65 32.56 6.17 - 4.61Aberdeen Asian Smaller Companies IT Plc QQQQQ Œ 3.94 -2.04 13.06 17.01 38.50 4.17
Edinburgh Investment Trust Plc QQQQQ ˆ -4.25 -6.97 20.06 14.37 18.46 2.62Aberdeen Emerging Markets A Acc QQQQQ Œ 5.94 2.32 4.11 3.32 19.26 2.45Finsbury Growth & Income Trust Plc QQQQQ Œ 4.04 0.68 34.37 21.37 26.49 2.24Invesco Perpetual High Income Inc QQQQ ˆ 2.64 1.28 23.67 13.53 13.50 1.81The City of London Investment Trust Plc QQQQQ Œ 3.40 1.63 26.44 14.95 17.33 1.33
Lyxor ETF FTSE All Share QQQ - 4.34 3.16 22.41 10.16 13.82 1.10Vodafone Group PLC QQQ - 3.94 13.67 41.38 16.88 20.91 1.03BP PLC QQQ - 11.45 7.57 14.62 8.66 3.57 0.88Newton Asian Income Inc QQQQQ „ 4.52 1.43 12.15 11.97 24.52 0.82Lloyds Banking Group PLC QQQQ - 5.37 13.23 91.08 3.99 -17.08 0.07
© 2013 Morningstar. All Rights Reserved. The information, data, analyses and opinions ("Information") contained herein: (1) include the proprietary information of Morningstar and its content providers; (2) may not be copied or redistributed exceptas specifically authorised; (3) do not constitute investment advice; (4) are provided solely for informational purposes; (5) are not warranted to be complete, accurate or timely; and (6) may be drawn from fund data published on various dates. Morningstaris not responsible for any trading decisions, damages or other losses related to the Information or its use. Please verify all of the Information before using it and don’t make any investment decision except upon the advice of a professional financialadviser. Past performance is no guarantee of future results. The value and income derived from investments may go down as well as up. Please see Portfolio Monitor Disclosure Statement for important disclosures.
ß®
Holding Details | My Portfolio | October 2013
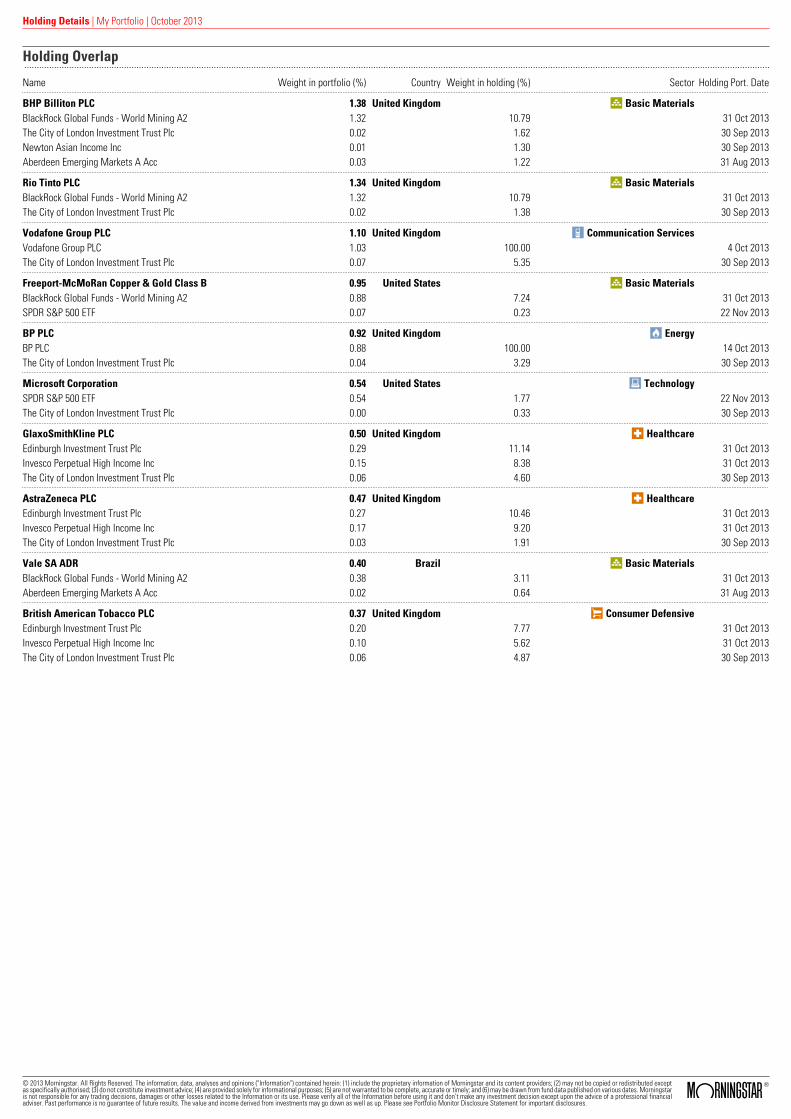
Holding Overlap
Name Weight in portfolio (%) Country Weight in holding (%) Sector Holding Port. Date
BHP Billiton PLC 1.38 United Kingdom r Basic MaterialsBlackRock Global Funds - World Mining A2 1.32 10.79 31 Oct 2013The City of London Investment Trust Plc 0.02 1.62 30 Sep 2013Newton Asian Income Inc 0.01 1.30 30 Sep 2013Aberdeen Emerging Markets A Acc 0.03 1.22 31 Aug 2013
Rio Tinto PLC 1.34 United Kingdom r Basic MaterialsBlackRock Global Funds - World Mining A2 1.32 10.79 31 Oct 2013The City of London Investment Trust Plc 0.02 1.38 30 Sep 2013
Vodafone Group PLC 1.10 United Kingdom i Communication ServicesVodafone Group PLC 1.03 100.00 4 Oct 2013The City of London Investment Trust Plc 0.07 5.35 30 Sep 2013
Freeport-McMoRan Copper & Gold Class B 0.95 United States r Basic MaterialsBlackRock Global Funds - World Mining A2 0.88 7.24 31 Oct 2013SPDR S&P 500 ETF 0.07 0.23 22 Nov 2013
BP PLC 0.92 United Kingdom o EnergyBP PLC 0.88 100.00 14 Oct 2013The City of London Investment Trust Plc 0.04 3.29 30 Sep 2013
Microsoft Corporation 0.54 United States a TechnologySPDR S&P 500 ETF 0.54 1.77 22 Nov 2013The City of London Investment Trust Plc 0.00 0.33 30 Sep 2013
GlaxoSmithKline PLC 0.50 United Kingdom d HealthcareEdinburgh Investment Trust Plc 0.29 11.14 31 Oct 2013Invesco Perpetual High Income Inc 0.15 8.38 31 Oct 2013The City of London Investment Trust Plc 0.06 4.60 30 Sep 2013
AstraZeneca PLC 0.47 United Kingdom d HealthcareEdinburgh Investment Trust Plc 0.27 10.46 31 Oct 2013Invesco Perpetual High Income Inc 0.17 9.20 31 Oct 2013The City of London Investment Trust Plc 0.03 1.91 30 Sep 2013
Vale SA ADR 0.40 Brazil r Basic MaterialsBlackRock Global Funds - World Mining A2 0.38 3.11 31 Oct 2013Aberdeen Emerging Markets A Acc 0.02 0.64 31 Aug 2013
British American Tobacco PLC 0.37 United Kingdom s Consumer DefensiveEdinburgh Investment Trust Plc 0.20 7.77 31 Oct 2013Invesco Perpetual High Income Inc 0.10 5.62 31 Oct 2013The City of London Investment Trust Plc 0.06 4.87 30 Sep 2013
© 2013 Morningstar. All Rights Reserved. The information, data, analyses and opinions ("Information") contained herein: (1) include the proprietary information of Morningstar and its content providers; (2) may not be copied or redistributed exceptas specifically authorised; (3) do not constitute investment advice; (4) are provided solely for informational purposes; (5) are not warranted to be complete, accurate or timely; and (6) may be drawn from fund data published on various dates. Morningstaris not responsible for any trading decisions, damages or other losses related to the Information or its use. Please verify all of the Information before using it and don’t make any investment decision except upon the advice of a professional financialadviser. Past performance is no guarantee of future results. The value and income derived from investments may go down as well as up. Please see Portfolio Monitor Disclosure Statement for important disclosures.
ß®

Analysis Digest | My Portfolio | October 2013
Lloyds Banking Group PLC - LLOY | QQQQ17/09/2013 | Erin Davis
Bulls Say• As non-core assets shrink and government ownership falls, Lloyds is re-emerging as the bank
it once was--a strong, conservative, and impressively profitable retail-focused institution.• Lloyds' funding is improving, and its goal of a 100% loan/deposit ratio in its core business
has finally been met.• Asset quality has stabilized in Lloyds' core businesses, and it is likely to improve further as
the U.K. economy returns to growth.
Bears Say• Nearly 8% of Lloyds' loans are impaired. At best, losses will pressure profits for some time,
but they may cause serious pain if the crisis in Europe deepens.• Lloyds' already-thin net interest margins is well below historical levels and is likely to remain
depressed until Europe's economy recovers and interest rates rise.• While Lloyds has run off more than half of its non-core assets, they remain 10% of total
assets and more than 100% of equity. If management's valuation of these assets proves toooptimistic, a substantial portion of Lloyds' book value could be wiped out.
Analyst Note18/11/2013
Lloyds announced on Monday that it has reached an agreement with Aberdeen AssetManagement to sell its Scottish Widows Investment Partnership Group to Aberdeen for an initial
GBP 560 million, plus up to GBP 100 million, depending on performance. The initial GBP 560million will be paid in shares and will make Lloyds Aberdeen’s largest shareholder, with a 9.9%stake. The deal does not include Lloyds’ other Scottish Widows branded businesses, such aslife insurance and pensions, which are not on the chopping block. For Lloyds, the deal makessense on two levels: It is a small step in its broader mission to streamline its business, and ithelps to boost the bank’s capital by increasing the bank’s pro forma Basel III ratio 11 basis pointsfrom the 9.9% reported at the end of the third quarter. Still, we see the deal as too small tomove the needle on our view of the narrow-moat bank--the maximum GBP 660 million ofcompensation Lloyds could receive is just 1.5% of its equity base. We plan to maintain our fairvalue estimate.
Valuation:We're raising our fair value estimate for Lloyds by GBX 32 per share to GBX 92 per share as wereduce our assumed cost of equity to 10% from 12% (GBX 20 of the increase) and increase ourmedium-term projections (GBX 12). Our fair value estimate is 1.7 times tangible book value and1.5 times book value. We anticipate that loan losses will average 0.5% of loans in the mediumterm. We think near-term net interest margins will remain very low in 2013 and will graduallyincrease to 1.4% by 2016, as we measure it, compared with 1.1% in 2012. We expect Lloyds'equity/assets ratio to increase to 5.25% by 2015, compared with 2.15% in 2009 and 4.76% in2012, as the bank adjusts to higher capital requirements. We expect that divestitures will bedone near fair value, and that total assets will shrink 3% in 2013, and grow with nominal GDPin the medium term, about 2.5% annually. Using these assumptions, we project that Lloyds willearn its 10% cost of equity in 2014, and earn a 13% return on equity in the medium term.
This is not the complete report. Please go to the website to read the full research report
© 2013 Morningstar. All Rights Reserved. The information, data, analyses and opinions ("Information") contained herein: (1) include the proprietary information of Morningstar and its content providers; (2) may not be copied or redistributed exceptas specifically authorised; (3) do not constitute investment advice; (4) are provided solely for informational purposes; (5) are not warranted to be complete, accurate or timely; and (6) may be drawn from fund data published on various dates. Morningstaris not responsible for any trading decisions, damages or other losses related to the Information or its use. Please verify all of the Information before using it and don’t make any investment decision except upon the advice of a professional financialadviser. Past performance is no guarantee of future results. The value and income derived from investments may go down as well as up. Please see Portfolio Monitor Disclosure Statement for important disclosures.
ß®
Analysis Digest | My Portfolio | October 2013
The City of London Investment Trust Plc CTY13/11/2013 | Jackie Beard
Morningstar Analyst Rating™
ŒRole in Portfolio:The fund is suitable as a core UK equity holding, offering exposure to UK large-cap equities. Themanager’s cautious approach and focus on limiting downside risk makes it suitable for all riskprofiles.
Executive Summary:• Process: Curtis’ process favours caution, and income is of paramount importance in his
decision-making. This leads to a portfolio biased toward large caps but not to the exclusionof smaller names.
• NAV Performance: The fund has performed well over the long term under Curtis’ stewardship,beating both its peers and the FTSE All-Share.
• People: Job Curtis is a long-standing veteran of Henderson. He has managed investmenttrusts since 1987. He is supported by a small but stable team.
• Parent: An acquisition-led period for Henderson has given it a platform for its rising retailambitions.
• Board: Although the board is relatively new, it comprises a good range of skills and all directorsown shares in the fund.
Morningstar Opinion:We think City of London is a standout. There are several reasons we have such conviction in thefund. Job Curtis has been at the helm for more than 20 years—a length of tenure that’s rare to
see. His involvement with the fund dates back to his time at Touche Remnant, which was acquiredby Henderson in 1992, although he officially took charge in July 1991. Not only has themanagement been consistent, but the process used by Curtis is little changed over that time,too. Curtis is naturally a cautious investor and this caution has served shareholders well overthe years. He doesn’t ignore the macro picture, but the bulk of his analysis is done from thebottom up. A company’s cash generation and physical assets are important in his analysis, butthe primary driver for a stock to enter the portfolio is dividend yield and this focus on income asa measure of a company’s value has been paramount in the fund’s success. That yield disciplinehelped the fund weather the financial crisis better than many; although it trailed the FTSE All-Share in 2009, it gave up a little less in 2008. This pattern is typical of Curtis’ style and, over thelong term, it has led to steady outperformance of both peers and the All-Share index. The fundhas structural gearing in place through fixed-loan debentures, which could cause the fund’sperformance to exacerbate market movements; however, Curtis has proved his ability to dampthat effect through his cautious approach to stock-picking. Indeed, in 2011, he used gearing toincrease his holdings in those stocks where his conviction is highest, and by year-end in 2011,the fund was well ahead of its Morningstar UK Large-Cap Blend Equity peers. Curtis’ approachhas also enabled the fund to increase its dividend progressively each year for the last 47 years—a record yet to be matched by any other fund, and a reminder of the benefit of having a revenuereserve on which to draw in tough times. Another plus is the board’s approach to discount andpremium management. While there is no firm rule in place, the board will issue shares whenthe fund trades at a premium to its NAV—as we have seen in recent months—and will buyback shares when the fund trades at a discount, when the discount reaches a level with whichthe board feels uncomfortable. The last time this occurred was July 2008. We take comfort inthe fact the board has demonstrated its approach clearly, and we think shareholders should bereassured by this. Finally, we like the low costs associated with this fund and the abolishmentof the performance fee in July 2013 is a further plus.All in, we believe the strong management,consistent process, and low fees have contributed to the excellent long-term performance,making this one of the best of its kind. The fund is fully deserving of its Gold rating.
This is not the complete report. Please go to the website to read the full research report
© 2013 Morningstar. All Rights Reserved. The information, data, analyses and opinions ("Information") contained herein: (1) include the proprietary information of Morningstar and its content providers; (2) may not be copied or redistributed exceptas specifically authorised; (3) do not constitute investment advice; (4) are provided solely for informational purposes; (5) are not warranted to be complete, accurate or timely; and (6) may be drawn from fund data published on various dates. Morningstaris not responsible for any trading decisions, damages or other losses related to the Information or its use. Please verify all of the Information before using it and don’t make any investment decision except upon the advice of a professional financialadviser. Past performance is no guarantee of future results. The value and income derived from investments may go down as well as up. Please see Portfolio Monitor Disclosure Statement for important disclosures.
ß®
Analysis Digest | My Portfolio | October 2013
Vodafone Group PLC - VOD | QQQ21/10/2013 | Allan C. Nichols, CFA
Bulls Say• Vodafone has sold most of its minority assets and is in the process of selling Verizon Wireless.
These divestitures reduce its debt load and increase its focus on operations it controls. India,in particular, is showing signs of improvement.
• The firm generates significant free cash flow, which it is using to increase dividends, makeacquisitions, and reinvest in the business.
• Vodafone acquired Kabel Deutschland, increasing its position in offering converged telecomservices as well as reducing cost.
Bears Say• Competition is increasing globally. European rivals are merging and becoming more global,
and strong emerging-markets players are developing. This competition is driving down ARPU.• Vodafone could overpay for more acquisitions like Kabel Deutschland.• The Indian government is a thorn in Vodafone's side. After the Indian Supreme Court ruled
in Vodafone's favor regarding its $2.5 billion tax dispute with the Indian government for itsacquisition of Hutchison Essar in 2007, the government proposed a new law retroactive to1962, which could require the firm to pay the tax.
Analyst Note12/11/2013
Vodafone reported fiscal first-half results that were generally in line with our expectations, andwe are maintaining our fair value estimate and moat rating for now. Revenue on management'sbasis grew 1.2% year over year versus our full-year projection of growth of 2.2%. Managementbasis includes the acquisitions of Cable & Wireless Worldwide and TelstraClear, but not KabelDeutschland, as well as currency gains (mostly in Europe where the pound weakened againstthe euro) and currency losses (primarily from the Indian rupee and South African randdepreciating against the pound). Our revenue growth also includes Kabel Deutschland on a proforma basis as if it had been owned in the year-ago period. The firm's European operations
remain weak, with organic service revenue in the north and central European region declining4.9% and falling 15.5% in southern Europe. This was partially offset by organic service revenuegains of 5.7% in the Africa, Middle East, and Asia Pacific region. Overall, Vodafone's subscribergrowth picked up during the quarter, adding 3.3 million customers after only increasing about1.2 million in the previous three quarters for total growth year over year of 1% to 411.5 million,excluding Verizon Wireless subscribers. Management said on the call that there are signs ofimprovement in Europe and India, which is in line with our thesis. We continue to think the worstis behind Vodafone in Europe, and emerging-market growth will be sufficient to offset weaknessin Europe going forward.On management's basis Vodafone was able to reduce costs enough forits EBITDA margin to only decline to 30% versus our full-year projection of 29.8%. However,management expects greater margin pressure during the second half of the year, thus weanticipate the firm's margin will be close to our estimate.
Valuation:We are maintaining our fair value estimate for Vodafone's shares at GBX 218. We have removedVerizon Wireless from our model and replaced it with the value of the cash and shares. We havealso added the revenue for Kabel Deutschland and removed the cash paid for it. KabelDeutschland increases our estimated annual revenue growth rate for the next five years to 2.4%from 1.3% previously. Overall, we think Vodafone's overpayment for Kabel Deutschland mostlyoffsets the higher value from selling Verizon Wireless. The firm's Southern European operationsremain in bad shape, and the north is seeing increased competition, particularly Germany.However, Vodafone's emerging-market operations are performing well, with India in particularpicking up steam again after last year's slowdown caused by new government regulations. Thepositive aspect of the increased regulation is that it has driven several smaller operators out ofbusiness and seems to be causing the remainder to behave more rationally. We are pleased tosee data growth picking up in many emerging countries, which is helping offset the slowdownin new subscriber growth. That said, we remain leery of the Indian government's telecom policy,which in our opinion has been very detrimental to foreign investment. The removal of VerizonWireless' results, with no accompanying revenue, lowers Vodafone's EBITDA margin. We nowexpect the firm's EBITDA margin to be slightly below 30%.
This is not the complete report. Please go to the website to read the full research report
© 2013 Morningstar. All Rights Reserved. The information, data, analyses and opinions ("Information") contained herein: (1) include the proprietary information of Morningstar and its content providers; (2) may not be copied or redistributed exceptas specifically authorised; (3) do not constitute investment advice; (4) are provided solely for informational purposes; (5) are not warranted to be complete, accurate or timely; and (6) may be drawn from fund data published on various dates. Morningstaris not responsible for any trading decisions, damages or other losses related to the Information or its use. Please verify all of the Information before using it and don’t make any investment decision except upon the advice of a professional financialadviser. Past performance is no guarantee of future results. The value and income derived from investments may go down as well as up. Please see Portfolio Monitor Disclosure Statement for important disclosures.
ß®
Analysis Digest | My Portfolio | October 2013
Finsbury Growth & Income Trust Plc FGT05/11/2013 | Szymon Idzikowski
Morningstar Analyst Rating™
ŒRole in Portfolio:Core. The fund can serve as a core holding for UK equities.
Executive Summary:• Process: The manager focuses on bottom-up selection of quality companies, combined with
a long-term investment horizon.• NAV Performance: Returns here have been excellent and Train has demonstrated his ability
to add value through a range of market cycles, without taking excessive risk.• People: Nick Train is a talented fund manager with a strong temperament and broad
experience.• Parent: Lindsell Train sticks to its specialties: the management of UK, Japanese, and global
equities.• Board: The board brings extensive experience gained through a variety of careers in financial
markets.
Morningstar Opinion:We think Finsbury Growth & Income is a standout.For one, it features an experienced, talented,and pragmatic manager. Nick Train draws on his three decades of expertise, which cover anumber of market cycles. Having started his career as an investment manager at GT Managementin 1981, he was appointed to run Finsbury Growth and Income in Dec 2000, just a few months
after founding Lindsell Train, together with Michael Lindsell. That was a leap of faith on thepart of the board, in that the newly formed firm was launched at a difficult time in markets,following the TMT-led crash, but it’s a move that has paid off. Train’s process is thorough andwell-proven over a number of market cycles—another reason for our conviction. It’s an approachthat’s been applied consistently and results in a concentrated list of stocks. Train selectscompanies from the bottom up and looks for unique and strong franchises that can prosperthrough a number of business cycles. He sells a stock only if he no longer considers it of sufficientquality, or when its growth in value causes it to become too large a proportion of the portfolio,at which point he will trim it. This process has led to excellent returns. The fund has comfortablyoutperformed its Morningstar UK Flex-Cap Equity Category peers since Train’s appointment inDec 2000. Given his emphasis on quality companies, he has also kept risk well in check. Thefund’s standard deviation, a statistical measure of risk, is significantly lower than its categoryaverage over the mid-, and long term, and that’s despite the use of gearing. We also like theboard’s approach to managing the fund’s discount. They operate a strict discount controlmechanism that keeps the fund’s discount below 5%. Conversely, they have been very proactiveat issuing shares when the fund has traded at a premium. We like the clear guidance and follow-through on their approach. Further, the board members share a wealth of investment experienceand all five members are shareholders in the fund. There are some long-serving directors in situand we wouldn’t be surprised to see some succession-planning take place in the near future.One slight hesitation is that, in addition to his responsibilities as a portfolio manager, Train alsohas duties as a founding partner. However, the firm has thus far stuck to only its corecompetencies and not tried to gather assets. While there’s a conflict in his role as partner andinvestment manager, we think this is well-managed and isn’t a cause for major concern. Indeed,we commend the firm for its transparent approach regarding the investment in the firm’s sharesin its other listed fund. All told, we think there is much to like here: an experienced manager, atried-and-tested process that has delivered excellent returns, and a competitive fee structure.The fund retains its Gold rating.
This is not the complete report. Please go to the website to read the full research report
© 2013 Morningstar. All Rights Reserved. The information, data, analyses and opinions ("Information") contained herein: (1) include the proprietary information of Morningstar and its content providers; (2) may not be copied or redistributed exceptas specifically authorised; (3) do not constitute investment advice; (4) are provided solely for informational purposes; (5) are not warranted to be complete, accurate or timely; and (6) may be drawn from fund data published on various dates. Morningstaris not responsible for any trading decisions, damages or other losses related to the Information or its use. Please verify all of the Information before using it and don’t make any investment decision except upon the advice of a professional financialadviser. Past performance is no guarantee of future results. The value and income derived from investments may go down as well as up. Please see Portfolio Monitor Disclosure Statement for important disclosures.
ß®
Analysis Digest | My Portfolio | October 2013
BP PLC - BP. | QQQ13/09/2013 | Stephen Simko, CFA
Bulls Say• $28 billion of cash on hand (as of June 30, 2013) and the coming growth in operating cash
flows have BP set up to grow shareholder distributions during the next few years as long asoil prices remain high.
• Though its Rosneft stake is very risky, BP now is less exposed to Russia than it was throughits ownership of TNK-BP. Rosneft currently accounts for less than 10% of our BP fair value.
• BP’s U.S. refineries (Whiting, Toledo, Cherry Point) stand to benefit from cost-advantagedcrude for many years to come.
Bears Say• The remaining Macondo liabilities are daunting: Our valuation assumes $25 billion in
remaining cash outflows and $18.5 billion in charges against net income.• There is a long history of Western oil companies that have been mistreated by the Russian
government. The sovereign risk and the illiquidity of BP’s Rosneft stake should not beunderestimated.
• Though there’s a good chance that production and operating cash flow will begin growing in2014, capital investment will also be increasing. This will limit BP’s ability to materiallyincrease its returns on capital in the coming years.
Analyst Note29/10/2013
BP's shares surged 5% today as the company raised its quarterly dividend by 6% to 9.5 centsper ordinary share ($0.57 per ADS) and also committed to $10 billion in further share repurchasesbeyond the buyback plan already announced. Our outlook for BP remains unchanged (as do ourfair value estimate and moat ratings). Cash flows will be growing in the coming years, its balancesheet is in great shape, and returning increasing amounts of cash to shareholders is somethingBP is now very well-positioned to do in the coming years. This optimistic outlook is despite ourprojection of $27 billion of Macondo aftertax cash outflows during the next decade. Put anotherway, 2010 to the present has been very difficult for BP, as the Macondo oil spill forced BP tosell almost $40 billion of non-Russian assets, which had materially shrunk cash flows as wellas oil and gas reserves. The process of shrinking itself to ensure it can handle its oil spill liabilitiesas well as fund its capital expenditure needs has finally ended, and we think it can be said witha high degree of confidence that a multiyear period of cash flow growth will begin next year.Regarding BP's $30 billion-$31 billion operating cash flow growth target for 2014, many investors
have had a difficult time understanding how such a target is possible given that operating cashflows thus far in 2013 have only been $15.7 billion. The answer, fortunately, is a simple one: Asworking capital has increased by $5.7 billion since the beginning of the year, and 70%-80% ofthis buildup is expected to be worked off by the end of 2014. Adding back this working capitaland operating cash flow would have been $21 billion, which equates to an annual run rate of$28 billion. Adding to the re-commissioning of the Whiting refinery and a few key upstreamproject startups, $30 billion-$31 billion next year is very realistic, assuming oil prices remainaround $100 per barrel.
Valuation:We are increasing our fair value estimate to GBX 525 per share from GBX 495 as we updateboth our near-term oil price and financial forecasts. After a multiyear period of shrinking becauseof the Macondo oil spill, BP finally is about ready to begin growing again. We expect productionoutside of Russia to grow by 1.5% annually during the next five years. In the downstream, weproject profits will range between $4 billion and $5 billion in the next few years. Adding it allup, we believe BP’s near-term cash flow targets are realistic if oil prices remain high; we projectoperating cash flows to reach $34 billion by 2016-17.Presently, our published forecasts excludeBP’s Rosneft investment and cash outflows related to extinguishing remaining Macondoliabilities. Instead we have made two adjustments to our valuation to reflect their impact on ourvaluation. For Rosneft, we value BP’s 19.75% stake in the company at its market value, less a33% discount to reflect sovereign risk and illiquidity. This currently equates to a value of $11billion, or roughly $3.50 per ADS of our valuation.Macondo liabilities lower our fair valueestimate by approximately $5.50 per ADS. We expect remaining after-tax cash outflows willtotal $28 billion. Such cash outflows will overwhelm the provisions BP current has booked todate; as a result we forecast a further $27 billion in income statement charges (after tax) willoccur during the next 10 years. As a frame of reference, changes of roughly $4 billion in Macondocash outflows correspond to a valuation impact of $1 per ADS.Offsetting some of the futureMacondo outflows is BP’s ability to shield future U.S. taxable profits by utilizing tax losscarryforwards arising from income statement charges related to the oil spill. During 2011-12 BPwas able to utilize $6.2 billion of these carryforwards; we project a further $12 billion of incomewill be shielded from taxes during the next decade. In total, deferred tax assets reduce thenegative impact of our Macondo projections by roughly $3 per ADS.For oil and gas prices, ourforecasts use prices based on Nymex futures contracts for 2012-14 and our own midcycle priceassumptions for 2015-16. Brent oil pricing: $110 per barrel in 2013, $107 in 2014, $99 in 2015,and $100 in 2016-17. WTI oil pricing: $101 per barrel in 2013, $99 in 2014, $90 in 2015, and $90in 2016-17. Henry Hub natural gas (U.S.): $3.67 per Mcf in 2013, $3.88 in 2014, $4.08 in 2015,and $5.40 in 2016-17.
This is not the complete report. Please go to the website to read the full research report
© 2013 Morningstar. All Rights Reserved. The information, data, analyses and opinions ("Information") contained herein: (1) include the proprietary information of Morningstar and its content providers; (2) may not be copied or redistributed exceptas specifically authorised; (3) do not constitute investment advice; (4) are provided solely for informational purposes; (5) are not warranted to be complete, accurate or timely; and (6) may be drawn from fund data published on various dates. Morningstaris not responsible for any trading decisions, damages or other losses related to the Information or its use. Please verify all of the Information before using it and don’t make any investment decision except upon the advice of a professional financialadviser. Past performance is no guarantee of future results. The value and income derived from investments may go down as well as up. Please see Portfolio Monitor Disclosure Statement for important disclosures.
ß®

Analysis Digest | My Portfolio | October 2013
Edinburgh Investment Trust Plc EDIN16/10/2013 | Jackie Beard
Morningstar Analyst Rating™
ˆRole in Portfolio:Core. This fund can serve as a core holding for UK-based investors with a total-return mind set.
Executive Summary:• Process: Woodford takes a long-term view. He is a contrarian and blends top-down calls with
bottom-up research.• NAV Performance: Returns have improved under Woodford. Their pattern may be lumpy but
he has outperformed peers since taking over in 2008.• People: Investors here are in very good hands with Neil Woodford at the helm.• Parent: Invesco Perpetual has a commendable investment ethos and a solid remuneration
structure.• Board: The board comprises a strong mix of skills and there is good succession-planning in
operation.
Morningstar Opinion:Neil Woodford’s resignation from Invesco has prompted us to move the fund’s rating to UnderReview.The course of events at Edinburgh Investment Trust is somewhat different from thoseat Woodford’s open-end funds. The investment management contract for the trust is currentlywith Invesco; however, the board—being independent—is free to appoint whomever theybelieve is the right firm for the future management of the fund. Thus, it’s not clear-cut who willbe Woodford’s successor here. It could be one of Woodford’s colleagues in the UK Equity team—both Mark Barnett and Ciaran Mallon will be assuming additional responsibilities as a resultof Woodford’s departure--or it could be the case that the board puts the contract out to tenderamong other firms. They have an element of time on their side to make the right decision, insofaras Woodford is in situ until April 2014. Woodford will continue to manage the fund until then,unless the board decides otherwise. Nonetheless, the change in management gives rise touncertainty for investors and thus we have put our rating Under Review until there is clarity onthe future management plans for the fund. At that time we will be able to make a more meaningfulassessment on the fund.
This is not the complete report. Please go to the website to read the full research report
© 2013 Morningstar. All Rights Reserved. The information, data, analyses and opinions ("Information") contained herein: (1) include the proprietary information of Morningstar and its content providers; (2) may not be copied or redistributed exceptas specifically authorised; (3) do not constitute investment advice; (4) are provided solely for informational purposes; (5) are not warranted to be complete, accurate or timely; and (6) may be drawn from fund data published on various dates. Morningstaris not responsible for any trading decisions, damages or other losses related to the Information or its use. Please verify all of the Information before using it and don’t make any investment decision except upon the advice of a professional financialadviser. Past performance is no guarantee of future results. The value and income derived from investments may go down as well as up. Please see Portfolio Monitor Disclosure Statement for important disclosures.
ß®
Analysis Digest | My Portfolio | October 2013
Invesco Perpetual High Income Inc16/10/2013 | Emma O'Neill
Morningstar Analyst Rating™
ˆPortfolio Role:Core. This fund can serve as a core holding for UK-based investors with a total-return mindset.
People:Mark Barnett will assume full management responsibility in April 2014.Parent:Invesco has a commendable investment ethos and a solid remuneration structure.Process:Woodford is a contrarian investor who takes a long-term view.Performance:The fund has delivered outstanding long-term returns but short-term performance can belumpy.Price:The fund’s TER is in line with that of the median fund in its category.
Morningstar Opinion:Following the announcement that Neil Woodford is set to leave Invesco Perpetual in April2014, we are placing the fund’s rating Under Review. Woodford has been at the helm of thisfund since 1988 and was central to our positive view here. Such a long tenure is seldom seenin the fund industry. Mark Barnett, who currently manages the Invesco Perpetual StrategicIncome fund, is set to assume full responsibility for the fund and take over as the head of UKequities at the end of April 2014. Barnett is an established member of the UK equity team whohas been with Invesco Perpetual for over 17 years and has a total of 21 years’ investmentexperience. Woodford is a value investor who has a long-term investment philosophy, whichbegins with the formation of a robust macro view that considers the world from a globalperspective. At the timing of writing we are unsure exactly how Barnett plans to run the fundin future. However, he adopts a similar value-driven investment process to Woodford's, witha long-term investment horizon, on the Invesco Perpetual UK Strategic Income fund, which hehas managed since Jan 2006. Woodford’s emphasis is on delivering a competitive overallreturn and in doing so he is open-minded, pragmatic, and active. Over his tenure the fund hasdelivered stellar absolute and relative returns, returning 13% per annum and outpacing theMorningstar UK Equity Income Category by 3.3 percentage points per annum. The performanceof the UK Strategic income fund over Barnett’s tenure has been similarly impressive (albeitover a shorter period) and the fund has outpaced the Morningstar UK Equity Income Categoryaverage by 2.4 percentage points per annum. Woodford has managed a significant pool ofassets and although his ability to be nimble is limited, his long-term focus and contrarian stylehave mitigated this somewhat. It is unclear yet the process that Barnett will adopt here andhis ability to manage such an extensive book of assets is unproven. Overall we feel it prudentto place the fund’s rating Under Review until we can meet Barnett to discuss his future plansfor the fund.
© 2013 Morningstar. All Rights Reserved. The information, data, analyses and opinions ("Information") contained herein: (1) include the proprietary information of Morningstar and its content providers; (2) may not be copied or redistributed exceptas specifically authorised; (3) do not constitute investment advice; (4) are provided solely for informational purposes; (5) are not warranted to be complete, accurate or timely; and (6) may be drawn from fund data published on various dates. Morningstaris not responsible for any trading decisions, damages or other losses related to the Information or its use. Please verify all of the Information before using it and don’t make any investment decision except upon the advice of a professional financialadviser. Past performance is no guarantee of future results. The value and income derived from investments may go down as well as up. Please see Portfolio Monitor Disclosure Statement for important disclosures.
ß®

Analysis Digest | My Portfolio | October 2013
Aberdeen Asian Smaller Companies IT Plc AAS25/09/2013 | Szymon Idzikowski
Morningstar Analyst Rating™
ŒRole in Portfolio:Niche. This fund is best used at the margin for exposure to Asian smaller companies, and itsspecialism means it’s likely to appeal only to the more risk-tolerant investor.
Executive Summary:• Process: Aberdeen applies a patient, value-based, bottom-up approach.• NAV Performance: Returns have been excellent over both the short and long term.• People: Hugh Young heads a seasoned and settled Asian equities team in the region.• Parent: Strategic acquisitions have broadened Aberdeen’s product base but its Asia and GEM
funds remain key.• Board: It’s a long-standing board that has changed little since the fund’s launch in 1995.
Morningstar Opinion:Our high opinion of Aberdeen Asian Smaller Companies remains intact.For one, the team is oneof the best in its field. Led by Hugh Young, who himself has more than 25 years of investmentexperience in Asian equities, it’s a stable team with longevity of both experience and tenure atAberdeen. The team is based across the region and we think this is particularly beneficial when
investing in smaller stocks, and the team members themselves cite it as a crucial factor in theirinvestment approach. Company meetings pay a critical role in their process and they won’t investin any company they haven’t first met.This investment approach has been in place at Aberdeensince 1985 and, furthermore, it originated in Asia, under Young and the firm’s Asian officecofounder Peter Hames. It’s a process that has been tried and tested over a number of marketcycles and it has stood the test of time—another reason for our conviction here. The teamemphasises long-term quality and looks for management teams that carry the right skills to growa company for the benefit of shareholders. But they don’t chase that growth, and they areprepared to be patient.Indeed, this process has proved its effectiveness. Since this fundlaunched, it has comfortably beaten its Morningstar Asia-Pacific ex-Japan Equity categoryaverage fund. Granted, the latter has a larger-cap bias, so it’s not a perfect comparison, butnonetheless the fund has returned some 10 percentage points annualised above the categoryaverage, and it has beaten the MSCI Asia-Pacific ex-Japan Small Companies index, too. What’smore, the team hasn’t taken excessive risk to achieve this result. In fact, the fund has a lowerrisk profile than its peers over the medium and long term, and that’s despite the use of gearing.This is helped by the team’s patient approach, which results in very low turnover.The use ofgearing here is a constant, although its level may vary depending on prevailing marketopportunities. In May 2012, the board issued GBP 35 million of convertible unsecured loan stockand repaid the short-term borrowings that had been financing the fund’s leverage; while thatmeans the gearing is unlikely to exceed 15% in normal market conditions, it has also had theeffect of increasing the total assets, and thus decreasing the overall costs a little. While notoutright cheap, the fund is competitive among its category peers.All in, we think this fund makesa compelling case for investors seeking small-cap exposure in Asia. It retains our highest rating:Gold.
This is not the complete report. Please go to the website to read the full research report
© 2013 Morningstar. All Rights Reserved. The information, data, analyses and opinions ("Information") contained herein: (1) include the proprietary information of Morningstar and its content providers; (2) may not be copied or redistributed exceptas specifically authorised; (3) do not constitute investment advice; (4) are provided solely for informational purposes; (5) are not warranted to be complete, accurate or timely; and (6) may be drawn from fund data published on various dates. Morningstaris not responsible for any trading decisions, damages or other losses related to the Information or its use. Please verify all of the Information before using it and don’t make any investment decision except upon the advice of a professional financialadviser. Past performance is no guarantee of future results. The value and income derived from investments may go down as well as up. Please see Portfolio Monitor Disclosure Statement for important disclosures.
ß®

Analysis Digest | My Portfolio | October 2013
Newton Asian Income Inc05/09/2013 | Lena Tsymbaluk
Morningstar Analyst Rating™
„Portfolio Role:Supporting Player. This fund is suitable for investors seeking Asia-Pacific ex-Japan equityexposure to diversify a broader portfolio.
People:Experienced manager Jason Pidcock remains at the helm, supported by Newton’s analystteam.Parent:Newton places strong emphasis on thematic investing and allocates large resources to thisendeavour.Process:The manager follows a strict yield discipline aiming for at least 35% more income than theindex.Performance:The fund has delivered very good returns with below-average risk for the category.Price:The retail share class TER is lower than the retail category median.
Morningstar Opinion:We continue to believe Newton Asian Income is a compelling choice for investors seekingincome. The fund’s appeal owes in part to the expertise of its lead manager. Jason Pidcockhas 20 years' investment experience and is one of the first fund managers in the UK to launchan Asian income fund in Nov 2005. His experience and ability make him one of the better Asianincome managers in our view. He also has support from alternate manager Caroline Keen andtwo other team members, as well as Newton’s 20-plus team of career analysts, who helpdevelop thematic research. The manager is mindful of the importance of capital preservationas well as capital growth. The strategy combines a strict yield discipline with Newton’s globalthematic approach based on the belief that no company or market should be considered inisolation. The manager looks for stocks with a dividend yield of 35% above that of the FTSEAW Asia Pac ex Japan index, but no stock is purchased for its yield criteria alone: Each companyis subject to rigorous analysis. The most attractive stocks tend to be those of good quality withdisciplined capital allocation, healthy cash-flow generation, and strong corporate governance.Pidcock also pays attention to earnings growth given its implied effect on dividend growth.This is evident in the portfolio’s weighting in growth stocks, which is normally around a thirdof the portfolio. This results in a portfolio that typically places in the blend column ofMorningstar Style Box. The strategy has led to impressive results over the long term, whilethe income focus has helped to protect the fund in down markets. Since inception, the fundhas ranked in the first or second quartiles of the Asia-Pacific ex-Japan Equity category in everyyear, with the exception of 2007. Overall, the fund has outperformed its category andbenchmark by a wide margin over the period from 1 Dec 2005 to 30 June 2013, with a below-average level of risk. The manager’s significant expertise, his sound and tested approach andconsistent outperformance have earned the fund our Silver rating.
© 2013 Morningstar. All Rights Reserved. The information, data, analyses and opinions ("Information") contained herein: (1) include the proprietary information of Morningstar and its content providers; (2) may not be copied or redistributed exceptas specifically authorised; (3) do not constitute investment advice; (4) are provided solely for informational purposes; (5) are not warranted to be complete, accurate or timely; and (6) may be drawn from fund data published on various dates. Morningstaris not responsible for any trading decisions, damages or other losses related to the Information or its use. Please verify all of the Information before using it and don’t make any investment decision except upon the advice of a professional financialadviser. Past performance is no guarantee of future results. The value and income derived from investments may go down as well as up. Please see Portfolio Monitor Disclosure Statement for important disclosures.
ß®
Analysis Digest | My Portfolio | October 2013
iShares £ Corporate Bond UCITS ETF (GBP) SLXX23/07/2013 | Jose Garcia-Zarate
Profile:The iShares GBP Corporate Bond ETF - previously iShares Markit iBoxx GBP Corporate Bond ETF- offers investors exposure to the GBP-denominated corporate bond market, both from financialand non-financial corporations. Investors have been traditionally attracted to investment-gradecorporate bonds for the expected steady income at higher yields vis-à-vis government bonds ofsimilar rating and an assumed lower risk profile vis-à-vis equity. The corporate bond market inthe UK is underpinned by active demand from pension funds, thus making it larger and moreliquid relative to other European countries. For a UK-based investor, the combination of yieldpick-up and relative security makes this ETF suitable as a core building block of a fixed incomeinvestment portfolio, while non-UK investors are more likely to see it as a satellite element. This ETF tracks an index which restricts its bond universe to only the most liquid issues, whichtend to be from large-cap corporations with ratings not veering significantly from those ofgovernment bonds. However, as the bulk of GBP-denominated corporate bond issuance is long-dated, there is a structural case for a substantial yield pick-up. Investors have to take intoconsideration potential performance risks arising from inflationary pressures and their effect onUK monetary policy. GBP-denominated corporate bonds tend to have much longer maturitiesthan their EUR-denominated counterparts, largely owing to very active demand from pensionfunds. As a result this ETF tracks an index with long maturity and duration metrics. This makesit vulnerable to proportionally higher capital losses relative to shorter duration funds at timesof rising interest rates.Foundamental View:Investor interest in the corporate bond market has grown substantially since the onset of thefinancial crisis. The search for safety away from troubled government bond markets has pushedcorporate bond yields down by a sizeable measure (e.g. GBP-denominated investment gradecorporate bond yields stood at 4.20% on average in June 2013 vs. 8.50% in January 2009).However, despite this decline in yields, credit spreads (i.e. the yield difference to notional lowerrisk assets such as AAA-rated government bonds) has remained positive throughout. Bondsissued by financial corporations usually have the highest credit spreads, followed by industrialand utility. This increase in investor interest in corporate bonds has taken place against abackdrop of increased issuance. The impairment of traditional banking lending channels sincethe onset of the global financial crisis has forced corporations to increase the share of open-market funding to meet their investment and debt refinancing goals. However, the increase incorporate bond demand has outstripped that in supply, hence the downward trend inyields. Despite monetary authorities’ efforts to boost money supply--not to mention the burdenof cleaning up private banks’ balance sheets, which has been forced upon taxpayers--the bankingsector in the world’s developed economies continues to retain a fairly high level of risk aversionwhen it comes to re-opening the lending tap. The easing of financial market tensions in Europesince H2-12 is an important step towards normalisation, but the general backdrop remainsfraught with uncertainty.This general backdrop may allow for steady above-average corporatebond issuance for some time to come, but in the longer run, assuming banking lending normalises,one would expect mean-reversion to kick in. However, remaining concerns about the strengthof the UK recovery and the still impaired bank lending channels despite all the liquidity provisionmeasures undertaken by the Bank of England (e.g. the resumption in June 2012 of the “ExtendedCollateral Term Repo Facility” whereby banks are able to swap assets for cash) may precludefull corrective action. Besides, the corporate bond market in the UK should continue to be wellsupported against a backdrop of ultralow interest rates (e.g. the Bank of England is expected tokeep very accommodative policy settings for a protracted period) and steady demand from thelikes of pension funds.Portfolio Construction:The Markit iBoxx GBP Liquid Corporates Large Cap Index measures the performance of the mostliquid GBP-denominated fixed rate corporate bonds with investment grade rating, irrespectiveof issuing country. Liquid indices are subsets of iBoxx benchmark indices and are designed for
derivatives and ETFs. Eligible new bonds must have a minimum remaining maturity of 1.5 yearsfor inclusion in the index, while the minimum for those already in the index is 1 year. The minimumoutstanding for inclusion in the index is GBP 300mn per individual bond and GBP 0.75bn perissuer. Index calculations are based on bid quotes provided by contributing banks. Analyticalvalues are calculated daily on closing prices. The index is weighted by market capitalisation,subject to an issuer overall cap of 4%. The index is rebalanced monthly on the last calendar day.Coupon cash is invested at at one-month LIBID (i.e. LIBOR minus 12.5 basis points) until the nextrebalancing, when it then is re-invested in the index. The index’s statistical weight split is abroad 35/65 between financials and non-financials. The distribution of the index’s basket ofconstituents is evenly distributed across the maturity spectrum. UK corporations are the largestissuing group, accounting for roughly 40% of the index value. GBP-denominated bonds issuedby US and Dutch-based corporations also have a fairly large representation in the index.Fund Construction:The iShares GBP Corporate Bond ETF was launched in March 2004 and is domiciled in Ireland.iShares uses physical replication to track the performance of the Markit iBoxx Sterling LiquidCorporates Large Cap Index (note – the ETF tracked the Markit iBoxx Sterling Liquid CorporateLong-Dated Bond index from inception until 1-Mar-2013). This ETF distributes dividends on aquarterly basis, with historical data showing a Mar-Jun-Sep-Dec payment pattern. iShares usesstatistical sampling techniques to construct the fund’s basket. As we write (e.g. mid July 2013)the number of holdings in the ETF stood at 270 against roughly 300 components included in theindex’s basket. As such, it can be safely argued that the extent of sampling is minimal. In anycase, statistical sampling techniques employed by the fund would tend to respect the underlyingindex’s key risk characteristics, such as maturity distribution and/or issuer and sub-sectorexposure. iShares may engage in securities lending in order to optimise the ETF’s trackingperformance. BlackRock acts as investment manager on behalf of iShares. The amount ofsecurities that can be lent out is capped to 50% per fund. Lending operations are hedged bytaking UCITS-approved collateral greater than the loan value and by revaluing loans andcollateral on a daily basis. The collateral is held in a ringfenced account by a third party custodian.The degree of overcollateralisation is a function of the assets provided as collateral, but typicallyranges from 102.5% to 112%. Lending revenue is split 60/40 between the ETF and BlackRock,respectively.Fees:The total annual expense ratio (TER) is 0.20%. This is average for European-domiciled ETFsoffering exposure to the corporate bond market. Additional costs potentially borne by investorsand not included in the TER include bid/offer spreads and brokerage fees when buy/sell ordersare placed for ETF shares.Alternatives:For many years iShares was the sole provider of GBP-denominated corporate bond ETFs in theEuropean market, to the extent that the only possible alternative to its Markit iBoxx GBPCorporate Bond ETF was also found in the iShares vending catalogue. We are referring to theiShares GBP Corporate Bond Ex-Financials ETF (TER 0.20%), launched in late 2009 and aimed toinvestors seeking to limit issuer exposure within the corporate bond asset class. Lyxor was thefirst competitor to challenge iShares’ monopolistic grip on this particular segment of the marketwith the launch of the Lyxor iBoxx GBP Liquid Corporate Long Dated ETF in December 2010. Thisis a swap-based ETF that tracks the same index as the iShares ETF. It also charges a TER of0.20%, but has failed to garner much investor interest, with assets under management (AUM)a tiny fraction of those held by the iShares ETF.Launched in 2012 we find the SPDR BarclaysCapital GBP Corporate Bond ETF (TER 0.20%) and the db x-trackers iBoxx GBP Liquid Corporate100 ETF (TER 0.12%). The SPDR ETF is physically replicated, while the db x-trackers ETF issynthetic. As we write, AUM for these ETFs still lag the iShares product by a sizeable margin,although the SPDR ETF has outpaced its synthetic rivals in the AUM stakes. iShares furthercomplements its suite of GBP-denominated corporate bond ETFs with the GBP Corporate Bond1-5 ETF (TER 0.20%) and the GBP Corporate Bond Ex-Financials (TER 0.20%). These arealternatives for those wanting to gain exposure to the GBP-denominated corporate bond market,but wanting to restrict it either in terms of maturity or sector.
© 2013 Morningstar. All Rights Reserved. The information, data, analyses and opinions ("Information") contained herein: (1) include the proprietary information of Morningstar and its content providers; (2) may not be copied or redistributed exceptas specifically authorised; (3) do not constitute investment advice; (4) are provided solely for informational purposes; (5) are not warranted to be complete, accurate or timely; and (6) may be drawn from fund data published on various dates. Morningstaris not responsible for any trading decisions, damages or other losses related to the Information or its use. Please verify all of the Information before using it and don’t make any investment decision except upon the advice of a professional financialadviser. Past performance is no guarantee of future results. The value and income derived from investments may go down as well as up. Please see Portfolio Monitor Disclosure Statement for important disclosures.
ß®

Analysis Digest | My Portfolio | October 2013
Aberdeen Emerging Markets A Acc10/10/2012 | Karine Glauser
Morningstar Analyst Rating™
ŒPortfolio Role:Niche Player. Like all emerging-markets offerings, this fund’s potential for volatility is too greatfor it to play anything more than a small role in a broader portfolio.
People:A well-resourced management team gives this fund a research advantage.Parent:Strategic acquisitions have broadened Aberdeen’s product base but its Asia and GEM fundsremain key.Process:Aberdeen applies a patient, value-based, bottom-up approach.Performance:The long-term record is impressive but investors can expect short-term bouts ofunderperformance.Price:The fund is marginally more expensive than its category median.
Morningstar Opinion:Aberdeen Emerging Markets is a strong choice for emerging-markets equity exposure. Thefund benefits from a very robust process and a well-resourced team, headed by Devan Kalooand Hugh Young. The global emerging-markets team comprises over 35 members withextensive experience in the region. We particularly like the stability of the team and the lowlevel of turnover, with senior managers having been with Aberdeen for more than 10 years.The Asia Pacific ex-Japan portion of this fund is managed from Singapore, under thestewardship of Young, while the London-based team, headed by Kaloo, covers emergingmarkets ex-Asia. The chief attraction continues to be the process, which has been appliedconsistently since the fund’s inception and is the cornerstone of Aberdeen’s investmentphilosophy. This very bottom-up process reflects the team members' strong emphasis onfinding value and quality. In their view, quality companies exhibit sustainable, competitivebusiness models, strong balance sheets, high returns on assets and capital, and good corporategovernance. As a result, the team favours Hong Kong-domiciled companies to gain exposureto China’s growth as corporate governance is typically stronger there. The team considersinvestments for the long term--as highlighted by the fund’s low turnover--and pays littleattention to the benchmark when constructing the portfolio. They are also firm believers thatreturns should be considered on an absolute basis, rather than relative, and are particularlyaware of capital losses. This philosophy, combined with the focus on quality and longer-terminvesting, can lead to periods of relative underperformance, particularly in momentum-drivenmarkets; over the longer term, however, this philosophy has been proven, with the fundachieving strong returns over one, three, and five years and since inception. This fund benefitsfrom a stable global and well-resourced team, proven and rigorous investment process, anda compelling track record over the long term. We maintain our highest rating, Gold.
© 2013 Morningstar. All Rights Reserved. The information, data, analyses and opinions ("Information") contained herein: (1) include the proprietary information of Morningstar and its content providers; (2) may not be copied or redistributed exceptas specifically authorised; (3) do not constitute investment advice; (4) are provided solely for informational purposes; (5) are not warranted to be complete, accurate or timely; and (6) may be drawn from fund data published on various dates. Morningstaris not responsible for any trading decisions, damages or other losses related to the Information or its use. Please verify all of the Information before using it and don’t make any investment decision except upon the advice of a professional financialadviser. Past performance is no guarantee of future results. The value and income derived from investments may go down as well as up. Please see Portfolio Monitor Disclosure Statement for important disclosures.
ß®

Analysis Digest | My Portfolio | October 2013
BlackRock Global Funds - World Mining A220/08/2012 | Emma O'Neill
Morningstar Analyst Rating™
ŒPortfolio Role:Niche Player. Precious metals equities can have a low correlation with other assets, but thisfund will also be exposed to base metals and coal equities, which tend to be more economicallysensitive.
People:The fund is managed by one of the best-resourced teams in the sector.Parent:BlackRock is the world’s largest asset manager and has significant strength in a number ofareas.Process:The rigorous assessment of both companies and commodities adds extra depth to the team'sanalysis.Performance:Despite struggling in 2008, the fund has delivered attractive absolute returns since launch.Price:The fund’s TER modestly exceeds the category median.
Morningstar Opinion:This is a compelling fund for investors seeking exposure to the mining sector. This fund iscomanaged by Evy Hambro and Catherine Raw. Hambro has been in charge here since thefund's launch in March 1997 and we like the consistency of approach this brings. He has helpedbuild the natural resources team into a well-resourced, cohesive group. He was appointed co-head of the team in April 2009 when Graham Birch retired and he became sole head in June2012 as Robin Batchelor stepped down. Catherine Raw was named comanager on the fund in2010, although she has worked on the natural resources team since 2003 when she initiallyjoined MLIM (now BlackRock). Indeed, the fund benefits from significant analyst resourcesand we like the stability this management partnership brings to the fund. In our opinion, themanagers’ process is comprehensive in considering the outlook for both commodity prices andfor the individual mining companies, with an emphasis on meeting company managementteams. They aim to deliver steady outperformance of the benchmark through a risk-awareapproach. Whilst we are carefully monitoring the capacity of the strategy (it held over USD11 billion as at July 2012), we believe the managers’ long-term approach and historic emphasison large, liquid companies means they should be able to manage a large fund withoutsignificantly impairing performance. Performance since launch is robust, comfortablyoutpacing the HSBC Global Mining index. However, the long-term track record was dented byunderperformance in 2008, due predominantly to the fund’s structural underweight in goldequities and an underweight to the giant stocks relative to the index. Nonetheless, for investorsseeking pure exposure to mining sector, we believe this is one of the strongest offerings. Thereare many factors in the fund’s favour, notably the strong team and robust process. Whilst wewould note that the TER exceeds its category median despite the high level of assets undermanagement and the firm’s large size, we have sufficient conviction in the manager’sestablished approach to award a Gold rating.
© 2013 Morningstar. All Rights Reserved. The information, data, analyses and opinions ("Information") contained herein: (1) include the proprietary information of Morningstar and its content providers; (2) may not be copied or redistributed exceptas specifically authorised; (3) do not constitute investment advice; (4) are provided solely for informational purposes; (5) are not warranted to be complete, accurate or timely; and (6) may be drawn from fund data published on various dates. Morningstaris not responsible for any trading decisions, damages or other losses related to the Information or its use. Please verify all of the Information before using it and don’t make any investment decision except upon the advice of a professional financialadviser. Past performance is no guarantee of future results. The value and income derived from investments may go down as well as up. Please see Portfolio Monitor Disclosure Statement for important disclosures.
ß®

Disclosure | My Portfolio | October 2013
This report summarises the composition characteristics of a portfolio of securities created by you. It considers broad asset allocation and regional exposures, security style and sector exposure toprovide a variety of ways for considering the level of diversification within a portfolio, its potential riskiness and its possible behaviour in the future. The information contained in this report is fromthe most recent information available to Morningstar and may or may not be an accurate reflection of the current composition of the securities included in your portfolio.
Your BenchmarkThe benchmark is the Morningstar category index chosen by you when you've created your portfolio in Portfolio Manager.
Performance – Growth ChartThe graph compares the growth of a fund with that of the benchmark. The returns are not adjusted to reflect sales charges or the effects of taxation, but are adjusted to reflect actual ongoing fundexpenses and assume reinvestment of dividends and capital gains. If adjusted, sales charges would reduce the performance quoted. The index is an unmanaged portfolio of specified securities andthe index average does not reflect any initial or ongoing expenses. A fund's portfolio may differ significantly from the securities in the index. The index shown may differ from the index/benchmarkprovided in the fund's prospectus.
Potential Value ChartIn this section we provide a hypothetical outlook on your portfolio’s future performance highlighting the percentage of achieving the values we project.
Asset AllocationThis pie chart and table show the portfolio's exposure to the following broad asset classes: Stocks, Bonds, Cash and Other. The Other category represents an asset class that Morningstar recognisesbut classifies outside of the asset classes listed above. (For example, real estate is typically classified as Other.) Not Classified is for those securities Morningstar does not recognise or track. Thetables adjacent to the pie chart identify the net asset allocation percentages of the portfolio, as well as the component long positions (assets) and short or marginal positions (liabilities) of theportfolio.
World Regions and Stock SectorWorld Regions: this data set provides a broad breakdown of a portfolio’s geographical exposure, by region and by market maturity. Only non-cash equity assets are evaluated in determining theexposures. Not Classified indicates the percentage of the equity portion of the portfolio for which Morningstar is unable to assess region or origin. Stock Sector: This table shows the percentageof the portfolio’s equity assets invested in each of the three supersectors (cyclical, sensitive, defensive) and 11 major industry subclassifications. The Sector Graph accompanying the tabledemonstrates the sector orientation of the portfolio in relation to the Morningstar Broad Market Index. Not Classified is for those securities Morningstar does not recognise or track.
Risk/Return Scatter Graph and Risk Measures in Top 10 Portfolio HoldingsThe risk/reward scatter plot is based on each holding's risk and return over the most recent three-year period. Risk is measured as 3-year standard deviation of return. Return is measured as 3-yearmean return. The risk/reward scatter plot also contains the portfolio's risk and return. In Risk Measures in Top 10 Portfolio Holdings, the standard deviation shows how far a set of values are spreadabove and below the average for a particular fund type. If the standard deviation is a high number, positive or negative, then the fund has performed that far above or below the average. If thestandard deviation is low then the fund has performed closer to the average. Mean is the annualised performance of a fund over three years.
Correlation MatrixThe matrix shows the performance correlation between different holdings. A correlation of 1 indicates the two holdings move in the same direction, a correlation of -1 indicates the two holdingsmove in opposite directions and a correlation of 0 means that no correlation could be found. A correlation of -1 will offer maximum diversification.
Morningstar RatingFor funds, the Morningstar Rating is calculated for funds with at least a three-year history. It is a measure of past performance based on a Morningstar risk-adjusted return measure that accountsfor variation in a fund's monthly performance, placing more emphasis on downward variations and rewarding consistent performance. The top 10% of funds in each category receive 5 stars, thenext 22.5% receive 4 stars, the next 35% receive 3 stars, the next 22.5% receive 2 stars and the bottom 10% receive 1 star. The Morningstar Rating for Funds is applied to open-end funds (OEICsand unit trusts), closed-end funds (including investment trusts) and exchange-traded funds. For stocks, the Morningstar Rating identifies whether a stock is trading at a discount or premium to itsintrinsic worth or fair value, as estimated by Morningstar analysts. 5-star stocks sell for the biggest risk-adjusted discount to their fair values, i.e. we consider these stocks to be currently undervaluedby the market, whereas 1-star stocks trade at the greatest premiums to their intrinsic worth, i.e. we consider these stocks to be overvalued by the market. A 3-star rating indicates the stock is fairlyvalued by the market relative to our valuation. Four key components drive the Morningstar rating: our assessment of the firm’s economic moat, our estimate of the stock’s fair value, our uncertaintyaround that fair value estimate and the current market price.
Morningstar Analyst RatingThe Morningstar Analyst Rating is not a credit or risk rating. It is a forward-looking and subjective evaluation performed by the mutual fund analysts of Morningstar, Inc. Morningstar evaluatesfunds based on five key pillars, which are process, performance, people, parent and price. Morningstar's analysts use this five pillar evaluation to identify funds they believe are more likely tooutperform over the long term on a risk-adjusted basis. Analysts consider quantitative and qualitative factors in their research, and the weighting of each pillar may vary. The Analyst Rating ultimatelyreflects the analyst's overall assessment and is overseen by Morningstar's Analyst Rating Committee. The approach serves not as a formula but as a framework to ensure consistency acrossMorningstar's global coverage universe. The Morningstar Analyst Rating is applied to actively-managed funds, i.e. open-end funds (OEICs and unit trusts) and closed-end funds (including investmenttrusts).
The Analyst Rating scale ranges from Gold to Negative, with Gold being the highest rating and Negative being the lowest rating. A fund with a "Gold" rating distinguishes itself across the fivepillars and has garnered the analysts' highest level of conviction. A fund with a 'Silver' rating has notable advantages across several, but perhaps not all, of the five pillars-strengths that give theanalysts a high level of conviction. A "Bronze"-rated fund has advantages that outweigh the disadvantages across the five pillars, with sufficient level of analyst conviction to warrant a positiverating. A fund with a 'Neutral' rating isn't seriously flawed across the five pillars, nor does it distinguish itself very positively. A "Negative" rated fund is flawed in at least one if not more pillarsand is considered an inferior offering to its peers. Analyst Ratings are reevaluated at least every 14 months.
For more detailed information about Morningstar's Analyst Rating, including its methodology, please go to http://corporate.morningstar.com/us/documents/MethodologyDocuments/AnalystRatingforFundsMethodology.pdf. The Morningstar Analyst Rating should not be used as the sole basis in evaluating a mutual fund. Morningstar Analyst Ratings are based on Morningstar'scurrent expectations about future events; therefore, in no way does Morningstar represent ratings as a guarantee nor should they be viewed by an investor as such. Morningstar Analyst Ratingsinvolve unknown risks and uncertainties which may cause Morningstar's expectations not to occur or to differ significantly from what we expected.
© 2013 Morningstar. All Rights Reserved. The information, data, analyses and opinions ("Information") contained herein: (1) include the proprietary information of Morningstar and its content providers; (2) may not be copied or redistributed exceptas specifically authorised; (3) do not constitute investment advice; (4) are provided solely for informational purposes; (5) are not warranted to be complete, accurate or timely; and (6) may be drawn from fund data published on various dates. Morningstaris not responsible for any trading decisions, damages or other losses related to the Information or its use. Please verify all of the Information before using it and don’t make any investment decision except upon the advice of a professional financialadviser. Past performance is no guarantee of future results. The value and income derived from investments may go down as well as up. Please see Portfolio Monitor Disclosure Statement for important disclosures.
ß®