Embed Size (px)
Citation preview

8/8/2019 Portfolio of Pricing Options Draft 1
http://slidepdf.com/reader/full/portfolio-of-pricing-options-draft-1 1/17
1
A Portfolio of Pricing Options for Public Sector Cadastral
OrganisationsSamwel Alananga-Sanga;
School of Real Estate Studies; Ardhi University;
Department of Land Management and Valuation; P.O.Box 35176,Dar es salaam, Tanzania.
Fax:+255-22-2775448, 2775391Mobile: +255 757 965150
Email: [email protected];
Walter de Vries, ITC faculty of Geoinformation Science and Earth
Observation;University of Twente: Department of Urban and Regional Planning and Geo-information
Management; Phone : +31 (0)53 4874475;
Fax: +31 (0)53 4874575;
Email: [email protected]
Abstract
The relationship between pricing options for cadastral products and cost recovery is often
portrayed to be two way, mandatory and automatic. However it is also evident that most
cadastral organisations lack the capability to ascertain costs per product hence unable todirectly match pricing options with cost recovery. Then a question arises as to whether the pricing options being implemented are in any way related to the imposed levels of cost
recovery. This study takes a qualitative approach to understanding this question. First by
using literature review pricing options and cost recovery regimes are defined and the link between them is established. E-survey was used to collect empirical data from 35 cadastral
organisations across the globe using key-informant technique. The collected data were
analysed using SPSS tools to establish the strength of the relationship between investigatedvariables. The result revealed a significantly strong relationship between cost recovery
regimes and pricing options. However consistency in responses was poor though statistically
significant. This means even if the imposition of a particular cost recovery regime
necessitate the adoption of a certain pricing option or a set of pricing options, that or those pricing options are not exclusive for that regime only. Therefore it is possible to infer
possible pricing options for each cost recovery regime but not the other way round.
Cadastral organisations under partial cost recovery regimes are likely to exhibit a wider range of pricing option because it is naturally designed to accommodate many policy goals
where as a full cost recovery regime have limited option depending on the attached level of
autonomy.
Key Words: Pricing options, Cost recovery regimes, cadastral products; cadastral
organisations;
1. Introduction
Charging for the provision of cadastral information by public sector cadastral organizationshas been challenged by both intellectuals and the general public (Clark M., 2007). Oneargument against charging is that as long as cadastral organisations are government entities,
charging for their products and services is unjustifiable since those products are produced
through tax payer’s money (Gompel, R. V. and J. Steyaert, 2002). In this context chargingseem to be unfair as those individuals who paid for the provision of cadastral products and
services through taxes pay again for the same product or/and service. Despite this criticism,
most public cadastral organisations whether independently or in corroboration with the
8/8/2019 Portfolio of Pricing Options Draft 1
http://slidepdf.com/reader/full/portfolio-of-pricing-options-draft-1 2/17
2
private sector, implements some form of charging by applying the user pay principle (Dale,
P. F. 2003). The principle provide that if public sector organisation are not making profit,they may charge a cost recovery price. However many researchers coincides that the whole
process of establishing costs for information products is hardly demonstrable (Gompel, R. V.
and J. Steyaert, 2002). This raises a question whether the prices charged are actually cost
recovery or not. This study provide a qualitative approach to address that question. Insection 2-3 literature review is used to define two concepts i.e. pricing options and cost
recovery regimes and establish a theoretical relationship between them. The concept were
necessary because it is almost impossible to establish the actual costs for each unit of a finalinformation product, due to team nature of the output (see Alchian A.A. and H. Demsetz,
1972). Section three explains the approach of the study specifically for test statistics. Data
collected through e-surveys and results of analysis are presented in section four wherediscussions and reccommendations are also provided.
2. Pricing options for cadastral products
Cadastral products are a subcategory of Public Sector Information (PSI) which by it nature
may be considered public good. Eaton J.J. and D. Bawden (1991) provide five characteristics of information products pertinent for cadastral products which are; one, non-
rivalriness i.e. the consumption by one may not reduce its availability to others: two, non-
excludability in consumption three, its value is not readily quantifiable, four, It is not a staticresource to be stored and five, it is unique for each end user. These characteristics makes
charging most PSI a controversial issues since it is not physically and economically feasible
to identify and charge consumers and to exclude non-purchasers or it may be costly and, inthe extreme virtually impossible (see Feeny D. et al. 1990). Likewise, charging for the
provision of cadastral products is highly controlled by rules and regulations which impede
price setting autonomy and incentives to reduce costs (Pollock, 2008). Despite theseconstraints, a number of pricing options are being implemented by cadastral organisations
across the globe. This means under certain circumstances it is possible to have a system of dissemination which may include a mechanisms to monitor the use of cadastral products, or exclude consumption; such as through access controls or licenses in on-line systems (Walsh
and Woods, 2001). Likewise the current global trend suggests that cadastral services have
been restructured and the private sector has been included in the provision of cadastral
products in many countries (Demir H. and A. Yavuz, 2009). Thus cadastral products arenot pure public product rather can be regarded as semi public products since they exhibit
both characteristics of public products and private products i.e. double edged instruments
(Poe, Bishop et al., 1992; see also Morris S. and Hyun Song Shin, 2002).
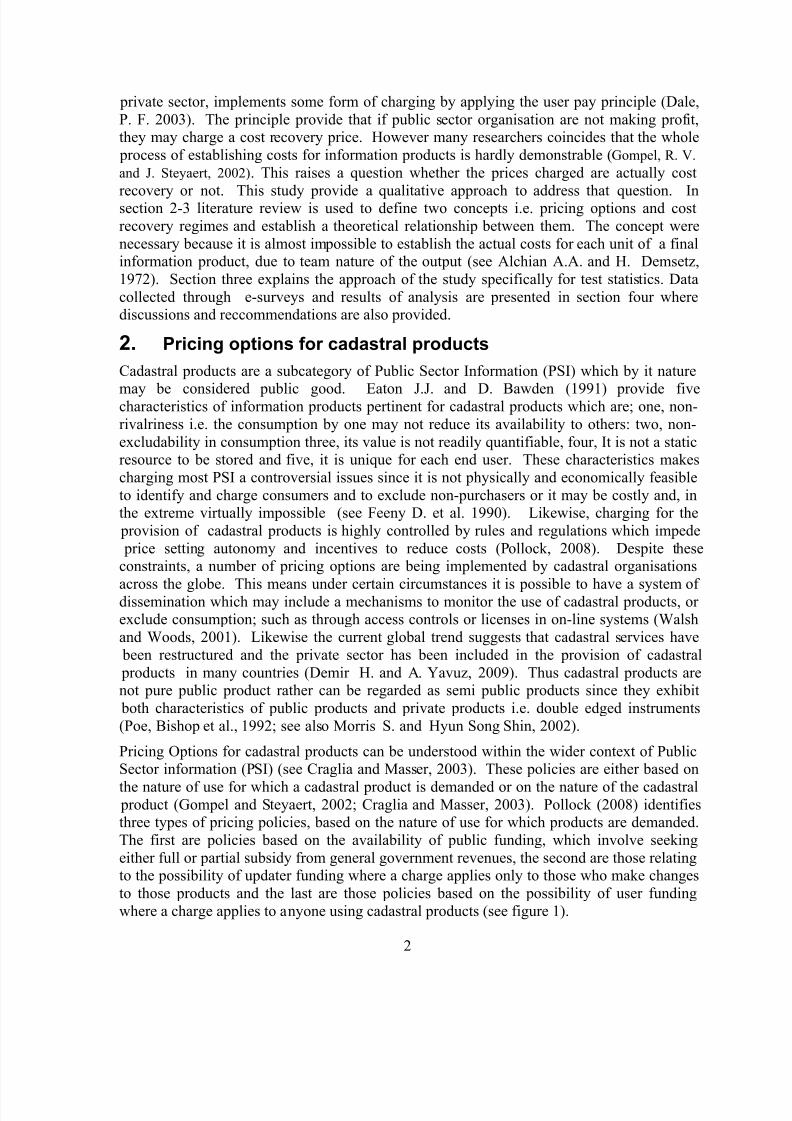
Pricing Options for cadastral products can be understood within the wider context of PublicSector information (PSI) (see Craglia and Masser, 2003). These policies are either based on
the nature of use for which a cadastral product is demanded or on the nature of the cadastral product (Gompel and Steyaert, 2002; Craglia and Masser, 2003). Pollock (2008) identifiesthree types of pricing policies, based on the nature of use for which products are demanded.
The first are policies based on the availability of public funding, which involve seeking
either full or partial subsidy from general government revenues, the second are those relatingto the possibility of updater funding where a charge applies only to those who make changes
to those products and the last are those policies based on the possibility of user funding
where a charge applies to anyone using cadastral products (see figure 1).

8/8/2019 Portfolio of Pricing Options Draft 1
http://slidepdf.com/reader/full/portfolio-of-pricing-options-draft-1 3/17
3
The Productivity Commission (2001), classifies pricing policies based on the nature of
cadastral products into two broad categories: the first is taxpayer funded ‘basic products’comprising collection and compilation of data and some (but not necessarily all) analysis and
the second is dissemination and ‘cost recovered additional products’ which are further
categorised into three groups, the first is Commercial products, which the private sector
could provide, the second is Incremental products, that only the public sector organisationcan provide, and the last is marginally costed products, which only the public sector
organisation can provide (see also Craglia and Masser, 2003). ‘Basic products’ are indirectly
charged to all citizens through tax while additional products are charged through a pricesetting mechanism.
Pricing policies are associated with a particular pricing goal. Pollock (2008) identifies three
pricing policy goals, which can be used for charging cadastral products:- the first is profit-
maximization goals: this is defined by the market demand for cadastral products provided bya particular cadastral organisation. The second is Average Cost (AC) or Cost-recovery
policy goals: this requires prices to be set at a level equal to long-run AC. The last is
economic efficiency goal where prices are set to equal the short-run Marginal Cost (MC).
That is the cost of supplying a unit of product to an extra user (Dole D. and I. Bartlett, 2004). In this research these pricing policy goals are combined with pricing policy options for
funding cadastral products leading to four pricing options (figure 1). The term ‘pricingoptions’ as used in this research, refers to alternative ways of assigning prices to cadastral
products as explain below. However for the purpose of data collection and analysis only
three categories were used.
Figure 1: Pricing options for cadastral products
Full cost chargeswith profit
Full costcharges
Subsidisedfee
Cost recovered
additional products
Pricing policybase
User
funding Basic
products
Pricing Policy
Updater
funding Public
funding
Profit
=AC+ Full cost
=AC
Partialsubsidy
Fullsubsidy
Marginal
cost (MC)
Nature of the Products Nature of Use
Completely freeof charge

8/8/2019 Portfolio of Pricing Options Draft 1
http://slidepdf.com/reader/full/portfolio-of-pricing-options-draft-1 4/17
4
The first pricing option is “completely free of charge” where the final consumers get the
product without paying anything. This option is favoured on the ground that it offer accessto all hence democratic (Longhorn and Blakemore, 2008), it avoid double taxation since
taxpayers have already paid for the collection of data (Van der Molen, 2001; Longhorn and
Blakemore, 2008). Also it has a higher possibility to stimulate economic growth due to
increased businesses which may employ more people and ultimately generate more taxeswhich can further enhance the provision of cadastral products (see Longhorn and Blakemore,
2008; Wagner R. P., 2003). However it can impede the development of new products and
operate against the financial interests of the governments since even if lower prices increasesthe use of cadastral products that does not automatically mean either increased tax revenue or
decreased societal cost (Clark M., 2007). This is because if information products are offered
at ‘completely free of charge’ pricing option, users are likely to demand more than theywould otherwise (Productivity Commission, 2001).
The second option for pricing cadastral products is ‘subsidised fee’ pricing option where
marginal charges or a fees that is in no way related to the true costs or Subsidy costing-flat
rate payment are applicable (see Cheng, Dogan et al., 2006). In practice some cadastral
organisations do not have a clear link between spending and sources of revenues and oftensome revenues generated are submitted to a pool of common government revenues (Barnes
G., 2000). Although some scholars advocates the ‘subsidised fee’ pricing optionsspecifically a MC approach where full costs for information products including shipping,
promotion, personnel and IT costs are charged (see Craglia and Masser, 2003; Clark M.,
2007), the provision of information products at a highly subsidised fees is so problematic
which has forced many governments to move away from direct taxation to indirect taxationand full cost user charges (see Longhorn and Blakemore, 2008).
The third pricing option is “full Cost charges” where there is no subsidy and the organisation
charges either either MC or AC. However the use of either approach may lead to someshortcomings. The MC pricing is often seen as inappropriate when an organisation is
required to recover all the costs. Holland (1995) states that, providing information for
commercial purposes at MC unfairly subsidizes private profit at taxpayer’s expenses. In atwo sided market (where the buying and selling takes place at a platform i.e. internet), Bolt
and Tieman (2005), proves that setting prices equal to MC (without a fixed costs
component), will induce losses for the monopoly platform. Rossi and James (1975) arguethat, Setting price equal to MC will be consistent with full cost-recovery only if, MC is
greater or equal to AC. If MC is less than AC, subsidisation will be necessary.
The last pricing option that may be adapted for charging cadastral products is ‘full cost
charges with profit’ where prices are set not only to reflect the full costs of producing a product but also includes a profit for reinvestment or for meeting some other future
obligations (Absorption Costing-all cost or AC plus mark-up) (Cheng, Dogan et al., 2006).Given the monopoly nature of most cadastral organisations different pricing strategies may be adopted such as differentiation of access to cadastral products by time, place and duration,
differentiation of actuality, completeness or extent of details of a product. Differentiation
could also be in terms of speed of delivery, user friendliness and support. Bundling of information products may also be implemented for profit making purposes (see Cheng, W.
and S. Yuan, 2008). However making profit is seen as unfair for government agencies like

8/8/2019 Portfolio of Pricing Options Draft 1
http://slidepdf.com/reader/full/portfolio-of-pricing-options-draft-1 5/17
5
cadastral organisations (Gompel and Steyaert, 2002), therefore most of these pricing
strategies are not well advocated in land administration literature.
3. Cost recovery regimes.
Cost-recovery is a mechanism for raising revenues in order to recoup all, or some, of the
costs incurred by the public organization through tariffs or charges (Dole D. and I. Bartlett,2004). The Productivity Commission (2001) defines cost recovery as the recovery of some
or all of the costs of a particular activity. Cost recovery is favoured as an important means of
improving the efficiency with which products and services are produced and consumed
(Productivity Commission, 2001; Commonwealth of Australian, 2005). It can improveagency efficiency by instilling cost consciousness and promoting demand responsiveness
charges for goods and services (Clark M., 2007; Dale, 2003;). Cost recovery can give an
important message to users or customers about the costs of resources involved and improveequity by ensuring that those who use products and services or who create the need for
information bear the costs as well as promote efficient use of government services by
reducing frivolous demand often associated with free services ( KPMG Consulting and
Sears, 2001; Dale, 2003). It is on the bases of these promising outcomes that manygovernments impose cost recovery regimes upon cadastral organizations. However there are
also negative impacts associated with cost recovery (McDonald D.A. and J. Pape (eds),
2002).
Figure 2.2 Defining cost recovery regimes for cadastral organisations
The concept of cost recovery regimes is used in this study to capture the perception of
cadastral organizations (specifically managers) regarding the role of charging on the overall
YESNO
YES
Does your organisation get a fixedbudget from the government?
YES
NO YES
Does the current mode of chargingproducts reflect any cost recovery
policy?
Does the government claim
an of our revenues?
Is the claim by the governmentbased on contractual
a reement?
Does the claim comprise allof the revenues generated?
No Cost RecoveryRegime
Partial CostRecovery Regime
Full Cost RecoveryRegime
NO
YES NO
NO
8/8/2019 Portfolio of Pricing Options Draft 1
http://slidepdf.com/reader/full/portfolio-of-pricing-options-draft-1 6/17
6
financial performance of the organization given the central role of the government in the
provision of cadastral products. It is a constrained clustering mechanism which categorisescadastral organizations based on their ability to recoup costs and to use the proceeds for
further provision of cadastral products. Thus three categories of “cost recovery regimes”
(CRR) were defined as shown in figure 2.5.1. These are ‘no cost recovery’ regime, ‘partial
cost recovery’ regime and ‘full cost recovery’ regimes.Under ‘no cost recovery’ regimes (NCR) the generation or collection of cadastral products is
done by the governments which rely on statutory powers to create the products (Clark M.,
2007). If under certain legal obligations a cadastral organisation is to charge for its products,
the revenues generated by the organisation are submitted to the pool of general governmentrevenues such as taxes, fines and other user fee (Barnes G., 2000). Under these
circumstances the cadastral organisation may lack incentives to match products with demand
(Heeks, 2002). Pricing options that may be adopted depend on the overall government policies (Longhorn and Blakemore, 2008; Pollock, 2008). Under “Partial Cost Recovery”
regime (PCR) the funding for running the organisation are contributed by both the
organisation the government through service level agreement (Dale, 2003). The last regime
is ‘ Full cost recovery’ regime (FCR) where the charges applied for cadastral products areoften equal (full cost charges) or higher than the AC (full cost charges with profit) of a
product (Van der Molen, 2001).
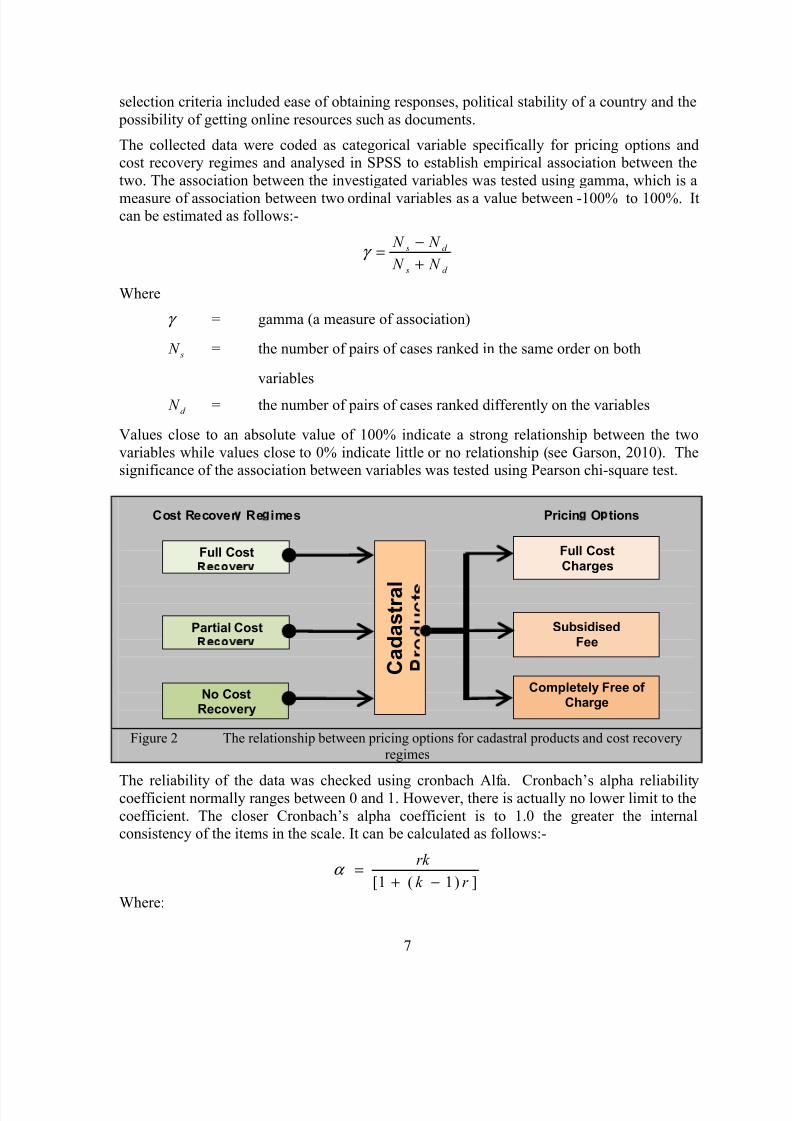
The literature review so far provides definitions and establishes the theoretical relationship between cost recovery regimes and pricing options for cadastral products. Figure 3
summarises that relationship and forms the basis upon which data were collected. It can be
seen that cost recovery regimes are associated with certain pricing option or a set of pricingoptions for cadastral products offered under each of those regimes. However at product level
there are limited empirical researches with findings that suggest the adoption of specific
pricing option for a particular cadastral products or a set of cadastral products when a pre-specified cost recovery regimes is imposed to the provider (cadastral organizations). This is
because cost recovery regimes are imposed based on the legal and political requirements
(holistic in nature) while pricing options are influenced by the level of autonomy a cadastralorganization may have in setting prices and other market condition for each cadastral
products (specific in nature). To understand the pricing options that may be available to a
cadastral organisation in pricing cadastral products, empirical data from 35 cadastralorganisations were collected and analyzed as explained using the approach described in the
following section.
4. Research Methodology
Since there is no specific number of cadastral products, it was important first to definesample products for inclusion into the study. Seven cadastral products were purposely
selected based on the presumed fact that most cadastral organization provide them and may
be in a position to understand what comprises those products (see Appendix A). A survey
questionnaire was designed and distributed online using the surveymonkey facility(www.surveymonkey.com) to a number of cadastral organizations across the globe, of which
35 responded. The cadastral organisations as well as respective respondent from those
organisations were purposely selected based on their ability to respond to the questions posed following a prearranged communication with the respective organisation. Other
8/8/2019 Portfolio of Pricing Options Draft 1
http://slidepdf.com/reader/full/portfolio-of-pricing-options-draft-1 7/17
7
selection criteria included ease of obtaining responses, political stability of a country and the
possibility of getting online resources such as documents.
The collected data were coded as categorical variable specifically for pricing options andcost recovery regimes and analysed in SPSS to establish empirical association between the
two. The association between the investigated variables was tested using gamma, which is a
measure of association between two ordinal variables as a value between -100% to 100%. Itcan be estimated as follows:-
d s
d s
N N
N N
+
−=γ
Where
γ = gamma (a measure of association)
s N = the number of pairs of cases ranked in the same order on both
variables
d N = the number of pairs of cases ranked differently on the variables
Values close to an absolute value of 100% indicate a strong relationship between the two
variables while values close to 0% indicate little or no relationship (see Garson, 2010). Thesignificance of the association between variables was tested using Pearson chi-square test.
Figure 2 The relationship between pricing options for cadastral products and cost recovery
regimes
The reliability of the data was checked using cronbach Alfa. Cronbach’s alpha reliabilitycoefficient normally ranges between 0 and 1. However, there is actually no lower limit to the
coefficient. The closer Cronbach’s alpha coefficient is to 1.0 the greater the internalconsistency of the items in the scale. It can be calculated as follows:-
])1(1[ r k
rk
−+=α
Where:
No CostRecovery
Cost Recover Re imes
Full CostCharges
Completely Free of Charge
SubsidisedFee
Full Cost
Partial Cost
C a d a s t r a l
Pricin O tions

8/8/2019 Portfolio of Pricing Options Draft 1
http://slidepdf.com/reader/full/portfolio-of-pricing-options-draft-1 8/17
8
α = Cronbach Alfa
k = the number of items considered and
r = the mean of the inter-item correlations
The size of α is determined by both the number of items in the scale and the mean inter-
item correlations. The rules of thumb for the consistency in responses is that if α ≥ 0.9 – itis excellent, if α > 0.8 – it is good, if α > 0.7 it is acceptable, if α > 0.6 it is
questionable, if α > 0.5 it is poor, and if α ≤ 0.5 it is unacceptable” (Griem, et al., 2003).
The data collected and analysed in the study are summarised in Appendix B.
5. Findings and Discussion
Table 1, shows the results of cross tabulation in SPSS in terms of the relationship between pricing option and cost recovery regimes. If all the seven products are considered in the
analysis, it was observed that there was a significant association between the two as shown in
table 2. That is the imposition of a certain cost recovery regime requires the adoption of certain pricing option specific for certain products. However the association between cost
recovery regimes and pricing option was not significant for all products. The imposition of cost recovery regimes seem to influence the adoption of specific pricing options for
Cadastral maps, General real property information and extracts from cadastres (see Appendix
C and D). When the remaining products with insignificant association are removed from the
analysis the association between cost recovery regime significantly improves from λ = 0.60
to λ =0.76 (see table 3).
Mode of Cost Recovery Total
No CostRecoveryRegime
Partial CostRecoveryRegime
Full CostRecoveryRegime
Completely
Free of Charge
count 2 4 0 6
% of responses within a mode of cost recovery
3% 7% 0% 4%
Subsidised fee count 21 12 0 33
% of responses within a mode of cost recovery
35% 21% 0% 21%
Full CostCharges
count 37 41 40 118
P r i c i n g O p t i o n s
% of responses within a mode of cost recovery
62% 72% 100% 75%
Total count 60 60 57 40% of responses within a mode of cost recovery
100% 100% 100% 100%
Consistency of responses (all
Products-)
α = 0.44
Consistency of responses (Productswith significant association)
α = 0.51
Strength of Association (all products λ = 0.60 Strength of Association (Productswith significant association)
λ = 0.76
Table1: The relationship between pricing options for cadastral products and cost
recovery regimes

8/8/2019 Portfolio of Pricing Options Draft 1
http://slidepdf.com/reader/full/portfolio-of-pricing-options-draft-1 9/17
9
The analysis provides substantial evidence that cadastral organizations converge towards
certain pricing options when cost recovery regimes are imposed and implemented. However
the level of consistency in responses as given by Cronbach Alfa (α ), was too small to be
acceptable (α = 0.44 i.e. unacceptable, and improves to 0.51,
i.e. poor, with only products that are significantly associated i.e. poor). That means there islimited evidence to suggest that higher levels of cost recovery regimes were directly linked
to higher levels of pricing option. This was true even when the products were only those
with a high degree of association i.e. λ =0.76 (see Appendix D). From the test statistic
results it can be observed that there is a significant consistency among responses but using
the rule of thumb set above, such consistency is too small to conclude that the imposition of
cost recovery regimes necessitate the adoption of certain levels of pricing option. Thismeans that if cost recovery is defined to mean both charging and ultimate use of financial
resources for further provision of cadastral products, the adoption of any cost recovery
requirement does not dictate a specific pricing option. Table 1 shows that FCR requires theadoption of full cost or full cost with profit charges but, such pricing option are not exclusive
for that regime only. They are highly implemented under other cost recovery regimes as
well. The reason for this is that pricing goes beyond cost recovery; it is a tool of public policy that can be used for a variety of social, economic, and financial purposes (Dole D. and
I. Bartlett, 2004).
Therefore while on one hand cost recovery regimes seem to be more specific towards pricing
options, pricing options are not. There are for example a substantial number of responsesfrom organizations under NCR charging at either full cost or full cost charges with profit.
This can be interpreted to mean that, though cadastral organisations across the globe coincide
that the provision of cadastral products should be paid for by beneficiaries that does notautomatically translate to mean the revenues generated thereof are used for further provision
of cadastral products. This may be a good explanation for inadequate provision of cadastral
products for cadastral organisations in transition (Heeks, 2002).Cost recovery for cadastral information need to be understood as an attempt to charge for the
provision of cadastral product and at the same time using the proceeds for further provision
of cadastral products. Traditionally the interest on cost recovery has been on the financialaspects only where the performance of an organisation is measured in terms of revenue
generated regardless of whether such revenue are directly appropriated in the organisation or
not. This study provides a qualitative tool to cluster cadastral organisation based on their
ability to meet financial obligation as well as provide further cadastral products. It has beenobserved that cadastral organisations may well meet financial obligation but fail to provide
cadastral products in the long run as financial resources are managed elsewhere. Charging
high level prices for cadastral products may not necessarily lead to operational sustainability
of the cadastral organisation. The government may for example use charges derived fromthe sale of cadastral product for general provision of social services.
In assessing the performance of cadastral organizations, this study proposes a clusteredwithin-category comparison of cadastral organization in terms of the ability to meet financial
cost recovery. Cross comparison of cadastral organization based on the ability to meet
operational or even the total cost of production is inadequate as cadastral organization differ substantially in terms of their pricing policy goals. Therefore charging and revenue

8/8/2019 Portfolio of Pricing Options Draft 1
http://slidepdf.com/reader/full/portfolio-of-pricing-options-draft-1 10/17
10
generation do not give a clear indication of the performance of cadastral organizations across
CRR. However it could be a good performance measure within a particular CRR as thefinancial conditions underlying pricing policy are the same within a CRR. Also it should be
noted that pricing options or a set of pricing options adopted within a CRR displays stepwise
continuum without breaks in the ordinal scale. Therefore mixing divergent prices for
cadastral products is not recommended rather organizations should seek appropriate mixwithin the ordinal spectrum of pricing options to meet its intended goals.
Symmetric Measures
Value Asymp.Std. Error
Approx.Tb
Approx.Sig.
Gamma .601 .096 5.053 .000Ordinal byOrdinal Spearman
Correlation .337 .060 4.457
.000
Interval byInterval
Pearson's R.306 .058 4.002
.000
N of Valid Cases 157
Table2: summary statistics on the relationship between pricing option
and cost recovery regime
An appropriate mix of pricing option when an organization is required to operate under a predefined CRR can directly be inferred in relation to the findings of this study. If an FCR is
imposed upon a cadastral organization, it is likely that such organization will implement only
two pricing option for most of it products. In this study all products under FCR werecharged at either full cost or full cost with profit pricing options. This could mean that an
FCR regime eliminates some flexibility in pricing option for cadastral organization
specifically for the seven product investigated in this study. Cadastral organizations under PCR have a wider range of pricing option from which to choose. That means for specific products, these organization may choose to offer at completely free of charge which can be
compensated with full charges on the other products. It is also possible for these
organizations to charge at a profit. Cadastral organizations under NCR are unlikely tocharge at a profit though this depend on the overall policy of the government. This is
because an organisation under NCR wholly depends on the government for its operation.
If the intention of the government in the provision of cadastral product is to maintain
flexibility in price to accommodate an economically diversified population, PCR isrecommended. This ensures that cadastral organization opts for socially accepted prices
while allowing a minimum government intervention in case the organization adopts pricingstrategies that are incompatible with national strategies in the provision of cadastral products(i.e. access for all).
An FCR can be implemented only under circumstances where awareness on the use of
cadastral products is high and the majority of the people are able to access cadastral productswithout unnecessary delays and additional costs. Also the overall per capital income should
be considered since in a manual cadastral system it may be too expensive to provide
cadastral products at full cost or full cost with profit charges hence curtailing a substantial
8/8/2019 Portfolio of Pricing Options Draft 1
http://slidepdf.com/reader/full/portfolio-of-pricing-options-draft-1 11/17
11
component of the population from access to these products. That means FCR is highly
recommended for automated cadastral systems and in developed countries in order to avoidthe design-actuality gap resulting from incompatibilities between cadastral systems and the
user (Heeks, 2002). With automated cadastral systems, the provision of cadastral products at
MC may be possible and in some cases such MC is closer to zero hence even if all the costs
are paid for by the consumer, it can still be affordable. However when per capita income islow, the necessary awareness necessary for mass consumption of cadastral products to
sustain the overall cost of running the cadastral organization may be difficult to meet. Hence
both income and the nature of the information system need to be considered when FCR issought.
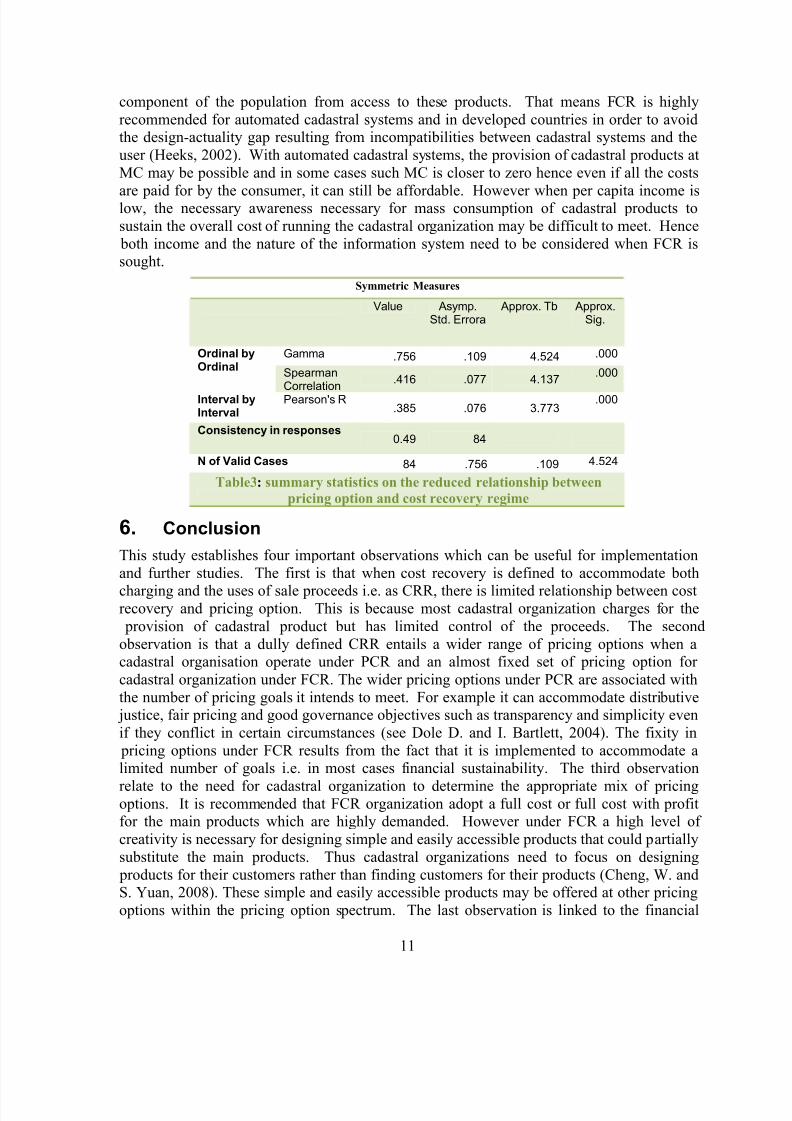
Symmetric Measures
Value Asymp.Std. Errora
Approx. Tb Approx.Sig.
Gamma .756 .109 4.524 .000Ordinal byOrdinal Spearman
Correlation.416 .077 4.137
.000
Interval byInterval
Pearson's R.385 .076 3.773
.000
Consistency in responses0.49 84
N of Valid Cases 84 .756 .109 4.524
Table3: summary statistics on the reduced relationship between
pricing option and cost recovery regime
6. Conclusion
This study establishes four important observations which can be useful for implementation
and further studies. The first is that when cost recovery is defined to accommodate both
charging and the uses of sale proceeds i.e. as CRR, there is limited relationship between costrecovery and pricing option. This is because most cadastral organization charges for the
provision of cadastral product but has limited control of the proceeds. The second
observation is that a dully defined CRR entails a wider range of pricing options when acadastral organisation operate under PCR and an almost fixed set of pricing option for
cadastral organization under FCR. The wider pricing options under PCR are associated with
the number of pricing goals it intends to meet. For example it can accommodate distributive justice, fair pricing and good governance objectives such as transparency and simplicity even
if they conflict in certain circumstances (see Dole D. and I. Bartlett, 2004). The fixity in
pricing options under FCR results from the fact that it is implemented to accommodate alimited number of goals i.e. in most cases financial sustainability. The third observation
relate to the need for cadastral organization to determine the appropriate mix of pricingoptions. It is recommended that FCR organization adopt a full cost or full cost with profitfor the main products which are highly demanded. However under FCR a high level of
creativity is necessary for designing simple and easily accessible products that could partially
substitute the main products. Thus cadastral organizations need to focus on designing
products for their customers rather than finding customers for their products (Cheng, W. andS. Yuan, 2008). These simple and easily accessible products may be offered at other pricing
options within the pricing option spectrum. The last observation is linked to the financial

8/8/2019 Portfolio of Pricing Options Draft 1
http://slidepdf.com/reader/full/portfolio-of-pricing-options-draft-1 12/17
12
performance of cadastral organization whereby this study suggests the use of CRR as defined
in this study to cluster cadastral organizations before any financial comparison is sought.
Acknowledgements
Special thanks to Prof. Van der Molen of the faculty of Geoinformation Science and Earth
Observation of the University of Twente, The Netherlands for the reference materials and detailedcontact lists he provided us, which were useful in reaching out specific individuals within the targeted
cadastral organisations. We also extend our sincere gratitude to all cadastral organisations that
participated in this study by providing us with specialised professionals whose responses were highly
valuable. Finally we extend our appreciation to the respondents themselves for their clear, detailed
and self-explanatory survey responses as well as for being tolerant to our often-disturbing remainder
emails.
ReferencesAlchian A.A. and H. Demsetz (1972). Production, Information Costs, and Economic Organization,
The American Economic Review, 62( 5), 777-795.Barnes G. (2000). Land Registration Modernization in Developing Economies: A Discussion of the
Main Problems in Central/Eastern Europe, Latin America, and the Caribbean. URISA
Journal,12(4), 33-42.
Bolt, W. and A. F. Tieman (2005). "Social Welfare and Cost Recovery in Two-Sided Markets."
SSRN eLibrary.
Chang, Wei-Lun and Soe-Tsyr Yuan, (2008). Collaborative pricing model for bundling information
goods. Journal of Information Science 34(2008), 635 - 650.
Cheng, H., K. Dogan, et al. (2006). "Pricing and Capacity Decisions for Non-Profit Internet Service
Providers." Information Technology and Management 7(2): 91-107.
Clark M. (2007). Fee or free? The hidden costs of free public sector information. Business
Information Review, 24(1): 49–59.
Commonwealth of Australian (2005). Australian Government Cost Recovery Guidelines. Financeand Administration. Canberra, Australia Government,: 77.
Craglia, M. and I. Masser (2003). "Access to Geographic Information: A European Perspective."
URISA Journal, 15(2003): 51-59.
Dale, P. F. (2003). Sustainable Land Administration: Taking a Business Approach. UConsortium of
Blom ASA,U. Ljubljana, Kadaster, Registers of Scotland,: 8.
Demir H. and A. Yavuz, (2009). Cadastral services in Turkey within the framework of new public
management. African Journal of Business Management, 3 (10), 582-590.
De Vries, W. T. and S. Beerens (2002). Economics and Capacity Implications of geo-ICT.
GIS@Development.
Dole D. and I. Bartlett, (2004). Beyond Cost Recovery:Setting User Charges for Financial,
Economic, and Social Goals. Pgs 46.
Eaton J.J. and D. Bawden ( 1991). What Kind of Resource is Information? The International Journalof information Management, 17(1991), 156-l 65.
Feeny D. et al. (1990). The Tragedy of the Commons: Twenty-Two Years Later. Human Ecology,
18(1 ), 1-19.
Gompel, R. V. and J. Steyaert (2002). Going Beyond Access: Accessibility of Government
Information in the Electronic Media Age. Intercultural Communication 23 Conference and
General Assembly IAMCR. Barcelona, Catholic University of Leuven: 30.

8/8/2019 Portfolio of Pricing Options Draft 1
http://slidepdf.com/reader/full/portfolio-of-pricing-options-draft-1 13/17
13
Griem, J. A., and Griem, R. R. (2003). Calculating, Interpreting, and Reporting Cronbach’s Alpha
Reliability Coefficient for Likert-Type Scales. Midwest Research to Practice Conference in
Continuing and community education, 2003, p. 7. Midwest.
Heeks, R. ( 2002). Information Systems and Developing Countries:Failure, Success, and Local
Improvisations. The Information Society , 18, 101–112,.
Holland, W. S., Esq. (1995). "Copyright, Licensing and Cost Recovery for Geographic and Land
Information Systems Data: A Legal, Economic and Policy Analysis." Retrieved 15/10/2009,2009, from http://www.spatial.maine.edu/~onsrud/tempe/holland.html.
KPMG Consulting and G. Sears (2001). Canadian Geospatial Data Policy Study (executivesummary): Report Prepared for GeoConnections,. Policy Advisory Node of GeoConnections.
Ottawa, KPMG Consulting: 32.
McDonald D.A. and J. Pape (eds) (2002). Cost Recovery and the Crisis of Service Delivery in South
Africa, Human Sciences Research Council Publishers, Pgs 208.
Morris S. and Hyun Song Shin (2002). Social Value of Public Information. The AmericanEconomic Review 92(5), 1521 - 1537.
Longhorn, R. A. and M. Blakemore (2008). Geographic Information : Value, Pricing, Production,
and Consumption. Boca Raton, CRC.
Poe, G. L., R. C. Bishop, et al. (1992). Benefit - Cost Principles for Land Information Systems.
URISA Journal, 4(2): 20-31.Pollock, R. (2008). The Economics of Public Sector Information. Cambridge, University of
Cambridge: 50.
Productivity Commission (2001). Cost Recovery by Government Agencies. Report No. 15. Ausinfo.
Canberra: 640.
Rossi, D. and A. James (1975). Cost Recovery in Pricing and Capacity Decision for Automated
Information Systems Washington DC, U.S. Dept. of Commerce, National Bureau of
Standards 61.
Van der Molen, P. (2001). "Cost Recovery for Land Administration." Survey Review, 36(282): 241-
248.
Walsh, S. and R. Woods (2001). Pricing Electronic Goods in the Public Sector. Government
Information Systems Forum. Wellington, New Zealand, Land Information New Zealand.
Wagner R. P., (2003). Information Wants to Be Free: Intellectual Property and the Mythologies of Control. Columbia Law Review, 103(4), 995-1034.

8/8/2019 Portfolio of Pricing Options Draft 1
http://slidepdf.com/reader/full/portfolio-of-pricing-options-draft-1 14/17
14
Appendix A.
Characteristics of cadastral productsProducts
Codes
Cadastral
ProductsCharacteristics
Charging and cost recovery
PotentialitiesA Certificate of
Title
RPR
• Similar terminologies such asportfolio of ownership, certificate of
title, certificate of occupancy.
• In some cases it is quoted at a
general level no details provided.
• It can be offered in both digital and
paper format dully signed
• Details if provided tend to differ
across jurisdictions.
• Can be used as evidence in court
• Can be provided by both self-financing andbudget based cadastral organisations most
likely under ‘full cost recovery’
• Can be charged and prices are fixed or
approved by the government
• Revenues likely to go to the state
• Is likely to be offered at ‘completely free of
charge’ to the public sector with many
limitations
B CadastralMaps
RPS
• Common product in many
jurisdiction
• Terminologies differ among
countries i.e. Index map, Map
printouts.
• Levels of detail differ.
• The organisation itself is likely set
• Revenues mostly remains with the provider
• Fairly difficult to achieve ‘full cost recovery’
• Possible to be provided in the competitive
market
• Charges may be flexible and reflect market
condition
C Generalinformation onReal Property
RPI
• Provided with detailed contents
• no authentication or guarantee
• It cannot be used as evidence in
court.
• Terminologies tend to differ across
cadastral jurisdiction
• Can be charged and the government is likely
to fix or set prices.
• Revenue mostly remains with the
organisation
• Most likely to be provided free to both the
public and the private sector
D Extract fromcadastre
RPS
• Common product in many
jurisdiction
• It can be Authenticated
• Other terminologies include, views
of registers and Cadastral
information
• The organisation itself is likely to set
Charges
• Revenues remains with the provider
• Fairly difficult to achieve full cost recovery
• Possible to be provided in the competitive
market
E Statistical dataon land marketRPI
• Prepared in different format
• Content tend to differ
• The government set or approve prices
• Revenue remains with the organisation
• Most likely to be provided free to both the
public and the private sector
F Extracts frommortgages andencumbrancesRPR
• Detailed information content-wise.
• Other terminologies include ‘extracts
from mortgages and
encumbrances’, ‘mortgage
certificate’,
• Can be Authenticated.
• The government set or approve prices
• Revenue goes to the organisation
• Full cost recovery more likely
• Products are likely to be freely provided to
the public sector with may limitations
G GeneralMortgageinformation
RPR
• Generally accessible Information on
mortgages
• No authentication
• May be certified.
• The government set or approve prices
• Revenue goes to the organisation
• Full cost recovery more likely
• Products are likely to be freely provided to
the public sector with many limitations.
NB: * Charging and cost recovery potentialities are based on a survey conducted by UNECE (UN, 2007).RPR = Real Property Registers, RPI = Real Property Information, RPS = Real Property Survey

8/8/2019 Portfolio of Pricing Options Draft 1
http://slidepdf.com/reader/full/portfolio-of-pricing-options-draft-1 15/17
15
Appendix B:
Summary of Responses on pricing options and cost recovery regimes
Pricing options for Cadastral ProductsS/No Name of Organisation
A B C D E F G
CRR
1 Institute of Geodesy, Cartography and
Remote Sensing (FÖMI)
3 3 3 3 3 3 - 1
2 Kosovo Cadastral Agency 3 3 2 3 3 3 - 13 Macao Cartography and Cadastre
Bureau- - 4 4 4 - - 3
4 The Land Registry5 Land Administration Project 2 2 2 2 2 2 - 16 Geodesy, Cartography and Cadastre
Agency2 2 - - - 2 - 1
7 Federal Office of Metrology andSurveying - BEV
2 2 2 - - 2 - 1
8 Statens kartverk-Norwegian MappingAuthority
4 4 4 4 4 4 4 2
9 Property Registration Authority 3 3 - - - - - 110 National Land Survey of Finland - 3 4 - 3 3 4 2
11 Survey and Mapping Office, LandsDepartment, HKSARG
- 3 - - - - - 2
12 Norsk Eiendomsinformasjon as 4 4 4 4 4 4 - 313 Korea Cadastral Survey
Corporation(KCSC)- 3 - - - - - 3
14 National Agency for Cadastre and LandRegistration
3 3 3 3 3 3 - 3
15 General Administration of PatrimonialDocumentation
2 2 - - 2 2 - 1
16 Service New Brunswick 3 1 3 3 - 3 3 217 State Enterprise Centre of Registers 4 4 4 4 3 4 4 318 Surveying and mapping authority of the
Republic of Slovenia- 4 - - - 4 1
19 Lantmäteriet 3 3 3 3 3 3 - 1
20 Department of Lands & Survey 3 3 1 3 3 3 1 121 General Directorate and Land Registry
and Cadastre of Turkey2 2 2 2 2 2 1 2
22 Estonian Land Board - 1 - - - 2 1 223 Cadastral Survey Branch 2 2 - - - 2 - 124 Survey of Israel - 3 - - - 3 - 125 Government of Alberta - Sustainable
Resource Development2 3 - 2 2 3 - 2
26 The National Land Agency of Republic of Indonesia
2 3 3 3 3 3 1 2
27 Land and Property Services (LPS)Northern Ireland
3 3 - - 3 3 - 2
28 Geodesy, Cartography and CadastreAuthority SR
3 3 3 - - 3 - 1
29 Czech Office for Surveying, Mapping andCadastre
3 3 3 3 3 3 - 1
30 Land Registry 3 3 4 - - 4 4 3
31 Land Information New Zealand (LINZ) 3 3 - - 3 3 - 2
32 Department of Primary Industries, Parks,Water and Environment
4 3 4 - - 4 - 2
33 PSMA Australia Limited - - - - - 4 - 2
34 Ministry of Lands Housing and \humanSettlement Development
3 - 3 3 3 - - 1
35 Kadaster 3 3 3 3 3 3 3 3

8/8/2019 Portfolio of Pricing Options Draft 1
http://slidepdf.com/reader/full/portfolio-of-pricing-options-draft-1 16/17
16
Appendix C
SPSS Analysis All Results: Symmetric Measures All Products
CadastralProducts
Value Asymp.Std. Error
Approx.Tb
Approx.Sig.
Gamma Zero-Order .494 .276 1.602 .109Ordinal byOrdinal Spearman Correlation .272 .161 1.353 .189
Interval by Interval Pearson's R .271 .290 .145 1.451
Certificate of Title
N of Valid Cases 25 25Gamma Zero-Order .641 .225 2.317 .021Ordinal by
Ordinal Spearman Correlation .350 .133 2.012 .054
CadastralMap
Interval by Interval Pearson's R .293 .293 .134 1.651
N of Valid Cases 31 31
Gamma Zero-Order .286 .369 .743 .458Ordinal byOrdinal Spearman Correlation .147 .191 .557 .586
Interval by Interval Pearson's R .157 .157 .171 .596
GeneralMortgageInformation
N of Valid Cases 16 16
Gamma Zero-Order .741 .191 2.502 .012Ordinal byOrdinal Spearman Correlation .389 .134 2.237 .033
Interval by Interval Pearson's R .388 .388 .125 2.229
Extracts fromCadastres
N of Valid Cases 30 30
Gamma Zero-Order .545 .298 1.475 .140Ordinal byOrdinal Spearman Correlation .276 .168 1.217 .239
Interval by Interval Pearson's R .280 .280 .161 1.236
Extracts fromMortages andEncumbrances
N of Valid Cases 20 20
Gamma Zero-Order .895 .114 3.131 .002Ordinal byOrdinal Spearman Correlation .535 .131 2.901 .009
Interval by Interval Pearson's R .451 .508 .113 2.701
General RealPropertyInformation
N of Valid Cases 23 23
StatisticalData on theLand Market
Gamma .556 .286 1.806 .071 .071Ordinal byOrdinal
Spearman Correlation .409 .213 1.416 .187
Interval byInterval
Pearson's R .383 .200 1.309 .220
N of ValidCases
12
Total .601 .096 5.053 .000 .000Gamma
.644
Ordinal byOrdinal
Spearman Correlation .337 .060 4.457 .000
Interval byInterval
Pearson's R .306 .058 4.002 .000
N of ValidCases
157

8/8/2019 Portfolio of Pricing Options Draft 1
http://slidepdf.com/reader/full/portfolio-of-pricing-options-draft-1 17/17
17
Appendix D
SPSS Analysis Reduced Products Results: Symmetric Measures All Products
CadastralProducts
Value Asymp. Std.Errora
Approx.Tb
Approx.Sig.
Gamma Zero-Order .641 .225 2.317 .021Ordinal by
Ordinal Spearman Correlation .350 .133 2.012 .054Interval byInterval
Pearson's R .293 .134 1.651 .110
Cadastral
Map
N of Valid Cases 31Gamma Zero-Order .741 .191 2.502 .012Ordinal by
Ordinal Spearman Correlation .389 .134 2.237 .033Interval byInterval
Pearson's R .388 .125 2.229 .034
ExtractsfromCadastres
N of Valid Cases 30Gamma Zero-Order .895 .114 3.131 .002Ordinal by
Ordinal Spearman Correlation .535 .131 2.901 .009Interval byInterval
Pearson's R .508 .113 2.701 .013
GeneralRealPropertyInformation N of Valid Cases 23
Zero-Order .756 .109 4.524 .000Gamma First-Order Partial
.741Ordinal byOrdinal
Spearman Correlation .416 .077 4.137 .000
Interval byInterval
Pearson's R .385 .076 3.773 .000
Total
N of Valid Cases 84


![[Nielsen] Pricing Asian Options](https://img.pdfslide.net/doc/110x75/55253fa54a7959c2488b4b35/nielsen-pricing-asian-options.jpg)