Embed Size (px)
Citation preview
June 2014
Monetary Affairs Department
Masashi Saito
Yoshihiko Hogen
Portfolio Rebalancing Following the Bank of Japan's Government Bond Purchases: Empirical Analysis Using Data on Bank Loans and Investment Flows
Please contact below in advance to request permission when reproducing or copying the content of this paper for
commercial purposes.
Monetary Affairs Department, Bank of Japan
P.O. Box 30, Nihonbashi, Tokyo 103-8660, Japan
Please credit the source when reproducing or copying the content of this paper.
1
Portfolio Rebalancing Following the Bank of Japan's Government Bond Purchases:
Empirical Analysis Using Data on Bank Loans and Investment Flows
Masashi Saito† and Yoshihiko Hogen‡
June 2014
Abstract
This paper organizes facts and conducts an empirical analysis related to the
portfolio rebalancing effect of government bond purchases by the Bank of Japan
(BOJ). Our analysis uses data on bank loans and investment flows that are
classified by type of entity, primarily taken from the Flow of Funds Accounts
Statistics. Following the introduction of Quantitative and Qualitative Monetary
Easing (QQE) by the BOJ in April 2013, entities other than the BOJ, as a group,
have increased loans and investment in equities, mutual funds, and corporate bonds
in Japan, while reducing their holdings of Japanese government bonds. Such
portfolio rebalancing is mainly led by domestic banks and nonresidents.
Meanwhile, so far, insurance companies, corporate pension funds, and public
pensions have not reduced government bond holdings when the BOJ purchased
government bonds. In addition to changes in financial and economic conditions,
such as the balance sheet conditions of domestic banks and loan demand faced by
domestic banks, purchases of government bonds with a longer remaining maturity
by the BOJ have played a role in the increase in bank loans observed during the
QQE period.
Keywords: portfolio rebalancing, government bond purchases, Quantitative and Qualitative Monetary Easing (QQE), Flow of Funds Accounts Statistics
JEL Classifications: E52, E58, G11, G2, H63
Shusaku Nishiguchi and Rie Yamaoka helped in preparing some of the data used in this paper. Staff members at the Bank of Japan provided useful comments. The views expressed in this paper are those of the authors and do not necessarily reflect those of the Bank of Japan.
† Monetary Affairs Department, Bank of Japan E-mail: [email protected]
‡ Monetary Affairs Department, Bank of Japan E-mail: [email protected]
2
1 Introduction
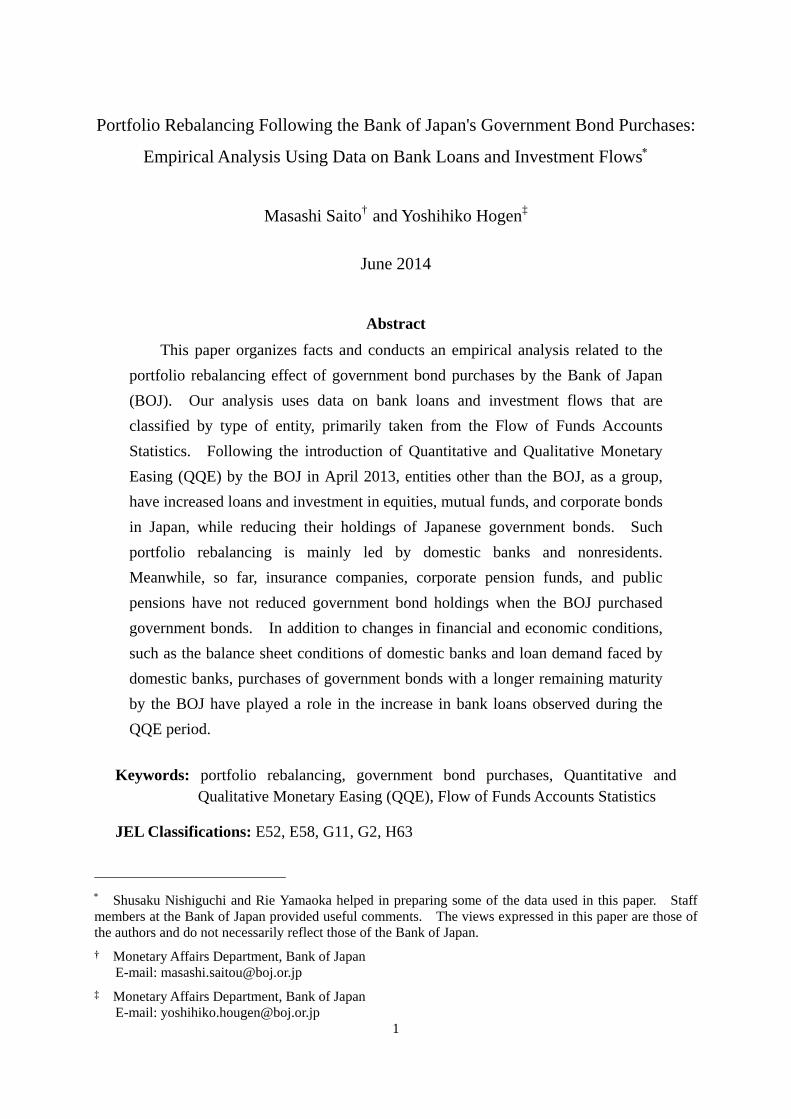
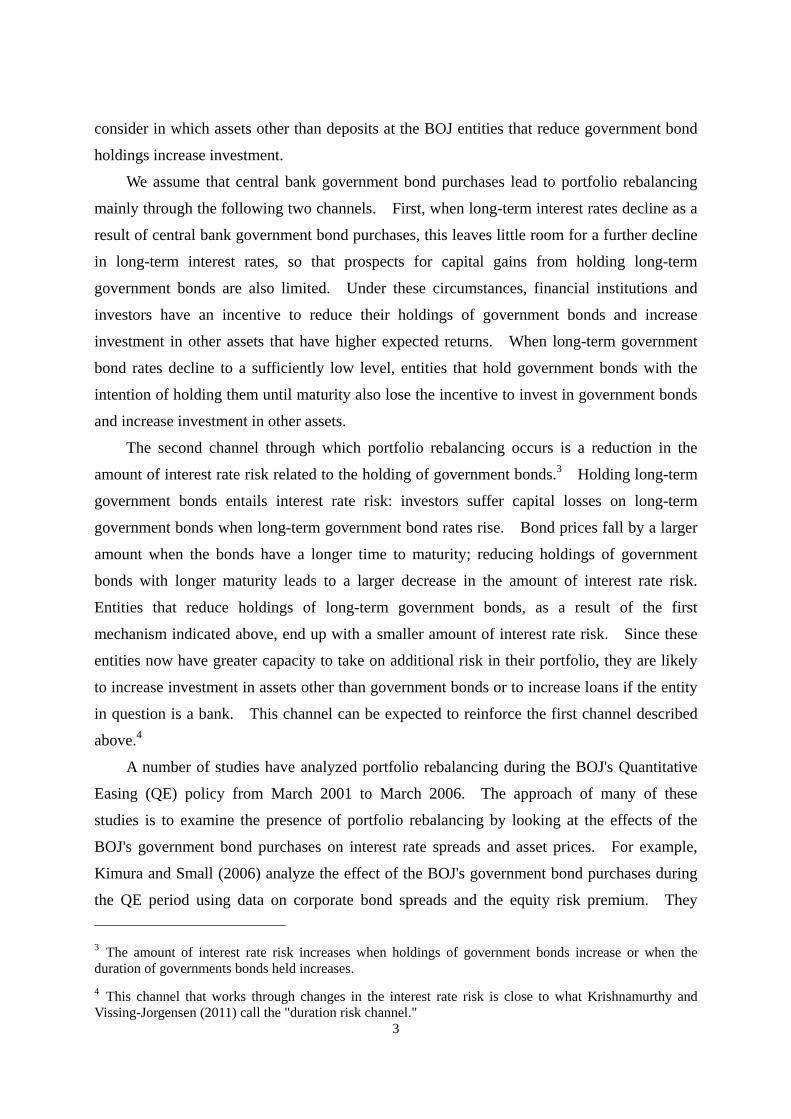
After the Bank of Japan (BOJ) introduced Quantitative and Qualitative Monetary Easing
(QQE) in April 2013, government bond purchases by the BOJ increased by a large amount
(Chart 1). Moreover, the average remaining maturity of government bonds purchased by the
BOJ became approximately twice as long as that prior to the introduction of QQE (Chart 2).1
One of the transmission mechanisms of government bond purchases by the central bank
is portfolio rebalancing.2 This paper lays out the characteristics of portfolio rebalancing in
Japan and assesses its workings especially after the introduction of QQE. Various
definitions and evaluation methods exist for portfolio rebalancing. This paper uses data on
bank loans and securities investment flows to examine whether entities other than the BOJ
reduce government bond holdings when the BOJ purchases government bonds. We also
1 In this paper, unless otherwise stated, we refer to treasury discount bills as short-term government bonds and to bonds issued domestically by the Japanese government excluding treasury discount bills as long-term government bonds or Japanese government bonds (JGBs). The latter mainly consist of revenue bonds and Fiscal Investment and Loan Program bonds issued by the Fiscal Loan Funds Special Accounts.
2 In this paper, we are using the term portfolio rebalancing in a narrow sense. Some studies use the term to represent both a decline in long-term interest rates and investors' rebalancing across assets. See, for example, Gagnon et al. (2011) and Joyce et al. (2011).
Chart 1: Bank of Japan's Purchases of Chart 2: Average Remaining Maturity of Long-Term Government Bonds Government Bonds Purchased by the Bank
of Japan
Note:
Source:
Short-term bonds consist of treasury bills (TBs) and financing bills (FBs) before January 2009, and treasury discount bills after February 2009.
Bank of Japan, "Monetary Base and the Bank of Japan's Transactions."
Note:
Source:
The most recent figure available is that for 14/Q1. Calculated using information from Bank of Japan, "Japanese Government Bonds held by the Bank of Japan."
0
5
10
15
20
25
30
35
40
45
50
00 01 02 03 04 05 06 07 08 09 10 11 12 13 14
Of which short-term government bondsOf which long-term government bonds
CY
QE CE QQE
Total purchases
Amount of quarterly purchases, tril. yen
0
1
2
3
4
5
6
7
8
04 05 06 07 08 09 10 11 12 13 14
Quarterly average, years
CY
3
consider in which assets other than deposits at the BOJ entities that reduce government bond
holdings increase investment.
We assume that central bank government bond purchases lead to portfolio rebalancing
mainly through the following two channels. First, when long-term interest rates decline as a
result of central bank government bond purchases, this leaves little room for a further decline
in long-term interest rates, so that prospects for capital gains from holding long-term
government bonds are also limited. Under these circumstances, financial institutions and
investors have an incentive to reduce their holdings of government bonds and increase
investment in other assets that have higher expected returns. When long-term government
bond rates decline to a sufficiently low level, entities that hold government bonds with the
intention of holding them until maturity also lose the incentive to invest in government bonds
and increase investment in other assets.
The second channel through which portfolio rebalancing occurs is a reduction in the
amount of interest rate risk related to the holding of government bonds.3 Holding long-term
government bonds entails interest rate risk: investors suffer capital losses on long-term
government bonds when long-term government bond rates rise. Bond prices fall by a larger
amount when the bonds have a longer time to maturity; reducing holdings of government
bonds with longer maturity leads to a larger decrease in the amount of interest rate risk.
Entities that reduce holdings of long-term government bonds, as a result of the first
mechanism indicated above, end up with a smaller amount of interest rate risk. Since these
entities now have greater capacity to take on additional risk in their portfolio, they are likely
to increase investment in assets other than government bonds or to increase loans if the entity
in question is a bank. This channel can be expected to reinforce the first channel described
above.4
A number of studies have analyzed portfolio rebalancing during the BOJ's Quantitative
Easing (QE) policy from March 2001 to March 2006. The approach of many of these
studies is to examine the presence of portfolio rebalancing by looking at the effects of the
BOJ's government bond purchases on interest rate spreads and asset prices. For example,
Kimura and Small (2006) analyze the effect of the BOJ's government bond purchases during
the QE period using data on corporate bond spreads and the equity risk premium. They
3 The amount of interest rate risk increases when holdings of government bonds increase or when the duration of governments bonds held increases.
4 This channel that works through changes in the interest rate risk is close to what Krishnamurthy and Vissing-Jorgensen (2011) call the "duration risk channel."
4
present empirical results that suggest that the BOJ's QE had some effect on high-grade
corporate bonds, but had little impact on low-grade corporate bonds and equities, implying
that portfolio rebalancing was limited to a narrow range of assets during the QE period. A
considerable number of other empirical studies on the BOJ's QE policy have also used
information on asset prices.5
To more directly check the existence of portfolio rebalancing -- for instance, to see which
entities reduce government bond holdings and in which assets these entities increase their
investment -- it is useful to employ information on investment flows and bank lending rather
than information on asset prices. Carpenter et al. (2013), for instance, use the Flow of Funds
Accounts Statistics for the United States to empirically examine portfolio rebalancing
following asset purchases by the Federal Reserve. They report that, following the Fed's
purchases of government bonds and mortgage backed securities (MBSs), it was mainly hedge
funds that reduced their holdings of government bonds and MBSs and increased investment in
corporate bonds. Another example is the study by Fratzscher et al. (2013), who use
investment flows data for funds domiciled in advanced and emerging economies to analyze
portfolio rebalancing arising from the Fed's asset purchases. Their findings suggest that
portfolio rebalancing took place not only within the United States (i.e., rebalancing from
bonds to equities within the United States), but also across countries (for example,
rebalancing from U.S. bonds to bonds in other advanced countries). They also argue that the
nature of portfolio rebalancing differed between the first and the second phase of the Fed's
large-scale asset purchase (LSAP) program.
Following these previous studies, we also use data on investment flows and bank lending,
primarily the Flow of Funds Accounts Statistics, to analyze portfolio rebalancing following
the BOJ's government bond purchases. Specifically, we examine the characteristics of
portfolio rebalancing following the BOJ's government bond purchases focusing on the
following three differences: (i) differences among entities, (ii) differences in portfolio
rebalancing depending on whether the BOJ purchased short-term or long-term government
bonds, and (iii) differences in portfolio rebalancing between the period of Quantitative Easing
(QE) from March 2001 to March 2006 on the one hand and the period of Comprehensive
Monetary Easing (CE) from October 2010 to March 2013 and QQE since April 2013 on the
5 For a survey of empirical studies on the BOJ's QE policy using asset prices, see Ugai (2007). Many of the empirical studies on the effect of asset purchases by the Federal Reserve and the Bank of England also use information on asset prices. See Gagnon et al. (2011) and Joyce et al. (2011) for examples of empirical studies using asset prices.
5
other. As for entities that we focus on, these consist of domestic financial institutions and
nonresidents; the latter include foreign financial institutions and foreign governments. We
also examine portfolio rebalancing at the macro level by aggregating investment flows over
different entities.
The main findings of this paper can be summarized as follows. First, looking at
portfolio rebalancing at the macro level after the introduction of QQE, we find that --
following the increase in the BOJ's purchases of government bonds with long durations --
entities other than the BOJ, as a group, decreased their government bond holdings and
increased loans and investment in equities, mutual funds, and corporate bonds in Japan.
Looking at each type of entity separately, however, we find that the nature of portfolio
rebalancing differs across entities, reflecting factors such as entities' liability structure and
investment strategy. The nature of portfolio rebalancing also differs depending on the
duration of government bonds purchased by the BOJ, i.e., whether it purchased short-term or
long-term government bonds. Specifically, domestic banks and the overseas sector tended to
reduce government bond holdings and increase investment in relatively risky assets such as
loans, equities, and corporate bonds in Japan when the BOJ purchased government bonds.
Among these entities, domestic banks tended to reduce government bond holdings and
increase loans when the BOJ purchased long-term government bonds -- especially bonds with
a relatively long remaining maturity --, while they did not tend to increase loans when the
BOJ purchased mainly short-term government bonds. Underlying this difference appears to
be the fact that the amount of interest rate risk related to government bond holdings decreases
by a large amount when domestic banks reduce their holdings of government bonds with long
duration, while the reduction in the amount of interest rate risk is relatively small when
domestic banks reduce their holdings of short-term government bonds. The overseas sector
also tended to reduce government bond holdings when the return on government bonds fell
following the BOJ's purchases of government bonds; it also increased investment in Japanese
equities and corporate bonds in response to the BOJ's government bond purchases, especially
in the more recent period, i.e., the period of CE and QQE.
In contrast to these types of entities, insurance companies and corporate pension funds
did not show a tendency to reduce government bond holdings when the BOJ purchased
government bonds. Since these entities have liabilities with a long duration -- that is, their
liability structure is characterized by predetermined payment flows that last for a long time
into the future --, they have a strong incentive to hold government bonds with a long
remaining maturity as assets to match the duration of liabilities.
6
The rest of this paper is structured as follows. In Section 2, we provide an overview of
government bond holdings by various entities, with an eye on the relationship between their
government bond holdings and the BOJ's purchase of government bonds. We also explore
formally, using regression analysis, which entities tend to reduce government bond holdings
when the BOJ increases government bond purchases. Next, in Section 3, we first examine
developments in portfolio rebalancing at the macro level by aggregating the behavior of
different entities. In Section 4, we then look in more detail, for each type of entity that
tended to reduce government bond holdings in response to the BOJ's purchases, in which
assets they increased investment. Finally, in Section 5, we summarize the main findings of
this paper, discuss several caveats regarding our analysis, and point out remaining issues to be
addressed in future research.
2 Changes in Government Bond Holdings Following BOJ Government Bond
Purchases
In this section, we first provide an overview of government bond holdings by each type of
entity. We then conduct a regression analysis to examine which entities tended to reduce
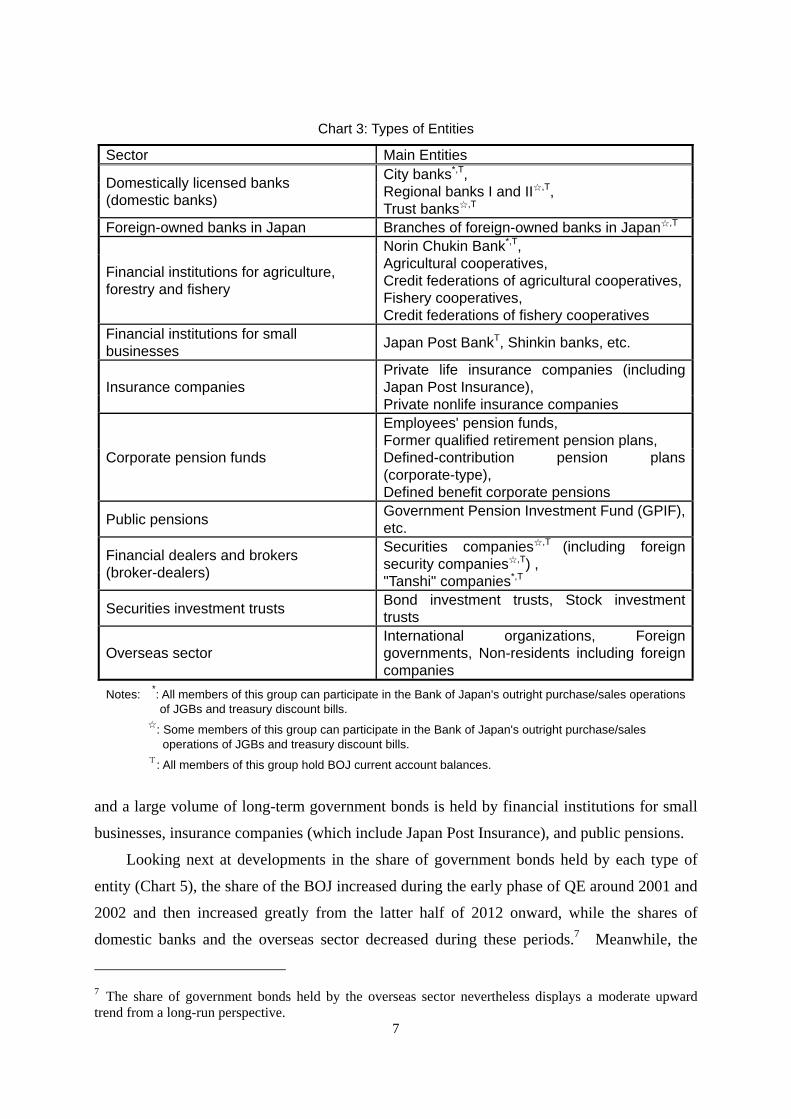
government bond holdings when the BOJ purchased government bonds. In this paper, we
mostly focus on the ten types of entities listed in Chart 3; because this paper is concerned with
portfolio shifts from government bonds to other assets, we do not focus on households and
private nonfinancial corporations that hold a relatively small amount of government bonds.6
2.1 Overview of Government Bond Holdings by Type of Entity
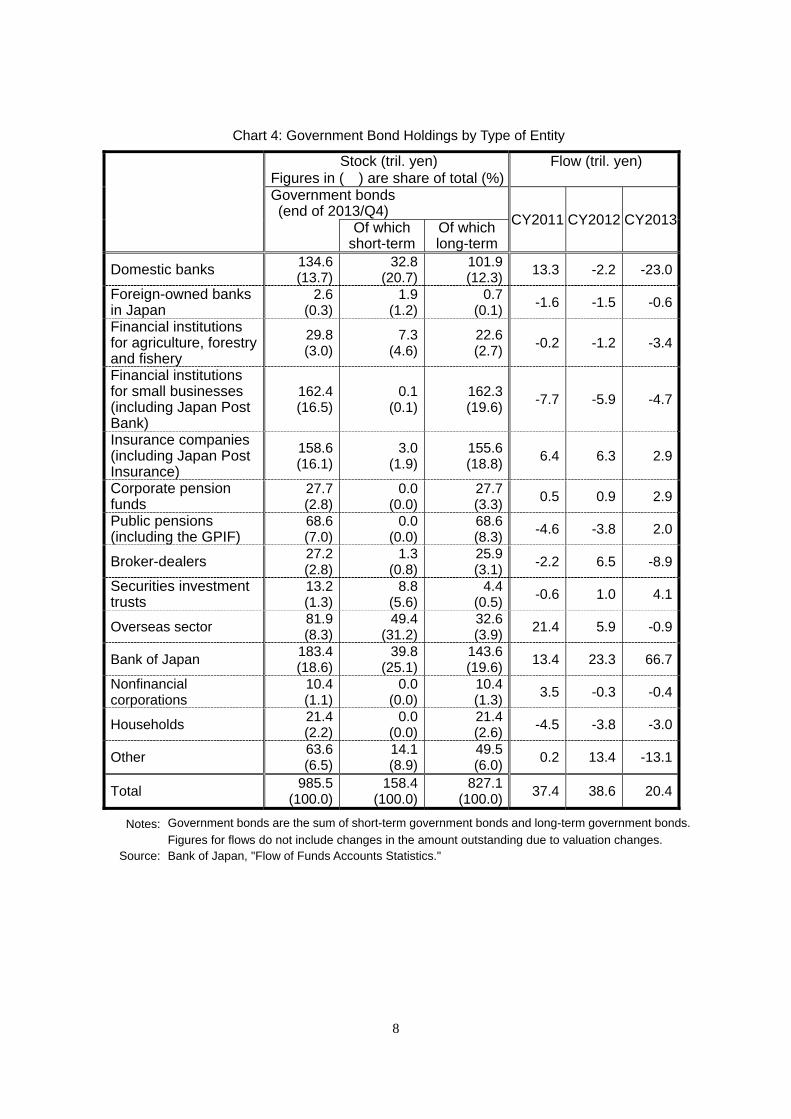
Looking at the government bond holdings of each type of entity at the end of 2013 using the
Flow of Funds Accounts Statistics (Chart 4), we find that the largest holders of government
bonds are the BOJ, financial institutions for small businesses (which include Japan Post Bank),
insurance companies, domestically licensed bank (referred to simply as "domestic banks"
hereafter), the overseas sector, and public pensions (which include the Government Pension
Investment Fund, GPIF), in that order. If we look at short-term and long-term government
bond holdings separately, the BOJ and domestic banks are the largest holders of both. We
also find that a large volume of short-term government bonds is held by the overseas sector,
6 This does not mean that we consider other kinds of portfolio shifts, such as a shift from bank deposits to equities and mutual funds, as unimportant for economic activity.
7
and a large volume of long-term government bonds is held by financial institutions for small
businesses, insurance companies (which include Japan Post Insurance), and public pensions.
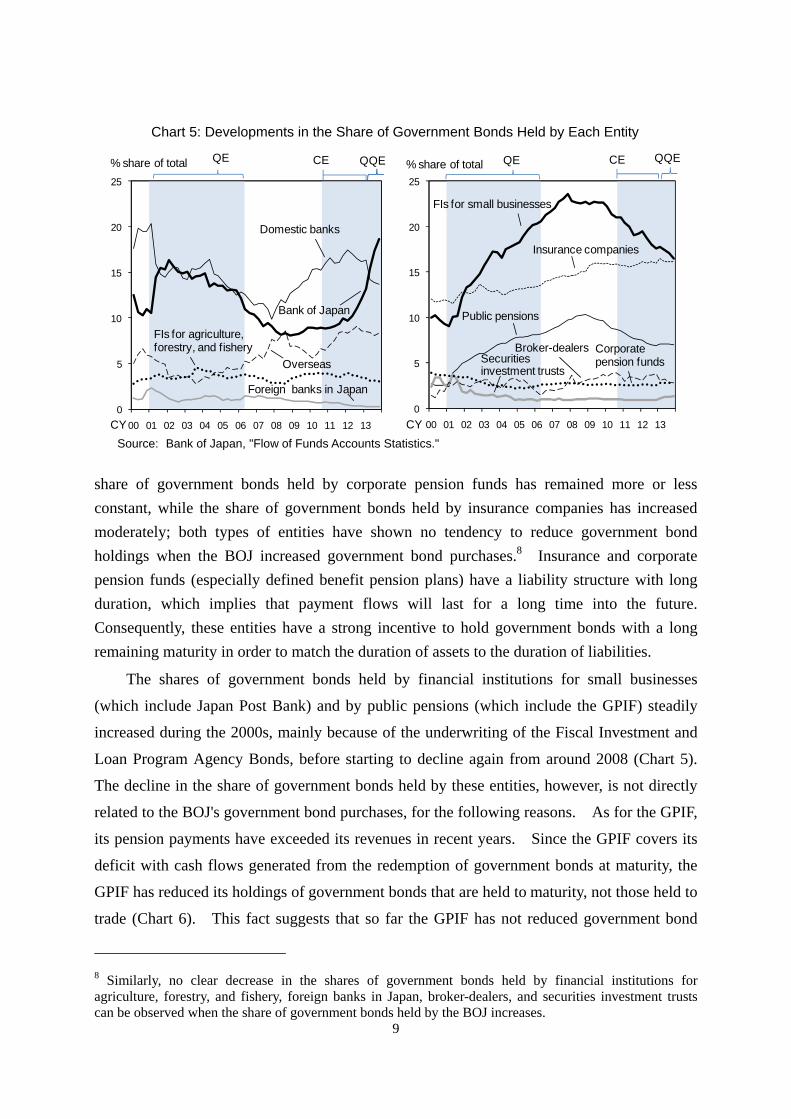
Looking next at developments in the share of government bonds held by each type of
entity (Chart 5), the share of the BOJ increased during the early phase of QE around 2001 and
2002 and then increased greatly from the latter half of 2012 onward, while the shares of
domestic banks and the overseas sector decreased during these periods.7 Meanwhile, the
7 The share of government bonds held by the overseas sector nevertheless displays a moderate upward trend from a long-run perspective.
Chart 3: Types of Entities
Sector Main Entities
Domestically licensed banks (domestic banks)
City banks*,T, Regional banks I and II☆,T, Trust banks☆,T
Foreign-owned banks in Japan Branches of foreign-owned banks in Japan☆,T
Financial institutions for agriculture, forestry and fishery
Norin Chukin Bank*,T, Agricultural cooperatives, Credit federations of agricultural cooperatives,Fishery cooperatives, Credit federations of fishery cooperatives
Financial institutions for small businesses
Japan Post BankT, Shinkin banks, etc.
Insurance companies Private life insurance companies (including Japan Post Insurance), Private nonlife insurance companies
Corporate pension funds
Employees' pension funds, Former qualified retirement pension plans, Defined-contribution pension plans (corporate-type), Defined benefit corporate pensions
Public pensions Government Pension Investment Fund (GPIF), etc.
Financial dealers and brokers (broker-dealers)
Securities companies☆,T (including foreign security companies☆,T) , "Tanshi" companies*,T
Securities investment trusts Bond investment trusts, Stock investment trusts
Overseas sector International organizations, Foreign governments, Non-residents including foreign companies
Notes: *: All members of this group can participate in the Bank of Japan's outright purchase/sales operations of JGBs and treasury discount bills.
☆: Some members of this group can participate in the Bank of Japan's outright purchase/sales operations of JGBs and treasury discount bills.
T: All members of this group hold BOJ current account balances.
8
Chart 4: Government Bond Holdings by Type of Entity
Stock (tril. yen) Figures in ( ) are share of total (%)
Flow (tril. yen)
Government bonds (end of 2013/Q4)
CY2011 CY2012 CY2013
Of which
short-termOf whichlong-term
Domestic banks 134.6 (13.7)
32.8(20.7)
101.9 (12.3)
13.3 -2.2 -23.0
Foreign-owned banks in Japan
2.6 (0.3)
1.9 (1.2)
0.7 (0.1)
-1.6 -1.5 -0.6
Financial institutions for agriculture, forestry and fishery
29.8 (3.0)
7.3 (4.6)
22.6 (2.7)
-0.2 -1.2 -3.4
Financial institutions for small businesses (including Japan Post Bank)
162.4 (16.5)
0.1 (0.1)
162.3 (19.6)
-7.7 -5.9 -4.7
Insurance companies (including Japan Post Insurance)
158.6 (16.1)
3.0 (1.9)
155.6 (18.8)
6.4 6.3 2.9
Corporate pension funds
27.7 (2.8)
0.0 (0.0)
27.7 (3.3)
0.5 0.9 2.9
Public pensions (including the GPIF)
68.6 (7.0)
0.0 (0.0)
68.6 (8.3)
-4.6 -3.8 2.0
Broker-dealers 27.2 (2.8)
1.3 (0.8)
25.9 (3.1)
-2.2 6.5 -8.9
Securities investment trusts
13.2 (1.3)
8.8 (5.6)
4.4 (0.5)
-0.6 1.0 4.1
Overseas sector 81.9 (8.3)
49.4 (31.2)
32.6 (3.9)
21.4 5.9 -0.9
Bank of Japan 183.4 (18.6)
39.8 (25.1)
143.6 (19.6)
13.4 23.3 66.7
Nonfinancial corporations
10.4 (1.1)
0.0 (0.0)
10.4 (1.3)
3.5 -0.3 -0.4
Households 21.4 (2.2)
0.0 (0.0)
21.4 (2.6)
-4.5 -3.8 -3.0
Other 63.6 (6.5)
14.1 (8.9)
49.5 (6.0)
0.2 13.4 -13.1
Total 985.5
(100.0)158.4
(100.0)827.1
(100.0)37.4 38.6 20.4
Notes: Government bonds are the sum of short-term government bonds and long-term government bonds.
Figures for flows do not include changes in the amount outstanding due to valuation changes. Source: Bank of Japan, "Flow of Funds Accounts Statistics."
9
share of government bonds held by corporate pension funds has remained more or less
constant, while the share of government bonds held by insurance companies has increased
moderately; both types of entities have shown no tendency to reduce government bond
holdings when the BOJ increased government bond purchases.8 Insurance and corporate
pension funds (especially defined benefit pension plans) have a liability structure with long
duration, which implies that payment flows will last for a long time into the future.
Consequently, these entities have a strong incentive to hold government bonds with a long
remaining maturity in order to match the duration of assets to the duration of liabilities.
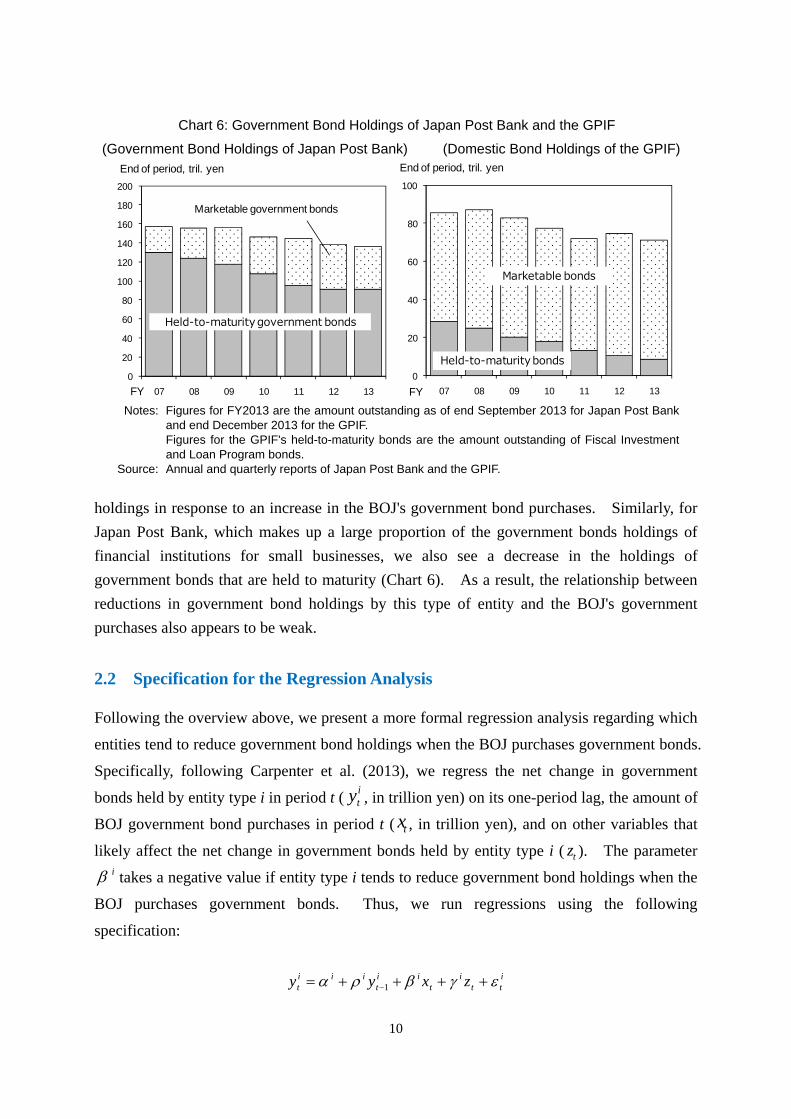
The shares of government bonds held by financial institutions for small businesses
(which include Japan Post Bank) and by public pensions (which include the GPIF) steadily
increased during the 2000s, mainly because of the underwriting of the Fiscal Investment and
Loan Program Agency Bonds, before starting to decline again from around 2008 (Chart 5).
The decline in the share of government bonds held by these entities, however, is not directly
related to the BOJ's government bond purchases, for the following reasons. As for the GPIF,
its pension payments have exceeded its revenues in recent years. Since the GPIF covers its
deficit with cash flows generated from the redemption of government bonds at maturity, the
GPIF has reduced its holdings of government bonds that are held to maturity, not those held to
trade (Chart 6). This fact suggests that so far the GPIF has not reduced government bond
8 Similarly, no clear decrease in the shares of government bonds held by financial institutions for agriculture, forestry, and fishery, foreign banks in Japan, broker-dealers, and securities investment trusts can be observed when the share of government bonds held by the BOJ increases.
Chart 5: Developments in the Share of Government Bonds Held by Each Entity
Source: Bank of Japan, "Flow of Funds Accounts Statistics."
0
5
10
15
20
25
00 01 02 03 04 05 06 07 08 09 10 11 12 13
% share of total
Domestic banks
Overseas
FIs for agriculture, forestry, and fishery
QE CE QQE
CY
Foreign banks in Japan
Bank of Japan
0
5
10
15
20
25
00 01 02 03 04 05 06 07 08 09 10 11 12 13
FIs for small businesses
Insurance companies
Securitiesinvestment trusts
Corporate pension funds
QE CE QQE
CY
Public pensions
Broker-dealers
% share of total
10
holdings in response to an increase in the BOJ's government bond purchases. Similarly, for
Japan Post Bank, which makes up a large proportion of the government bonds holdings of
financial institutions for small businesses, we also see a decrease in the holdings of
government bonds that are held to maturity (Chart 6). As a result, the relationship between
reductions in government bond holdings by this type of entity and the BOJ's government
purchases also appears to be weak.
2.2 Specification for the Regression Analysis
Following the overview above, we present a more formal regression analysis regarding which
entities tend to reduce government bond holdings when the BOJ purchases government bonds.
Specifically, following Carpenter et al. (2013), we regress the net change in government
bonds held by entity type i in period t (ity , in trillion yen) on its one-period lag, the amount of
BOJ government bond purchases in period t ( tx , in trillion yen), and on other variables that
likely affect the net change in government bonds held by entity type i ( tz ). The parameteri takes a negative value if entity type i tends to reduce government bond holdings when the
BOJ purchases government bonds. Thus, we run regressions using the following
specification:
itt
it
iit
iiit zxyy 1
Chart 6: Government Bond Holdings of Japan Post Bank and the GPIF
(Government Bond Holdings of Japan Post Bank) (Domestic Bond Holdings of the GPIF)
Notes: Figures for FY2013 are the amount outstanding as of end September 2013 for Japan Post Bank
and end December 2013 for the GPIF. Figures for the GPIF's held-to-maturity bonds are the amount outstanding of Fiscal Investment
and Loan Program bonds. Source: Annual and quarterly reports of Japan Post Bank and the GPIF.
0
20
40
60
80
100
120
140
160
180
200
07 08 09 10 11 12 13FY
End of period, tril. yen
Marketable government bonds
Held-to-maturity government bonds
0
20
40
60
80
100
07 08 09 10 11 12 13FY
End of period, tril. yen
Marketable bonds
Held-to-maturity bonds
11
We run this regression for each of the ten types of entities listed in Chart 3 using
quarterly data for the period from 1999:Q4 to 2013:Q4.9 The sample period includes periods
in which the BOJ purchased government bonds through a series of asset purchase programs --
i.e., the QE, CE, QQE programs -- as well as periods in which the BOJ purchased government
bonds outside these programs such as during the so-called "rinban" operations.
For the dependent variable (ity ), we use data on net changes in government bond
holdings of entity type i. This variable reflects transactions in government bonds as well as
the redemption of government bonds at maturity and is unaffected by changes in the amount
of government bond holdings due to changes in their market value.10 The data source for
this variable is the "Financial Transactions" table in the Flow of Funds Accounts Statistics.
Note that some entities considered in our analysis are not counterparts to the BOJ's outright
purchases of Japanese government bonds and treasury discount bills (Chart 3). Thus, a
decrease in government bond holdings by entities during a period of purchases by the BOJ
does not necessarily imply that the entities participated in the BOJ's bond purchase
operations; instead, these entities may have sold government bonds in the market.
The reason for including the lagged value of entity type i's net change in government
bond holdings is to capture ongoing gradual portfolio adjustments unrelated to current
purchase operations by the BOJ. Next, the data for the BOJ's government bond purchases
( tx ) come from the "Flow Table" in the statistics on the Monetary Base and the Bank of
Japan's Transactions published by the BOJ. The vector of control variables ( tz ) consists of
the following three variables: (i) the overall change in the amount of government bonds
outstanding in the economy as a whole, (ii) the one-period lag of the equity yield spread (the
difference between the dividend yield on equities and the interest rate on government bonds
with two years to maturity), and (iii) the one-period lag of implied volatility of government
bond futures. 11 The reason for including the overall change in government bonds
9 Our sample period begins in 1999:Q4 because the BOJ started its purchases of short-term government bonds in October 1999.
10 Alternatively, one might consider using the ratio of the stock of government bonds held by entity type i to the stock of total assets held by the same entity type as the dependent variable. However, we did not use this ratio since it can be affected by changes in the stock of government bonds due to valuation changes.
11 For the equity yield spread and the implied volatility of government bond futures, we use the average values for each period. Note that our choice of control variables closely follows that of other studies. Carpenter et al. (2013), for example, also use the total change in the amount of government bonds outstanding, while Fratzscher et al. (2013) use the VIX, government bond yields, and equity returns as control variables.
12
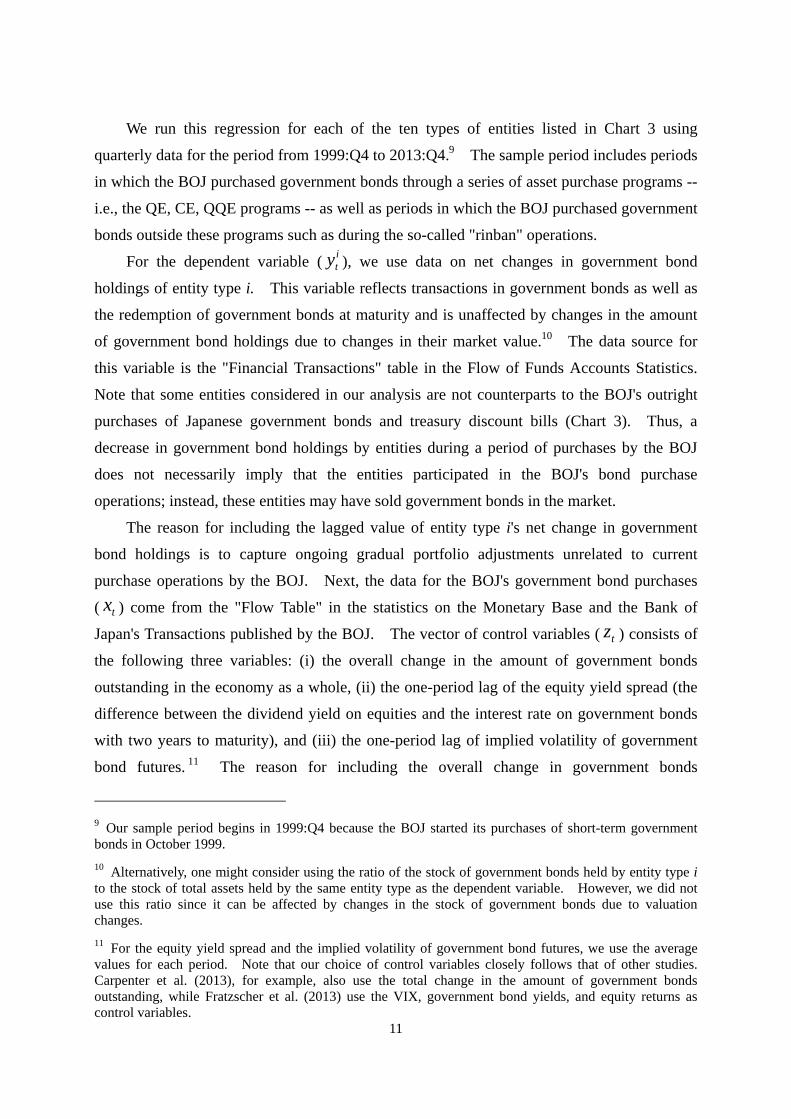
outstanding in the regression is to take the role of the issuance and redemption of government
bonds in the net investment of each type of entity into account. In fact, when we compare
the change in government bonds held by domestic banks with the overall change in
government bonds outstanding, we find that these are positively correlated (Chart 7).
Including this variable allows us to examine the role of the BOJ's government bond purchases
in the net change in each type of entity's government bond holdings by removing the effects
of the issuance and redemption of government bonds on the bond holdings of each type of
entity. Next, the purpose of including the equity yield spread in the control variables is to
take into account the impact of return differences between government bonds and equities.12
Finally, an increase in the implied volatility of government bond futures is expected to have a
negative impact on the net investment in government bonds by each type of entity.
2.3 Estimation Results
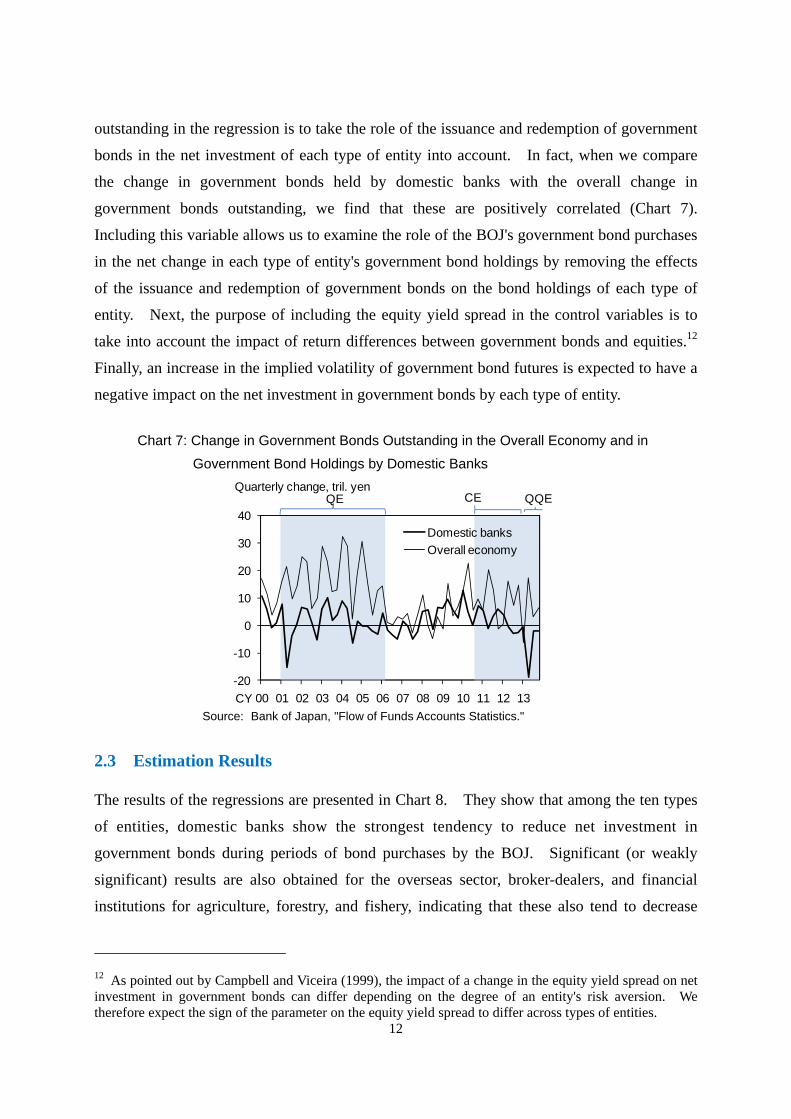
The results of the regressions are presented in Chart 8. They show that among the ten types
of entities, domestic banks show the strongest tendency to reduce net investment in
government bonds during periods of bond purchases by the BOJ. Significant (or weakly
significant) results are also obtained for the overseas sector, broker-dealers, and financial
institutions for agriculture, forestry, and fishery, indicating that these also tend to decrease
12 As pointed out by Campbell and Viceira (1999), the impact of a change in the equity yield spread on net investment in government bonds can differ depending on the degree of an entity's risk aversion. We therefore expect the sign of the parameter on the equity yield spread to differ across types of entities.
Chart 7: Change in Government Bonds Outstanding in the Overall Economy and in
Government Bond Holdings by Domestic Banks
Source: Bank of Japan, "Flow of Funds Accounts Statistics."
-20
-10
0
10
20
30
40
00 01 02 03 04 05 06 07 08 09 10 11 12 13
Domestic banks
Overall economy
Quarterly change, tril. yen
CY
QE CE QQE
13
government bond holdings when the BOJ purchases government bonds, although the size of
the decrease is considerably smaller than in the case of domestic banks.
On the other hand, foreign banks in Japan, insurance companies, corporate pension funds,
securities investment trusts, financial institutions for small businesses, and public pensions do
not show a tendency to reduce their government bond holdings when the BOJ purchases
government bonds. Because insurance companies and corporate pension funds (especially
defined benefit pension funds) have liabilities with a long duration, they have a strong
incentive to hold a certain amount of long-term government bonds in order to keep the
duration mismatch between assets and liabilities small.
Next, Chart 9 shows the regression results when we separate the BOJ's government bond
purchases into purchases of short-term and long-term government bonds. The results again
indicate that different types of entities responded differently to the BOJ's purchases of
short-term and long-term government bonds. Specifically, starting with short-term
government bond purchases by the BOJ, domestic banks and the overseas sector tend to
significantly reduce their government bond holdings. Significant reductions can also be
observed for broker-dealers as well as foreign banks in Japan, although the size of these
Chart 8: Response of Government Bond Holdings to Bank of Japan Purchases
(a) All Government Bonds
Notes: Figures in parentheses are Newey-West standard errors.
***, **, and * indicate significance at the 1%, 5%, and 10% level, respectively. Shaded cells indicate a statistically significant decrease in government bond holdings when the Bank of
Japan purchases government bonds.
-5.90*** 0.88 -0.10 1.11 0.59 0.17 -1.33 6.13*** 3.64 1.73**(1.76) (0.83) (1.41) (0.77) (0.45) (1.76) (1.02) (1.46) (2.21) (0.69)
-0.03 0.02 0.09 0.20 -0.16 -0.20 0.13 -0.06 0.28*** 0.32*(0.09) (0.12) (0.12) (0.13) (0.19) (0.13) (0.10) (0.05) (0.10) (0.19)
-0.32*** -0.02 -0.04** 0.00 0.01 -0.05* 0.02 -0.10*** -0.02 0.04(0.07) (0.02) (0.01) (0.02) (0.01) (0.03) (0.04) (0.02) (0.06) (0.04)
0.17** 0.00 0.02 0.03* 0.00 0.07* 0.03 -0.02 0.16*** 0.03(0.08) (0.02) (0.02) (0.02) (0.01) (0.04) (0.03) (0.03) (0.05) (0.02)
4.01*** -0.33 0.52 -0.17 -0.01 -0.57 0.03 -0.75* -1.73* -1.34***(0.67) (0.24) (0.41) (0.27) (0.15) (0.67) (0.15) (0.45) (0.93) (0.49)
1.37*** -0.08 0.01 0.05 -0.14 0.24 0.24 -0.63** -0.42 -0.10(0.49) (0.11) (0.28) (0.12) (0.08) (0.24) (0.23) (0.25) (0.33) (0.15)
Sample period 1999/Q4-2013/Q4
Government bond purchases by the Bank of Japan
Change in government bondsoutstanding in economy overall
Equity yield spread(lagged one period)
Implied volatility of governmentbond futures (lagged one period)
Securitiesinvestment
trusts
Overseassector
FIs forsmall
businesses
Publicpensions
Constant
Lagged dependent variable
Domesticbanks
Foreignbanks inJapan
FIs foragriculture,
forestry,
and fishery
Insurancecompanies
Corporatepensionfunds
Broker-dealers
14
reductions is comparatively small. Next, looking at the impact of long-term government
bond purchases by the BOJ, we find that domestic banks and, to a lesser extent, financial
institutions for agriculture, forestry, and fishery as well as insurance companies reduce their
government bond holdings. The estimation results in Chart 9 further indicate that financial
institutions for small businesses and public pensions also tend to reduce their government
bond holdings when the BOJ purchases long-term government bonds. However, as
mentioned above, the reductions in government bond holdings by these entities likely are
unrelated to the BOJ's monetary policy.
3 Portfolio Rebalancing
The analysis in the previous section suggests that although patterns differ somewhat
depending on whether the BOJ purchases short-term or long-term government bonds, it is
mainly domestic banks and the overseas sector that tend to reduce government bond holdings
in response to such purchases. In this section, we examine this kind of portfolio rebalancing
in greater detail. Specifically, we first examine portfolio rebalancing at the macro level by
aggregating the investment of all types of entities. We then analyze in which assets domestic
Chart 9: Response of Government Bond Holdings to Bank of Japan Purchases
(b) Short-Term and Long-Term Bonds Separately
Notes: Figures in parentheses are Newey-West standard errors.
***, **, and * indicate significance at the 1%, 5%, and 10% level, respectively. Shaded cells indicate a statistically significant decrease in government bond holdings when the Bank of
Japan purchases government bonds.
-5.85*** 0.88 -0.14 1.37** 0.59 -0.02 -1.58* 6.45*** 5.14** 2.31***(1.41) (0.81) (1.14) (0.58) (0.42) (1.66) (0.85) (1.40) (2.16) (0.70)
-0.03 0.00 0.04 0.09 -0.15 -0.16 0.11 -0.11** 0.07 0.04(0.09) (0.11) (0.12) (0.09) (0.19) (0.13) (0.08) (0.05) (0.10) (0.22)
-0.26* -0.05** 0.02 0.06*** 0.01 -0.13* -0.02 -0.27*** 0.25*** 0.18**(0.15) (0.02) (0.03) (0.02) (0.02) (0.08) (0.03) (0.07) (0.06) (0.07)
-0.43** 0.04* -0.15*** -0.11*** 0.00 0.13 0.14*** 0.17*** -0.45*** -0.15**(0.18) (0.02) (0.05) (0.02) (0.02) (0.11) (0.04) (0.03) (0.06) (0.06)
0.15 0.01 0.00 0.02 0.00 0.10* 0.04 0.03 0.10** 0.00(0.10) (0.02) (0.02) (0.02) (0.02) (0.05) (0.03) (0.03) (0.04) (0.02)
4.39*** -0.56* 0.94** 0.15 0.02 -1.19 -0.37* -1.77*** -0.88 -1.20***(0.68) (0.29) (0.37) (0.29) (0.18) (0.74) (0.21) (0.49) (0.83) (0.36)
1.32*** -0.06 -0.02 -0.01 -0.14 0.32 0.31 -0.56*** -0.71** -0.17(0.42) (0.11) (0.23) (0.08) (0.09) (0.25) (0.19) (0.19) (0.28) (0.12)
Sample period 1999/Q4-2013/Q4
Short-term government bondpurchases by the Bank of Japan
Long-term government bondpurchases by the Bank of Japan
Change in government bondsoutstanding in economy overall
Equity yield spread(lagged one period)
Implied volatility of governmentbond futures (lagged one period)
Securitiesinvestment
trusts
Overseassector
FIs for smallbusinesses
Publicpensions
Constant
Corporatepensionfunds
Broker-dealers
Lagged dependent variable
Domesticbanks
Foreignbanks inJapan
FIs foragriculture,
forestry, andfishery
Insurancecompanies
15
banks' and the overseas sector's investment increased when the BOJ purchased government
bonds, focusing on the seven types of assets listed in Chart 10.13
3.1 Portfolio Rebalancing at the Macro Level
Looking at portfolio rebalancing at the macro level, we find that since the beginning of 2013,
entities other than the BOJ, as a group, have been increasing loans as well as investment in
equities and mutual funds and to a lesser extent in corporate bonds, while reducing their
holdings of government bonds (Chart 11). During the same period, the BOJ has been
increasing government bond holdings through QQE.
Next, we take a brief look at the contribution of each type of entity to the macro-level
investment in equities and mutual funds, corporate bonds, and outward securities
investment.14 Note that for investment in a certain asset to increase at the macro level,
13 There are three caveats regarding the data used in this section. First, we do not include call loans when we use the Flow of Funds Accounts data for loans. Second, loans made by domestic banks include only loans made by domestic branches of Japanese banks and do not include loans made by foreign branches of Japanese banks. Loans made by domestic banks, however, include loans made by domestic branches of Japanese banks to foreign branches of Japanese banks (so called interoffice accounts). Third, corporate bonds include only industrial securities and external securities issued by residents, and do not include bank debentures, structured financing instruments, and commercial paper.
14 Loans at the macro level can be mostly explained by the behavior of domestic banks, as will be seen shortly.
Chart 10: Types of Assets Covered in this Paper
Types of Assets Detail
Government bonds Treasury discount bills, Central government securities, Fiscal Investment and Loan Program bonds
Currency and deposits (excluding deposits with the Bank of Japan)
Currency, Transferable deposits, Time and savings deposits, Certificates of deposit, Foreign currency deposits
Deposits with the Bank of Japan
Loans
Loans by private financial institutions, Loans by the nonfinancial sector, Bills purchased and sold, Installment credit, Repurchase agreements and securities lending transactions
Corporate bonds Industrial securities, External securities issued by residents
Equities and mutual funds Shares, Investment trust beneficiary certificates, Trust beneficiary rights
Outward investment Outward investment in securities, Outward direct investment
16
issuances of that asset must increase. Looking at the results, we find the following. First,
total net investment in equities and mutual funds has been positive since the end of 2012, led
by the overseas sector (Chart 12). As for investment in corporate bonds, unlike that in
equities and mutual funds, no substantial net increase can be observed. Yet, investment in
corporate bonds has been positive since the beginning of 2013, implying that the issuance of
corporate bonds has increased (Chart 13). As for outward securities investment, no clear
pattern since the end of 2012 can be observed: positive net investment by financial institutions
for agriculture, forestry, and fishery as well as nonfinancial corporations tends to be offset by
negative net investment by domestic banks, public pensions, and corporate pension funds
(Chart 14).15
15 Outward investment flows of domestic banks are negative in the second quarter of 2013 (Chart 14). Domestic banks sold medium- to long-term foreign bonds during that period in order to cover losses on Japanese government bonds owing to the increase in long-term interest rates in Japan.
Chart 11: Portfolio Rebalancing from Government Bonds to Other Assets at the Macro Level
(a) Changes in Government Bond Holdings (b) Investment Flows of Entities Other than the BOJ of the BOJ
Notes: "Entities other than the BOJ" in (b) includes all entities covered in the Flow of Funds (listed in Chart
4) except for the Bank of Japan. Outward investment consists of outward securities investment and outward direct investment.
Source: Bank of Japan, "Flow of Funds Accounts Statistics."
-15
-10
-5
0
5
10
15
20
25
30
10/Q4
11 12 13
Government bonds
4-quarter moving average of quarterly changes, tril. yen
-15
-10
-5
0
5
10
15
20
25
30
10/Q4
11 12 13
Government bondsCorporate bondsEquities and mutual fundsLoansOutward investment
4-quarter moving average of quarterly amount, tril. yen
17
Chart 12: Investment in Equities and Mutual Funds at the Macro Level
Source: Bank of Japan, "Flow of Funds Accounts Statistics."
-6
-4
-2
0
2
4
6
8
12/Q4 13/Q1 Q2 Q3 Q4
OtherDomestic banksHouseholdsPublic pensionsOverseasTotal
Quarterly amount, tril. yen
Chart 13: Investment in Corporate Bonds at the Macro Level
(a) Investment in Corporate Bonds by Type of Entity (b) Investment in Corporate Bonds by Type
Notes: In panel (a), corporate bonds consist of industrial securities and external securities issued by residents.
In panel (b), corporate bonds are domestically issued bonds. Monthly investment is calculated as the difference in the amount outstanding from the previous month.
Sources: For (a), Bank of Japan, "Flow of Funds Accounts Statistics." For (b), Japan Securities Depository Center and I-N Information Systems "Funding Eye."
-2
-1
0
1
2
3
12/Q4 13/Q1 2Q 3Q 4Q
Corporate pension fundsOtherInsurance companiesFIs for small businessesPublic pensionsOverseasDomestic banksTotal
Quarterly amount, tril. yen
-0.15
-0.10
-0.05
0.00
0.05
0.10
0.15
0.20
12/10
13/1 4 7 10 14/1
Industrial securities
External securities issued by residentsTotal
12-month moving average of monthly investment, tril. yen
18
3. 2 Portfolio Rebalancing of Domestic Banks
We next examine in which assets domestic banks and the overseas sector tend to increase their
investment when the BOJ purchases government bonds. Specifically, following Carpenter et
al. (2013), we estimate the following regression equation using the Flow of Funds Accounts
Statistics: we regress the changes in asset j held by each type of entity ( jtA , in trillion yen) on
its one-period lag, on the BOJ's government bond purchases ( tx , in trillion yen), and on other
variables that are expected to influence the portfolio choice of domestic banks and the
overseas sector ( tz ). We are interested in the parameter on the BOJ's government bond
purchases ( j ). Specifically, we run the following regression:
jtt
jt
jjt
jjjt zxAA γ1
In this specification, jtA represents the seven types of assets listed in Chart 10. Thus,
seven equations are estimated for each type of entity. In the estimation, we use seemingly
unrelated regression (SUR) to account for potential correlation among the error terms in the
seven equations, which may arise when changes in the holdings of the seven types of assets
are correlated due to factors not captured by our explanatory variables. As controls ( tz ), we
use the following three variables: (i) the change in the amount outstanding of asset type j in
the economy as a whole (in trillion yen), (ii) the one-period lag of the equity yield spread, and
Chart 14: Outward Securities Investment at the Macro Level
Note: Outward securities investment is calculated by subtracting outward direct investment and the
central government's outward securities investment from outward investment. Source: Bank of Japan, "Flow of Funds Accounts Statistics."
-15
-10
-5
0
5
10
15
20
12/Q4 13/Q1 2Q 3Q 4Q
Nonf inancial corporationsFIs for agriculture, forestry, and f isheryPublic pensionsCorporate pension fundsDomestic banksOthersTotal
Quarterly amount, tril. yen
19
(iii) the one-period lag of the implied volatility of government bond futures. 16 The
estimation period is from 1999:Q4 to 2013:Q4.
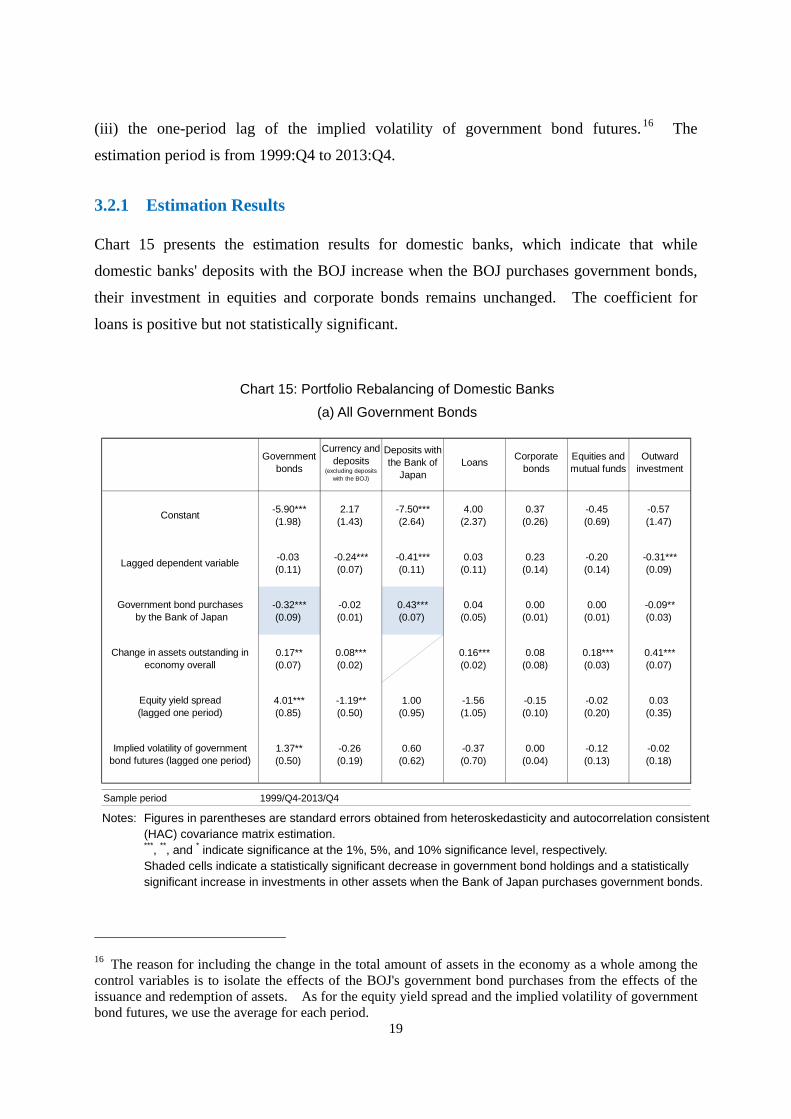
3.2.1 Estimation Results
Chart 15 presents the estimation results for domestic banks, which indicate that while
domestic banks' deposits with the BOJ increase when the BOJ purchases government bonds,
their investment in equities and corporate bonds remains unchanged. The coefficient for
loans is positive but not statistically significant.
16 The reason for including the change in the total amount of assets in the economy as a whole among the control variables is to isolate the effects of the BOJ's government bond purchases from the effects of the issuance and redemption of assets. As for the equity yield spread and the implied volatility of government bond futures, we use the average for each period.
Chart 15: Portfolio Rebalancing of Domestic Banks
(a) All Government Bonds
Notes: Figures in parentheses are standard errors obtained from heteroskedasticity and autocorrelation consistent
(HAC) covariance matrix estimation. ***, **, and * indicate significance at the 1%, 5%, and 10% significance level, respectively. Shaded cells indicate a statistically significant decrease in government bond holdings and a statistically significant increase in investments in other assets when the Bank of Japan purchases government bonds.
-5.90*** 2.17 -7.50*** 4.00 0.37 -0.45 -0.57(1.98) (1.43) (2.64) (2.37) (0.26) (0.69) (1.47)
-0.03 -0.24*** -0.41*** 0.03 0.23 -0.20 -0.31***(0.11) (0.07) (0.11) (0.11) (0.14) (0.14) (0.09)
-0.32*** -0.02 0.43*** 0.04 0.00 0.00 -0.09**(0.09) (0.01) (0.07) (0.05) (0.01) (0.01) (0.03)
0.17** 0.08*** 0.16*** 0.08 0.18*** 0.41***(0.07) (0.02) (0.02) (0.08) (0.03) (0.07)
4.01*** -1.19** 1.00 -1.56 -0.15 -0.02 0.03(0.85) (0.50) (0.95) (1.05) (0.10) (0.20) (0.35)
1.37** -0.26 0.60 -0.37 0.00 -0.12 -0.02(0.50) (0.19) (0.62) (0.70) (0.04) (0.13) (0.18)
Sample period 1999/Q4-2013/Q4
Equity yield spread(lagged one period)
Implied volatility of governmentbond futures (lagged one period)
Equities andmutual funds
Outwardinvestment
Constant
Lagged dependent variable
Government bond purchases by the Bank of Japan
Change in assets outstanding ineconomy overall
Governmentbonds
Currency anddeposits
(excluding depositswith the BOJ)
Deposits withthe Bank of
JapanLoans
Corporatebonds
20
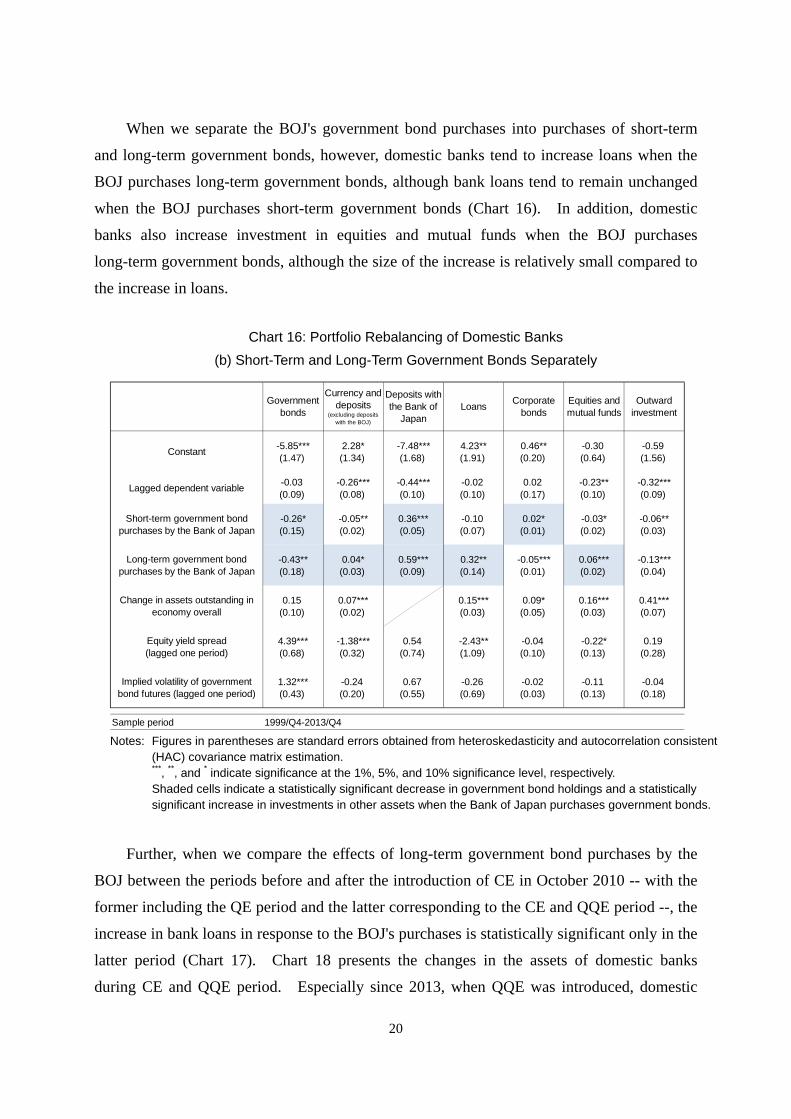
When we separate the BOJ's government bond purchases into purchases of short-term
and long-term government bonds, however, domestic banks tend to increase loans when the
BOJ purchases long-term government bonds, although bank loans tend to remain unchanged
when the BOJ purchases short-term government bonds (Chart 16). In addition, domestic
banks also increase investment in equities and mutual funds when the BOJ purchases
long-term government bonds, although the size of the increase is relatively small compared to
the increase in loans.
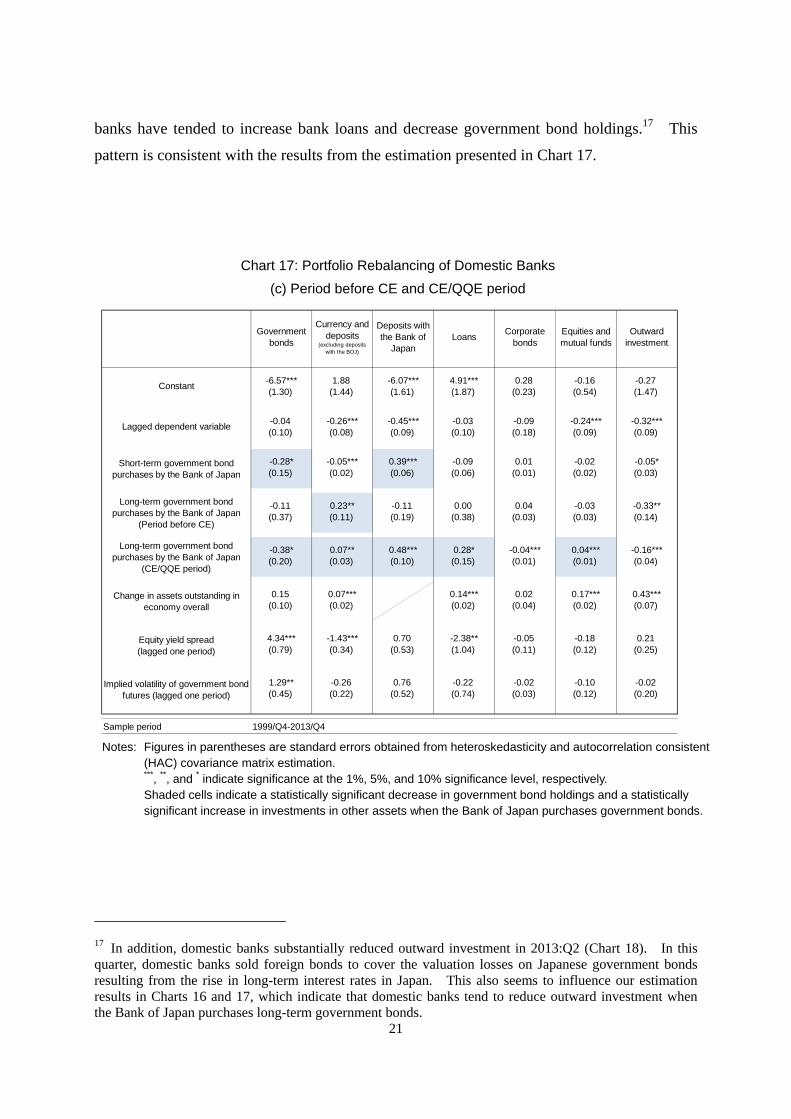
Further, when we compare the effects of long-term government bond purchases by the
BOJ between the periods before and after the introduction of CE in October 2010 -- with the
former including the QE period and the latter corresponding to the CE and QQE period --, the
increase in bank loans in response to the BOJ's purchases is statistically significant only in the
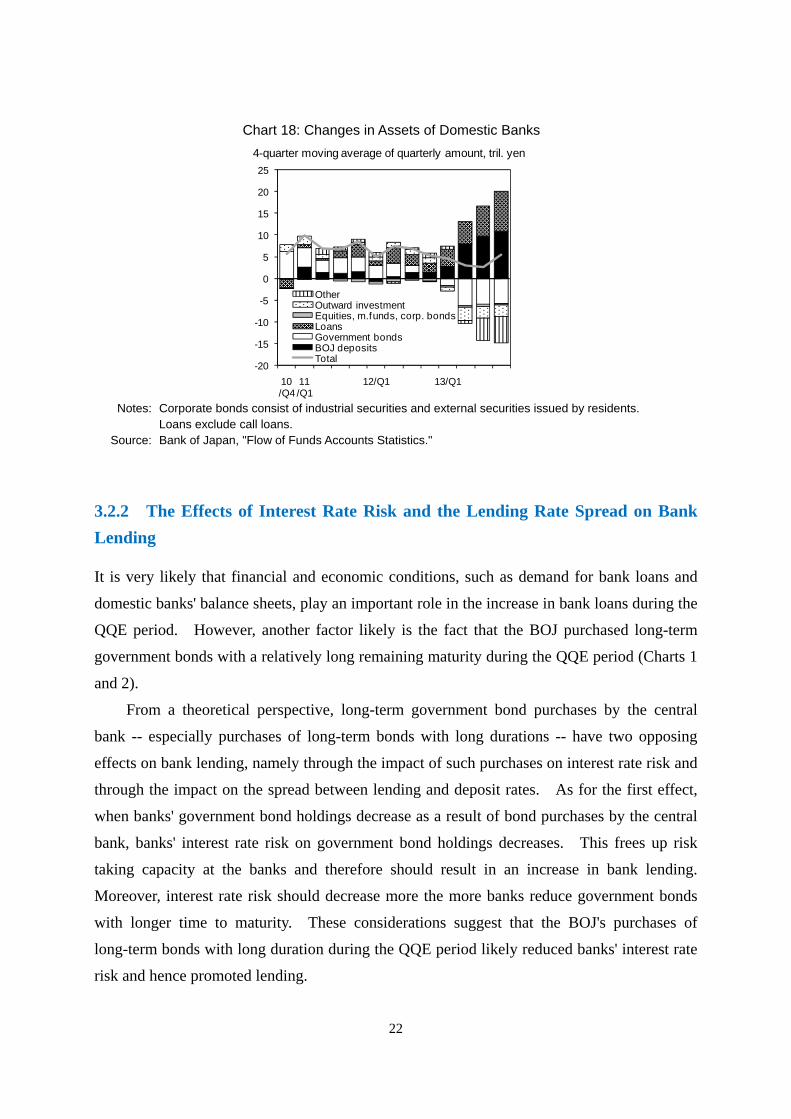
latter period (Chart 17). Chart 18 presents the changes in the assets of domestic banks
during CE and QQE period. Especially since 2013, when QQE was introduced, domestic
Chart 16: Portfolio Rebalancing of Domestic Banks
(b) Short-Term and Long-Term Government Bonds Separately
Notes: Figures in parentheses are standard errors obtained from heteroskedasticity and autocorrelation consistent
(HAC) covariance matrix estimation. ***, **, and * indicate significance at the 1%, 5%, and 10% significance level, respectively. Shaded cells indicate a statistically significant decrease in government bond holdings and a statistically significant increase in investments in other assets when the Bank of Japan purchases government bonds.
-5.85*** 2.28* -7.48*** 4.23** 0.46** -0.30 -0.59(1.47) (1.34) (1.68) (1.91) (0.20) (0.64) (1.56)
-0.03 -0.26*** -0.44*** -0.02 0.02 -0.23** -0.32***(0.09) (0.08) (0.10) (0.10) (0.17) (0.10) (0.09)
-0.26* -0.05** 0.36*** -0.10 0.02* -0.03* -0.06**(0.15) (0.02) (0.05) (0.07) (0.01) (0.02) (0.03)
-0.43** 0.04* 0.59*** 0.32** -0.05*** 0.06*** -0.13***(0.18) (0.03) (0.09) (0.14) (0.01) (0.02) (0.04)
0.15 0.07*** 0.15*** 0.09* 0.16*** 0.41***(0.10) (0.02) (0.03) (0.05) (0.03) (0.07)
4.39*** -1.38*** 0.54 -2.43** -0.04 -0.22* 0.19(0.68) (0.32) (0.74) (1.09) (0.10) (0.13) (0.28)
1.32*** -0.24 0.67 -0.26 -0.02 -0.11 -0.04(0.43) (0.20) (0.55) (0.69) (0.03) (0.13) (0.18)
Sample period 1999/Q4-2013/Q4
Corporatebonds
Equities andmutual funds
Outwardinvestment
Constant
Lagged dependent variable
Short-term government bondpurchases by the Bank of Japan
Long-term government bondpurchases by the Bank of Japan
Change in assets outstanding ineconomy overall
Equity yield spread(lagged one period)
Implied volatility of governmentbond futures (lagged one period)
Governmentbonds
Currency anddeposits
(excluding depositswith the BOJ)
Deposits withthe Bank of
JapanLoans
21
banks have tended to increase bank loans and decrease government bond holdings.17 This
pattern is consistent with the results from the estimation presented in Chart 17.
17 In addition, domestic banks substantially reduced outward investment in 2013:Q2 (Chart 18). In this quarter, domestic banks sold foreign bonds to cover the valuation losses on Japanese government bonds resulting from the rise in long-term interest rates in Japan. This also seems to influence our estimation results in Charts 16 and 17, which indicate that domestic banks tend to reduce outward investment when the Bank of Japan purchases long-term government bonds.
Chart 17: Portfolio Rebalancing of Domestic Banks
(c) Period before CE and CE/QQE period
Notes: Figures in parentheses are standard errors obtained from heteroskedasticity and autocorrelation consistent
(HAC) covariance matrix estimation. ***, **, and * indicate significance at the 1%, 5%, and 10% significance level, respectively.
Shaded cells indicate a statistically significant decrease in government bond holdings and a statistically significant increase in investments in other assets when the Bank of Japan purchases government bonds.
-6.57*** 1.88 -6.07*** 4.91*** 0.28 -0.16 -0.27(1.30) (1.44) (1.61) (1.87) (0.23) (0.54) (1.47)
-0.04 -0.26*** -0.45*** -0.03 -0.09 -0.24*** -0.32***(0.10) (0.08) (0.09) (0.10) (0.18) (0.09) (0.09)
-0.28* -0.05*** 0.39*** -0.09 0.01 -0.02 -0.05*(0.15) (0.02) (0.06) (0.06) (0.01) (0.02) (0.03)
-0.11 0.23** -0.11 0.00 0.04 -0.03 -0.33**(0.37) (0.11) (0.19) (0.38) (0.03) (0.03) (0.14)
-0.38* 0.07** 0.48*** 0.28* -0.04*** 0.04*** -0.16***(0.20) (0.03) (0.10) (0.15) (0.01) (0.01) (0.04)
0.15 0.07*** 0.14*** 0.02 0.17*** 0.43***(0.10) (0.02) (0.02) (0.04) (0.02) (0.07)
4.34*** -1.43*** 0.70 -2.38** -0.05 -0.18 0.21(0.79) (0.34) (0.53) (1.04) (0.11) (0.12) (0.25)
1.29** -0.26 0.76 -0.22 -0.02 -0.10 -0.02(0.45) (0.22) (0.52) (0.74) (0.03) (0.12) (0.20)
Sample period 1999/Q4-2013/Q4
Equities andmutual funds
Outwardinvestment
Constant
Lagged dependent variable
Short-term government bondpurchases by the Bank of Japan
Long-term government bondpurchases by the Bank of Japan
(Period before CE)
Long-term government bondpurchases by the Bank of Japan
(CE/QQE period)
Change in assets outstanding ineconomy overall
Governmentbonds
Currency anddeposits
(excluding depositswith the BOJ)
Deposits withthe Bank of
JapanLoans
Corporatebonds
Equity yield spread(lagged one period)
Implied volatility of government bondfutures (lagged one period)
22
3.2.2 The Effects of Interest Rate Risk and the Lending Rate Spread on Bank
Lending
It is very likely that financial and economic conditions, such as demand for bank loans and
domestic banks' balance sheets, play an important role in the increase in bank loans during the
QQE period. However, another factor likely is the fact that the BOJ purchased long-term
government bonds with a relatively long remaining maturity during the QQE period (Charts 1
and 2).
From a theoretical perspective, long-term government bond purchases by the central
bank -- especially purchases of long-term bonds with long durations -- have two opposing
effects on bank lending, namely through the impact of such purchases on interest rate risk and
through the impact on the spread between lending and deposit rates. As for the first effect,
when banks' government bond holdings decrease as a result of bond purchases by the central
bank, banks' interest rate risk on government bond holdings decreases. This frees up risk
taking capacity at the banks and therefore should result in an increase in bank lending.
Moreover, interest rate risk should decrease more the more banks reduce government bonds
with longer time to maturity. These considerations suggest that the BOJ's purchases of
long-term bonds with long duration during the QQE period likely reduced banks' interest rate
risk and hence promoted lending.
Chart 18: Changes in Assets of Domestic Banks
Notes: Corporate bonds consist of industrial securities and external securities issued by residents.
Loans exclude call loans. Source: Bank of Japan, "Flow of Funds Accounts Statistics."
-20
-15
-10
-5
0
5
10
15
20
25
10/Q4
11/Q1
12/Q1 13/Q1
OtherOutward investmentEquities, m.funds, corp. bondsLoansGovernment bondsBOJ depositsTotal
4-quarter moving average of quarterly amount, tril. yen
23
As for the second effect regarding the interest rate spread, central bank purchases of
government bonds with a long remaining maturity reduce the term spread (i.e., the spread
between long-term and short-term rates) and the spread between banks' lending and deposit
rates, reflecting the fact that banks' loans tend to be long term while the deposits they take
tend to be short term.18 A narrowing of the interest rate spread can be expected to weaken
the incentive for banks to make loans.
In addition, although this may not be directly related to bond purchases by the central
bank, bank lending can be also influenced by factors such as the demand for loans as well as
banks' balance sheet conditions, as indicated, for example, by their capital adequacy ratio or
nonperforming loan ratio.
To quantitatively examine the role of the two effects outlined above, we conduct a
regression analysis as described below. It should be noted that in doing so, we focus on the
behavior of "major banks," because it is these banks that greatly reduced their holdings of
long-term government bonds in recent period.19, 20 Specifically, we regress the aggregate
monthly lending (in trillion yen) of the major banks on four variables: (i) the interest rate risk
of major banks on their government bond holdings (monthly change, in trillion yen),21 (ii) the
interest rate spread (in percentage points), (iii) the diffusion index representing the loan
demand of large nonfinancial firms (the data are taken from the Bank of Japan's Senior Loan
Officer Opinion Survey, in percentage points), and (iv) the nonperforming loan ratio. We
18 This is true for unconventional monetary easing when short-term nominal interest rates are at the zero lower bound, but it is not necessarily true for conventional monetary easing when short-term nominal interest rates are not at the zero lower bound: in the former case, long-term interest rates fall while short-term interest rates remain unchanged, resulting in a decrease in the term spread; in the latter case, short-run nominal interest rates typically fall by a larger amount than long-term interest rates, resulting in a widening in the term spread. For an empirical analysis of this issue for the United States, see Gilchrist et al. (2014).
19 The group of "major banks" here consists of the following ten banks: five "city banks" (Bank of Tokyo-Mitsubishi UFJ, Mizuho Bank, Sumitomo Mitsui Banking Corporation, Resona Bank, and Saitama Resona Bank), three trust banks (Mitsubishi UFJ Trust and Banking Corporation, Mizuho Trust and Banking Company, and Sumitomo Mitsui Trust Bank), and two other banks (Shinsei Bank and Aozora Bank).
20 Although not considered in this paper, regional banks in Japan have also started to reduce government bond holdings since the middle of 2013 -- somewhat later than when city banks started to reduce government bond holdings --, and regional banks have been steadily increasing loans in recent years.
21 The amount of interest rate risk related to the holding of government bonds is calculated as (major banks' aggregate government bond holdings) (average remaining maturity for the government bonds held by major banks) 0.01. The monthly change is obtained by taking the difference in the amount of interest rate risk.
24
use monthly data from April 2007 to September 2013 in the estimation.22 For further details
on the data used in the estimation, see Appendix 1. Since monthly data are subject to
seasonality, we use the difference from the same month in the previous year in the estimation.
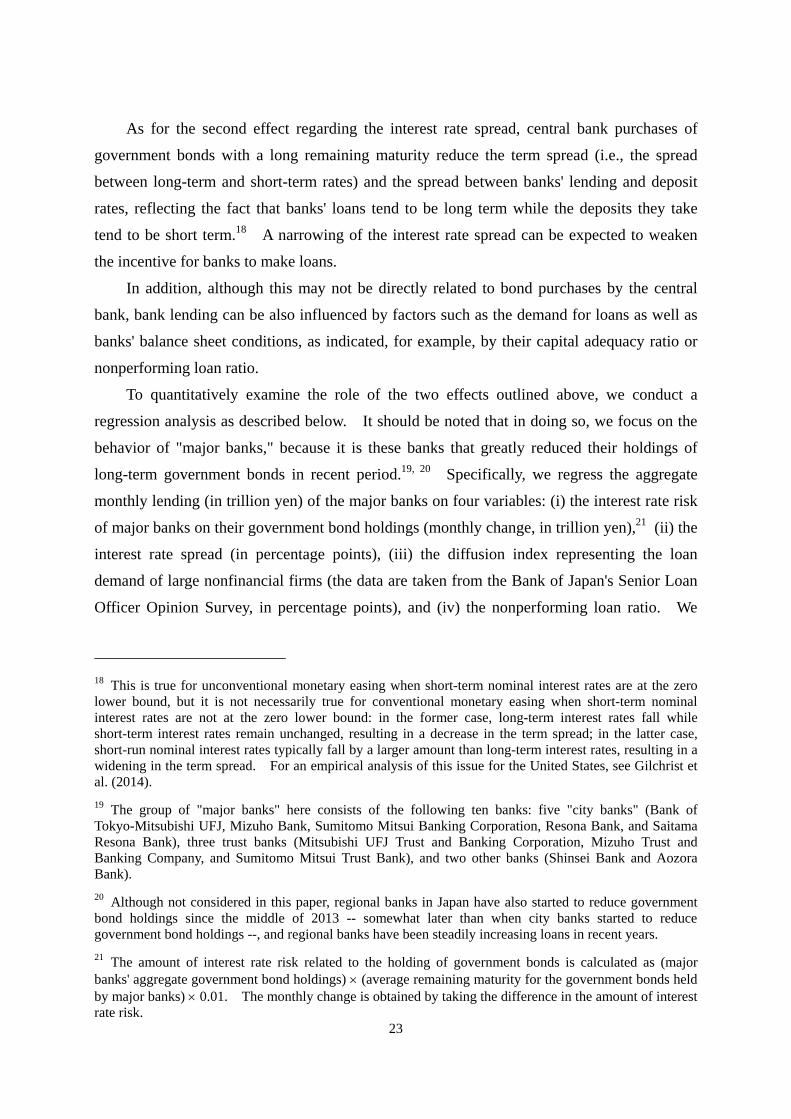
Chart 19 presents the estimation results. We find that, as expected, both major banks'
interest rate risk and their nonperforming loan ratio have a negative impact on bank lending,
while both the interest rate spread and loan demand have a positive impact on bank lending.23
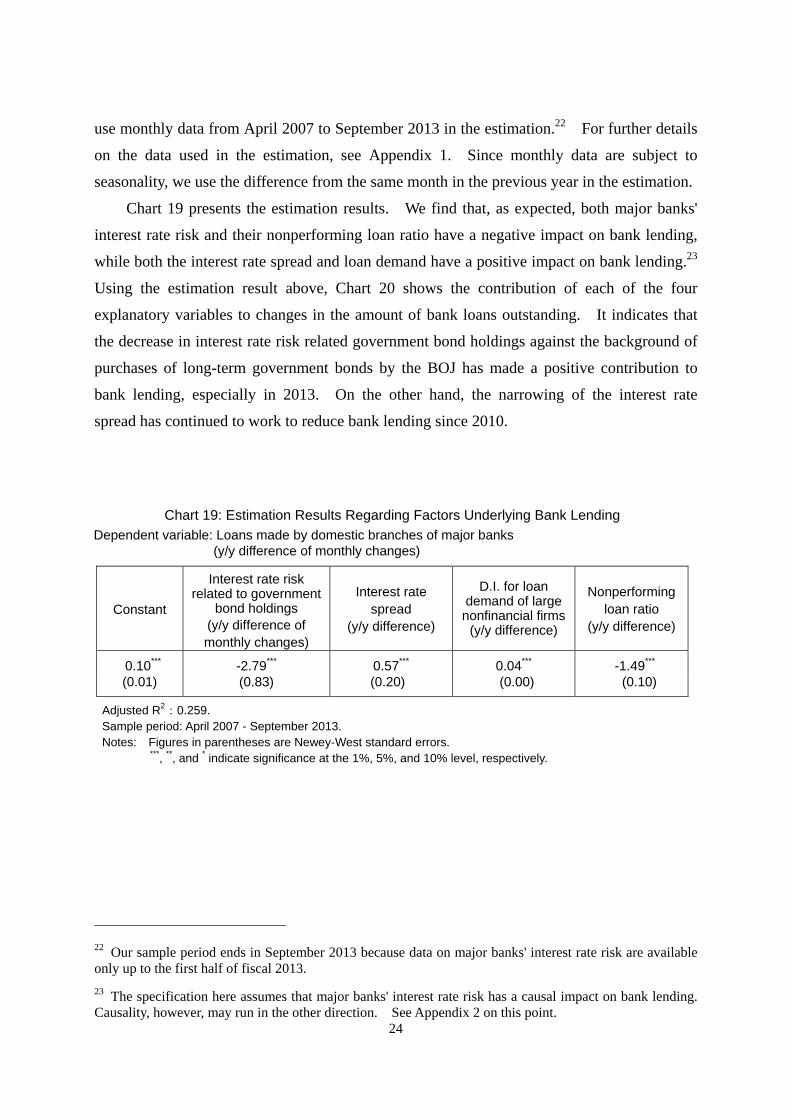
Using the estimation result above, Chart 20 shows the contribution of each of the four
explanatory variables to changes in the amount of bank loans outstanding. It indicates that
the decrease in interest rate risk related government bond holdings against the background of
purchases of long-term government bonds by the BOJ has made a positive contribution to
bank lending, especially in 2013. On the other hand, the narrowing of the interest rate
spread has continued to work to reduce bank lending since 2010.
22 Our sample period ends in September 2013 because data on major banks' interest rate risk are available only up to the first half of fiscal 2013.
23 The specification here assumes that major banks' interest rate risk has a causal impact on bank lending. Causality, however, may run in the other direction. See Appendix 2 on this point.
Chart 19: Estimation Results Regarding Factors Underlying Bank Lending Dependent variable: Loans made by domestic branches of major banks (y/y difference of monthly changes)
Constant
Interest rate risk related to government
bond holdings (y/y difference of monthly changes)
Interest rate spread
(y/y difference)
D.I. for loan demand of large nonfinancial firms
(y/y difference)
Nonperforming loan ratio
(y/y difference)
0.10*** -2.79*** 0.57*** 0.04*** -1.49*** (0.01) (0.83) (0.20) (0.00) (0.10)
Adjusted R2:0.259.
Sample period: April 2007 - September 2013. Notes: Figures in parentheses are Newey-West standard errors.
***, **, and * indicate significance at the 1%, 5%, and 10% level, respectively.
25
3.2.3 Changes in the Composition of Bank Loans
So far, we have looked at portfolio rebalancing by domestic banks in terms of the volume of
bank lending. We now examine whether there have been any changes in the composition of
bank lending under QQE.
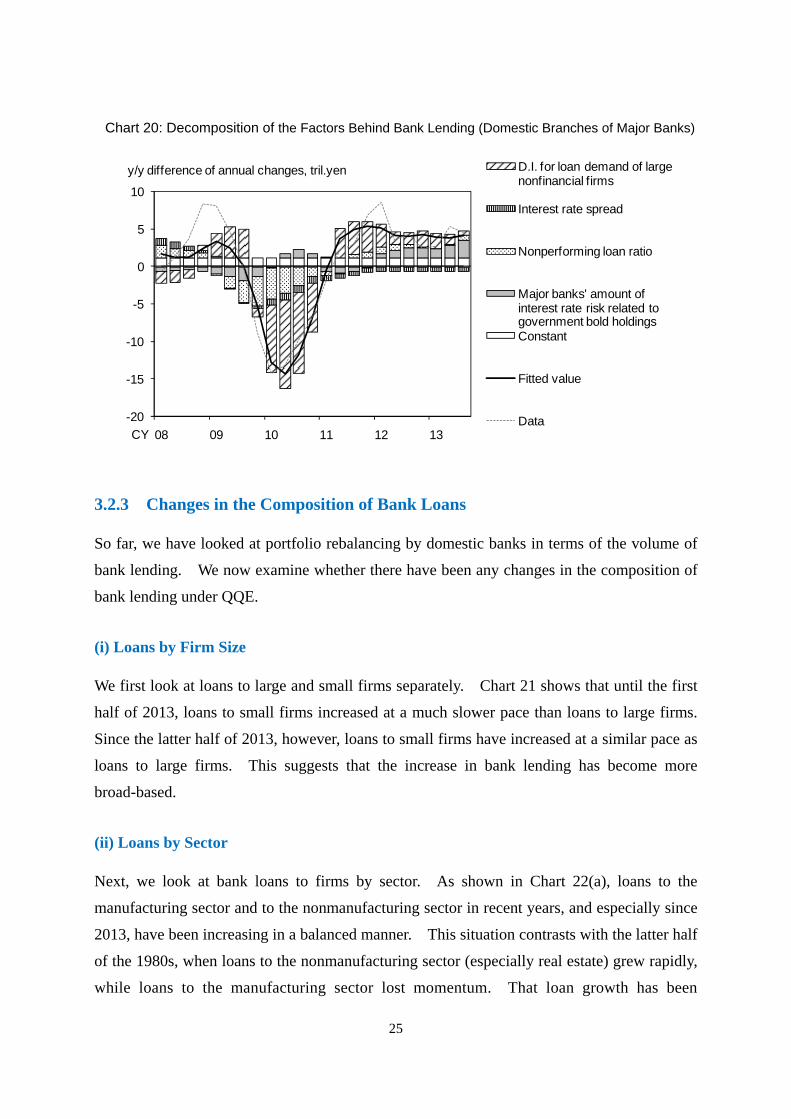
(i) Loans by Firm Size
We first look at loans to large and small firms separately. Chart 21 shows that until the first
half of 2013, loans to small firms increased at a much slower pace than loans to large firms.
Since the latter half of 2013, however, loans to small firms have increased at a similar pace as
loans to large firms. This suggests that the increase in bank lending has become more
broad-based.
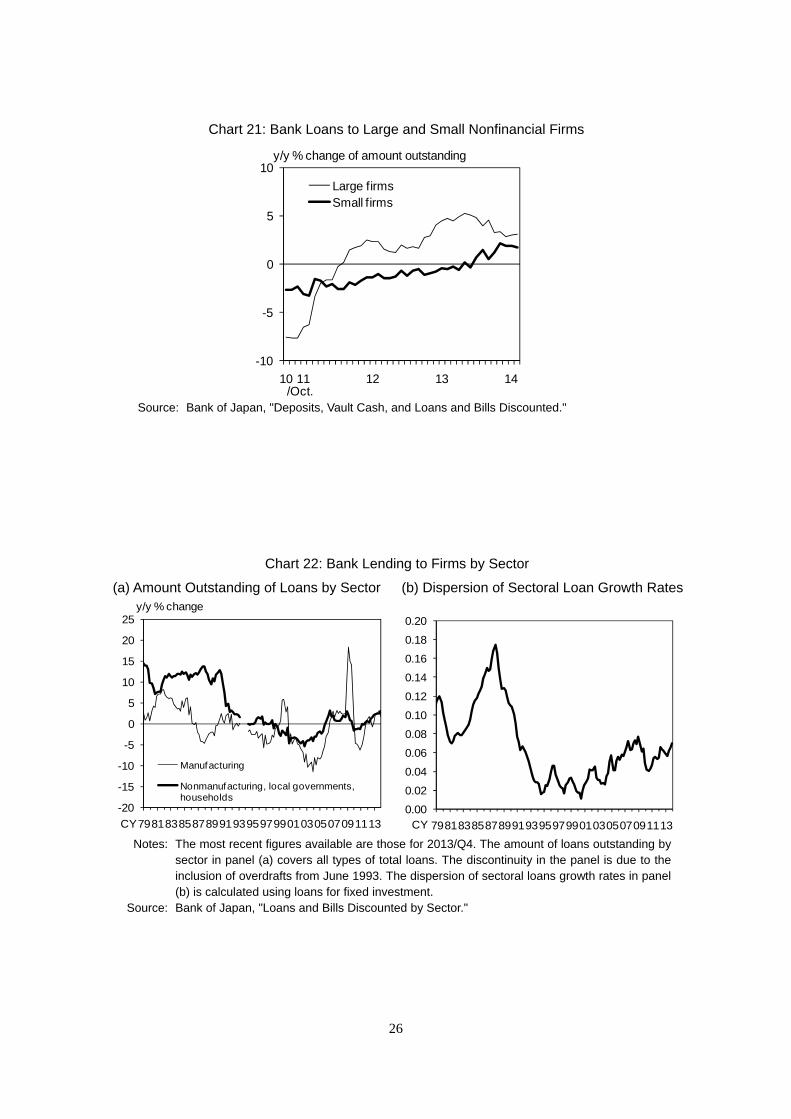
(ii) Loans by Sector
Next, we look at bank loans to firms by sector. As shown in Chart 22(a), loans to the
manufacturing sector and to the nonmanufacturing sector in recent years, and especially since
2013, have been increasing in a balanced manner. This situation contrasts with the latter half
of the 1980s, when loans to the nonmanufacturing sector (especially real estate) grew rapidly,
while loans to the manufacturing sector lost momentum. That loan growth has been
Chart 20: Decomposition of the Factors Behind Bank Lending (Domestic Branches of Major Banks)
-20
-15
-10
-5
0
5
10
08 09 10 11 12 13
D.I. for loan demand of large nonfinancial firms
Interest rate spread
Nonperforming loan ratio
Major banks' amount of interest rate risk related to government bold holdingsConstant
Fitted value
Data
y/y difference of annual changes, tril.yen
CY
26
Chart 21: Bank Loans to Large and Small Nonfinancial Firms
Source: Bank of Japan, "Deposits, Vault Cash, and Loans and Bills Discounted."
-10
-5
0
5
10
10 11 12 13 14
Large firmsSmall firms
y/y % change of amount outstanding
/Oct.
Chart 22: Bank Lending to Firms by Sector
(a) Amount Outstanding of Loans by Sector (b) Dispersion of Sectoral Loan Growth Rates
Notes: The most recent figures available are those for 2013/Q4. The amount of loans outstanding by
sector in panel (a) covers all types of total loans. The discontinuity in the panel is due to the inclusion of overdrafts from June 1993. The dispersion of sectoral loans growth rates in panel (b) is calculated using loans for fixed investment.
Source: Bank of Japan, "Loans and Bills Discounted by Sector."
0.00
0.02
0.04
0.06
0.08
0.10
0.12
0.14
0.16
0.18
0.20
798183858789919395979901030507091113CY
-20
-15
-10
-5
0
5
10
15
20
25
798183858789919395979901030507091113
Manufacturing
Nonmanufacturing, local governments, households
CY
y/y % change
27
relatively balanced in recent years can also been seen when measuring the dispersion of
sectoral loan growth rates, which is shown Chart 22(b).24 This also suggests that bank
lending has not been substantially biased to any specific sectors.
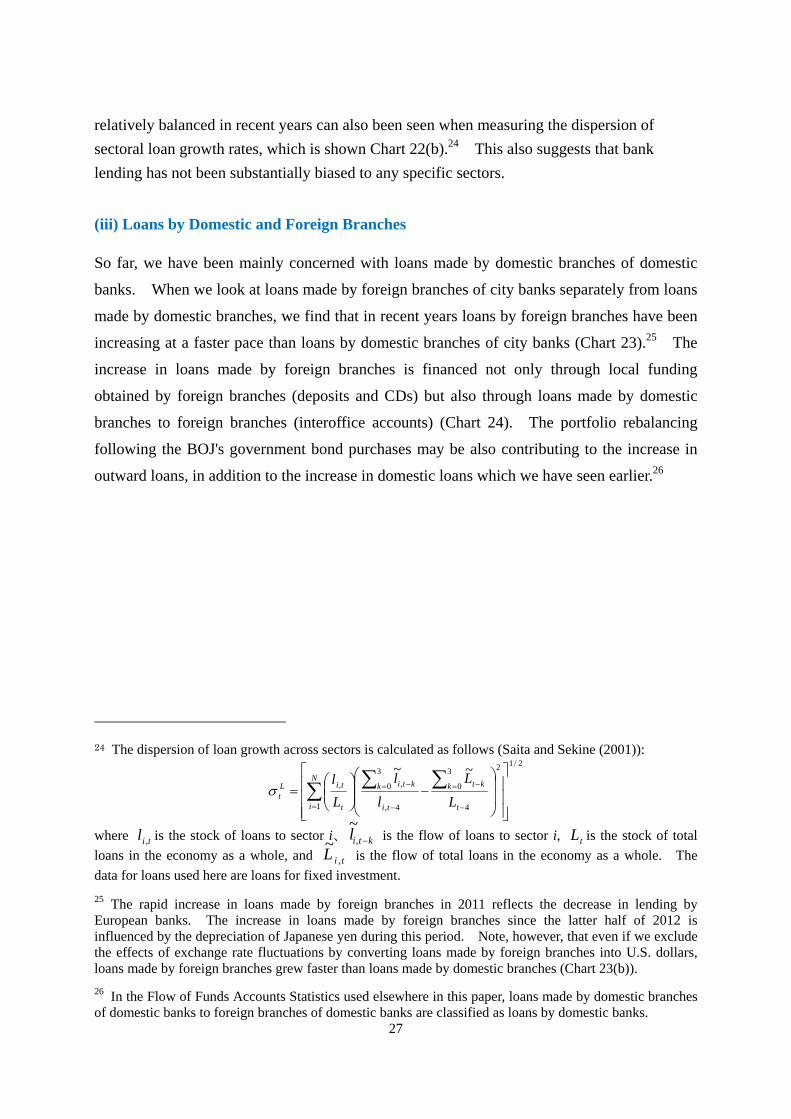
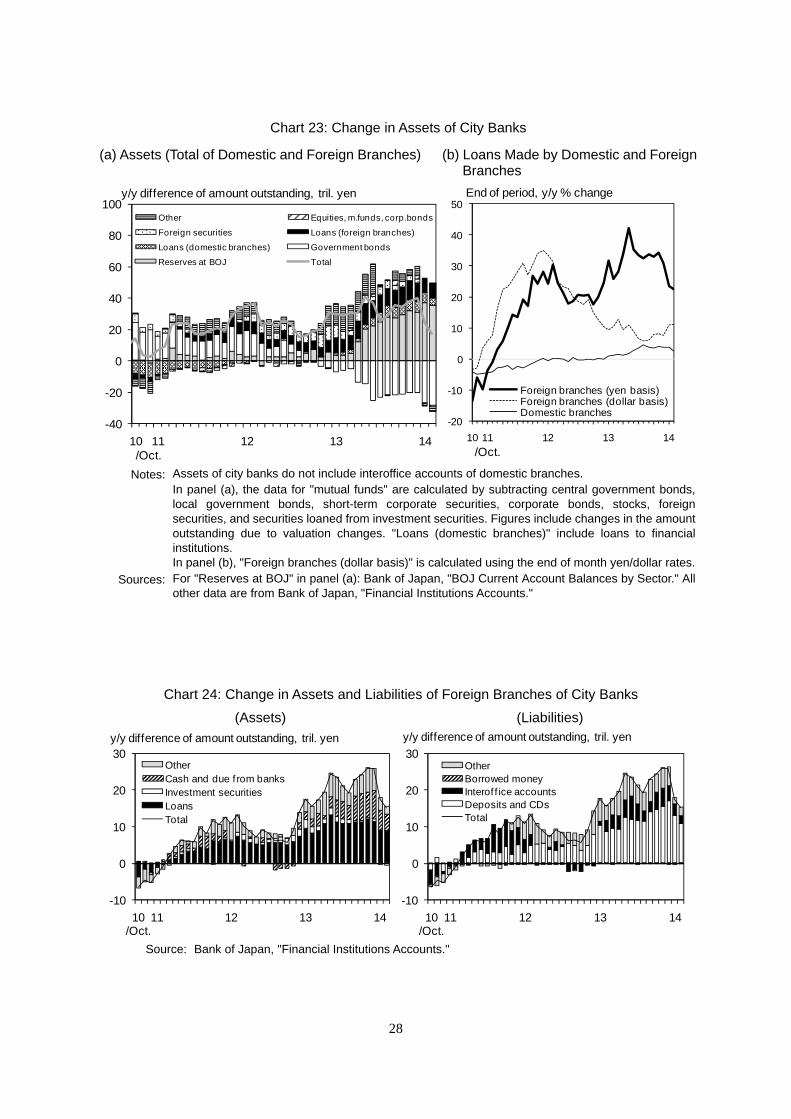
(iii) Loans by Domestic and Foreign Branches
So far, we have been mainly concerned with loans made by domestic branches of domestic
banks. When we look at loans made by foreign branches of city banks separately from loans
made by domestic branches, we find that in recent years loans by foreign branches have been
increasing at a faster pace than loans by domestic branches of city banks (Chart 23).25 The
increase in loans made by foreign branches is financed not only through local funding
obtained by foreign branches (deposits and CDs) but also through loans made by domestic
branches to foreign branches (interoffice accounts) (Chart 24). The portfolio rebalancing
following the BOJ's government bond purchases may be also contributing to the increase in
outward loans, in addition to the increase in domestic loans which we have seen earlier.26
24 The dispersion of loan growth across sectors is calculated as follows (Saita and Sekine (2001)): 2/12
1 4
3
0
4,
3
0 ,,
~~
N
i t
k kt
ti
k kti
t
tiLt L
L
l
l
L
l
where til , is the stock of loans to sector i、 ktil ,
~ is the flow of loans to sector i, tL is the stock of total
loans in the economy as a whole, and tiL ,
~ is the flow of total loans in the economy as a whole. The
data for loans used here are loans for fixed investment.
25 The rapid increase in loans made by foreign branches in 2011 reflects the decrease in lending by European banks. The increase in loans made by foreign branches since the latter half of 2012 is influenced by the depreciation of Japanese yen during this period. Note, however, that even if we exclude the effects of exchange rate fluctuations by converting loans made by foreign branches into U.S. dollars, loans made by foreign branches grew faster than loans made by domestic branches (Chart 23(b)).
26 In the Flow of Funds Accounts Statistics used elsewhere in this paper, loans made by domestic branches of domestic banks to foreign branches of domestic banks are classified as loans by domestic banks.
28
Chart 23: Change in Assets of City Banks
(a) Assets (Total of Domestic and Foreign Branches) (b) Loans Made by Domestic and Foreign Branches
Notes: Assets of city banks do not include interoffice accounts of domestic branches.
In panel (a), the data for "mutual funds" are calculated by subtracting central government bonds, local government bonds, short-term corporate securities, corporate bonds, stocks, foreign securities, and securities loaned from investment securities. Figures include changes in the amount outstanding due to valuation changes. "Loans (domestic branches)" include loans to financial institutions. In panel (b), "Foreign branches (dollar basis)" is calculated using the end of month yen/dollar rates.
Sources: For "Reserves at BOJ" in panel (a): Bank of Japan, "BOJ Current Account Balances by Sector." All other data are from Bank of Japan, "Financial Institutions Accounts."
-40
-20
0
20
40
60
80
100
10 11 11 11 11 12 12 12 12 13 13 13 13 14
Other Equities, m.funds, corp.bonds
Foreign securities Loans (foreign branches)
Loans (domestic branches) Government bonds
Reserves at BOJ Total
y/y difference of amount outstanding, tril. yen
/Oct.
-20
-10
0
10
20
30
40
50
10 11 11 11 11 12 12 12 12 13 13 13 13 14
Foreign branches (yen basis)Foreign branches (dollar basis)Domestic branches
End of period, y/y % change
/Oct.
Chart 24: Change in Assets and Liabilities of Foreign Branches of City Banks
(Assets) (Liabilities)
Source: Bank of Japan, "Financial Institutions Accounts."
-10
0
10
20
30
10/Oct.
11 12 13 14
OtherCash and due f rom banksInvestment securitiesLoansTotal
y/y difference of amount outstanding, tril. yen
-10
0
10
20
30
10/Oct.
11 12 13 14
OtherBorrowed moneyInterof f ice accountsDeposits and CDsTotal
y/y difference of amount outstanding, tril. yen
29
3.3 Portfolio Rebalancing of the Overseas Sector
Our analysis in Section 2 suggests that the overseas sector tends to reduce government bond
holdings when the BOJ purchases government bonds. Here, we examine in which assets the
overseas sector increases investment during such periods.
We run a similar regression for the overseas sector as the one we ran earlier for domestic
banks using the Flow of Funds Accounts Statistics. The estimation results are presented in
Chart 25 and suggest that the overseas sector tends to increase investment in Japanese equities
and mutual funds as well as in Japanese corporate bonds when the BOJ purchases government
bonds.27 When we split the sample into the periods before and after the introduction of CE
in October 2010, this pattern is more pronounced in the latter period (Chart 26).28
27 The Flow of Funds Accounts Statistics do not cover investment by the overseas sector outside Japan. For this reason, the column labeled "outward investment" in Chart 25 is empty.
28 According to the estimation results presented in Chart 26, the overseas sector tends to increase loans inside Japan when the BOJ purchases government bonds. Such increase in loans, however, mainly reflects the increase in repurchase agreements and securities lending transactions as well as the increase in loans to Japanese branches of foreign-owned banks. These types of loans are likely to have a smaller impact on the spending of Japanese firms and households than loans to firms and mortgage loans made by domestic banks.
Chart 25: Portfolio Rebalancing of the Overseas Sector
(a) Whole Sample Period
Notes: Figures in parentheses are standard errors obtained from heteroskedasticity and autocorrelation consistent
(HAC) covariance matrix estimation. ***, **, and * indicate significance at the 1%, 5%, and 10% significance level, respectively. Shaded cells indicate a statistically significant decrease in government bond holdings and a statistically significant increase in investments in other assets when the Bank of Japan purchases government bonds.
6.13*** 0.46*** 1.35 -0.07 1.24***(1.46) (0.13) (1.08) (0.24) (0.45)
-0.06 -0.44*** -0.34*** 0.15** 0.13***(0.05) (0.05) (0.09) (0.07) (0.05)
-0.10*** 0.00 0.06 0.02*** 0.05***(0.02) (0.00) (0.04) (0.00) (0.02)
-0.02 -0.01*** 0.10*** 0.21*** 0.19***(0.03) (0.00) (0.01) (0.08) (0.06)
-0.75* 0.01 1.44*** -0.14 -0.18(0.45) (0.04) (0.31) (0.08) (0.17)
-0.63** -0.12*** -0.67*** -0.03 -0.21(0.25) (0.02) (0.24) (0.03) (0.15)
Sample period 1999/Q4-2013/Q4
Equities andmutual funds
Outwardinvestment
Constant
Lagged dependent variable
Government bond purchases by the Bank of Japan
Change in assets outstanding ineconomy overall
Equity yield spread(lagged one period)
Implied volatility of governmentbond futures (lagged one period)
Governmentbonds
Currency anddeposits
(excluding depositswith the BOJ)
Deposits withthe Bank of
JapanLoans
Corporatebonds
30
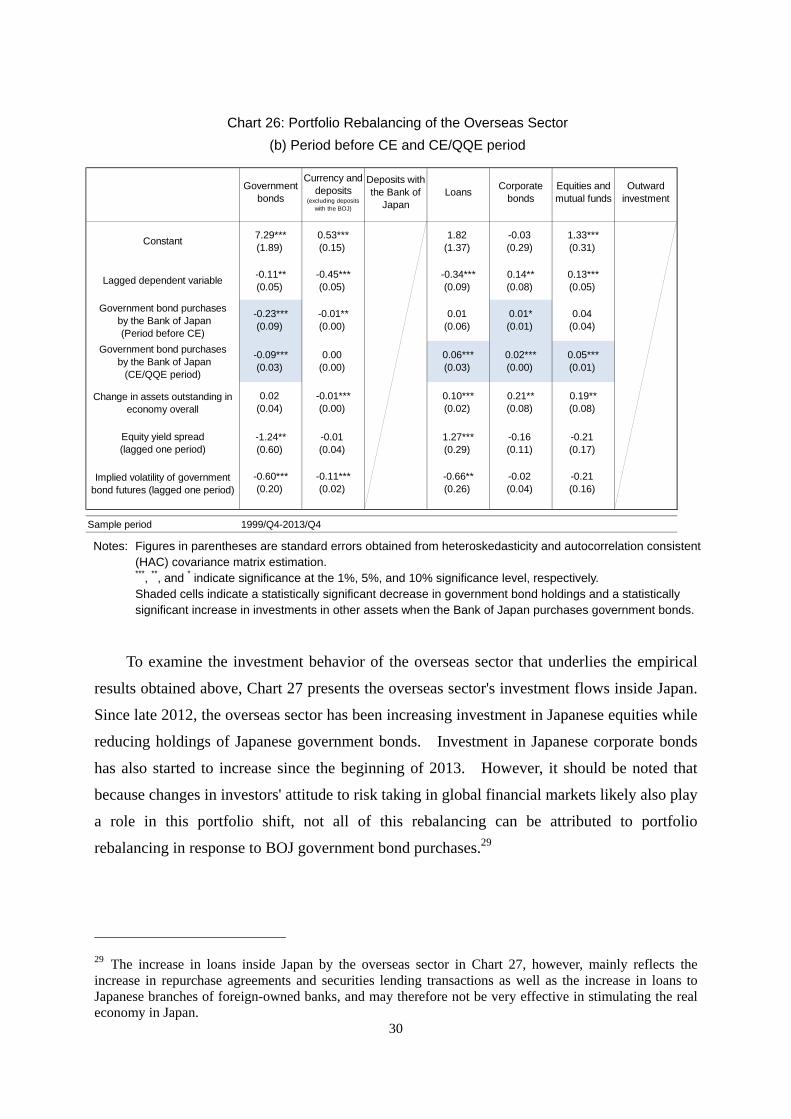
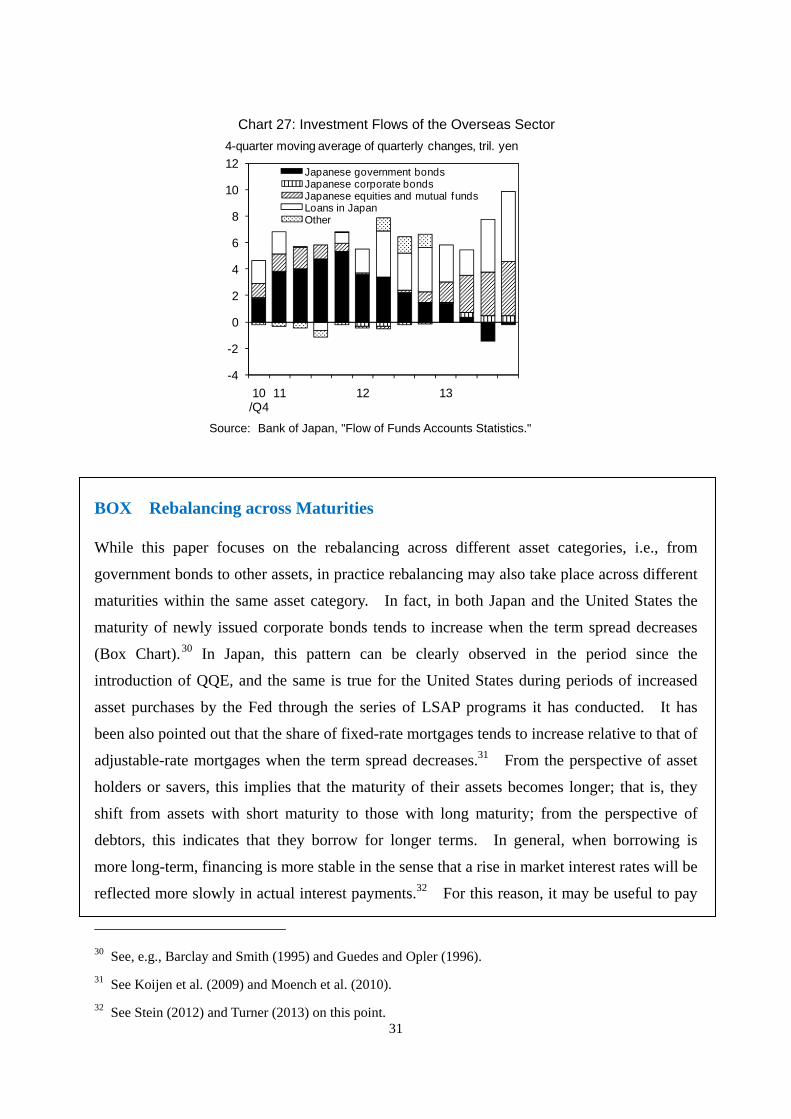
To examine the investment behavior of the overseas sector that underlies the empirical
results obtained above, Chart 27 presents the overseas sector's investment flows inside Japan.
Since late 2012, the overseas sector has been increasing investment in Japanese equities while
reducing holdings of Japanese government bonds. Investment in Japanese corporate bonds
has also started to increase since the beginning of 2013. However, it should be noted that
because changes in investors' attitude to risk taking in global financial markets likely also play
a role in this portfolio shift, not all of this rebalancing can be attributed to portfolio
rebalancing in response to BOJ government bond purchases.29
29 The increase in loans inside Japan by the overseas sector in Chart 27, however, mainly reflects the increase in repurchase agreements and securities lending transactions as well as the increase in loans to Japanese branches of foreign-owned banks, and may therefore not be very effective in stimulating the real economy in Japan.
Chart 26: Portfolio Rebalancing of the Overseas Sector
(b) Period before CE and CE/QQE period
Notes: Figures in parentheses are standard errors obtained from heteroskedasticity and autocorrelation consistent
(HAC) covariance matrix estimation. ***, **, and * indicate significance at the 1%, 5%, and 10% significance level, respectively. Shaded cells indicate a statistically significant decrease in government bond holdings and a statistically significant increase in investments in other assets when the Bank of Japan purchases government bonds.
7.29*** 0.53*** 1.82 -0.03 1.33***(1.89) (0.15) (1.37) (0.29) (0.31)
-0.11** -0.45*** -0.34*** 0.14** 0.13***(0.05) (0.05) (0.09) (0.08) (0.05)
-0.23*** -0.01** 0.01 0.01* 0.04(0.09) (0.00) (0.06) (0.01) (0.04)
-0.09*** 0.00 0.06*** 0.02*** 0.05***(0.03) (0.00) (0.03) (0.00) (0.01)
0.02 -0.01*** 0.10*** 0.21** 0.19**(0.04) (0.00) (0.02) (0.08) (0.08)
-1.24** -0.01 1.27*** -0.16 -0.21(0.60) (0.04) (0.29) (0.11) (0.17)
-0.60*** -0.11*** -0.66** -0.02 -0.21(0.20) (0.02) (0.26) (0.04) (0.16)
Sample period 1999/Q4-2013/Q4
Corporatebonds
Implied volatility of governmentbond futures (lagged one period)
Equities andmutual funds
Outwardinvestment
Constant
Lagged dependent variable
Government bond purchases by the Bank of Japan
(Period before CE)
Government bond purchases by the Bank of Japan
(CE/QQE period)
Change in assets outstanding ineconomy overall
Equity yield spread(lagged one period)
Governmentbonds
Currency anddeposits
(excluding depositswith the BOJ)
Deposits withthe Bank of
JapanLoans
31
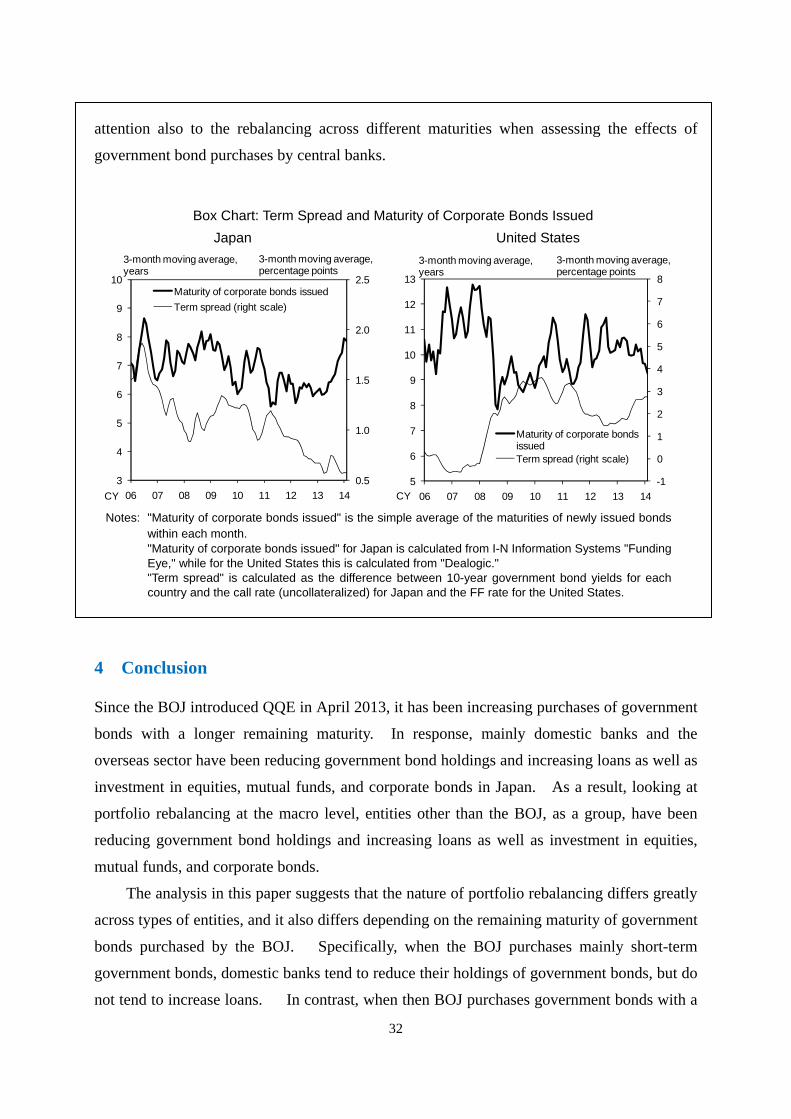
BOX Rebalancing across Maturities
While this paper focuses on the rebalancing across different asset categories, i.e., from
government bonds to other assets, in practice rebalancing may also take place across different
maturities within the same asset category. In fact, in both Japan and the United States the
maturity of newly issued corporate bonds tends to increase when the term spread decreases
(Box Chart).30 In Japan, this pattern can be clearly observed in the period since the
introduction of QQE, and the same is true for the United States during periods of increased
asset purchases by the Fed through the series of LSAP programs it has conducted. It has
been also pointed out that the share of fixed-rate mortgages tends to increase relative to that of
adjustable-rate mortgages when the term spread decreases.31 From the perspective of asset
holders or savers, this implies that the maturity of their assets becomes longer; that is, they
shift from assets with short maturity to those with long maturity; from the perspective of
debtors, this indicates that they borrow for longer terms. In general, when borrowing is
more long-term, financing is more stable in the sense that a rise in market interest rates will be
reflected more slowly in actual interest payments.32 For this reason, it may be useful to pay
30 See, e.g., Barclay and Smith (1995) and Guedes and Opler (1996).
31 See Koijen et al. (2009) and Moench et al. (2010).
32 See Stein (2012) and Turner (2013) on this point.
Chart 27: Investment Flows of the Overseas Sector
Source: Bank of Japan, "Flow of Funds Accounts Statistics."
-4
-2
0
2
4
6
8
10
12
10/Q4
11 12 13
Japanese government bondsJapanese corporate bondsJapanese equities and mutual fundsLoans in JapanOther
4-quarter moving average of quarterly changes, tril. yen
32
attention also to the rebalancing across different maturities when assessing the effects of
government bond purchases by central banks.
4 Conclusion
Since the BOJ introduced QQE in April 2013, it has been increasing purchases of government
bonds with a longer remaining maturity. In response, mainly domestic banks and the
overseas sector have been reducing government bond holdings and increasing loans as well as
investment in equities, mutual funds, and corporate bonds in Japan. As a result, looking at
portfolio rebalancing at the macro level, entities other than the BOJ, as a group, have been
reducing government bond holdings and increasing loans as well as investment in equities,
mutual funds, and corporate bonds.
The analysis in this paper suggests that the nature of portfolio rebalancing differs greatly
across types of entities, and it also differs depending on the remaining maturity of government
bonds purchased by the BOJ. Specifically, when the BOJ purchases mainly short-term
government bonds, domestic banks tend to reduce their holdings of government bonds, but do
not tend to increase loans. In contrast, when then BOJ purchases government bonds with a
Box Chart: Term Spread and Maturity of Corporate Bonds Issued
Japan United States
Notes: "Maturity of corporate bonds issued" is the simple average of the maturities of newly issued bonds
within each month. "Maturity of corporate bonds issued" for Japan is calculated from I-N Information Systems "Funding
Eye," while for the United States this is calculated from "Dealogic." "Term spread" is calculated as the difference between 10-year government bond yields for each
country and the call rate (uncollateralized) for Japan and the FF rate for the United States.
0.5
1.0
1.5
2.0
2.5
3
4
5
6
7
8
9
10
06 07 08 09 10 11 12 13 14
Maturity of corporate bonds issued
Term spread (right scale)
3-month moving average, years
3-month moving average, percentage points
CY
-1
0
1
2
3
4
5
6
7
8
5
6
7
8
9
10
11
12
13
06 07 08 09 10 11 12 13 14
Maturity of corporate bonds issuedTerm spread (right scale)
CY
3-month moving average,years
3-month moving average,percentage points
33
long remaining maturity, domestic banks tend to increase loans. Underlying this difference
appears to be the following mechanism. When domestic banks reduce their holdings of
long-term government bonds, the interest rate risk they hold decreases by a larger amount
than when they reduce their holdings of short-term government bonds. This means that they
are more likely to be able to take on additional risk by increasing loans. The overseas sector
also tends to reduce government bond holdings when the BOJ purchases government bonds as
a result of the decline in interest rates on government bonds, and tends to increase investment
in Japanese equities and corporate bonds during these periods. In contrast to these types of
entities, insurance companies and corporate pension funds so far have not tended to reduce
government bond holdings when the BOJ purchases government bonds.
There are several caveats that apply to the analysis in this paper. This paper attempted
to capture portfolio rebalancing that originates from the BOJ's government bond purchases.
Part of the results presented in this paper, however, may also capture portfolio rebalancing
arising from other sources. For example, factors such as an increase in inflation expectations,
an increase in expectations of a currency depreciation, and an expected increase in stock
prices may also lead investors to rebalance their portfolios from government bonds to other
assets. These changes in expectations may arise from the central bank's government bond
purchases, but may also arise from other factors such as an increase in the central bank's target
level of inflation.
Our analysis, which is based mainly on time series data, is susceptible to identification
problems. In particular, since the sample period after the introduction of QQE is not very
long, it is difficult to tell clearly whether the rebalancing behavior of a type of entity is caused
by the BOJ's monetary policy or by other factors. In future research, it would be desirable to
employ cross-sectional information in addition to time-series information to deal with this
identification problem.
Finally, we have seen that, so far, it is mainly domestic banks and the overseas sector that
have tended to reduce government bond holdings in response to the BOJ's purchases of
government bonds. If other types of entities start reducing their holdings of government
bonds, the nature of portfolio rebalancing may differ from what we have seen in the past.
34
References
Barclay, Michael and Clifford Smith, "The Maturity Structure of Corporate Debt," Journal of Finance, 1995.
Campbell, John and Luis Viceira, "Consumption and Portfolio Decisions when Expected Returns are Time Varying," Quarterly Journal of Economics, 1999.
Carpenter, Seth, Selva Demiralp, Jane Ihrig and Elizabeth Klee, "Analyzing Federal Reserve Asset Purchases: From Whom Does the Fed Buy?" Federal Reserve Board, April 2013.
Fratzscher, Marcel, Marco Lo Duca and Roland Straub, "On the International Spillovers of US Quantitative Easing," European Central Bank, June 2013.
Gagnon, Joseph, Matthew Raskin, Julie Remache and Brian Sack, "The Financial Market Effects of the Federal Reserve's Large-Scale Asset Purchases," International Journal of Central Banking, 2011.
Gilchrist, Simon, David Lopez-Salido and Egon Zakrajsek, "Monetary Policy and Real Borrowing Costs at the Zero Lower Bound," NBER Working Paper No. 20094, April 2014.
Guedes, Jose and Tim Opler, "The Determinants of the Maturity of Corporate Debt Issues," Journal of Finance, 1996.
Joyce, Michael, Ana Lasaosa, Ibrahim Stevens and Matthew Tong, "The Financial Market Impact of Quantitative Easing," International Journal of Central Banking, 2011.
Kimura, Takeshi and David Small, "Quantitative Monetary Easing and Risk in Financial Asset Markets," BE Journal in Macroeconomics, 2006.
Koijen, Ralph, Otto van Hemert and Stijn van Nieuwerburgh, "Mortgage Timing," Journal of Financial Economics, 2009.
Krishnamurthy, Arvind and Annette Vissing-Jorgensen, "The Effects of Quantitative Easing on Interest Rate: Channels and Implications for Policy," Brookings Papers on Economic Activity, 2011.
Moench, Emanuel, James Vickery and Diego Aragon, "Why is the Market Share of Adjustable Rate Mortgages So Low?" Federal Reserve Bank of New York, Current Issues in Economics and Finance, December 2010.
Saita, Yumi and Toshitaka Sekine, "Sectoral Credit Shifts in Japan: Causes and Consequences of their Decline in the 1990s," BOJ Research and Statistics Working Paper No. 01-16, November 2001.
Stein, Jeremy, "Evaluating Large-Scale Asset Purchases," Remarks at the Brookings Institution, October 11, 2012.
Turner, Philip, "Benign Neglect of the Long-Term Interest Rate," BIS Working Papers, February 2013.
Ugai, Hiroshi, "Effects of the Quantitative Easing Policy: A Survey of Empirical Analyses," Bank of Japan Monetary and Economic Studies, March 2007.
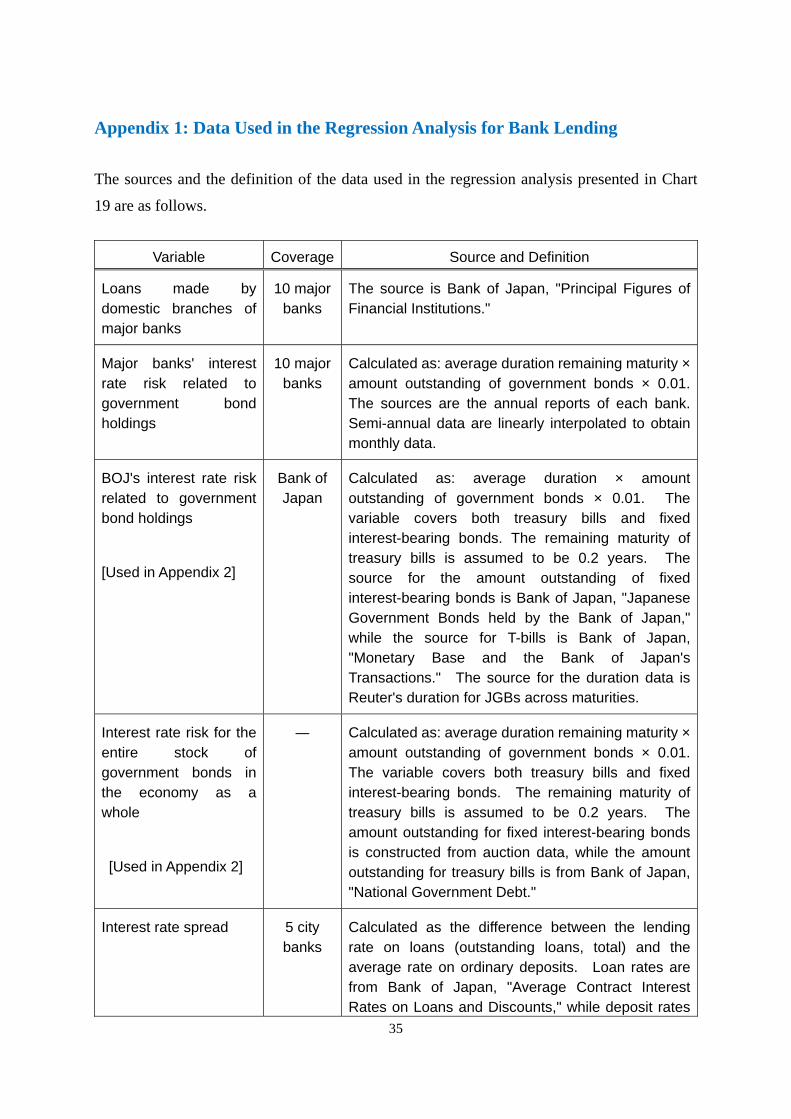
35
Appendix 1: Data Used in the Regression Analysis for Bank Lending
The sources and the definition of the data used in the regression analysis presented in Chart
19 are as follows.
Variable Coverage Source and Definition
Loans made by domestic branches of major banks
10 major banks
The source is Bank of Japan, "Principal Figures of Financial Institutions."
Major banks' interest rate risk related to government bond holdings
10 major banks
Calculated as: average duration remaining maturity × amount outstanding of government bonds × 0.01. The sources are the annual reports of each bank. Semi-annual data are linearly interpolated to obtain monthly data.
BOJ's interest rate risk related to government bond holdings
[Used in Appendix 2]
Bank of Japan
Calculated as: average duration × amount outstanding of government bonds × 0.01. The variable covers both treasury bills and fixed interest-bearing bonds. The remaining maturity of treasury bills is assumed to be 0.2 years. The source for the amount outstanding of fixed interest-bearing bonds is Bank of Japan, "Japanese Government Bonds held by the Bank of Japan," while the source for T-bills is Bank of Japan, "Monetary Base and the Bank of Japan's Transactions." The source for the duration data is Reuter's duration for JGBs across maturities.
Interest rate risk for the entire stock of government bonds in the economy as a whole
[Used in Appendix 2]
― Calculated as: average duration remaining maturity × amount outstanding of government bonds × 0.01. The variable covers both treasury bills and fixed interest-bearing bonds. The remaining maturity of treasury bills is assumed to be 0.2 years. The amount outstanding for fixed interest-bearing bonds is constructed from auction data, while the amount outstanding for treasury bills is from Bank of Japan, "National Government Debt."
Interest rate spread 5 city banks
Calculated as the difference between the lending rate on loans (outstanding loans, total) and the average rate on ordinary deposits. Loan rates are from Bank of Japan, "Average Contract Interest Rates on Loans and Discounts," while deposit rates
36
are from Bank of Japan, "Average Interest Rates Posted at Financial Institutions by Type of Deposit."
Diffusion index for loan demand of large nonfinancial firms
Domestic banks
The source is Bank of Japan, "Senior Loan Officer Opinion Survey on Bank Lending Practices at Large Japanese Banks." The D.I. is calculated as: (percentage of respondents selecting "substantially stronger" + percentage of respondents selecting "moderately stronger" × 0.5) - (percentage of respondents selecting "substantially weaker" + percentage of respondents selecting "moderately weaker" × 0.5). Quarterly data are linearly interpolated to obtain monthly data.
Nonperforming loan ratio
5 city banks,
3 trust banks
The data are obtained from Financial Services Agency. Semi-annual data are linearly interpolated to obtain monthly data.
5 city banks: Bank of Tokyo-Mitsubishi UFJ, Mizuho Bank, Sumitomo Mitsui Banking Corporation, Resona Bank, and Saitama Resona Bank
3 trust banks: Mitsubishi UFJ Trust and Banking Corporation, Mizuho Trust and Banking Company, and Sumitomo Mitsui Trust Bank
10 major banks: 5 city banks, 3 trust banks, Shinsei Bank, and Aozora Bank
Taking a brief look at the behavior of each variable over the sample period, major banks'
interest rate risk related to government bond holdings decreased significantly since early 2013
when QQE was introduced (Appendix Chart 1). The amount of interest rate risk for the BOJ
related to government bond holdings increased during the same period, since the BOJ
substantially increased purchases of government bonds with long remaining maturity.33 The
interest rate spread has been on a declining trend in recent years. The nonperforming loan
ratio fell by a large amount in the first half of the 2000s (not shown in the Chart) and has been
more or less flat since the mid-2000s.
33 Appendix Chart 1(c) shows the amount of interest rate risk related to government bond holdings for the economy as a whole. This has been steadily increasing as the amount outstanding of government bonds has increased and the maturity of newly issued government bonds has become longer.
37
Appendix Chart 1: Variables Used in the Estimation for Bank Lending
-6
-4
-2
0
2
4
6
06 07 08 09 10 11 12 13CY1.5
3.0
4.5
6.0
7.5
06 07 08 09 10 11 12 13
Major banks
Bank of Japan
CY
0
10
20
30
40
50
60
06 07 08 09 10 11 12 13CY
0.5
1.0
1.5
2.0
06 07 08 09 10 11 12 13CY
-20
0
20
40
60
06 07 08 09 10 11 12 13CY1.0
1.5
2.0
2.5
06 07 08 09 10 11 12 13
(f) Nonperforming Loan Ratio
%
CY
(c) Interest Rate Risk for the Entire Stock of Government Bonds in the Economy as a WholeTril. yen
(d) Interest Rate Spread
Percentage points
(e) Diffusion Index for Loan Demand of LargeNonfinancial FirmsPercentage points
(a) Loans Made by Domesic Branchesof Major Banksy/y % change
(b) Interest Rate Risk Related to Government Bond HoldingsTril. yen
38
Appendix 2: Robustness Check for the Regression Analysis on Bank Lending
The results in Chart 19 in Section 3 suggested that a reduction in major banks' interest rate
risk related to government bond holdings has a negative and statistically significant impact on
bank lending. However, the specification used in that analysis may suffer from endogeneity.
Specifically, the specification used for the analysis in Chart 19 assumes that major banks'
interest rate risk has a causal impact on bank lending. Causality, however, may run in the
other direction; that is, major banks' lending decisions may affect their decisions regarding
government bond holdings. If this is the case, one of the explanatory variables -- the interest
rate risk for major banks -- and the error term in the regression equation are negatively
correlated and the estimated parameters may be biased as a result.
In this appendix, we employ a different estimation that explicitly takes the potential
endogeneity into account and show that the results presented in Section 3 are robust.
Specifically, we conduct the following two-step instrumental variable estimation. In the first
step, we regress major banks' interest rate risk related to government holdings on the BOJ's
interest rate risk related to government bond holdings, the interest rate risk for the entire stock
of government bonds in the economy, and the three explanatory variables in the original
specification (the interest rate spread, the diffusion index for loan demand of large
nonfinancial firms, and the nonperforming loan ratio).34 Among these variables, we expect
both the BOJ's interest rate risk and the total interest rate risk for the economy as a whole to
be correlated with major banks' interest rate risk;35 at the same time, we expect that neither of
these two variables directly influence bank lending, i.e., neither of these two variables affects
bank lending independently of major banks' interest rate risk. Thus, these two variables
likely are good instruments for major banks' interest rate risk.
Appendix Chart 2 reports the estimation results for the first step. They suggest that
major banks' amount of interest rate risk is negatively correlated with the BOJ's interest rate
risk. They further suggest that major banks' interest rate risk is positively correlated with the
34 See Appendix 1 for the calculation of the BOJ’s interest rate risk related to government bond holdings and for the calculation of the interest rate risk for the entire stock of government bonds in the economy.
35 The correlation is expected to arise for the following reasons. First, when major banks reduce government bond holdings during a time of government bond purchases by the BOJ, major banks' interest rate risk will be negatively correlated with the BOJ's interest rate risk. Second, when additional government bonds are issued, interest rate risk in the economy as a whole increases; moreover, major banks are likely to purchase part of these additional government bonds, raising their interest rate risk, so that interest rate risk for the economy as a whole and major banks' interest rate risk are likely to be positively correlated.
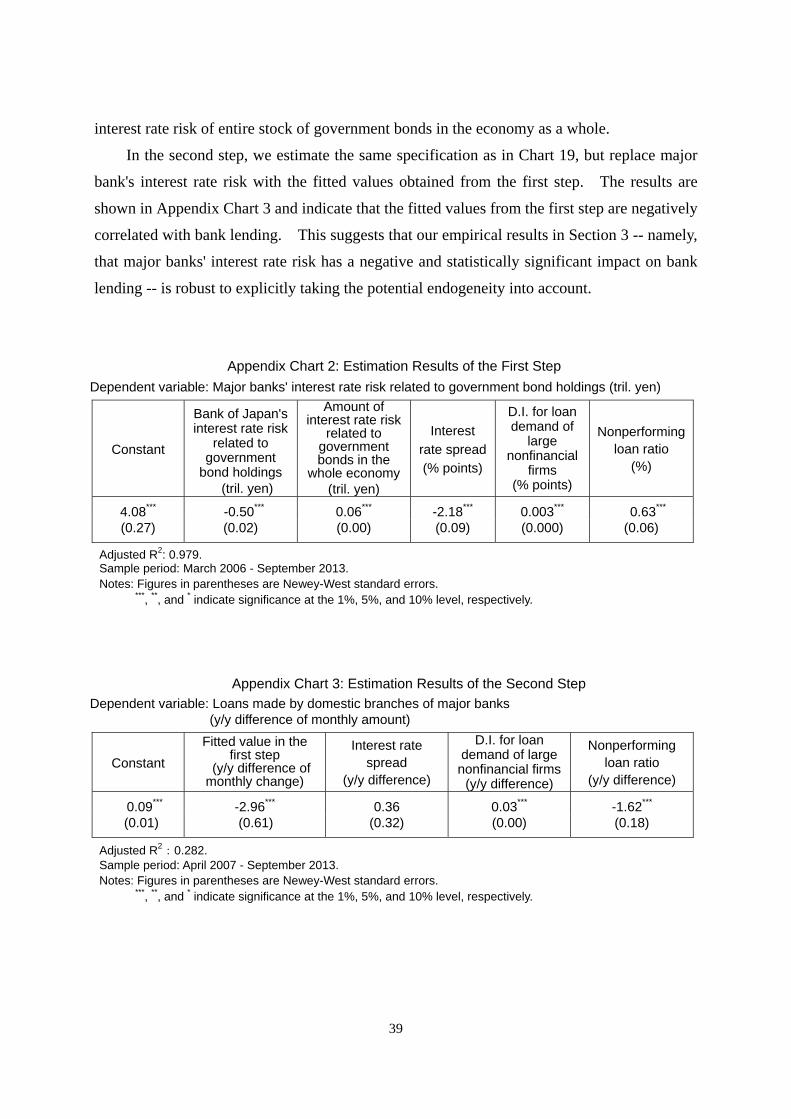
39
interest rate risk of entire stock of government bonds in the economy as a whole.
In the second step, we estimate the same specification as in Chart 19, but replace major
bank's interest rate risk with the fitted values obtained from the first step. The results are
shown in Appendix Chart 3 and indicate that the fitted values from the first step are negatively
correlated with bank lending. This suggests that our empirical results in Section 3 -- namely,
that major banks' interest rate risk has a negative and statistically significant impact on bank
lending -- is robust to explicitly taking the potential endogeneity into account.
Appendix Chart 2: Estimation Results of the First Step Dependent variable: Major banks' interest rate risk related to government bond holdings (tril. yen)
Constant
Bank of Japan's interest rate risk
related to government
bond holdings (tril. yen)
Amount of interest rate risk
related to government bonds in the
whole economy(tril. yen)
Interest
rate spread(% points)
D.I. for loan demand of
large nonfinancial
firms (% points)
Nonperforming loan ratio
(%)
4.08*** -0.50*** 0.06*** -2.18*** 0.003*** 0.63*** (0.27) (0.02) (0.00) (0.09) (0.000) (0.06)
Adjusted R2: 0.979. Sample period: March 2006 - September 2013. Notes: Figures in parentheses are Newey-West standard errors.
***, **, and * indicate significance at the 1%, 5%, and 10% level, respectively.
Appendix Chart 3: Estimation Results of the Second Step Dependent variable: Loans made by domestic branches of major banks (y/y difference of monthly amount)
Constant
Fitted value in the first step
(y/y difference of monthly change)
Interest rate spread
(y/y difference)
D.I. for loan demand of large nonfinancial firms
(y/y difference)
Nonperforming loan ratio
(y/y difference)
0.09*** -2.96*** 0.36 0.03*** -1.62*** (0.01) (0.61) (0.32) (0.00) (0.18)
Adjusted R2:0.282.
Sample period: April 2007 - September 2013. Notes: Figures in parentheses are Newey-West standard errors.
***, **, and * indicate significance at the 1%, 5%, and 10% level, respectively.