Embed Size (px)
Citation preview

GIOA Pre-ConferenceSeptember 8, 2021
1
PORTFOLIO STRATEGY FROM THE INSIDE OUT
Hubie White, CFAChief Investment OfficerCity and County of San [email protected]
Jason Klinghoffer, CFADirector, Debt Capital MarketsMischler Financial [email protected]
“Strategy is style of thinking, a conscious and deliberate process, an intensive implementation system, the science of insuring future success.” Pete Johnson
CASH FLOW MANAGEMENT TECHNIQUES
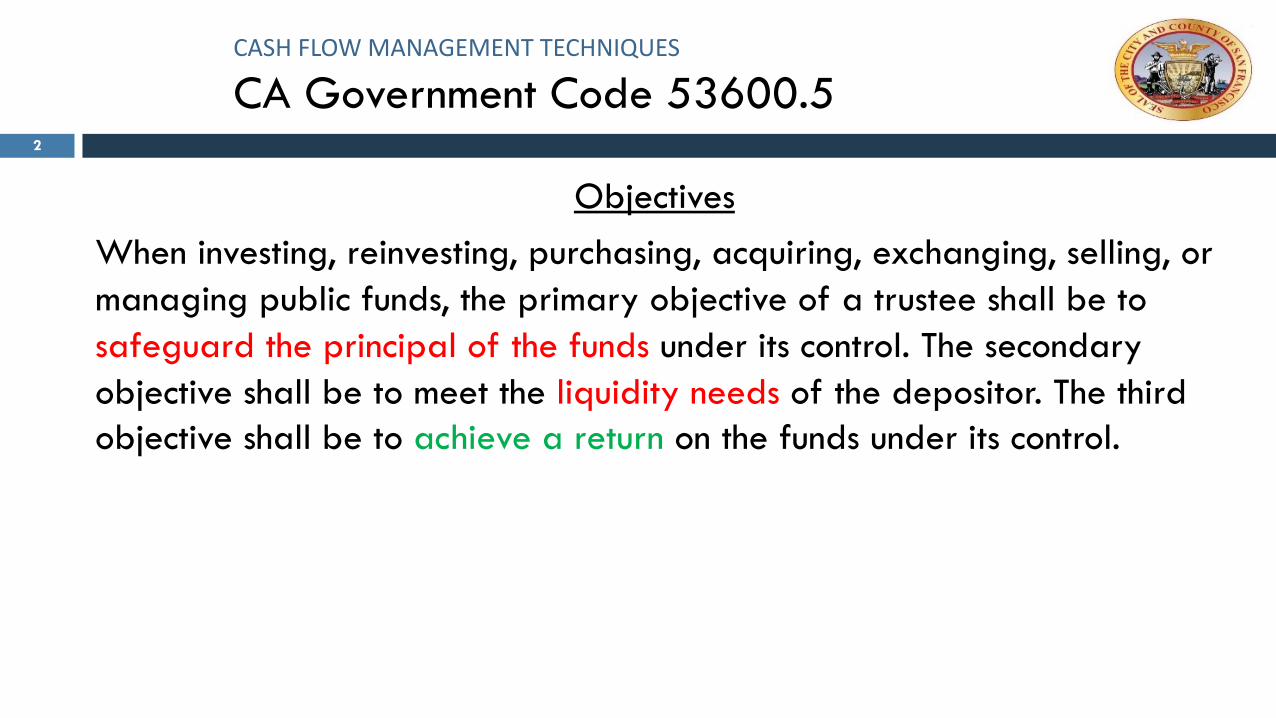
CA Government Code 53600.5
Objectives When investing, reinvesting, purchasing, acquiring, exchanging, selling, or managing public funds, the primary objective of a trustee shall be to safeguard the principal of the funds under its control. The secondary objective shall be to meet the liquidity needs of the depositor. The third objective shall be to achieve a return on the funds under its control.
2
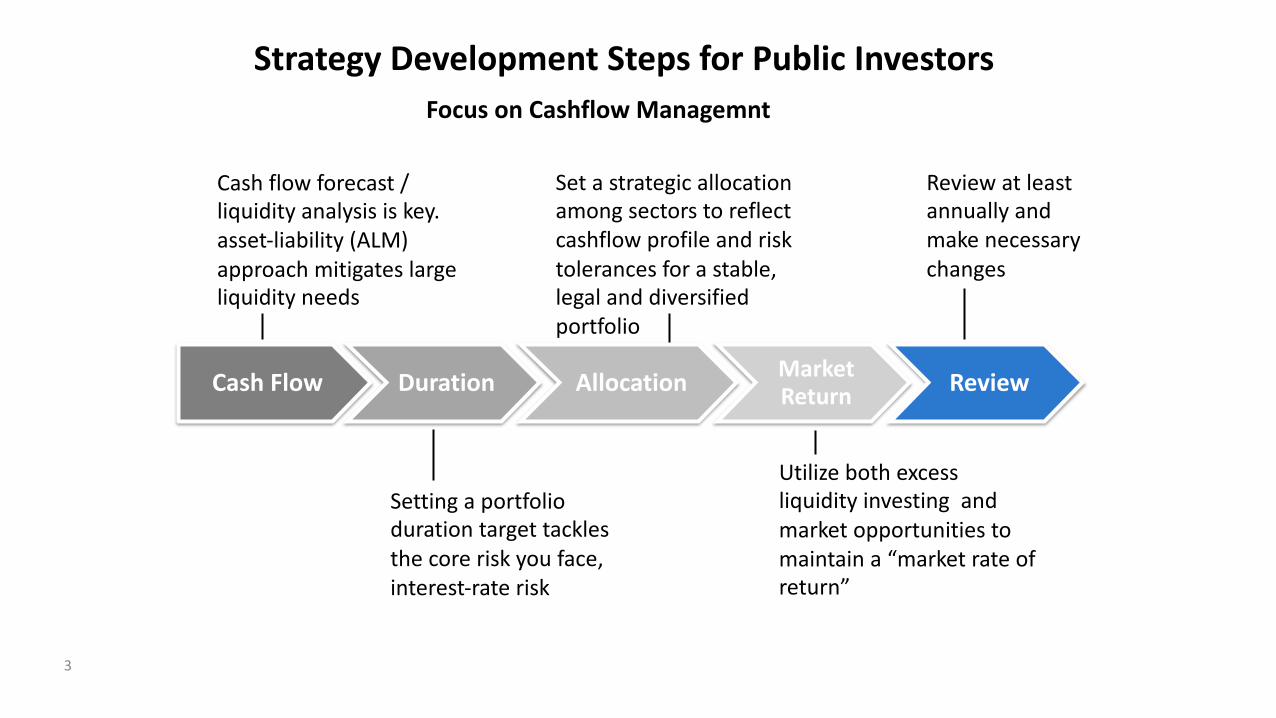
Strategy Development Steps for Public InvestorsFocus on Cashflow Managemnt
3
Cash flow forecast / liquidity analysis is key. asset-liability (ALM) approach mitigates large liquidity needs
Set a strategic allocation among sectors to reflect cashflow profile and risk tolerances for a stable, legal and diversified portfolio
Review at least annually and make necessary changes
Setting a portfolio duration target tackles the core risk you face, interest-rate risk
Utilize both excess liquidity investing and market opportunities to maintain a “market rate of return”
Cash Flow Duration Allocation Market Return Review
4
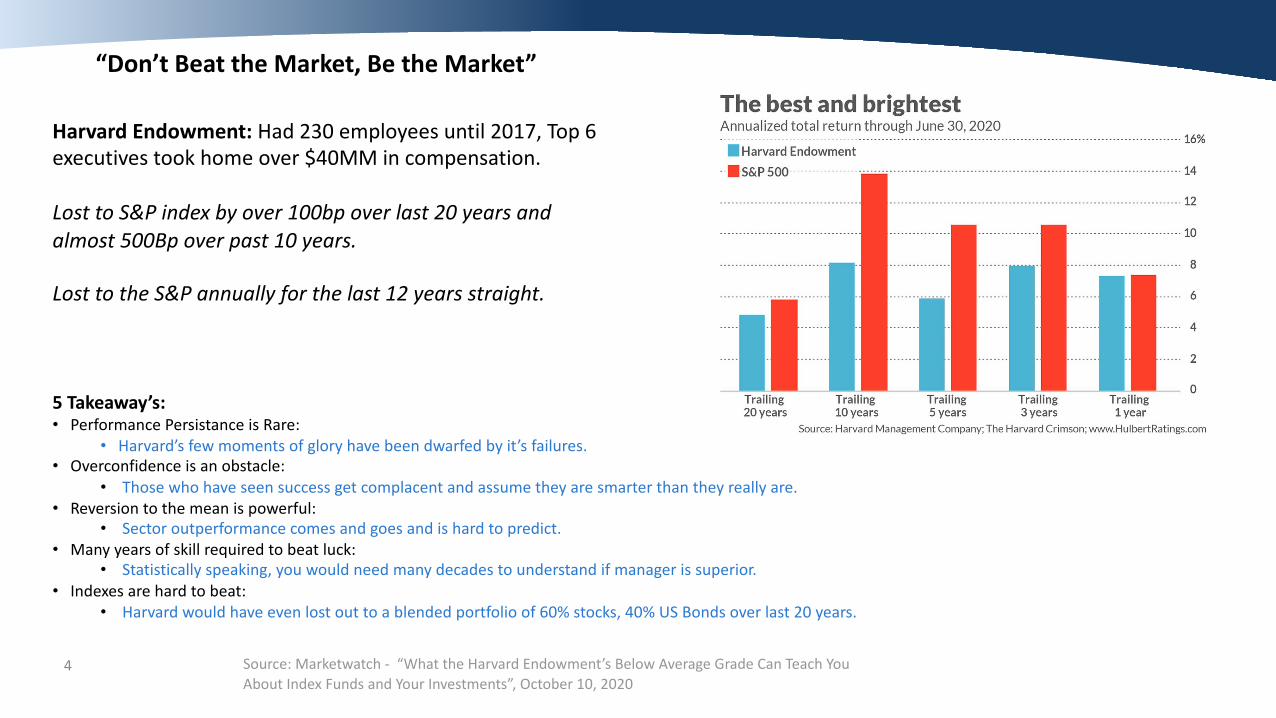
“Don’t Beat the Market, Be the Market”
Harvard Endowment: Had 230 employees until 2017, Top 6 executives took home over $40MM in compensation.
Lost to S&P index by over 100bp over last 20 years and almost 500Bp over past 10 years.
Lost to the S&P annually for the last 12 years straight.
5 Takeaway’s:• Performance Persistance is Rare:
• Harvard’s few moments of glory have been dwarfed by it’s failures.• Overconfidence is an obstacle:
• Those who have seen success get complacent and assume they are smarter than they really are. • Reversion to the mean is powerful:
• Sector outperformance comes and goes and is hard to predict.• Many years of skill required to beat luck:
• Statistically speaking, you would need many decades to understand if manager is superior.• Indexes are hard to beat:
• Harvard would have even lost out to a blended portfolio of 60% stocks, 40% US Bonds over last 20 years.
Source: Marketwatch - “What the Harvard Endowment’s Below Average Grade Can Teach YouAbout Index Funds and Your Investments”, October 10, 2020
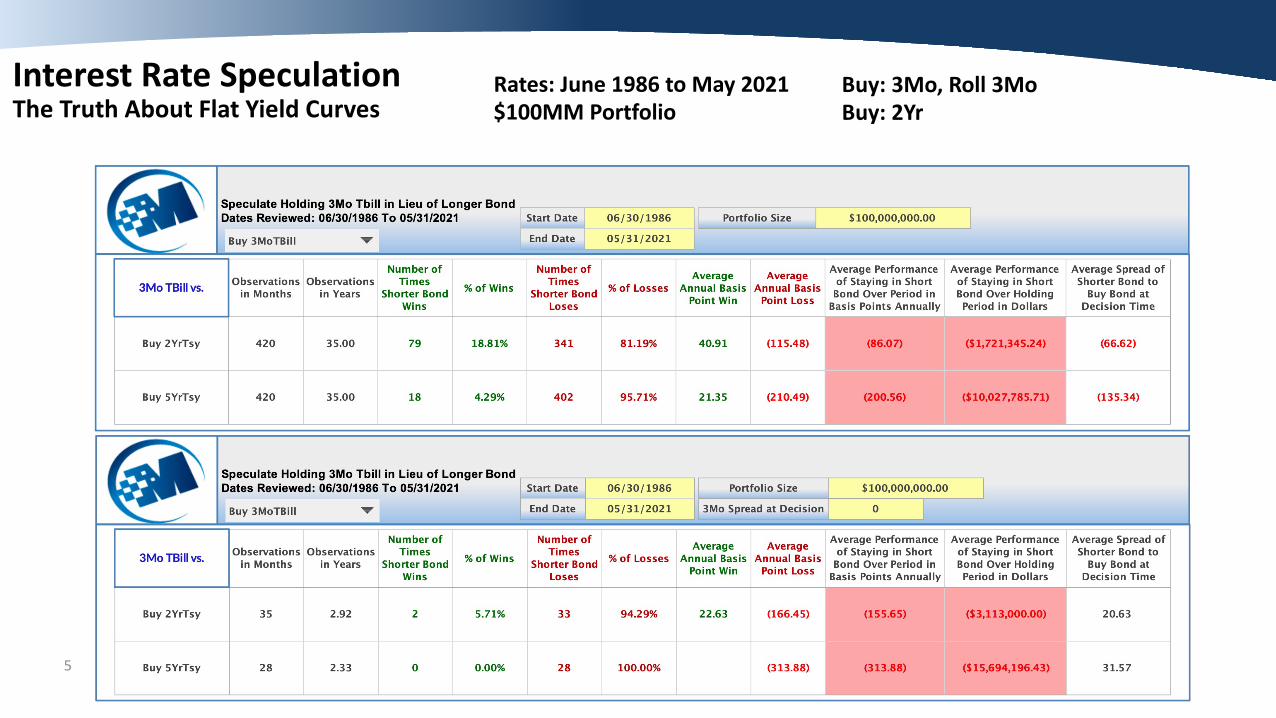
The Truth About Flat Yield Curves
5
Interest Rate Speculation Rates: June 1986 to May 2021$100MM Portfolio
Buy: 3Mo, Roll 3MoBuy: 2Yr
6
Can’t Beat the Market, So Now What?
• Public entities generally exhibit predictive cash flows in both magnitude and timing.
• This allows public funds to create duration optimized (interest rate risk centric) allocations.
• Allocations should reflect the legal guidance of the investment policy and the desired weights of allowable sectors based on risk/reward and ALM preferences.
• Portfolio construction: Safety (IR Risk, credit), liquidity, diversified, legal, market rate of return.
7
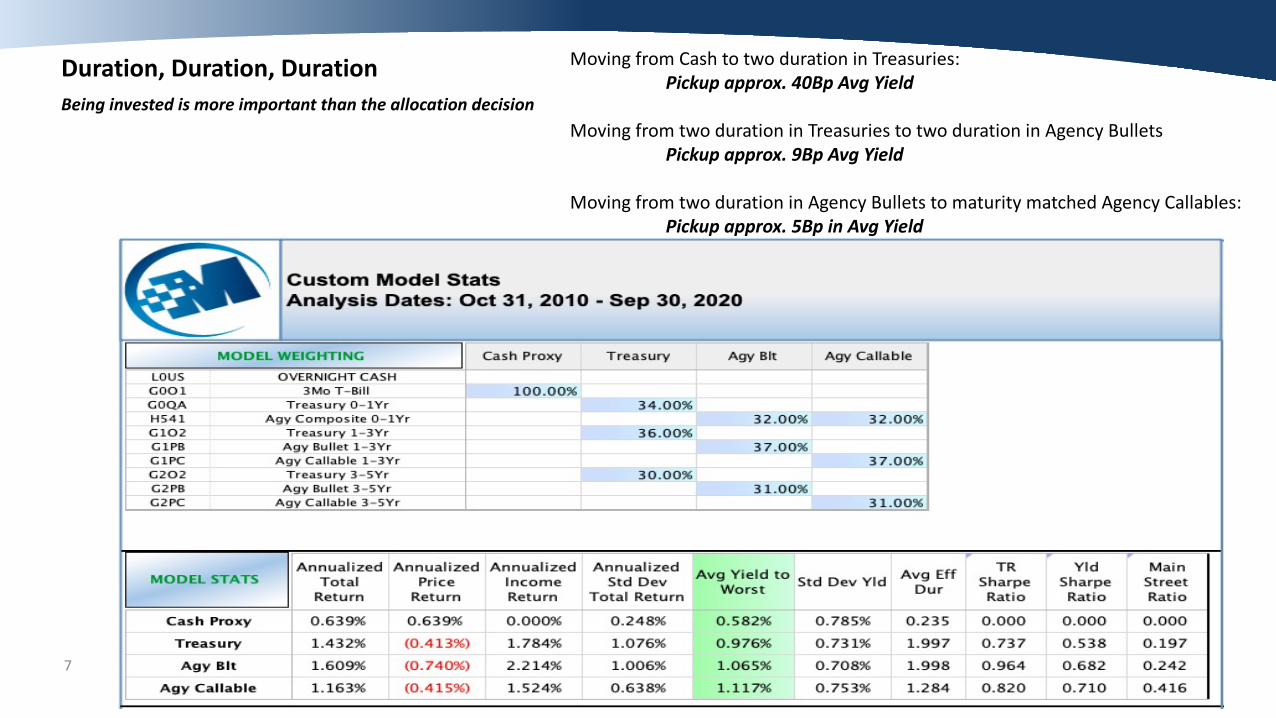
Duration, Duration, DurationBeing invested is more important than the allocation decision
Moving from Cash to two duration in Treasuries:Pickup approx. 40Bp Avg Yield
Moving from two duration in Treasuries to two duration in Agency BulletsPickup approx. 9Bp Avg Yield
Moving from two duration in Agency Bullets to maturity matched Agency Callables:Pickup approx. 5Bp in Avg Yield
8
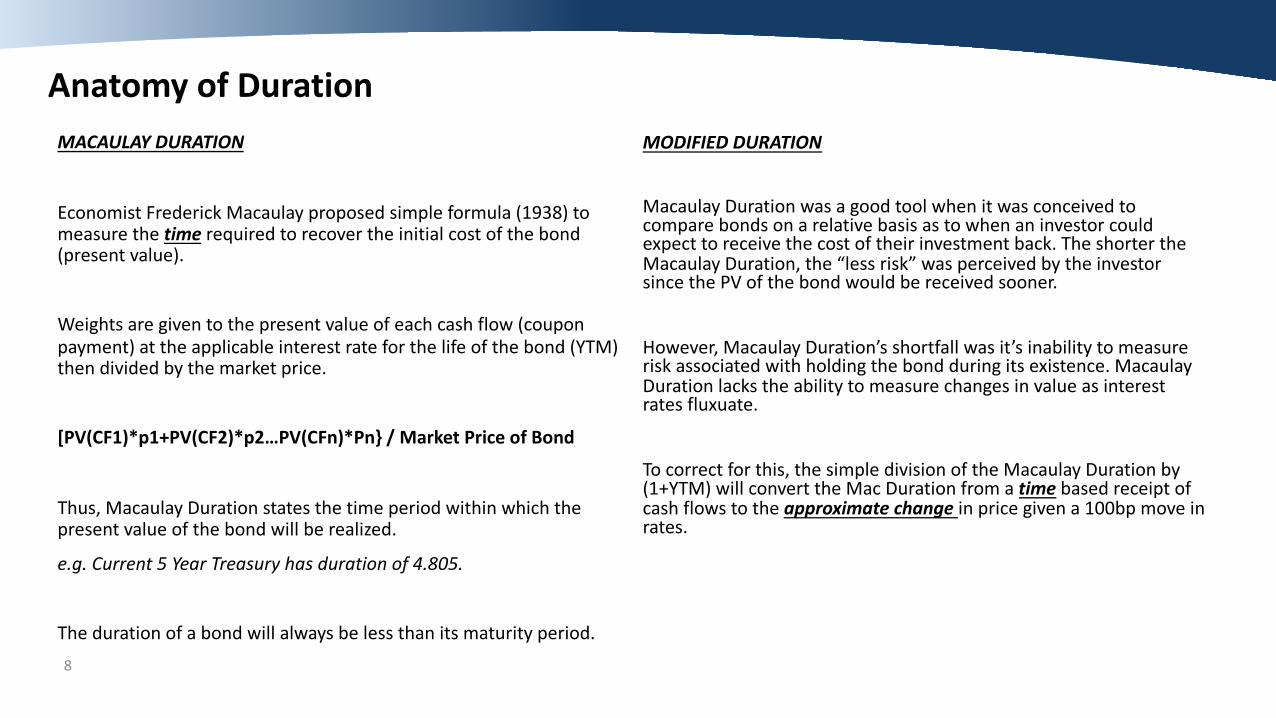
Anatomy of DurationMACAULAY DURATION
Economist Frederick Macaulay proposed simple formula (1938) to measure the time required to recover the initial cost of the bond (present value).
Weights are given to the present value of each cash flow (coupon payment) at the applicable interest rate for the life of the bond (YTM) then divided by the market price.
[PV(CF1)*p1+PV(CF2)*p2…PV(CFn)*Pn} / Market Price of Bond
Thus, Macaulay Duration states the time period within which the present value of the bond will be realized.
e.g. Current 5 Year Treasury has duration of 4.805.
The duration of a bond will always be less than its maturity period.
MODIFIED DURATION
Macaulay Duration was a good tool when it was conceived to compare bonds on a relative basis as to when an investor could expect to receive the cost of their investment back. The shorter the Macaulay Duration, the “less risk” was perceived by the investor since the PV of the bond would be received sooner.
However, Macaulay Duration’s shortfall was it’s inability to measure risk associated with holding the bond during its existence. Macaulay Duration lacks the ability to measure changes in value as interest rates fluxuate.
To correct for this, the simple division of the Macaulay Duration by (1+YTM) will convert the Mac Duration from a time based receipt of cash flows to the approximate change in price given a 100bp move in rates.
9
Why Do We Care?
• We know modified duration measures the approximate change in value for a 100bp change in interest rates.
• Because Modified Duration has Macaulay Duration as an input, we know that TVM (time value of money) principles apply.
• Thus, we can show that in normal markets over long periods of time, the more duration we take on (risk), the more return we can achieve
• Since earning a Market Rate of Return is a core objective (albeit a lower priority one), maximizing duration given safety and liquidity are taken care of is important. It will be the coredeterminant of how much income/return can be derived from the portfolio.
• Sector and structure profile is of secondary importance to duration.
10
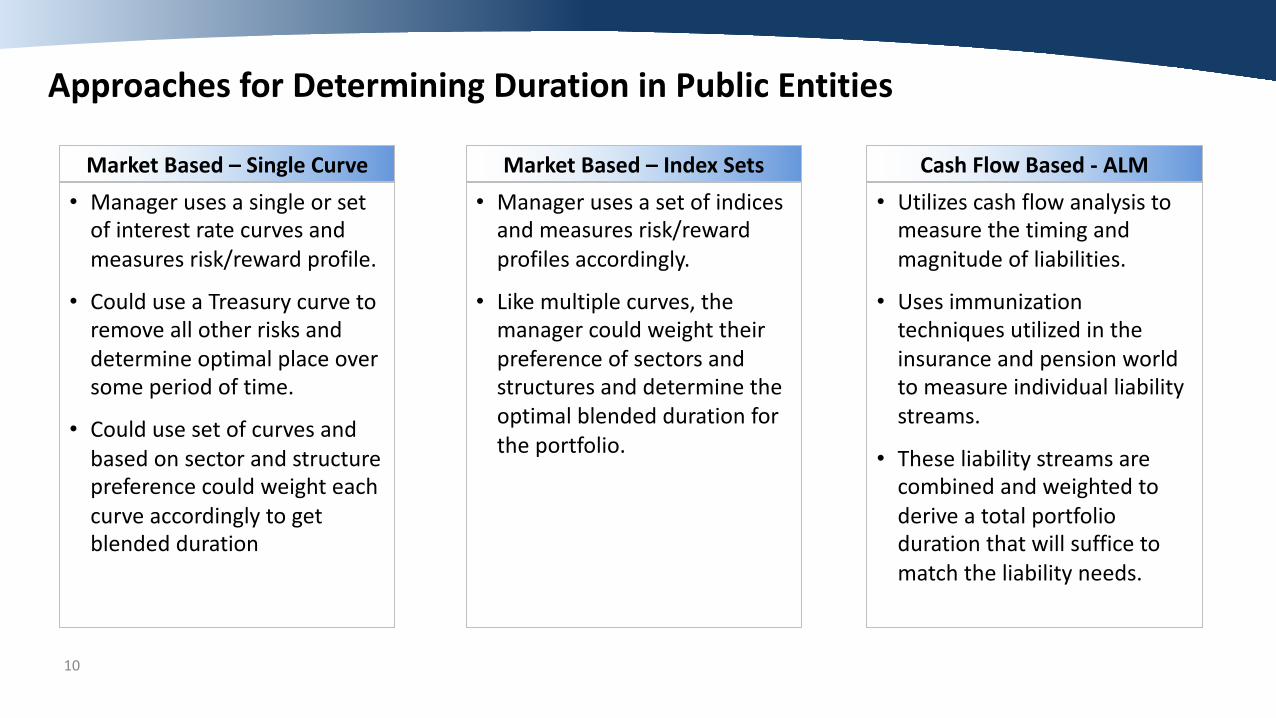
Approaches for Determining Duration in Public Entities
Market Based – Single Curve• Manager uses a single or set
of interest rate curves and measures risk/reward profile.
• Could use a Treasury curve to remove all other risks and determine optimal place over some period of time.
• Could use set of curves and based on sector and structure preference could weight each curve accordingly to get blended duration
Market Based – Index Sets• Manager uses a set of indices
and measures risk/reward profiles accordingly.
• Like multiple curves, the manager could weight their preference of sectors and structures and determine the optimal blended duration for the portfolio.
Cash Flow Based - ALM• Utilizes cash flow analysis to
measure the timing and magnitude of liabilities.
• Uses immunization techniques utilized in the insurance and pension world to measure individual liability streams.
• These liability streams are combined and weighted to derive a total portfolio duration that will suffice to match the liability needs.
11
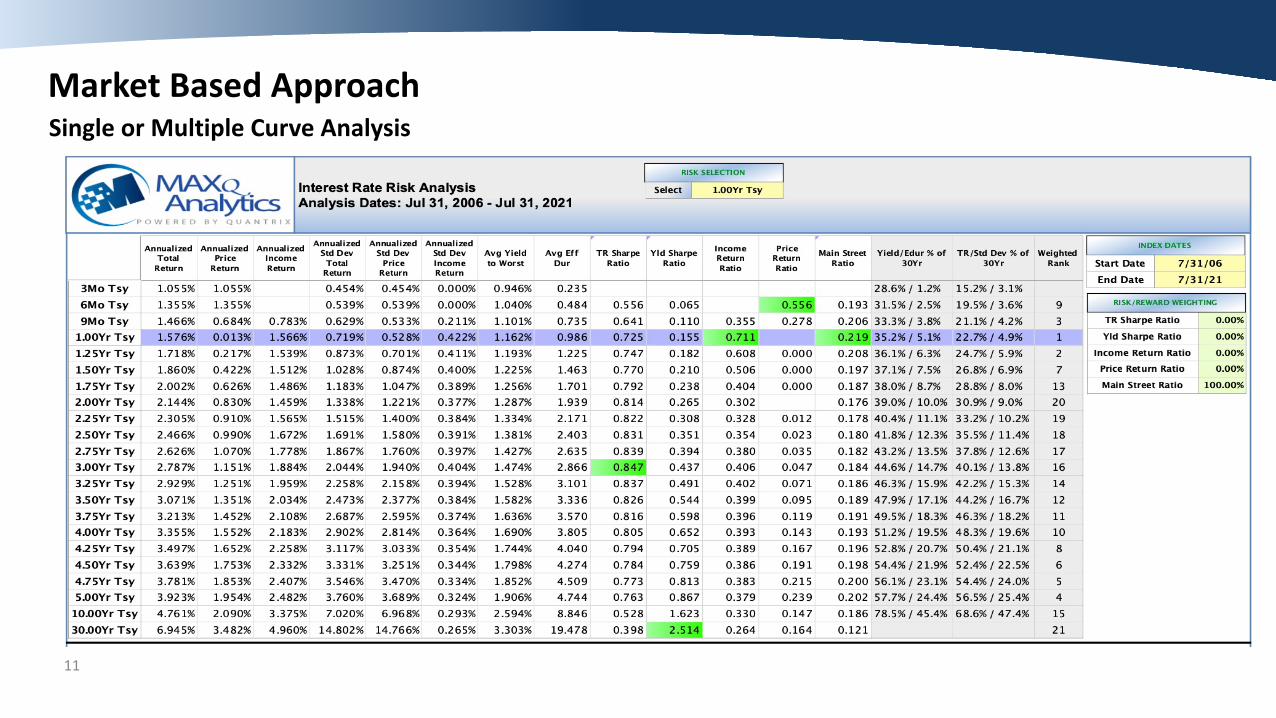
Market Based ApproachSingle or Multiple Curve Analysis
12
Market Based ApproachSingle or Multiple Curve Analysis
• Uses simple methodology by utilizing a single or multiple curves that are easily accessible.
• Risk/Reward is measured through principles like the Sharpe Ratio or a duration modified Sharpe Ratio and are relatively simple calculations.
• Does not capture true portfolio exposure (single curve used to measure duration, but portfolio is allocated across different sectors).
• Multiple curve approach requires sector allocation desires before duration established (chicken vs. egg).
• Mean-Variance Analysis possible, but requires sophistication and still optimizes market-based volatility to expected returns.
• Does not account for liabilities or cash flow needs of portfolio.
13
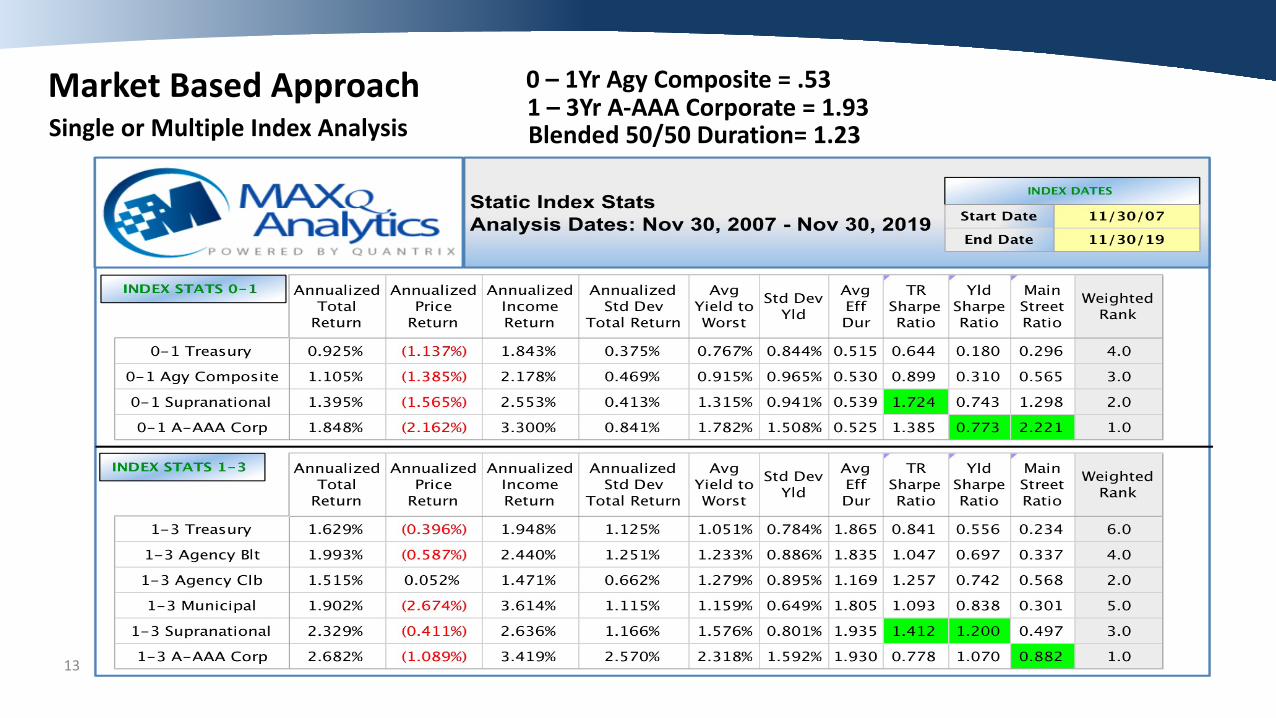
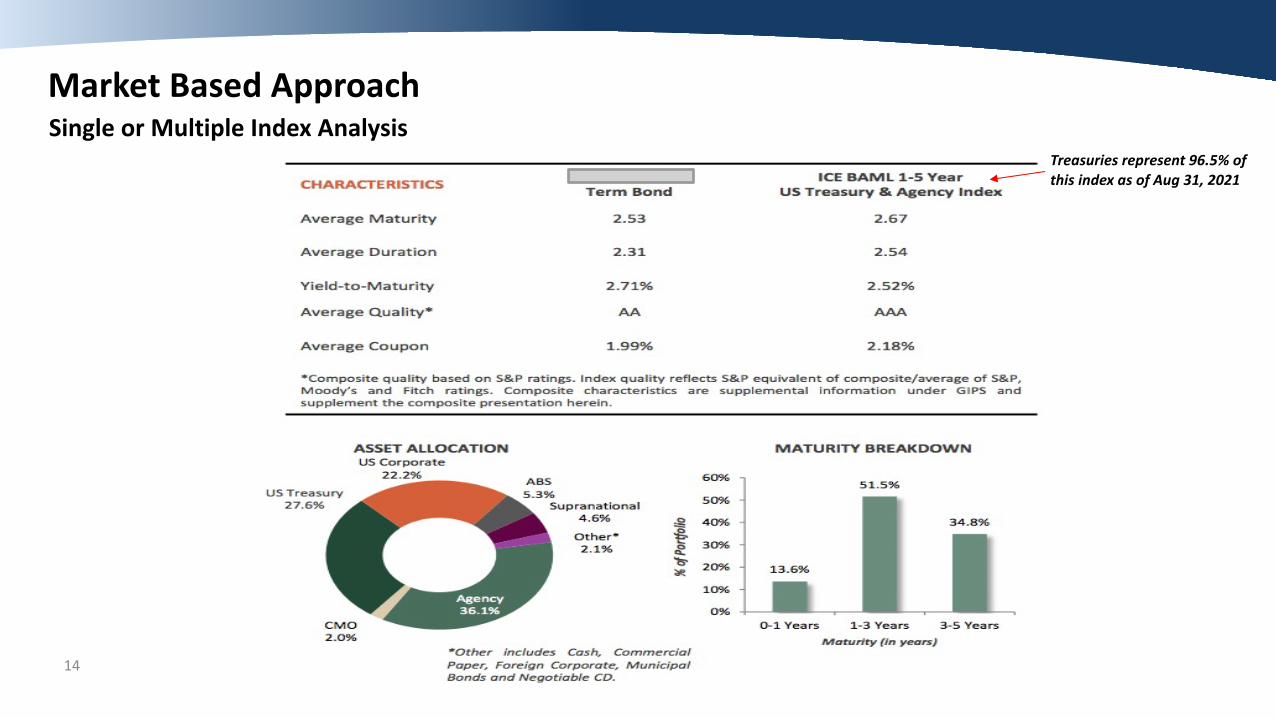
Market Based ApproachSingle or Multiple Index Analysis
0 – 1Yr Agy Composite = .531 – 3Yr A-AAA Corporate = 1.93Blended 50/50 Duration= 1.23
14
Market Based ApproachSingle or Multiple Index Analysis
Treasuries represent 96.5% of this index as of Aug 31, 2021
15
Market Based ApproachSingle or Multiple Index Analysis
• Again uses simple methodology by utilizing a single or multiple indices that are easily accessible.
• Risk/Reward is measured through principles like the Sharpe Ratio or a duration modified Sharpe Ratio and are relatively simple calculations.
• Single Indices like the ICE BofAML 1-5 Tsy / Agy can be heavily weighted in one sector.
• Does not capture liquidity needs or actual allocation exposure of your portfolio (unless several indices are used with actual exposure weights).
• Multiple index approach requires sector allocation desires before duration established (chicken vs. egg)
• Does not account for liabilities or cash flow needs of portfolio.
16
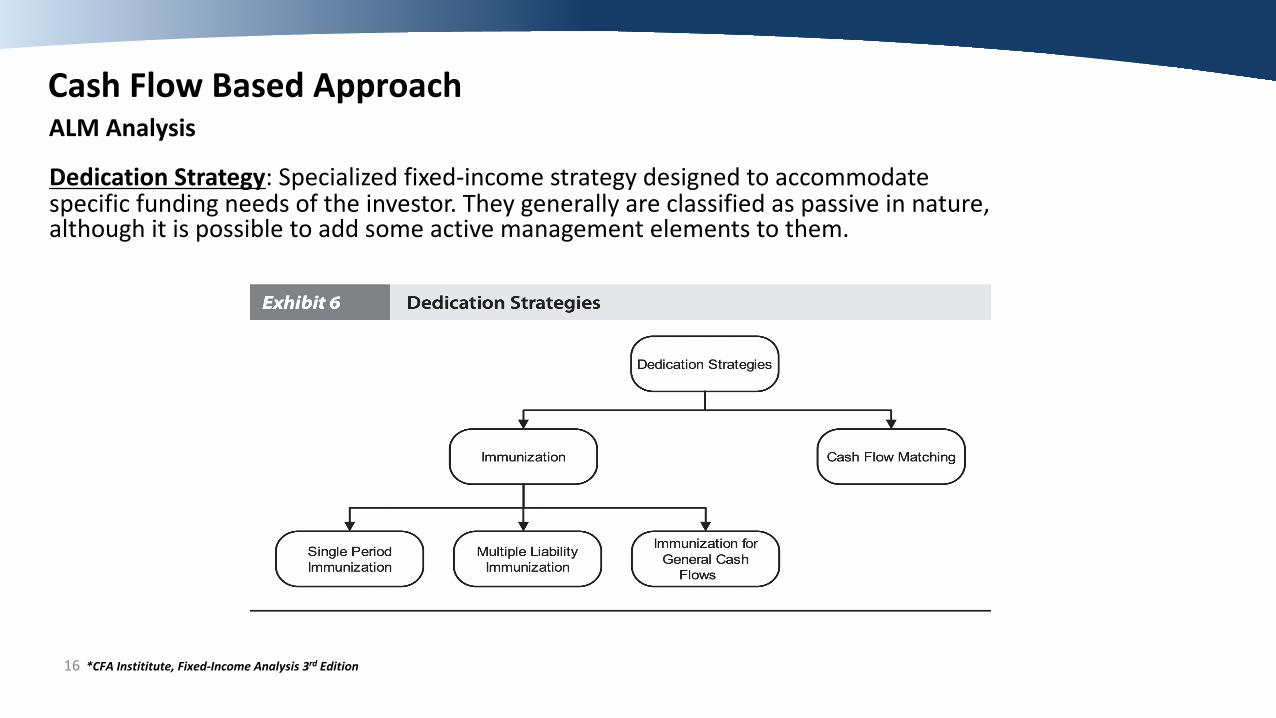
Cash Flow Based ApproachALM Analysis
Dedication Strategy: Specialized fixed-income strategy designed to accommodate specific funding needs of the investor. They generally are classified as passive in nature, although it is possible to add some active management elements to them.
*CFA Instititute, Fixed-Income Analysis 3rd Edition
17
Cash Flow Based ApproachALM Analysis
Immunization: Aims to construct a portfolio that, over a specified horizon, will earn a predetermined return regardless of interest rate changes (duration focused). An increase in rates and the corresponding drop in investment value partially offset by an increase in re-investment rates (and vice-versa).
*CFA Instititute, Fixed-Income Analysis 3rd Edition
Cash Flow Matching: Provides the future funding of a liability stream from the coupon and matured principal payments of the portfolio (not duration focused). A simple accumulation of the coupon, reinvestment return and value at horizon will offset liability in full.
Neither strategy perfectly fits public treasury as public entities must focus on Duration as a primary risk metric and typically spend coupons as anticipated by their budget.
18
Cash Flow Based ApproachALM Analysis
Combination Matching (also called horizon matching): Popular variation of multiple immunization and cash flow matching to fund liabilities by combining the two strategies. A portfolio is created that is duration-matched with the added constraint that it be cash flow-matched in the first few years, usually the first five years.
Since most public entities are policy constrained to five years and in, we can combine the strategies for the entire legal timeframe of the portfolio.
*CFA Instititute, Fixed-Income Analysis 3rd Edition
19
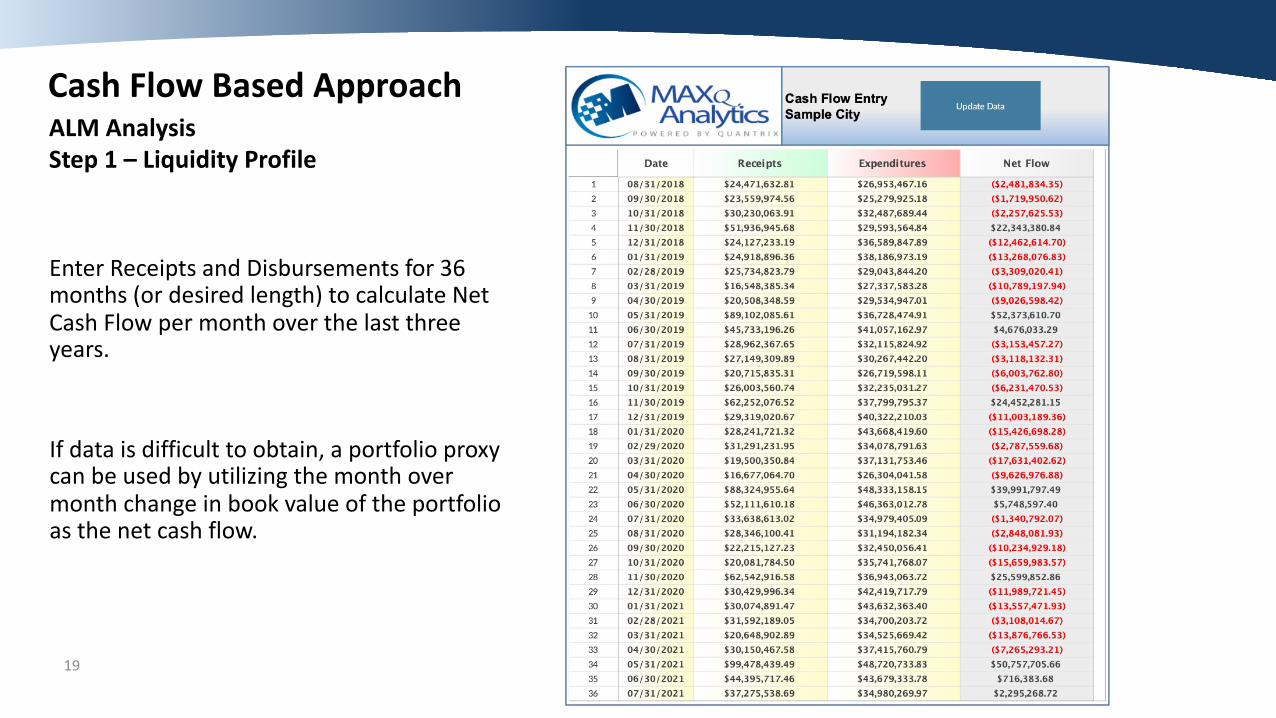
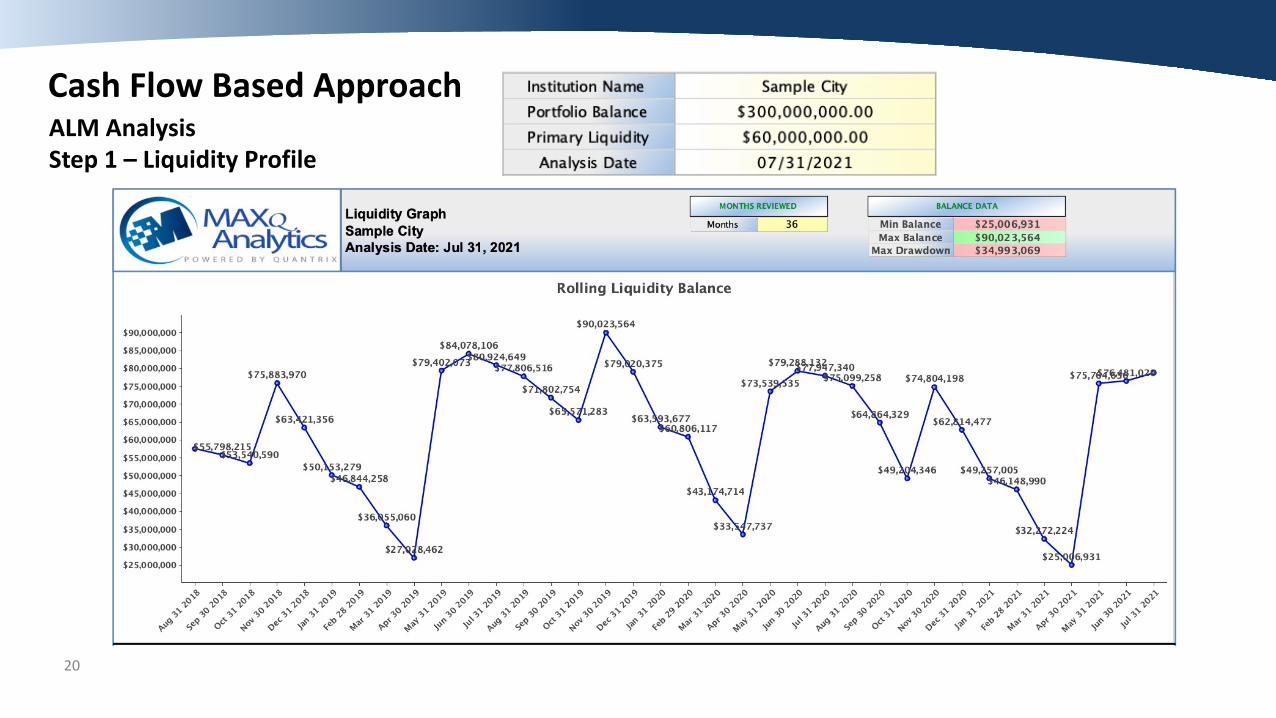
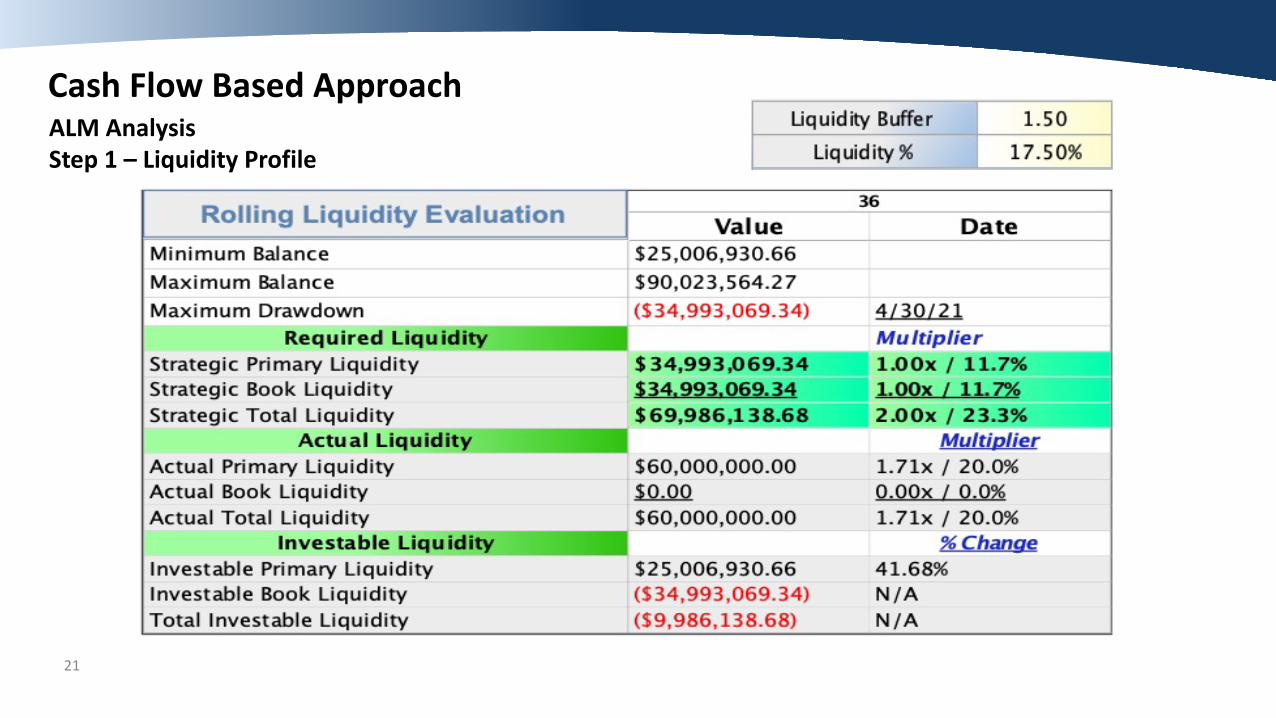
Cash Flow Based ApproachALM AnalysisStep 1 – Liquidity Profile
Enter Receipts and Disbursements for 36 months (or desired length) to calculate Net Cash Flow per month over the last three years.
If data is difficult to obtain, a portfolio proxy can be used by utilizing the month over month change in book value of the portfolio as the net cash flow.
20
Cash Flow Based ApproachALM AnalysisStep 1 – Liquidity Profile
21
Cash Flow Based ApproachALM AnalysisStep 1 – Liquidity Profile
22
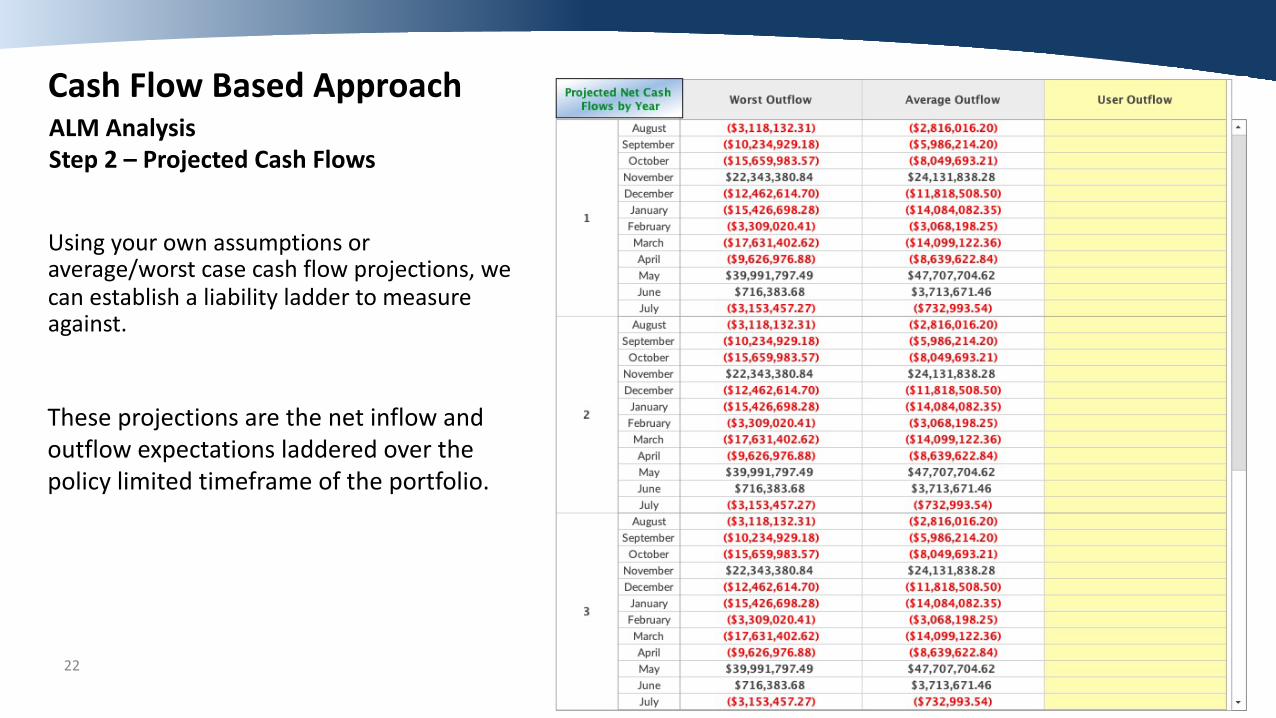
Cash Flow Based ApproachALM AnalysisStep 2 – Projected Cash Flows
Using your own assumptions or average/worst case cash flow projections, we can establish a liability ladder to measure against.
These projections are the net inflow and outflow expectations laddered over the policy limited timeframe of the portfolio.
23
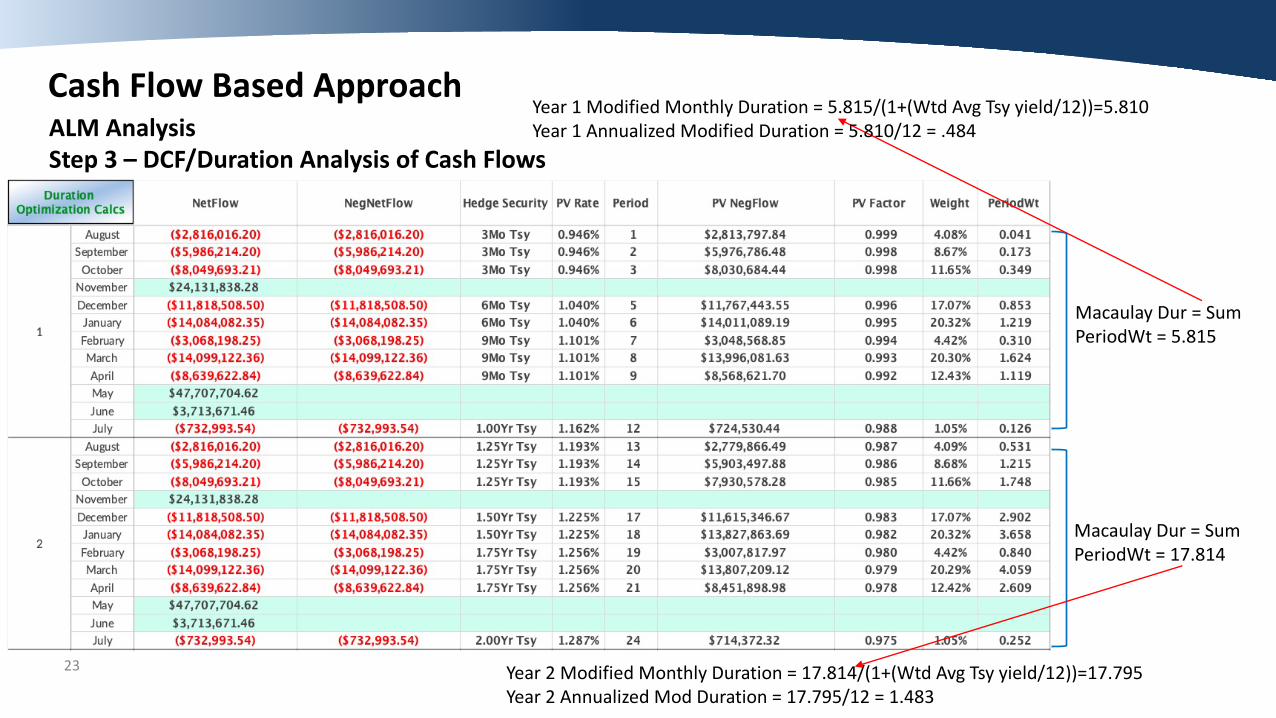
Cash Flow Based ApproachALM AnalysisStep 3 – DCF/Duration Analysis of Cash Flows
Year 1 Modified Monthly Duration = 5.815/(1+(Wtd Avg Tsy yield/12))=5.810Year 1 Annualized Modified Duration = 5.810/12 = .484
Macaulay Dur = Sum PeriodWt = 5.815
Year 2 Modified Monthly Duration = 17.814/(1+(Wtd Avg Tsy yield/12))=17.795Year 2 Annualized Mod Duration = 17.795/12 = 1.483
Macaulay Dur = Sum PeriodWt = 17.814
24
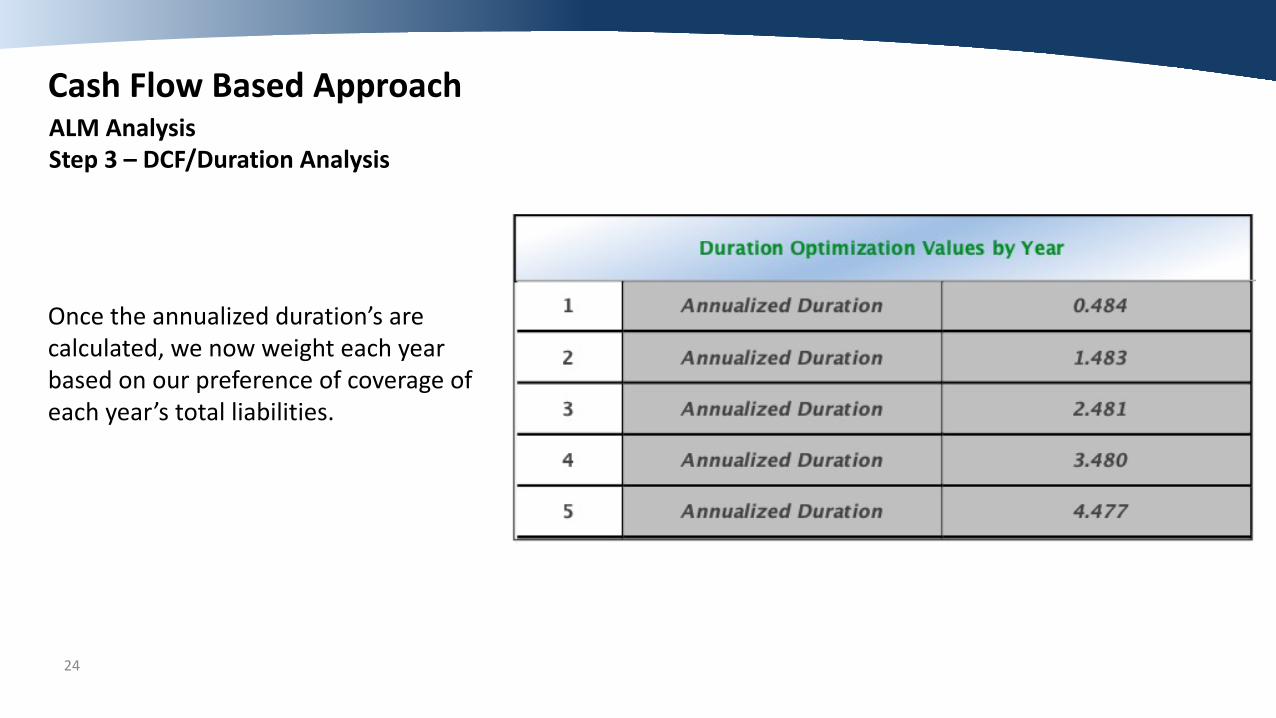
Cash Flow Based ApproachALM AnalysisStep 3 – DCF/Duration Analysis
Once the annualized duration’s are calculated, we now weight each year based on our preference of coverage of each year’s total liabilities.
25
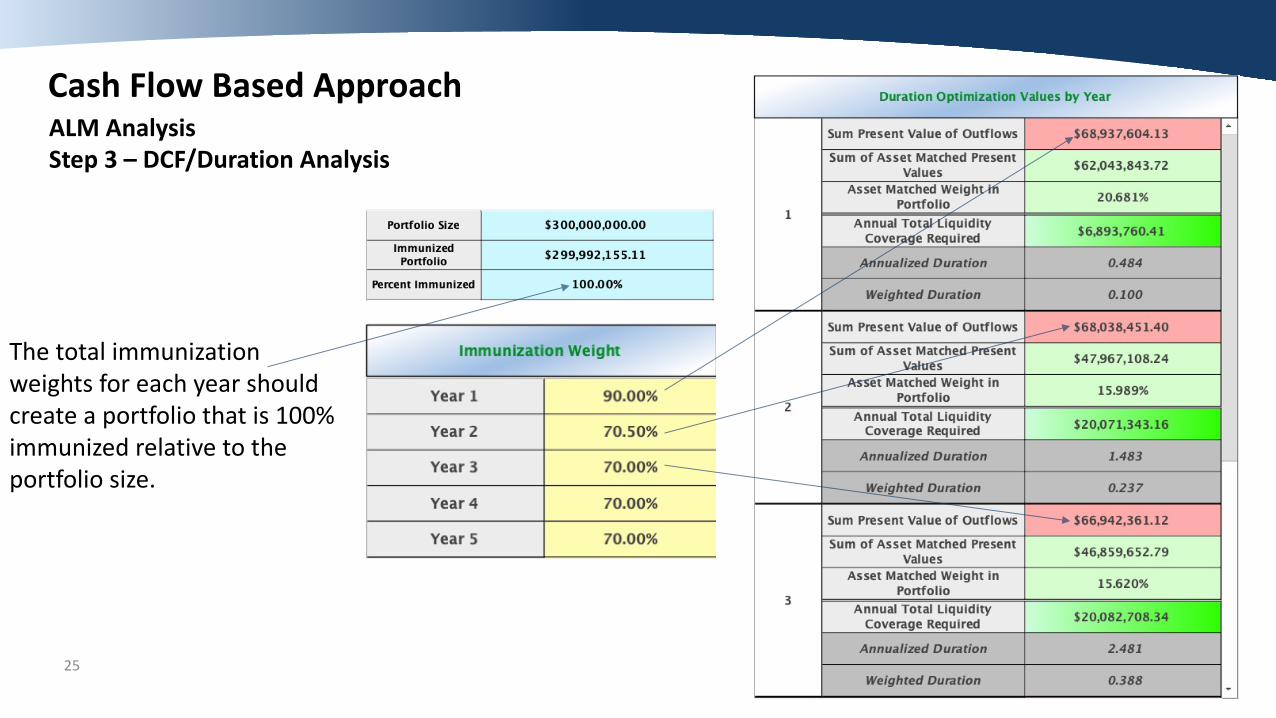
Cash Flow Based ApproachALM AnalysisStep 3 – DCF/Duration Analysis
The total immunization weights for each year should create a portfolio that is 100% immunized relative to the portfolio size.
YOURLOGO26
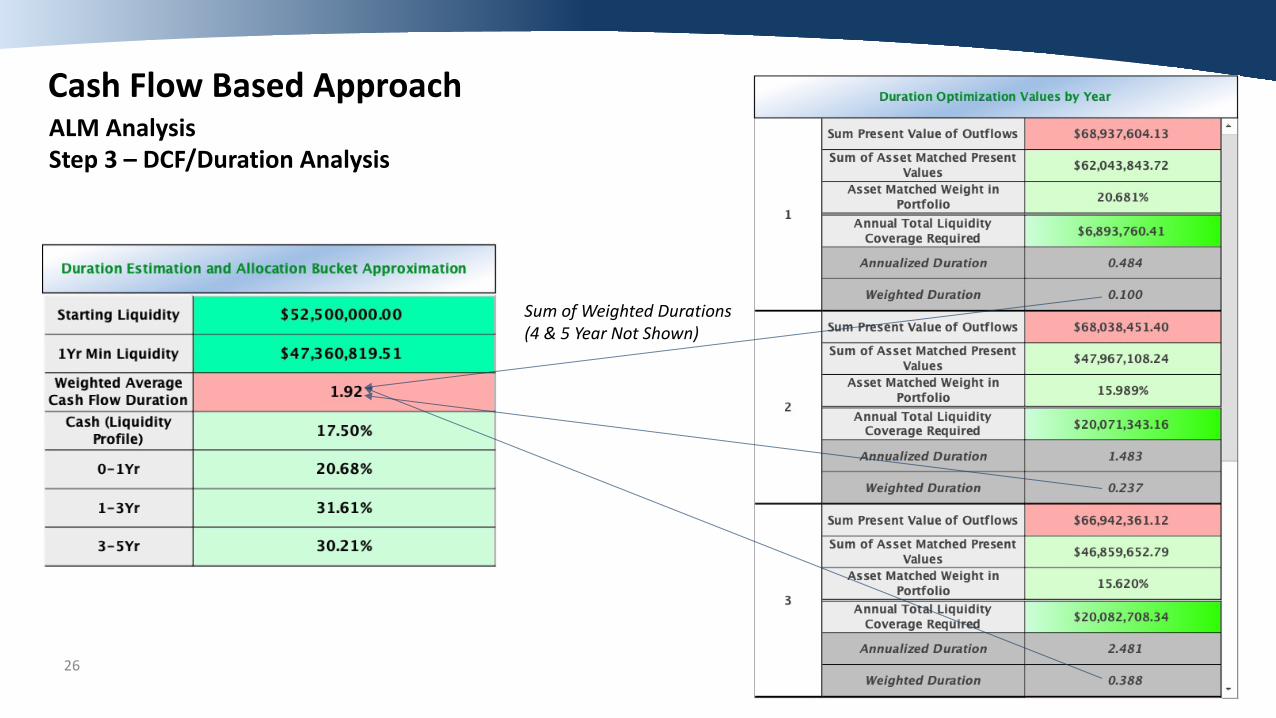
Cash Flow Based ApproachALM AnalysisStep 3 – DCF/Duration Analysis
Sum of Weighted Durations (4 & 5 Year Not Shown)

YOURLOGO27
Cash Flow Based ApproachALM AnalysisStep 3 – DCF/Duration Analysis
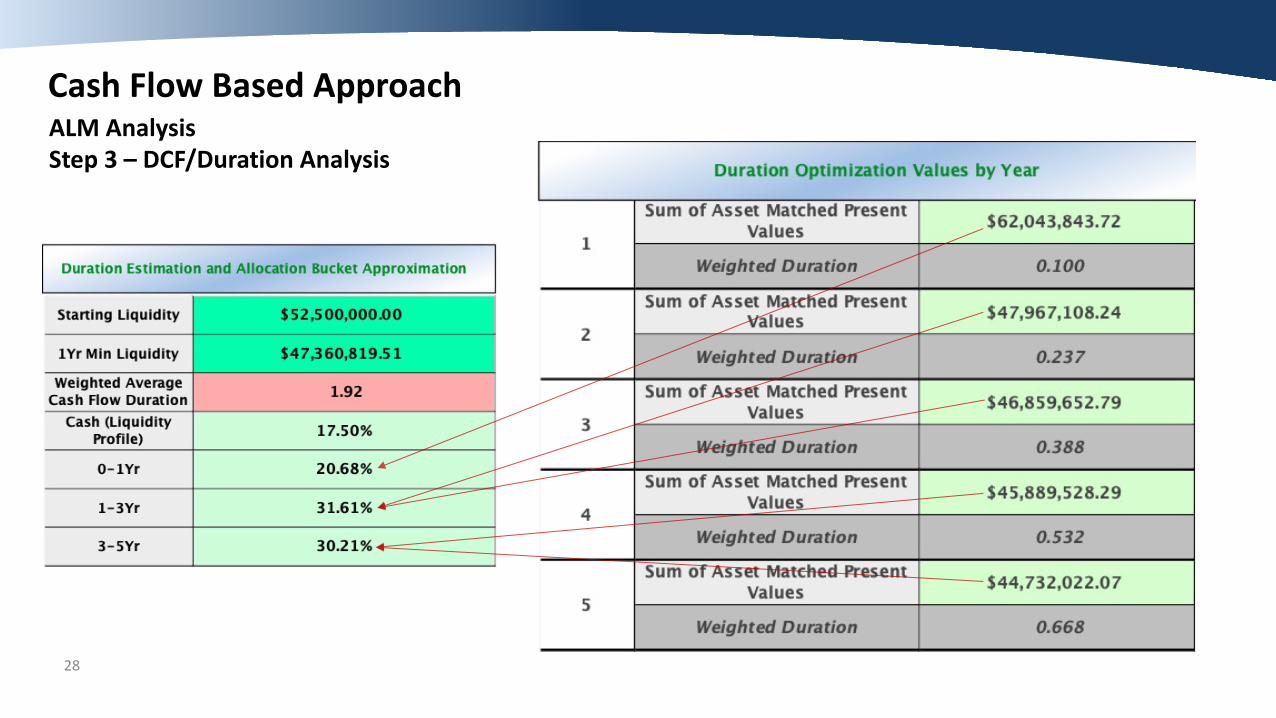
Sum of Asset Matched Weights (4 & 5 Year Not Shown)
28
Cash Flow Based ApproachALM AnalysisStep 3 – DCF/Duration Analysis
29
Case Study: City and County of San Francisco
CCSF Investment Pool§ City & County of San Francisco encompasses 93 Square miles - population of 883,000+§ CCSF Investment Pool currently is $12.5 billion§ Many different participants both discretionary and non-discretionary with 13 major participants§ Monthly apportionment to each participant§ Consists of operating reserves and bond issuance proceeds
Investment Strategy§ Focus is on Safety of Principal and Liquidity – return is considered after the first two mandates are
satisfied§ Emphasis on Asset/Liability Management – matching asset maturities with cash outflows§ Maintaining a consistent average maturity consistent with cashflow profile – not market timing§ Income generation is key – not total return
30
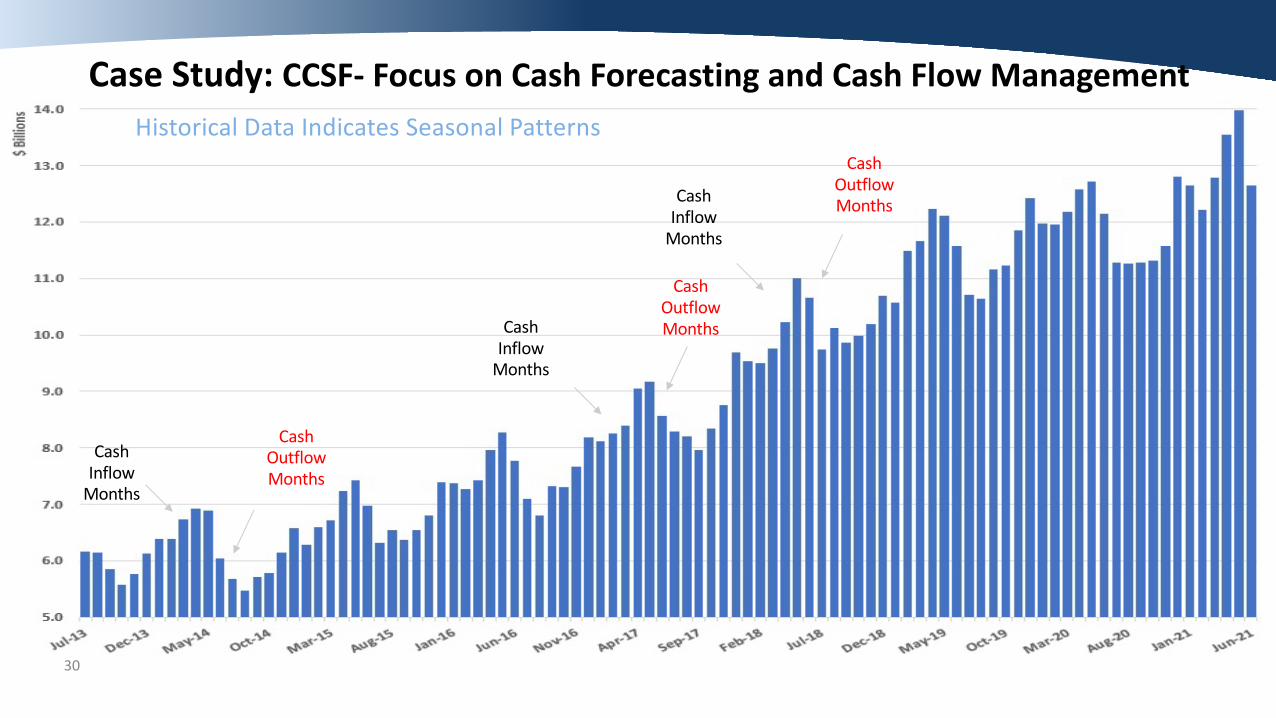
Case Study: CCSF- Focus on Cash Forecasting and Cash Flow ManagementHistorical Data Indicates Seasonal Patterns
Cash Inflow
Months
Cash Outflow Months
Cash Inflow
Months
Cash Outflow Months
Cash Inflow
Months
Cash Outflow Months
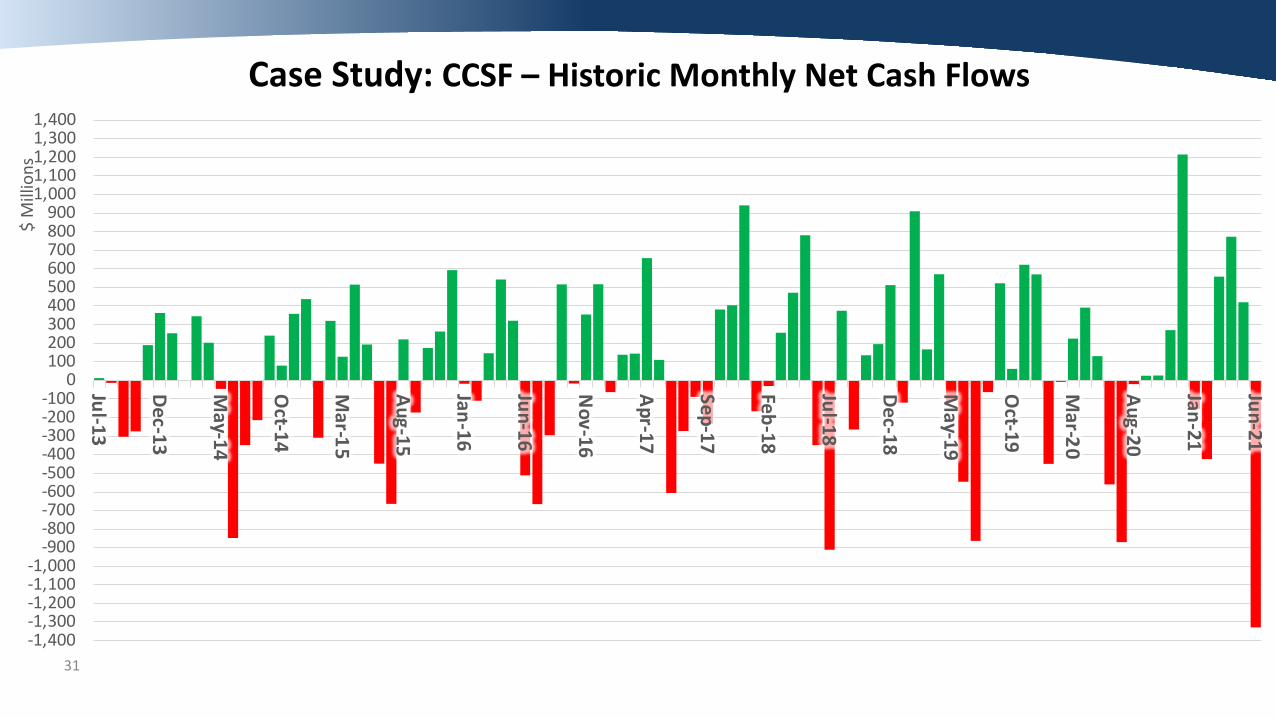
31
Case Study: CCSF – Historic Monthly Net Cash Flows
-1,400-1,300-1,200-1,100-1,000
-900-800-700-600-500-400-300-200-100
0100200300400500600700800900
1,0001,1001,2001,3001,400
Jul-13
Dec-13
May-14
Oct-14
Mar-15
Aug-15
Jan-16
Jun-16
Nov-16
Apr-17
Sep-17
Feb-18
Jul-18
Dec-18
May-19
Oct-19
Mar-20
Aug-20
Jan-21
Jun-21$
Mill
ions
32
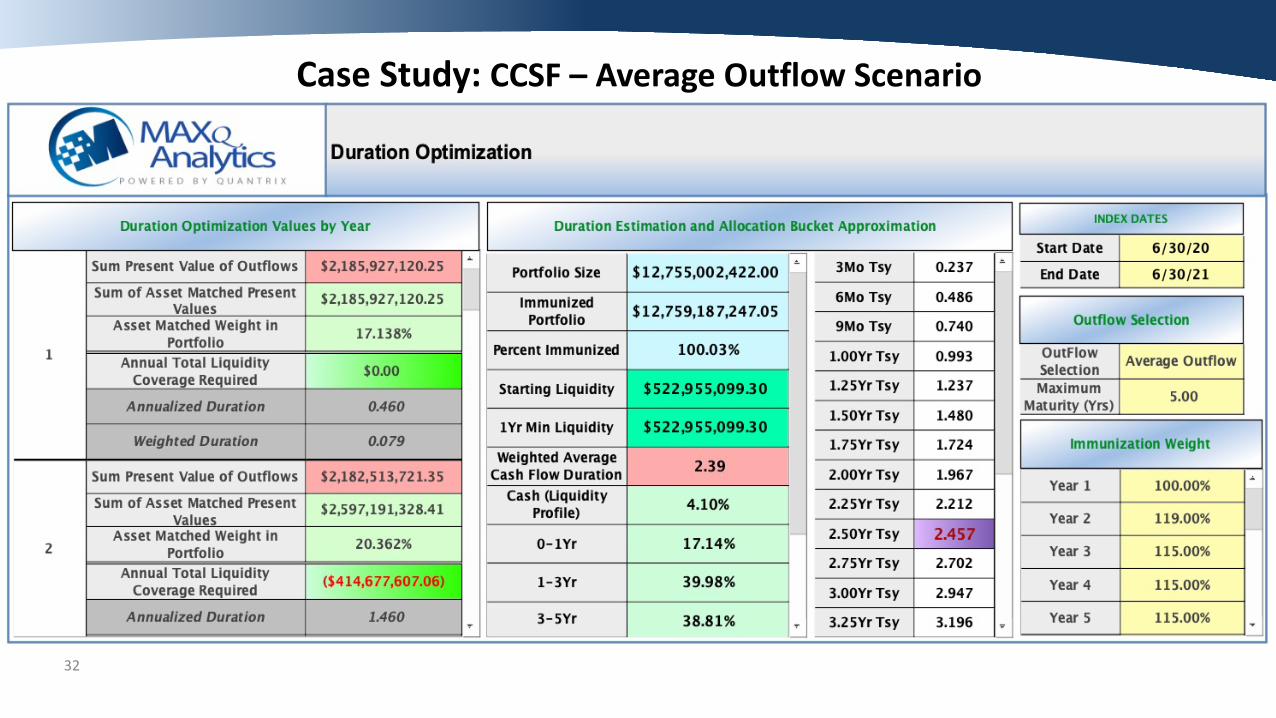
Case Study: CCSF – Average Outflow Scenario
33
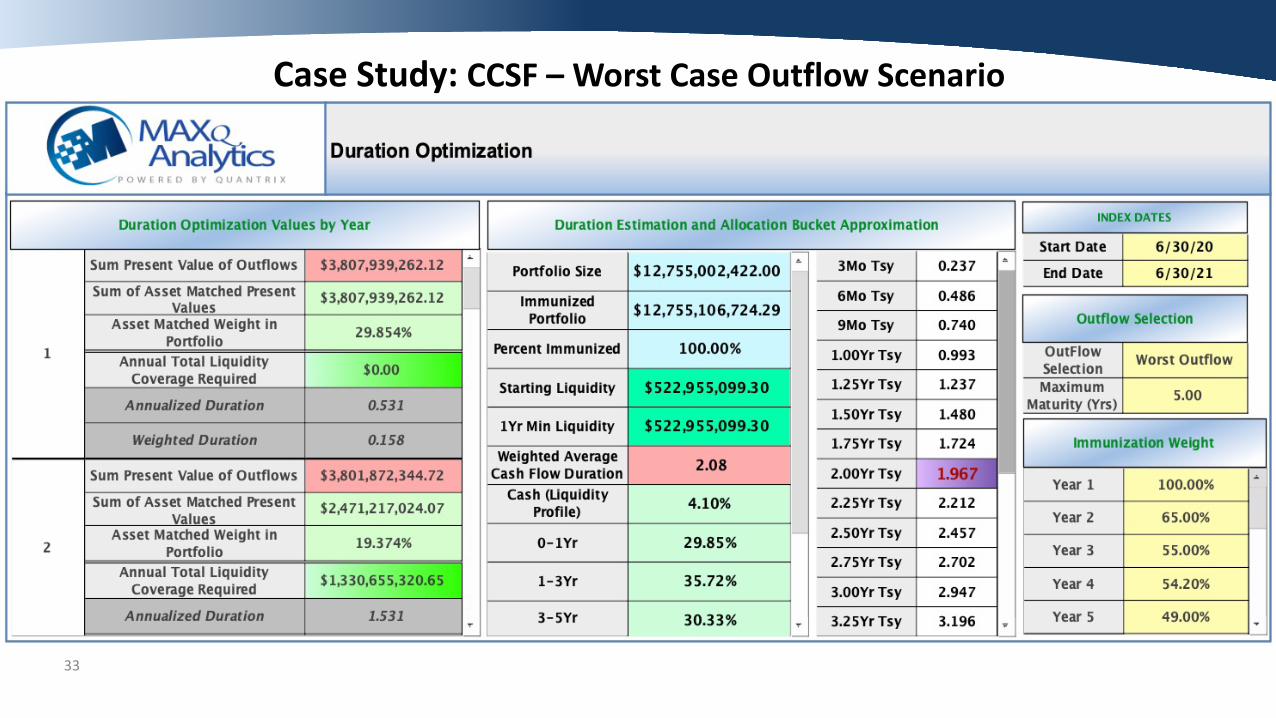
Case Study: CCSF – Worst Case Outflow Scenario
34
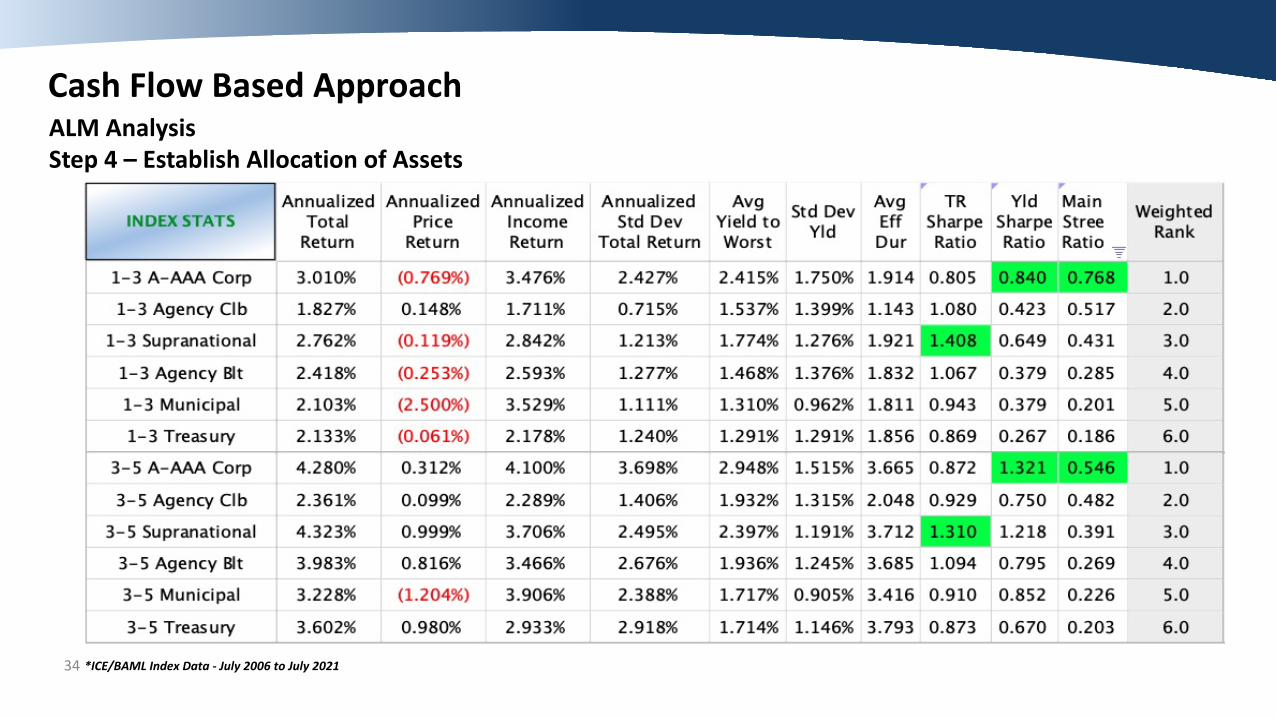
Cash Flow Based ApproachALM AnalysisStep 4 – Establish Allocation of Assets
*ICE/BAML Index Data - July 2006 to July 2021
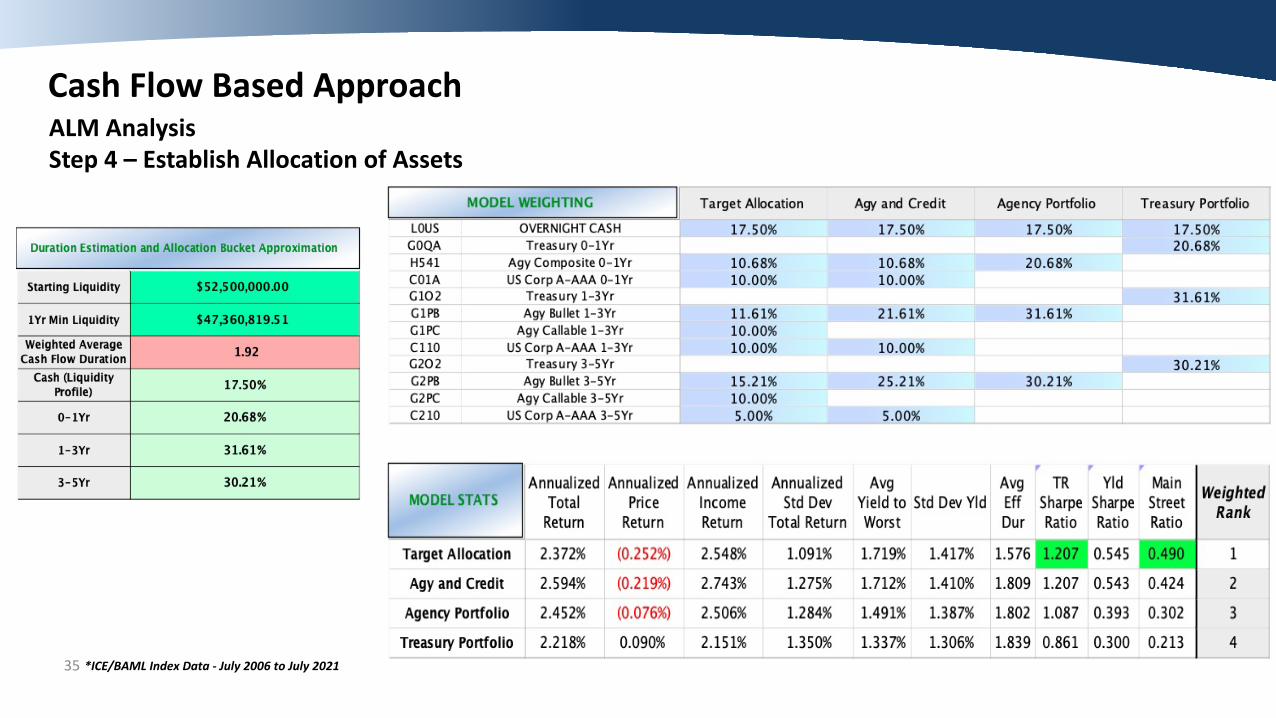
35
Cash Flow Based ApproachALM AnalysisStep 4 – Establish Allocation of Assets
*ICE/BAML Index Data - July 2006 to July 2021
36
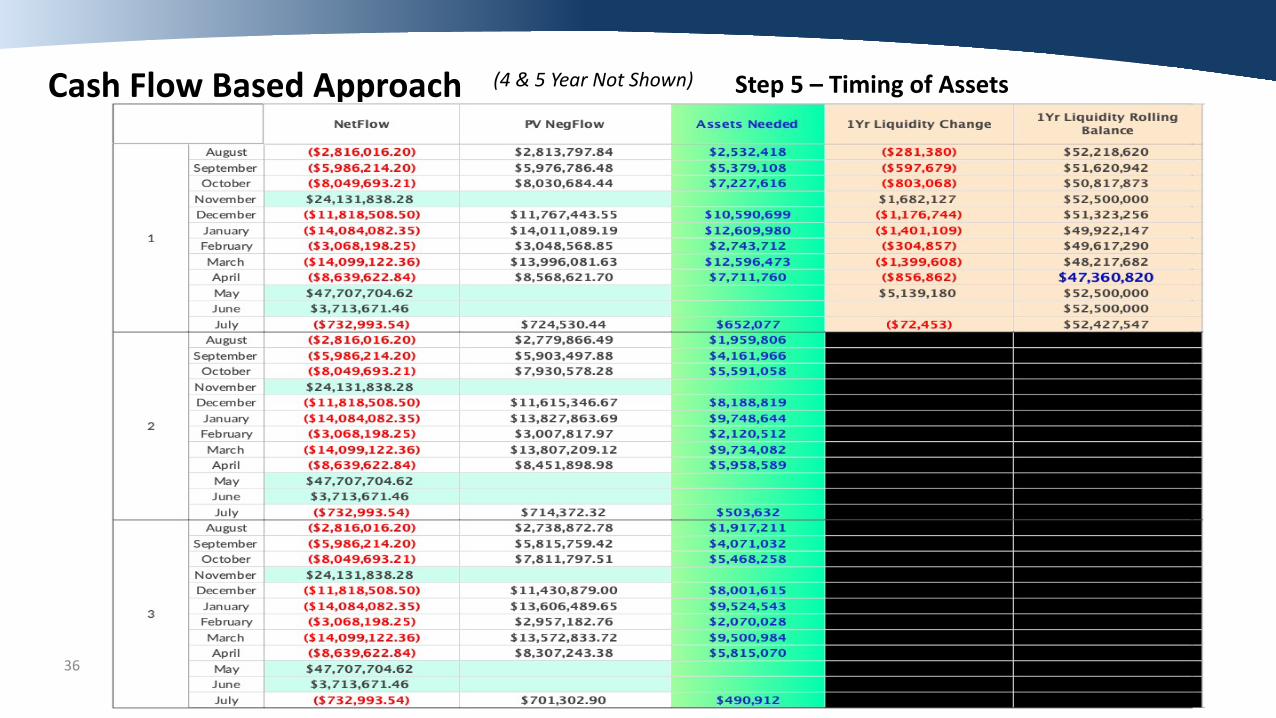
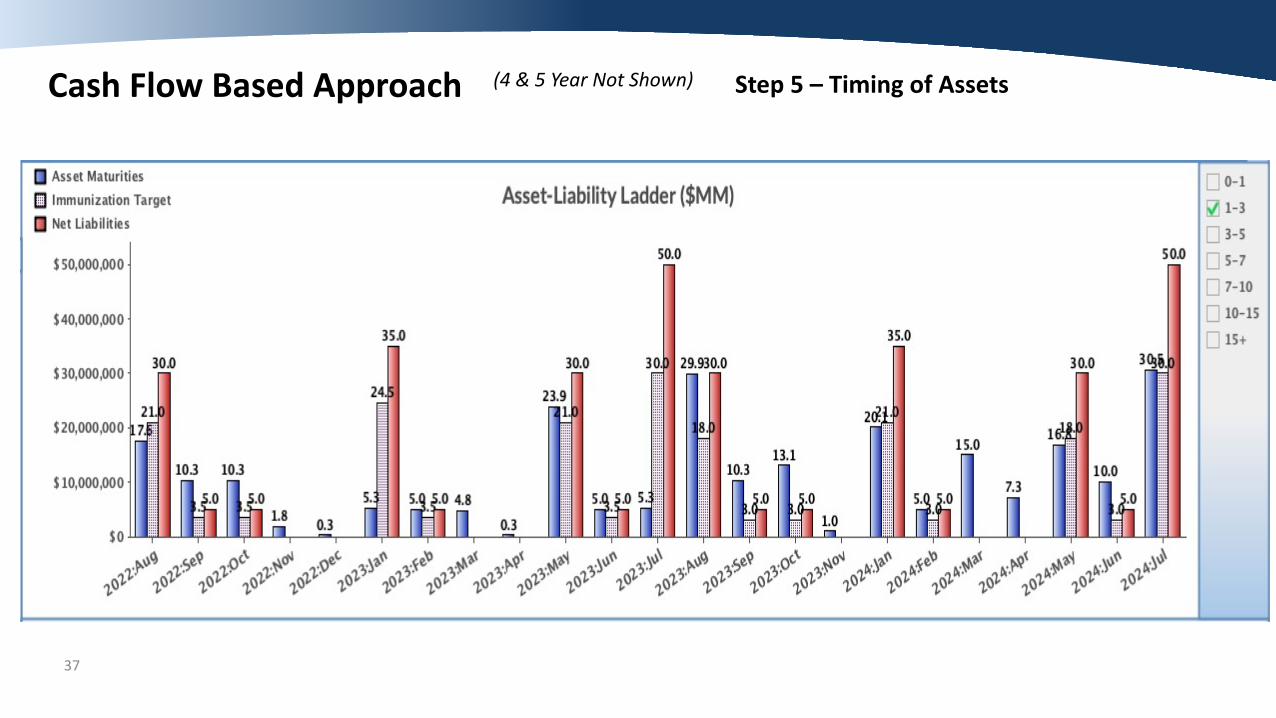
Cash Flow Based Approach Step 5 – Timing of Assets(4 & 5 Year Not Shown)
37
Cash Flow Based Approach Step 5 – Timing of Assets(4 & 5 Year Not Shown)
38
Cash Flow Based ApproachALM Analysis
• Uses institution’s actual cash flow data to measure future liabilities and derive duration needs
• Eliminates bias and idiosyncratic problems that public entities can have with market based approaches (liquidity, sector and structure differences).
• Ensures each institution’s duration is unique and not peer or market related.
• Places emphasis on timing and magnitude of investments relative to liabilities versus market based optimizations for the masses.
• Does require more data and effort to establish the projected liability stream and involves calculations that may not be familiar.
• There are opportunity costs associated by limiting the investment universe to any particular timeframe, however it can be argued that maintaining a stable duration and limiting cash balances can more than offset any costs associated with security selection constraints (without this process, cash balances tend to be higher and more conservative securities are purchased due to uncertainty).

Any questions?
Questions & Answers
39
Disclosure
40
The information presented is intended for institutional investors only. Mischler Financial Group does not warrant the correctness of any information herein or the appropriateness of any transaction. The contents of this presentation and any attachments or links are for informational purposes only and under no circumstances should they be construed as an offer to sell or a solicitation to buy any security. Any information or data used in this presentation was obtained from sources we deemed to be reliable, but we can not guarantee its accuracy. This presentation contains the current opinions of the author, which are subject to change without notice. Opinions expressed herein are statements only of the date indicated and are not given or endorsed by Mischler Financial Group. Past performance is not Indicative of future results.