Embed Size (px)
Citation preview

3 Hour Investor Newsletter incorporating the “Newsletter Portfolio” Year 2. Week 13-2017-Sep-02
Portfolio Vital Statistics
Commenced on 10 June 2016 with $250,000.
Now worth $296,753
First stocks purchased in week of 7/7/2016
Total Portfolio performance since inception 13.66% pa
Performance on funds invested in securities since
inception 24.18%
3 Hour Investor Newsletter incorporating the “Newsletter Portfolio” Year 2. Week 13-2017-Sep-02
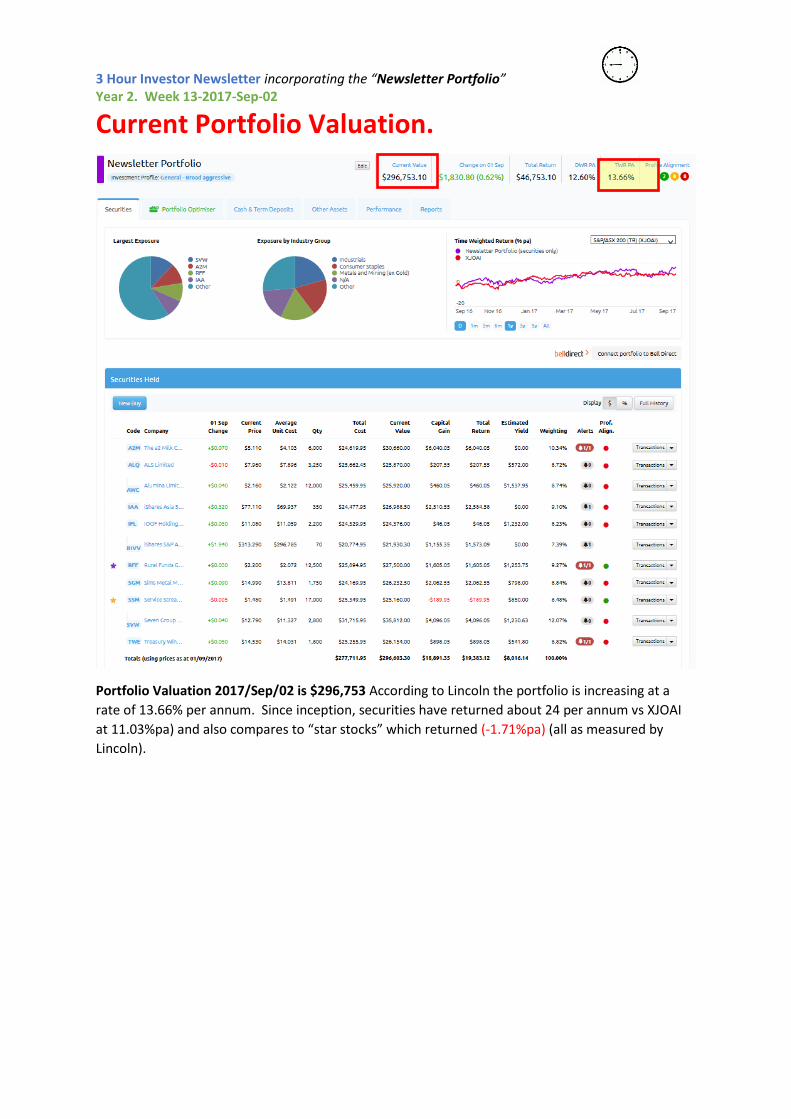
Current Portfolio Valuation.
Portfolio Valuation 2017/Sep/02 is $296,753 According to Lincoln the portfolio is increasing at a
rate of 13.66% per annum. Since inception, securities have returned about 24 per annum vs XJOAI
at 11.03%pa) and also compares to “star stocks” which returned (-1.71%pa) (all as measured by
Lincoln).
3 Hour Investor Newsletter incorporating the “Newsletter Portfolio” Year 2. Week 13-2017-Sep-02
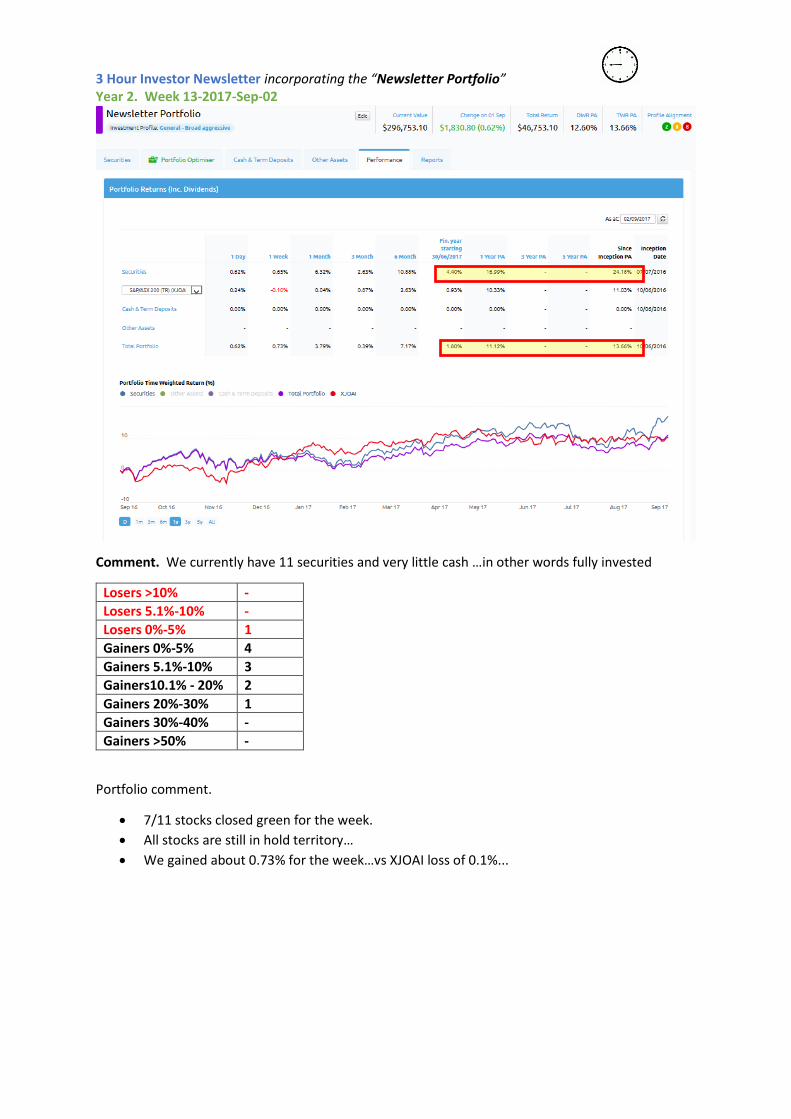
Comment. We currently have 11 securities and very little cash …in other words fully invested
Losers >10% -
Losers 5.1%-10% -
Losers 0%-5% 1
Gainers 0%-5% 4
Gainers 5.1%-10% 3
Gainers10.1% - 20% 2
Gainers 20%-30% 1
Gainers 30%-40% -
Gainers >50% -
Portfolio comment.
7/11 stocks closed green for the week.
All stocks are still in hold territory…
We gained about 0.73% for the week…vs XJOAI loss of 0.1%...

3 Hour Investor Newsletter incorporating the “Newsletter Portfolio” Year 2. Week 13-2017-Sep-02 Status of US Markets.
Dow. Closed Green for the week Up 0.18% Friday Futures Green (Saturday) Short term moving average still above long term moving average Volume looks ok
S&P 500 was Green for the week Up 0.2% Friday FUTURES Green Saturday… Short Term Moving average well above long term. Volume about average
Nasdaq. Green for Week Up 0.1% Friday Futures RED Saturday. Short term moving average still well above longer term moving average
Russell 2000 Green for week, UP 0.59% Friday Futures Green Saturday Bearish signal now gone…last week price was still below 30 day line now popped back above
Vix…closed RED for the week a Green signal for us
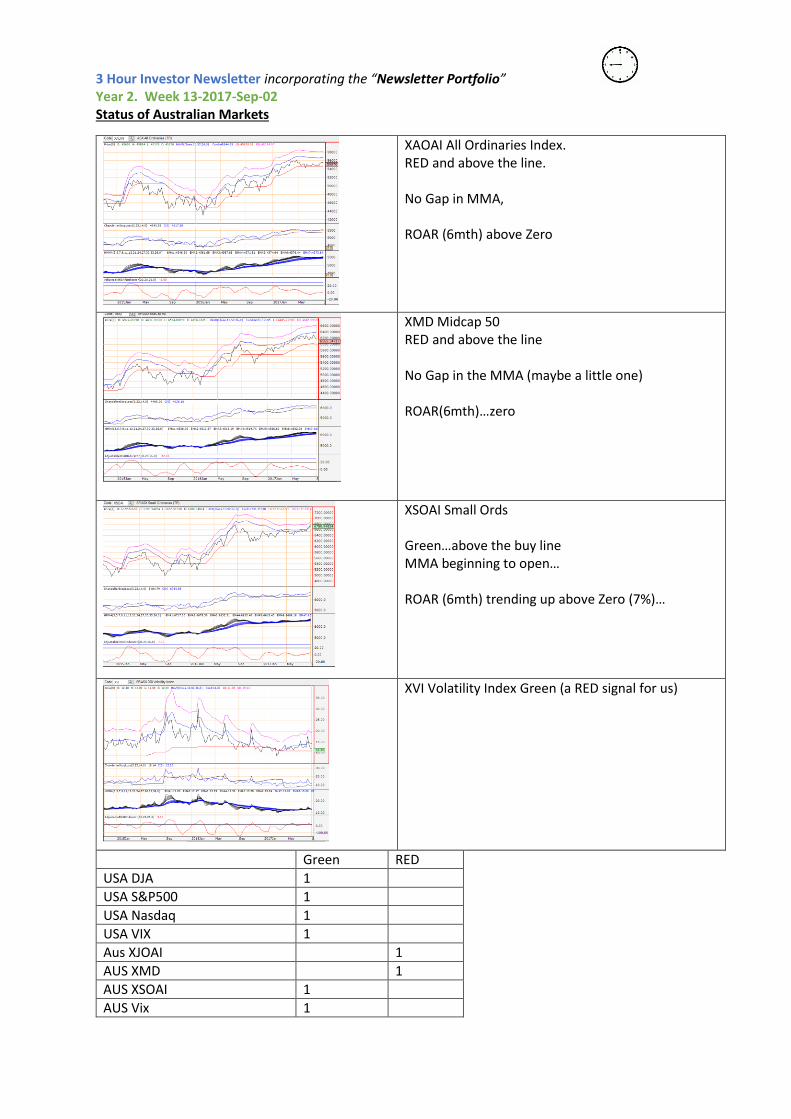
3 Hour Investor Newsletter incorporating the “Newsletter Portfolio” Year 2. Week 13-2017-Sep-02 Status of Australian Markets
XAOAI All Ordinaries Index. RED and above the line. No Gap in MMA, ROAR (6mth) above Zero
XMD Midcap 50 RED and above the line No Gap in the MMA (maybe a little one) ROAR(6mth)…zero
XSOAI Small Ords Green…above the buy line MMA beginning to open… ROAR (6mth) trending up above Zero (7%)…
XVI Volatility Index Green (a RED signal for us)
Green RED
USA DJA 1
USA S&P500 1
USA Nasdaq 1
USA VIX 1
Aus XJOAI 1
AUS XMD 1
AUS XSOAI 1
AUS Vix 1

3 Hour Investor Newsletter incorporating the “Newsletter Portfolio” Year 2. Week 13-2017-Sep-02
Overall market signals look mostly green to me. Of particular interest is the rising XSOAI…this
indicates some optimism to me.
ASX Indices with ROAR above 20%
New section for this report. Here are the ASX indices which closed the week with ROAR (6 months
rather than annual) above 20%. (purpose of this section….if an index is going up…perhaps consider
looking at its component stocks to check for anything worth buying). (if it closed green for the week
I’ll mention it)
XJR (resources) …21% (6mths)
XMM S&P ASX 300 Metals Mining. 25%(6mths)
Special Mention: There are some indices that are starting to rise
XEC Emerging companies crossed up at 1200 and now at 1292 (6mth ROAR 12%) Green.
XGD ASX 300 Gold +9% (6months)
XMM ASX300 metals and mining growing at about 25% on 6 mth ROAR
Things can change quite quickly in the markets. I suspect it’s important to look everywhere to find
value and danger.
3 Hour Investor Newsletter incorporating the “Newsletter Portfolio” Year 2. Week 13-2017-Sep-02
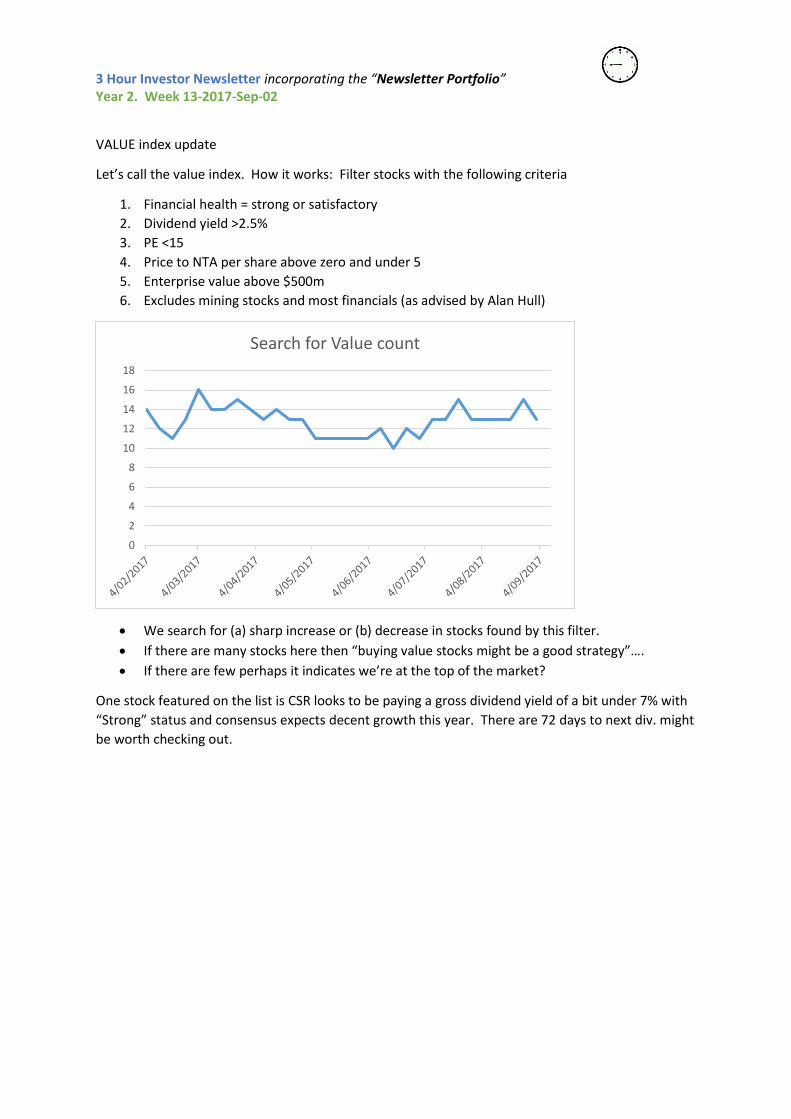
VALUE index update
Let’s call the value index. How it works: Filter stocks with the following criteria
1. Financial health = strong or satisfactory
2. Dividend yield >2.5%
3. PE <15
4. Price to NTA per share above zero and under 5
5. Enterprise value above $500m
6. Excludes mining stocks and most financials (as advised by Alan Hull)
We search for (a) sharp increase or (b) decrease in stocks found by this filter.
If there are many stocks here then “buying value stocks might be a good strategy”….
If there are few perhaps it indicates we’re at the top of the market?
One stock featured on the list is CSR looks to be paying a gross dividend yield of a bit under 7% with
“Strong” status and consensus expects decent growth this year. There are 72 days to next div. might
be worth checking out.
0
2
4
6
8
10
12
14
16
18
Search for Value count
3 Hour Investor Newsletter incorporating the “Newsletter Portfolio” Year 2. Week 13-2017-Sep-02
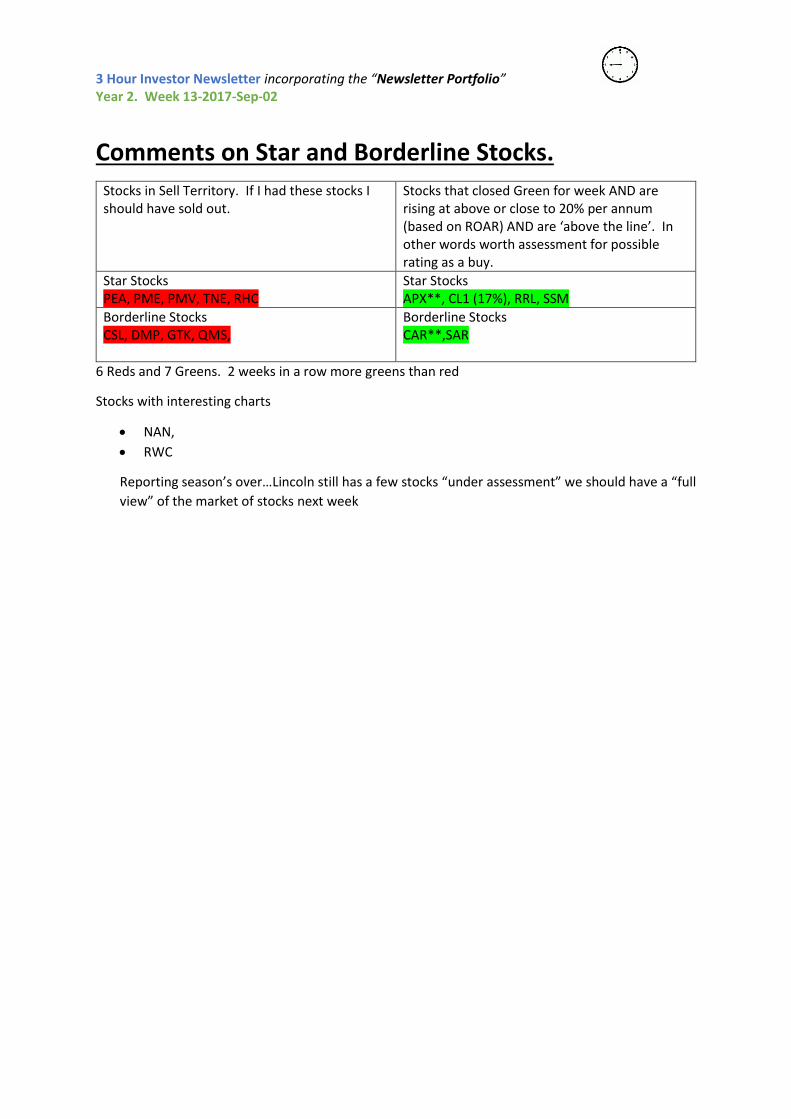
Comments on Star and Borderline Stocks.
Stocks in Sell Territory. If I had these stocks I should have sold out.
Stocks that closed Green for week AND are rising at above or close to 20% per annum (based on ROAR) AND are ‘above the line’. In other words worth assessment for possible rating as a buy.
Star Stocks PEA, PME, PMV, TNE, RHC
Star Stocks APX**, CL1 (17%), RRL, SSM
Borderline Stocks CSL, DMP, GTK, QMS,
Borderline Stocks CAR**,SAR
6 Reds and 7 Greens. 2 weeks in a row more greens than red
Stocks with interesting charts
NAN,
RWC
Reporting season’s over…Lincoln still has a few stocks “under assessment” we should have a “full
view” of the market of stocks next week
3 Hour Investor Newsletter incorporating the “Newsletter Portfolio” Year 2. Week 13-2017-Sep-02
Selling Report.
No sells this week
Buying Report. TWE buy 28/8, 1,800 @ 14.02 fees 19.95
RFF buy 28/8, 12,500 @2.07 fees 19.95
SSM buy 30/8 17,000@ 1.49 fees 19.95
IFL Buy 31/8 2,[email protected] fees 19.95
AWC buy 31/8 12,[email protected]
As you can see it was a busy week. We had a lot of cash and buying conditions seemed favourable
so we pushed down on the accelerator.

3 Hour Investor Newsletter incorporating the “Newsletter Portfolio” Year 2. Week 13-2017-Sep-02
Stocks worth assessing as suitable for
purchase if conditions are right this week The following stocks are on our “potential buy” list…
Warning. Requires further careful analysis
1. A2M**
2. AGI
3. ALQ**
4. APX**
5. AWC**
6. BGA
7. CAR**
8. CGC**
9. CIM**
10. DOW
11. FLT
12. HFA
13. IFL**
14. IRI**
15. MIN
16. MLD
17. RFF**
18. RRL
19. SAR
20. SVW**
21. WHC**
We’re fully invested at the moment…so we won’t be buying unless one of our stocks is sold.
3 Hour Investor Newsletter incorporating the “Newsletter Portfolio” Year 2. Week 13-2017-Sep-02
Bonus Charts:
In this section I’ll sometimes list a chart that catches my eye and provide a brief comment.
If you want a stock reviewed, perhaps email me and I might include it (no promises)
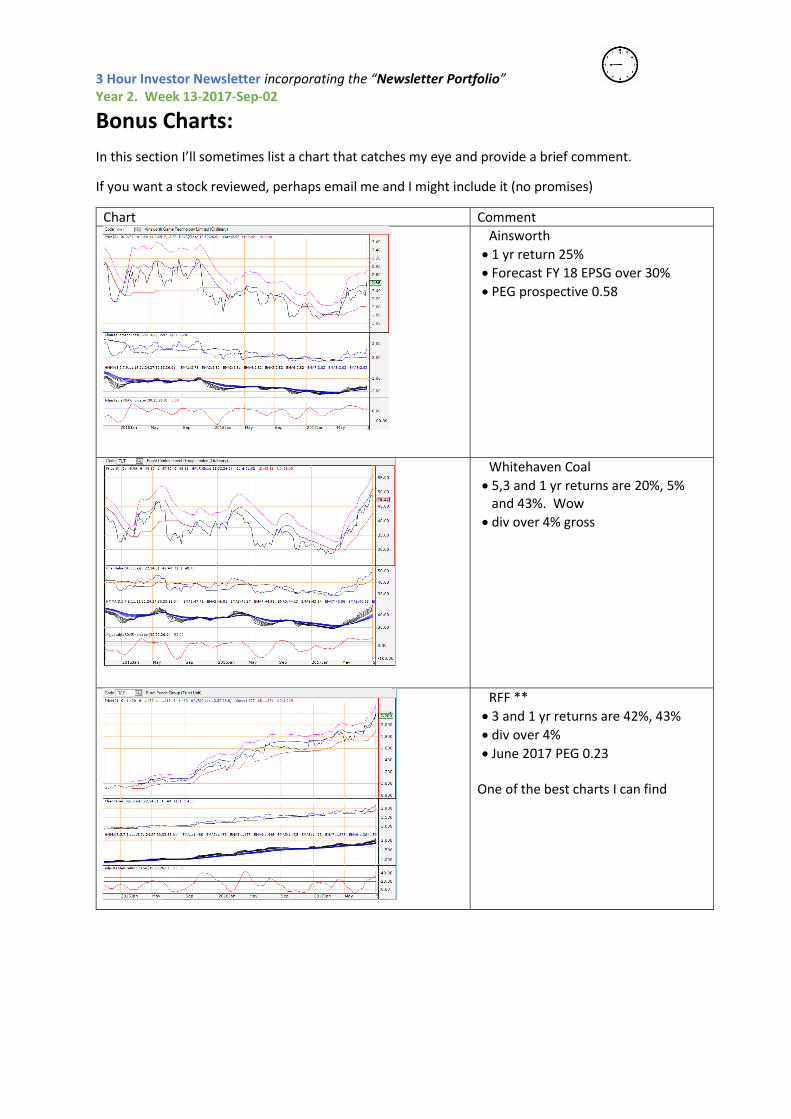
Chart Comment
Ainsworth
1 yr return 25%
Forecast FY 18 EPSG over 30%
PEG prospective 0.58
Whitehaven Coal
5,3 and 1 yr returns are 20%, 5% and 43%. Wow
div over 4% gross
RFF **
3 and 1 yr returns are 42%, 43%
div over 4%
June 2017 PEG 0.23 One of the best charts I can find

3 Hour Investor Newsletter incorporating the “Newsletter Portfolio” Year 2. Week 13-2017-Sep-02 Parting comment
Gold and silver and other metals are growing
And again here’s the NASDAQ
What does it all mean?
Personally I think it’s close to impossible to carefully understand all the
fundamentals…there’s simply too much going on.
I’m going to BE READY for shifts in the market…whichever way they go….emphasis on being
safe and trying to pick favourable trends..
I’ll attempt to identify stocks with good looking fundamentals that are going up and buy
them when the market is trending up. I’ll quickly sell when the market tells me I’m wrong.
The selling quickly part is the most critical…there should be zero friction to selling.

3 Hour Investor Newsletter incorporating the “Newsletter Portfolio” Year 2. Week 13-2017-Sep-02
Comparison of portfolio returns
Newsletter portfolio . Since inception 10/6/16 13.66%pa
Buffett’s Widow passive portfolio. Since inception 1/7/16 9.30%pa
Star Stocks Portfolio: Since inception 17/11/2016. 1.59% pa
Warning. This newsletter is provided for your entertainment only, I’m not a financial adviser, I have not taken account of your objectives, financial situation or needs. You should therefore consider the appropriateness of any descriptions of my Newsletter and its newsletter portfolio in light of your objectives, financial situation and needs, before taking any actions.
All views and information expressed in this newsletter are not the views of Lincoln and or its directors, agents, representatives and employees.
Many of the graphs and screen shots are taken from Lincoln services and are fully credited to them. I’m a paid up licensee to Lincoln, otherwise all IP in their system and graphs belongs totally to them. I recommend that you consider signing up to their service…it’s a great service and I feel great value for money!
I do invest and trade in shares, I’ll usually mark the ones that I own with (**)…however it’s safe for you to imagine that I’m either buying or selling just about any stock in the market, particularly and especially if mentioned here.