Embed Size (px)
Citation preview
Traffic Safety Basic Facts 2013 - Main Figures
Traffic Safety Basic Facts 2015 Urban Areas
Portugal
Road Safety Country Overview
Road Safety Country Overview - PORTUGAL
- 2 -
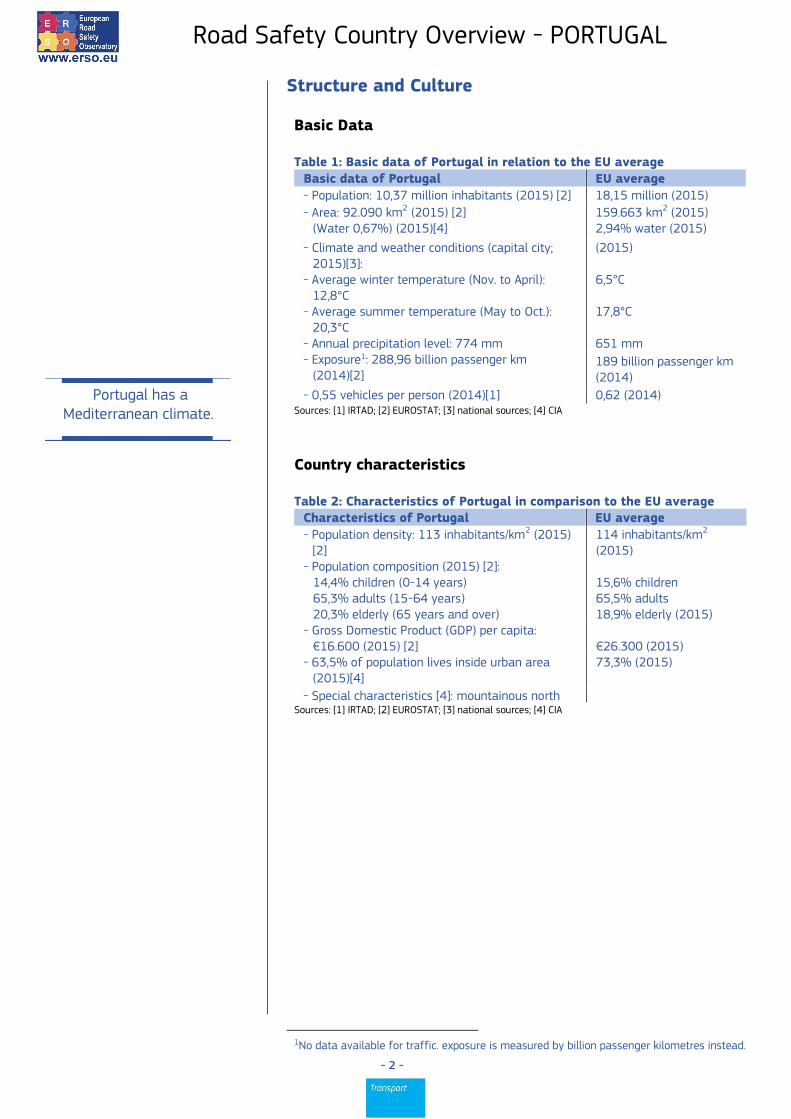
Structure and Culture Basic Data Table 1: Basic data of Portugal in relation to the EU average
Basic data of Portugal EU average
- Population: 10,37 million inhabitants (2015) [2] 18,15 million (2015)
- Area: 92.090 km2 (2015) [2] (Water 0,67%) (2015)[4]
159.663 km2 (2015) 2,94% water (2015)
- Climate and weather conditions (capital city; 2015)[3]:
- Average winter temperature (Nov. to April): 12,8°C
- Average summer temperature (May to Oct.): 20,3°C
- Annual precipitation level: 774 mm
(2015) 6,5°C 17,8°C 651 mm
- Exposure1: 288,96 billion passenger km (2014)[2]
189 billion passenger km (2014)
- 0,55 vehicles per person (2014)[1] 0,62 (2014) Sources: [1] IRTAD; [2] EUROSTAT; [3] national sources; [4] CIA
Country characteristics Table 2: Characteristics of Portugal in comparison to the EU average
Characteristics of Portugal EU average
- Population density: 113 inhabitants/km2 (2015) [2]
114 inhabitants/km2 (2015)
- Population composition (2015) [2]: 14,4% children (0-14 years) 65,3% adults (15-64 years) 20,3% elderly (65 years and over)
15,6% children 65,5% adults 18,9% elderly (2015)
- Gross Domestic Product (GDP) per capita: €16.600 (2015) [2]
€26.300 (2015)
- 63,5% of population lives inside urban area (2015)[4]
73,3% (2015)
- Special characteristics [4]: mountainous north Sources: [1] IRTAD; [2] EUROSTAT; [3] national sources; [4] CIA
1No data available for traffic. exposure is measured by billion passenger kilometres instead.
Portugal has a
Mediterranean climate.

Road Safety Country Overview - PORTUGAL
- 3 -
Structure of road safety management The objectives of the National Road Safety Strategy were established from the joint analysis based on the joint study of the recent developments in pattern of fatalities in Portugal and its constraints, how numbers progressed countries that in 1999 and 2003 had indicators similar to those reached by Portugal in 2006 and the behavioral studies of drivers and the population at large carried out in the past few years by ISCTE. The following key actors are responsible for Road Safety (RS) policy making: Table 3: Key actors per function in Portugal
Key functions Key actors 1. - Formulation of national
RS strategy - Setting targets - Development of the RS
programme
- Autoridade Nacional de Segurança Rodoviária (ANSR)
- Instituto Superior das Ciências do Trabalho e da Empresa (ISCTE)
- Conselho de Segurança Rodoviária (CSR) [Road Safety Council]
- Public Security Police - Provincial Governments
2. Monitoring of the RS development in the country
- Autoridade Nacional de Segurança Rodoviária (ANSR)
- Instituto Superior das Ciências do Trabalho e da Empresa (ISCTE)
3. Improvements in road infrastructure
- Infrastructure Portugal (under the ministry of Economy)
4. Vehicle improvement - IMTT - Instituto da Mobilidade e Transporte Terrestre
- ACAP - Associação do Comércio Automóvelem Portugal
- National Association of Companies Trade and Auto Repair - ANECRA
5. Improvement in road user education
- Ministry of Education - ANSR - IPJ – Instituto Português da Juventude - PRP – Prevenção Rodoviária Portuguesa - IMTT - Instituto da Mobilidade e Transportes
Terrestres
6. Publicity campaigns - ANSR
7. Enforcement of road traffic laws
- Instituto da Droga e da Toxicodependência - DirecçãoGeral da Saúde - Instituto Nacional de Medicina Legal
8. Other relevant actors Sources: national sources
The years 2008–2015 have been established as temporal framework for implementing a
National Road Safety Strategy.

Road Safety Country Overview - PORTUGAL
- 4 -
Attitudes towards risk taking - Portuguese drivers are less supportive for stricter legislation on
speeding and drink-driving compared to drivers in other countries. - The perceived probability of being checked is slightly lower than the
ESRA-average. Table 4: Road safety attitudes and behaviour of drivers
Portugal
ESRA average
Self-reported driving behaviour % of drivers that show behaviour at least once
In the past 12 months, as a road user, how often did you drive without respecting a safe distance to the car in front?
62% 60%
In the past 12 months, as a road user, how often did you talk on a hand-held mobile phone while driving?
46% 38%
In the past 12 months, as a road user, how often did you drive faster than the speed limit inside built-up areas?
72% 68%
Supporting stricter legislation % of drivers that disagree
with the following
What do you think about the current traffic rules and penalties in your country for each of the following themes?: The penalties are too severe: for speeding
48% 61%
What do you think about the current traffic rules and penalties in your country for each of the following themes?: The penalties are too severe: alcohol
78% 87%
Do you support the following measure?: Zero tolerance for alcohol (0,0‰) for all drivers
45% 41%
Perceived probability of being checked % of drivers with answers
in following categories
In the past 12 months, have you been stopped by the police for a check? (once or more)
46% 31%
On a typical journey, how likely is it that you (as a driver) will be checked by the police for respecting the speed limits (including checks by police car with a camera and/or GoSafe cameras)? (Very (big) chance)
35% 37%
In the past 12 months, have you been checked by the police for alcohol while driving a car (i.e., being subjected to a Breathalyser test)? (once or more)
19% 19%
Source: ESRA 2016
Legend (comparison of country attitude in relation to average attitude of other SARTRE countries):
2-9% better
10-19% better
≥ 20% better
2-9% worse 10-19% worse
≥ 20% worse
Portuguese drivers are less
supportive for stricter legislation on speeding and drink-driving compared to drivers in other countries.

Road Safety Country Overview - PORTUGAL
- 5 -
Programmes and measures National strategic plans and targets - The new National Road Safety Strategy, “PENSE 2016-2020” is being
developed. - Targets (referred to 2006): Table 5: Road safety targets for Portugal
Year Fatalities
2015 Max. 6,2 per 100.000 population Source: IRTAD, 2016
Priority topics:
- improvement of driver behaviour - protection of vulnerable road users - increased road safety in urban areas - reduction of the main risk behaviours - safer infrastructures and better mobility - promotion of vehicle safety - improvement in the assistance, treatment and follow-up of injured
road users
(Source: IRTAD, 2015)
Road infrastructure Table 6: Description of the road categories and their characteristics in Portugal
Road type General speed limits for passenger cars (km/h)
Urban roads 50
Rural roads 90
Motorways 120 Source: IRTAD, 2016
Special rules for:
- Light motorcycles (A1; until 18 years): no information on speed limits
Guidelines and strategic plans for infrastructure are available in
Portugal. Table 7: Obligatory parts of infrastructure management in Portugal and other EU countries
Obligatory parts in Portugal: EU countries with obligation
Safety impact assessment: no 32%
Road safety audits: no 81%
Road safety inspections: no 89%
High risk site treatment: yes 74% Source: IRTAD, 2015
Recent activities of road infrastructure improvement have been
addressing: no information
The new National Road Safety Strategy, “PENSE
2016-2020” is being developed.
High risk site treatment is
obligatory in Portugal.

Road Safety Country Overview - PORTUGAL
- 6 -
Traffic laws and regulations Table 8: Description of the regulations in Portugal in relation to the most common regulations in other EU countries
Regulations in Portugal [1] Most common in EU (% of countries)
Allowed BAC2 levels: - General population: 0,5‰ - Novice drivers: 0,5‰ - Professional drivers: 0,2‰
0,5‰ (61%) 0,2‰ (39%) and 0,0‰ (36%) 0,2‰ (36%) and 0,0‰ (36%)
Phoning: - Hand held: not allowed - Hands free: allowed
Not allowed (all countries) Allowed (all countries)
Use of restraint systems: - Driver: obligatory - Front passenger: obligatory - Rear passengers: obligatory - Children: obligatory
Obligatory (all countries) Obligatory (all countries) Obligatory (all countries) Obligatory (all countries)
Helmet wearing: - Motor riders: Obligatory - Moped riders: Obligatory - Cyclists: not obligatory
Obligatory (all countries) Obligatory (all countries) Not obligatory (46%)
Sources: [1] EC DG-Move, 2016
Enforcement Table 9: Effectiveness of enforcement effort in Portugal according to an international respondent consensus (scale = 0-10)
Issue Score for Portugal
Most common in EU (% of countries)
Speed legislation enforcement 7 7 (43%)
Seat-belt law enforcement 8 7 (25%) and 8 (25%)
Child restraint law enforcement 8 8 (39%)
Helmet legislation enforcement 9 9 (50%)
Drink-driving law enforcement 7 8 (43%) Source: WHO, 2015
2 Blood Alcohol Concentration
Regulations in Portugal are similar to the regulations in
most other EU countries.
Effectiveness of enforcement in Portugal is at the level of
most EU countries.

Road Safety Country Overview - PORTUGAL
- 7 -
Road User Education and Training Table 10: Road user education and training in Portugal compared to the situation in other EU countries
Education and training in Portugal Most common in EU (% of countries)
General education programmes:
- Primary school: compulsory - Secondary school: voluntary - Other groups: no information.
Compulsory (71%) Compulsory (43%) -
Driving licences thresholds:
- Passenger car: 18 years - Motorised two wheeler: mopeds: 16 years, motorcycles: 18 years - Buses and coaches: 21 years - Lorries and trucks: 18 years
18 years (79%) 18 years (low categories) and higher ages (32%) 21 years (86%) 21 years (75%)
Sources: [1] ROSE25, 2005; [2] ETSC, 2011; [3] national sources
Public Campaigns Table 11: Public campaigns in Portugal compared to the situation in other EU countries
Campaigns in Portugal Most common issues in EU
(% of countries)
Organisation: - ANSR - ACA-M - Police Authorities (GNR and PSP) - Local Authorities - Directorate of Health - NGOs
Main themes: - Drink-driving - Seat-belt - Speeding - Fatigue - Young people - Vulnerable road users
Drink-driving (96%) Speeding (86%) Seat-belt (79%)
Sources: [1] SUPREME, 2005; [2] ETSC, 2011; [3] national sources
Vehicles and technology (national developments) Table 12: Developments of vehicles and technology in Portugal, compared to the situation in other EU countries
Mandatory technical inspections: Most common in EU
(% of countries)
Passenger cars: 4-2-2-1-1-1 years etc. Every 12 months (39%) Motorcycles: not mandatory Every 24 months (32%)
Buses or coaches: every year for 7 years, thereafter every 6 months
Every 12 months (61%)
Lorries or trucks: every year for 7 years, thereafter every 6 months
Every 12 months (68%)
Sources: EC website, national sources
Mandatory inspection periods
in Portugal are somewhat shorter for older
buses/coaches and lorries/trucks than the most common periods in the EU.
Portugal has compulsory road safety education at primary
schools and voluntary education at secondary
schools.

Road Safety Country Overview - PORTUGAL
- 8 -
Road Safety Performance Indicators Speed Table 13: Number of speed tickets per population in Portugal versus the EU average
Measure 2006 2014 Average annual change
EU average (2014)
Number of speed tickets/1.000 population
9 25 13,6% 94
Sources: [1] ETSC, 2010; [2] ETSC, 2015
Table 14: Percentage of speed offenders per road type in Portugal compared to the EU average
Road type 2004 2012 Average annual change
EU average
Motorways 54% 45% -2,3% n/a
Rural roads 82% n/a - n/a
Urban roads 38% n/a - n/a Sources: [1] ETSC, 2010; [2] ETSC, 2015
Table 15: Mean speed per road type in Portugal compared to the EU average
Road type 2004 2012 Average annual change
EU average
Motorways 121 km/h 118 km/h -0,3% n/a
Rural roads 106 km/h n/a - n/a
Urban roads 45 km/h n/a - n/a Sources: [1] ETSC, 2010; [2] ETSC, 2015
Alcohol Table 16: Road side surveys for drink-driving in Portugal compared to the EU average
Measure 2006 2013 Average annual change
EU average (2013)
Amount of tests/1.000 population
48 149 17,6% 201,6
% tested over the limit 7,3% 3,8%* -15,1% 2,1%
Sources: [1] ETSC, 2010; [2] ETSC, 2015 *Data from 2010
The number of speed tickets per population in Portugal is
much lower than the EU average.
The amount of alcohol tests per population in 2013 was almost three times higher
than that of 2006.

Road Safety Country Overview - PORTUGAL
- 9 -
Vehicles Table 17: State of the vehicle fleet in Portugal compared to the EU average
Vehicles EU average
Cars per age group (2012) [1]: Passenger cars (2012) - ≤2 years: 6% - 3 to 5 years: 15% - 6 to 10 years: 23% - >10 years: 57%
≤2 years: 9% 3 to 5 years: 13%
6 to 10 years: 28% >10 years: 49%
EuroNCAP occupant protection score of cars (new cars sold in 2013) [2]: - 5 stars: 54,2% - 4 stars: 3,5% - 3 stars: 2,7% - 2 stars: 0,4% - not tested: 39,1%
5 stars: 52,5% 4 stars: 4,5% 3 stars: 2,9% 2 stars 0,5%
not tested: 39,6%3 Source: [1] EUROSTAT, 2015; [2] ETSC, 2016 Protective systems Table 18: Protective system use in Portugal versus the average in EU Protective systems EU average4 Daytime seat-belt wearing in cars and vans (2013) [1]:
(2015)
- 96% front - no information on % driver - no information on % front passenger - 77% rear - 94% child restraint systems
89,7% front not available not available 69,5% rear
not available Helmet use (2010) [2]: - 94% motorcycle drivers - 94% motorcycle passengers - no information on % cyclists
not available
Sources: [1] IRTAD, 2016; [2] WHO, 2013
3 Based on data of 25 EU countries (excl. HR, LU and MT). 4 Based on data of 15 EU countries; data of AT, BE, IE, IT, LU, HU, FI, SE (2015); data of CZ, DE, DK, HR, LT, PL, UK (2014); data of PT (2013)
The vehicle fleet in Portugal has a bit higher EuroNCAP occupant protection score
than the EU average.
Helmet wearing rate is very high in Portugal; seat-belt
wearing rates are also higher than the EU average.

Road Safety Country Overview - PORTUGAL
- 10 -
Road Safety Outcomes General positioning The fatality rate of Portugal is higher than the EU average (around 61 fatalities per million population in 2014). The Portuguese fatality rate and the EU average rate have shown similar developments from 2006 to 2009 and from 2012 to 2014. Figure 1: Fatalities per million inhabitants in 2014 with EU average
Sources: CARE, Eurostat
Figure 2: Development of fatalities per million inhabitants between 2001 and 2014 for Portugal and the EU average
Sources: CARE, Eurostat
The fatality rate of Portugal is
higher than the EU average. The Portuguese fatality rate
and the EU average rate have shown similar developments from 2006 to 2009 and from
2012 to 2014.

Road Safety Country Overview - PORTUGAL
- 11 -
Transport mode The shares of moped, lorry and truck occupant fatalities are higher than the EU average. While the average annual reduction of cyclist fatalities between 2001 and 2014 was only 3%, it was 8% for car occupants. In the same period, the annual reduction rates of pedestrian and motorcyclist fatalities were 6% and 7% respectively. Table 19: Reported fatalities by mode of road transport in Portugal compared to the EU average
Transport mode 2001 2014 Average annual change
Share in 2014
EU average (2014)
Pedestrians 337 145 -6% 23% 22%
Car occupants 636 223 -8% 35% 45%
Motorcyclists 229 91 -7% 14% 15%
Mopeds 184 43 -11% 7% 3%
Cyclists 50 35 -3% 5% 8%
Bus/coach occupants
29 2 -18% 0% 1%
Lorries or truck occupants
166 57 -8% 9% 5%
Sources: CARE, national sources
Age, gender and nationality Table 20: Reported fatalities by age, gender and nationality in Portugal versus the EU average
Age and gender 2001 2014 Average annual change
Share in 2014
EU average (2014)
Females
0 - 14 years 23 3 -14% 0% 1% 15 – 17 years 13 3 -10% 0% 1% 18 – 24 years 55 11 -12% 2% 3% 25 – 49 years 98 28 -9% 4% 6% 50 – 64 years 64 28 -6% 4% 4% 65+ years 103 61 -4% 10% 9% Males
0 - 14 years 33 5 -14% 1% 1% 15 – 17 years 42 8 -12% 1% 2% 18 – 24 years 274 42 -13% 7% 12% 25 – 49 years 528 187 -8% 29% 29% 50 – 64 years 178 116 -3% 18% 15% 65+ years 218 144 -3% 23% 16% Nationality of driver or rider killed
National n/a 328 n/a 51% n/a
Non-national n/a 310 n/a 49% n/a Sources: CARE, national sources
The shares of moped, lorry and truck occupant fatalities
are higher than the EU average.
Portugal has a somewhat higher share of male road
fatalities than the EU average. Half of the all fatalities are
non-nationals.

Road Safety Country Overview - PORTUGAL
- 12 -
Location Fatalities in built-up areas are over-represented in Portugal compared to the EU average. Table 21: Reported fatalities by location in Portugal compared to the EU average
Location 2001 2014 Average annual change
Share in 2014
EU average (2014)
Built-up areas 720 347 -5% 54% 38% Rural areas 839 241 -9% 38% 54% Motorways 112 50 -6% 8% 7% Junctions 236 111 -6% 17% 19%
Sources: CARE, national sources
Lighting and weather conditions Table 22: Reported fatalities by lighting and weather conditions in Portugal compared to the EU average
Conditions 2001 2014 Average annual change
Share in 2014
EU average (2014)
Lightning conditions
During daylight 925 400 -6% 63% 49% During night-time 743 201 -10% 32% 30% Weather conditions
While raining 275 113 -7% 18% 9% Sources CARE, national sources
Single vehicle accidents Table 23: Reported fatalities by type in Portugal compared to the EU average
Accident Type 2001 2014 Average annual change
Share in 2014
EU average (2014)
Single vehicle accidents
580 237 -7% 37% 28%
Sources: CARE, national sources
Under-reporting of casualties - Fatalities: 100%, due to improvements of the data recording systems. - Hospitalised: no studies with quantitative information exist.
Fatalities in built-up areas are over-represented in Portugal.
The share of fatal single
vehicle accidents in Portugal is higher than the EU average.

Road Safety Country Overview - PORTUGAL
- 13 -
Risk Figures Figure 3: Fatalities by vehicle type in Portugal in 2014
Sources CARE, IRTAD; Number of registered mopeds and mofas was not available, Total = all motor vehicles excluding mopeds and mofas Figure 4: Fatalities by million inhabitants in Portugal in 2014
Sources: CARE, EUROSTAT
In Portugal, risk is high for
motorcyclists and the elderly.
Road Safety Country Overview - PORTUGAL
- 14 -
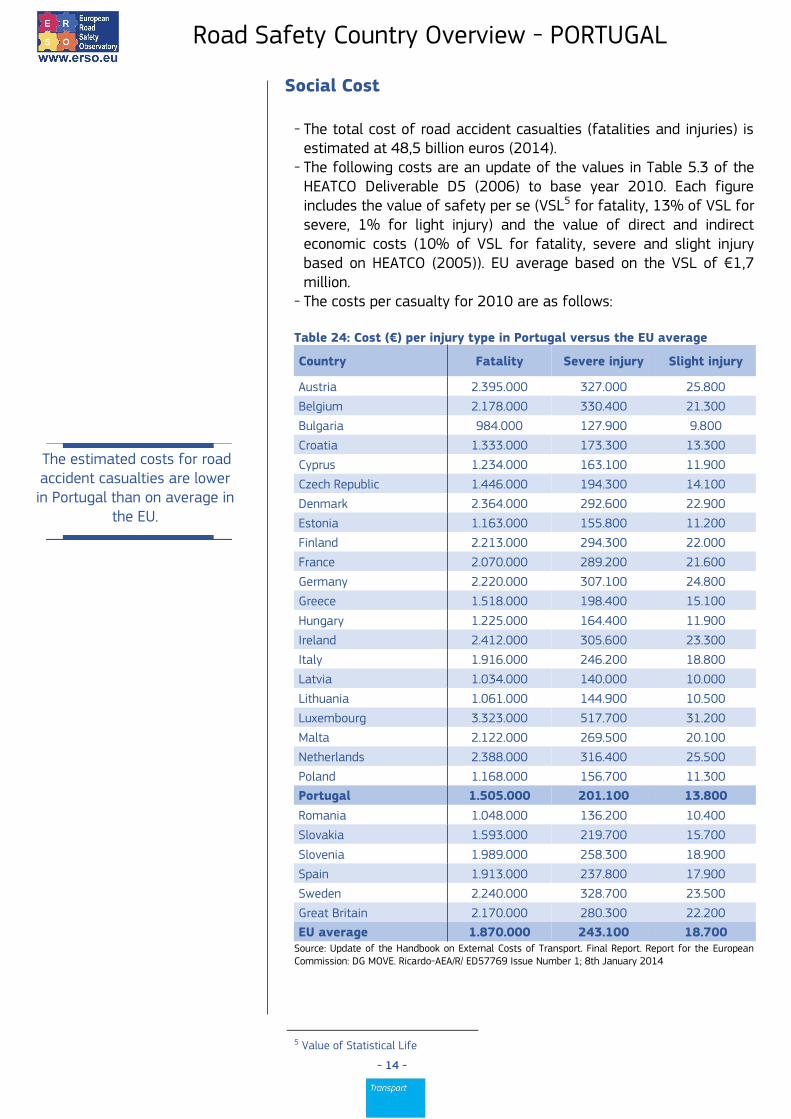
Social Cost - The total cost of road accident casualties (fatalities and injuries) is
estimated at 48,5 billion euros (2014). - The following costs are an update of the values in Table 5.3 of the
HEATCO Deliverable D5 (2006) to base year 2010. Each figure includes the value of safety per se (VSL5 for fatality, 13% of VSL for severe, 1% for light injury) and the value of direct and indirect economic costs (10% of VSL for fatality, severe and slight injury based on HEATCO (2005)). EU average based on the VSL of €1,7 million.
- The costs per casualty for 2010 are as follows: Table 24: Cost (€) per injury type in Portugal versus the EU average
Country Fatality Severe injury Slight injury
Austria 2.395.000 327.000 25.800
Belgium 2.178.000 330.400 21.300
Bulgaria 984.000 127.900 9.800
Croatia 1.333.000 173.300 13.300
Cyprus 1.234.000 163.100 11.900
Czech Republic 1.446.000 194.300 14.100
Denmark 2.364.000 292.600 22.900
Estonia 1.163.000 155.800 11.200
Finland 2.213.000 294.300 22.000
France 2.070.000 289.200 21.600
Germany 2.220.000 307.100 24.800
Greece 1.518.000 198.400 15.100
Hungary 1.225.000 164.400 11.900
Ireland 2.412.000 305.600 23.300
Italy 1.916.000 246.200 18.800
Latvia 1.034.000 140.000 10.000
Lithuania 1.061.000 144.900 10.500
Luxembourg 3.323.000 517.700 31.200
Malta 2.122.000 269.500 20.100
Netherlands 2.388.000 316.400 25.500
Poland 1.168.000 156.700 11.300
Portugal 1.505.000 201.100 13.800
Romania 1.048.000 136.200 10.400
Slovakia 1.593.000 219.700 15.700
Slovenia 1.989.000 258.300 18.900
Spain 1.913.000 237.800 17.900
Sweden 2.240.000 328.700 23.500
Great Britain 2.170.000 280.300 22.200
EU average 1.870.000 243.100 18.700 Source: Update of the Handbook on External Costs of Transport. Final Report. Report for the European Commission: DG MOVE. Ricardo-AEA/R/ ED57769 Issue Number 1; 8th January 2014
5 Value of Statistical Life
The estimated costs for road accident casualties are lower in Portugal than on average in
the EU.

Road Safety Country Overview - PORTUGAL
- 15 -
Synthesis
Safety position - The fatality rate of Portugal is higher than the EU average (around
61 fatalities per million population in 2014). Scope of problem - In Portugal, relative many moped riders and truck occupants died in
road accidents compared to the EU average. - Portugal has a somewhat higher share of male road fatalities than
the EU average. - Fatalities in built-up areas, during daylight and while raining are over-
represented in Portugal. - The number of speed tickets per population in Portugal is much lower
than the EU average. Recent progress - The Portuguese fatality rate and the EU average rate have shown
similar developments from 2006 to 2009 and from 2012 to 2014. - The percentage of speed offenders in Portugal has decreased on
motorways between 2001 and 2004. - The amount of alcohol tests per population in 2013 was almost three
times higher than that of 2006. Remarkable road safety policy issues - The new National Road Safety Strategy, “PENSE 2016-2020” is being
developed. - High risk site treatment is obligatory in Portugal. - Effectiveness of enforcement in Portugal is at the level of most EU
countries. - Helmet wearing rate is very high in Portugal; seat-belt wearing rates
are also higher than the EU average. - Mandatory inspection periods in Portugal are somewhat shorter for
older buses/coaches and lorries/trucks than the most common periods in the EU.
The new National Road Safety Strategy, “PENSE
2016-2020” is being developed.

Road Safety Country Overview - PORTUGAL
- 16 -
References
1. CARE database (2016). 2. CIA database (2016). 3. DG-TREN (2010). Technical Assistance in support of the Preparation of the
European Road Safety Action Program 2011-2020. Final Report. DG-TREN, Brussels.
4. European Commission website (2016). http://europa.eu/youreurope/citizens/vehicles/registration/formalities/index_en.htm
5. European Commission DG Move website (2016). http://ec.europa.eu/transport/road_safety/index_en.htm
6. ETSC (2009). Boost the market for safer cars across Europe. + Background tables PIN Flash no. 13. ETSC, Brussels.
7. ETSC (2010). Road Safety Target in Sight: Making up for lost time. + Background tables 4th Road Safety PIN report. ETSC, Brussels.
8. ETSC (2014). Ranking EU progress on car occupant safety. + Background tables PIN Flash no. 27. ETSC, Brussels.
9. ETSC (2015). Enforcement in the EU-Vision 2020. + Background tables. ETSC, Brussels.
10. ETSC (2015). Making walking and cycling on Europe's roads safer. + Background tables PIN Flash no. 29. ETSC, Brussels.
11. ETSC (2015). Ranking EU progress on improving motorway safety. + Background tables PIN Flash no. 28. ETSC, Brussels.
12. ETSC (2016). How safe are the new cars sold in the EU? An analysis of the market penetration of Euro NCAP-rated cars. + Background tables PIN Flash no. 30. ETSC, Brussels.
13. ETSC (2016). How traffic law enforcement can contribute to safer roads. + Background tables PIN Flash no. 31. ETSC, Brussels.
14. Eurostat database (2016). 15. European Commission (2014). Handbook on External Costs of Transport. Final
Report. Ricardo-AEA/R/ ED57769 Issue Number 1; 8th January 2014. 16. European Commission (2015). Road Safety in the European Union: Trends,
statistics and main challenges. European Commission, Mobility and Transport DG, Brussels.
17. National Sources (2016): via national CARE experts and official national sources of statistics.
18. OECD/ITF (2014). Road Safety Annual Report 2014. OECD Publishing, Paris. 19. OECD/ITF (2015). Road Safety Annual Report 2015. OECD Publishing, Paris. 20. OECD/ITF (2015). Road Infrastructure Safety Management. OECD Publishing,
Paris. 21. OECD/ITF (2016). Road Safety Annual Report 2016. OECD Publishing, Paris. 22. ROSE25 (2005). Inventory and compiling of a European good practice guide on
road safety education targeted at young people. Final report. KfV, Vienna. 23. SUPREME (2007) Final Report Part F1. Thematic Report: Education and
Campaigns. European Commission, Brussels. 24. Torfs, K., Meesmann, U., Van den Berghe, W., & Trotta M., (2016). ESRA 2015 –
The results. Synthesis of the main findings from the ESRA survey in 17 countries. ESRA project (European Survey of Road users’ safety Attitudes). Belgian Road Safety Institute, Brussels.
25. WHO (2013). Global status report on road safety 2013: supporting a decade of action. World Health Organisation, Geneva.
26. WHO (2015) Global status report on road safety 2015. World Health Organisation, Geneva.
27. UNECE database (2016).

Road Safety Country Overview - PORTUGAL
- 17 -
Notes
1. Country abbreviations
Belgium BE Italy IT Romania RO
Bulgaria BG Cyprus CY Slovenia SI
Czech Republic CZ Latvia LV Slovakia SK
Denmark DK Lithuania LT Finland FI
Germany DE Luxembourg LU Sweden SE
Estonia EE Hungary HU United Kingdom UK
Ireland IE Malta MT
Greece EL Netherlands NL Iceland IS
Spain ES Austria AT Liechtenstein LI
France FR Poland PL Norway NO
Croatia HR Portugal PT Switzerland CH
2. Sources: CARE (Community database on road accidents), EUROSTAT, ITF-IRTAD, National sources. The full glossary of definitions of variables used in this Report is available at: http://ec.europa.eu/transport/road_safety/pdf/statistics/cadas_glossary.pdf 3. Data available in September 2016. 4. Average annual change is calculated with the power function between the first and last years: [aac = (b/a)1/n-1, where aac: annual average change, a: first year value, b: last year value, n: number of years]. 5. Explanation of symbols in Tables: n/a: not available "-": not applicable (e.g. calculation cannot be performed) 6. This 2016 edition of Road Safety Country Overviews updates the previous version produced in 2012 within the EU co-funded research project DaCoTA. 7. Disclaimer This report has been produced by the National Technical University of Athens (NTUA), the Austrian Road Safety Board (KFV) and the European Union Road Federation (ERF) under a contract with the European Commission. Whilst every effort has been made to ensure that the information presented in this report is relevant, accurate and up-to-date, the Partners cannot accept any liability for any error or omission, or reliance on part or all of the content in another context. Any information and views set out in this report are those of the author(s) and do not necessarily reflect the official opinion of the Commission. The Commission does not guarantee the accuracy of the data included in this study. Neither the Commission nor any person acting on the Commission’s behalf may be held responsible for the use that may be made of the information contained therein. 8. Please refer to this Report as follows: European Commission, Road Safety Country Overview - Portugal, European Commission, Directorate General for Transport, September 2016.