Embed Size (px)
Citation preview
October 12, 2018
PORTUGAL
ECONOMICS & STATE FUNDING

Portugal has turned the corner from the European crisis, with economicrebalancing and structural reforms underpinning the recovery
Source: EC, IGCP
2
Executive summary
1. Economic revitalization, following a sustained recovery in the past 4 years. Currently, Portugal stands as one of the fastest-growing economies of the EA
2. Strong growth foundations led to the correction of macroeconomic imbalances, resulting in successive current and capital account surpluses since 2013
3. Private sector turnaround, following an extensive deleveraging process and balance sheet strengthening
4. Fiscal stabilization, based on sizable fiscal adjustments, successive primary surplus and lower interest charges, resulting in a sustained downward trend of GG debt
5. Resilient public debt structure, enhancing shock-absorptive capacities
6. Improving market conditions, based on lower financing costs and broadening investor base
Outline
2
6
10
14
18
-15
-10
-5
0
5
1995 1998 2001 2004 2007 2010 2013 2016 2019
% la
bo
ur
forc
e
% G
DP
Current account balance (LHS)Primary balance (LHS)Primary balance, excl BES/Banif resolutions (LHS)Unemployment rate (RHS)
Boom Slump CrisisBalancedGrowth
EC f
ore
cast
s
Outline
3
1.
1. Economic revitalization
2. Stronger growth foundations
3. Private sector turnaround
4. Fiscal stabilization
5. Resilient public debt structure
6. Improving market conditions
1.
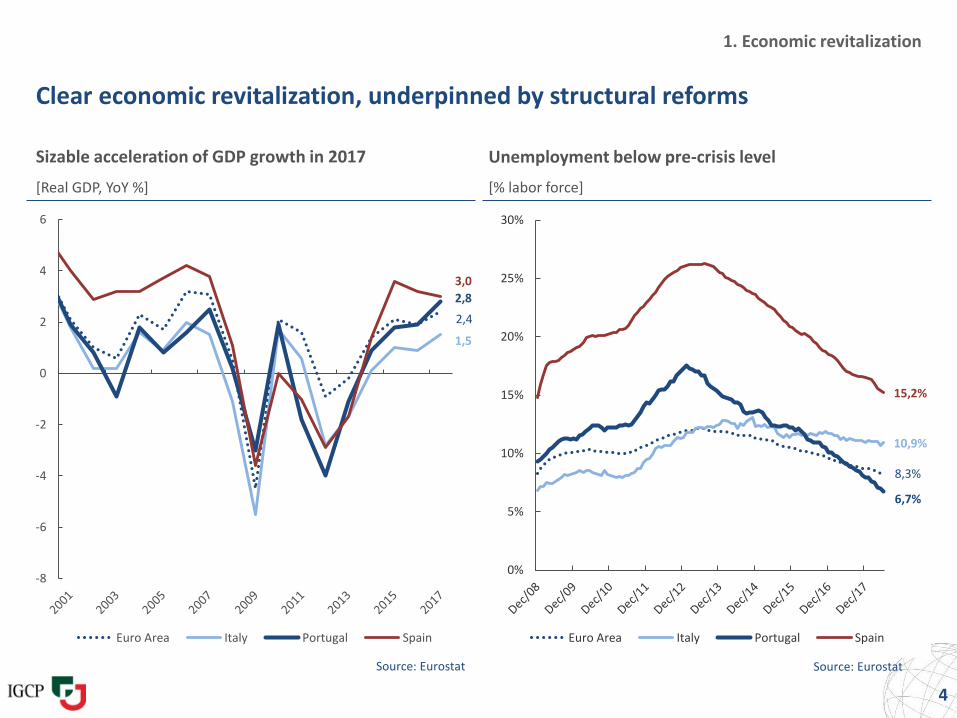
1. Economic revitalization
Clear economic revitalization, underpinned by structural reforms
Source: Eurostat
4
[Real GDP, YoY %]
Unemployment below pre-crisis level
[% labor force]
Source: Eurostat
Sizable acceleration of GDP growth in 2017
2,4
1,5
2,8
3,0
-8
-6
-4
-2
0
2
4
6
Euro Area Italy Portugal Spain
8,3%
10,9%
6,7%
15,2%
0%
5%
10%
15%
20%
25%
30%
Euro Area Italy Portugal Spain
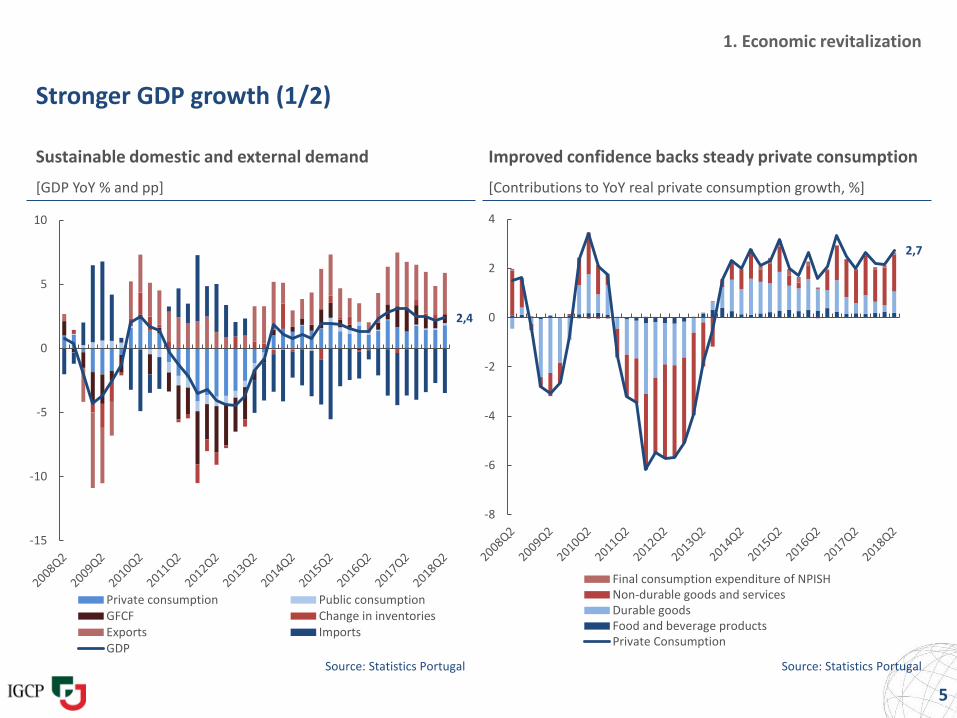
1. Economic revitalization
Stronger GDP growth (1/2)
[GDP YoY % and pp] [Contributions to YoY real private consumption growth, %]
Source: Statistics Portugal Source: Statistics Portugal
5
Sustainable domestic and external demand Improved confidence backs steady private consumption
2,4
-15
-10
-5
0
5
10
Private consumption Public consumptionGFCF Change in inventoriesExports ImportsGDP
2,7
-8
-6
-4
-2
0
2
4
Final consumption expenditure of NPISHNon-durable goods and servicesDurable goodsFood and beverage productsPrivate Consumption
1. Economic revitalization
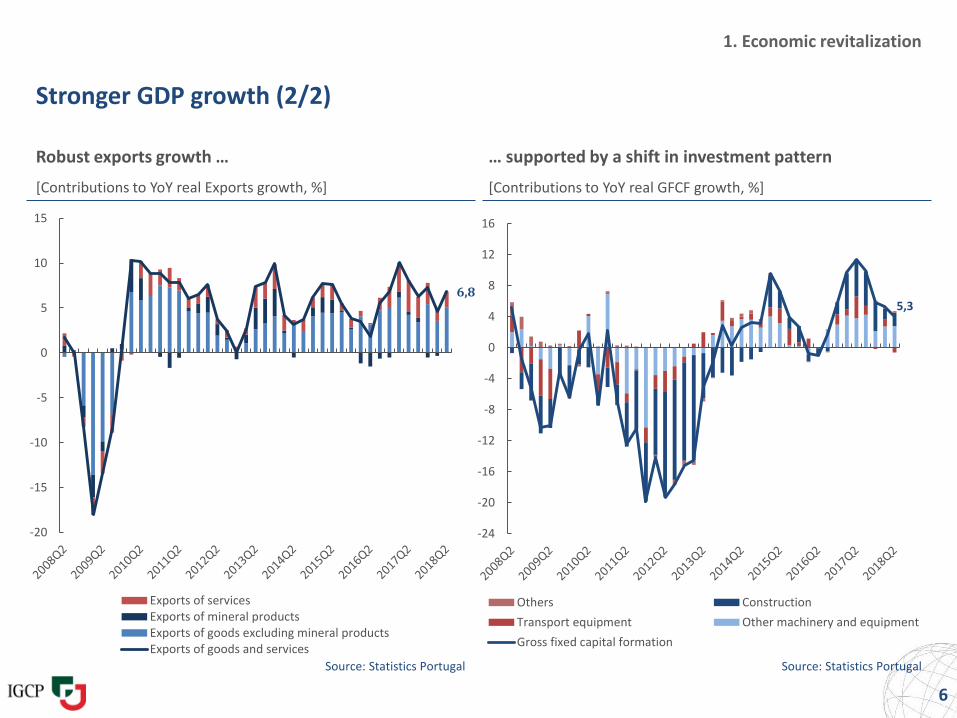
Stronger GDP growth (2/2)
Robust exports growth … … supported by a shift in investment pattern
[Contributions to YoY real Exports growth, %] [Contributions to YoY real GFCF growth, %]
Source: Statistics Portugal Source: Statistics Portugal
6
6,8
-20
-15
-10
-5
0
5
10
15
Exports of servicesExports of mineral productsExports of goods excluding mineral productsExports of goods and services
5,3
-24
-20
-16
-12
-8
-4
0
4
8
12
16
Others Construction
Transport equipment Other machinery and equipment
Gross fixed capital formation
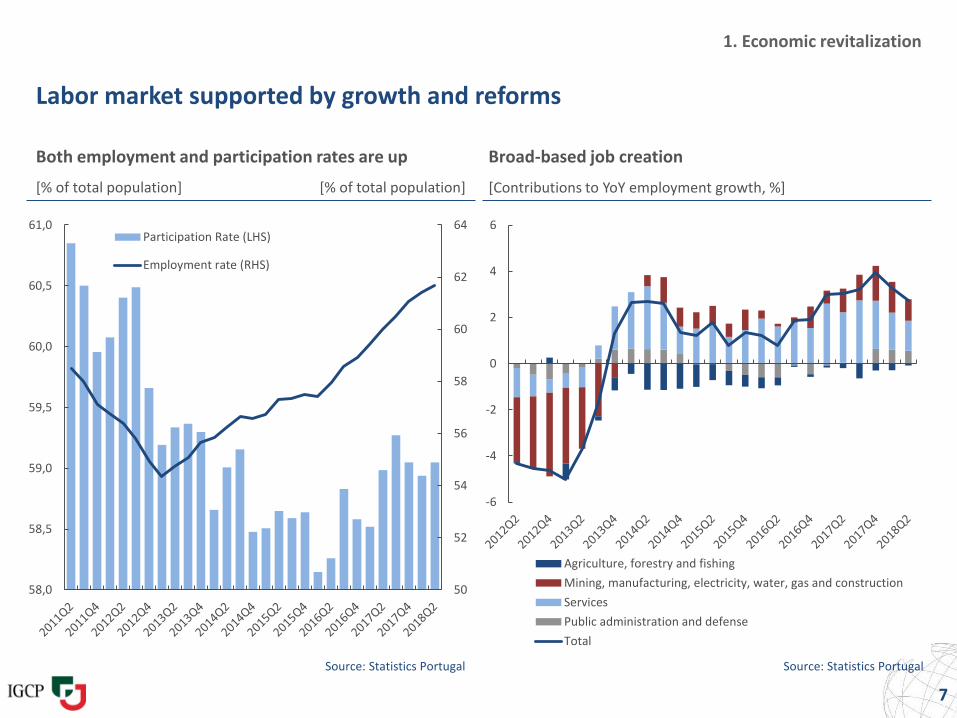
Labor market supported by growth and reforms
Broad-based job creation
[% of total population] [Contributions to YoY employment growth, %]
7
1. Economic revitalization
Both employment and participation rates are up
Source: Statistics Portugal Source: Statistics Portugal
[% of total population]
-6
-4
-2
0
2
4
6
Agriculture, forestry and fishing
Mining, manufacturing, electricity, water, gas and construction
Services
Public administration and defense
Total
50
52
54
56
58
60
62
64
58,0
58,5
59,0
59,5
60,0
60,5
61,0Participation Rate (LHS)
Employment rate (RHS)
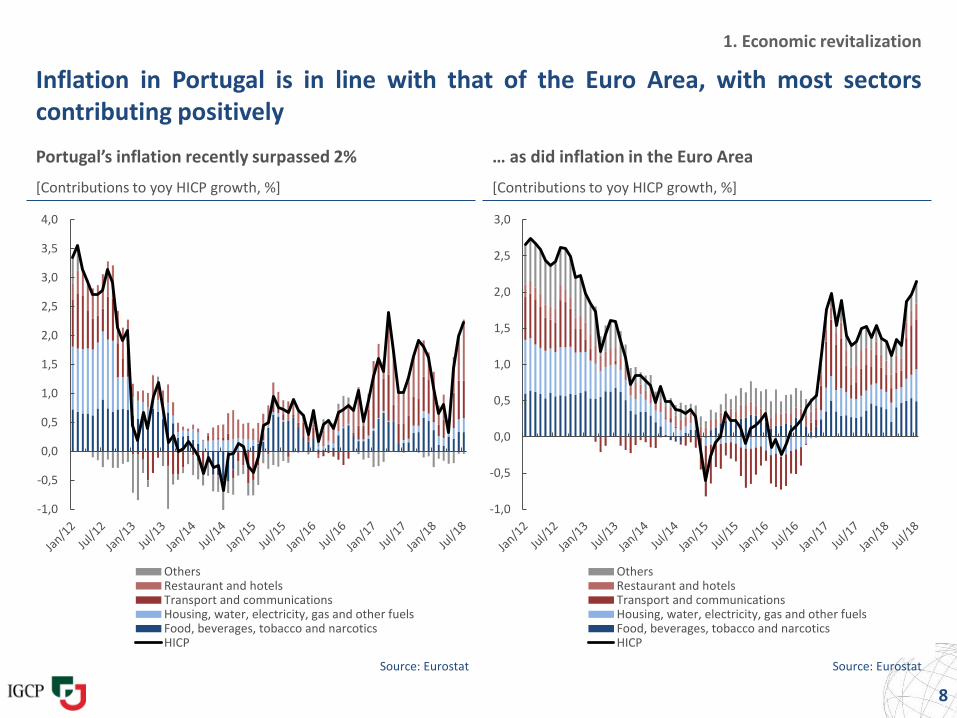
Inflation in Portugal is in line with that of the Euro Area, with most sectorscontributing positively
Portugal’s inflation recently surpassed 2% … as did inflation in the Euro Area
[Contributions to yoy HICP growth, %]
Source: Eurostat Source: Eurostat
8
1. Economic revitalization
[Contributions to yoy HICP growth, %]
-1,0
-0,5
0,0
0,5
1,0
1,5
2,0
2,5
3,0
OthersRestaurant and hotelsTransport and communicationsHousing, water, electricity, gas and other fuelsFood, beverages, tobacco and narcoticsHICP
-1,0
-0,5
0,0
0,5
1,0
1,5
2,0
2,5
3,0
3,5
4,0
OthersRestaurant and hotelsTransport and communicationsHousing, water, electricity, gas and other fuelsFood, beverages, tobacco and narcoticsHICP
1. Economic revitalization
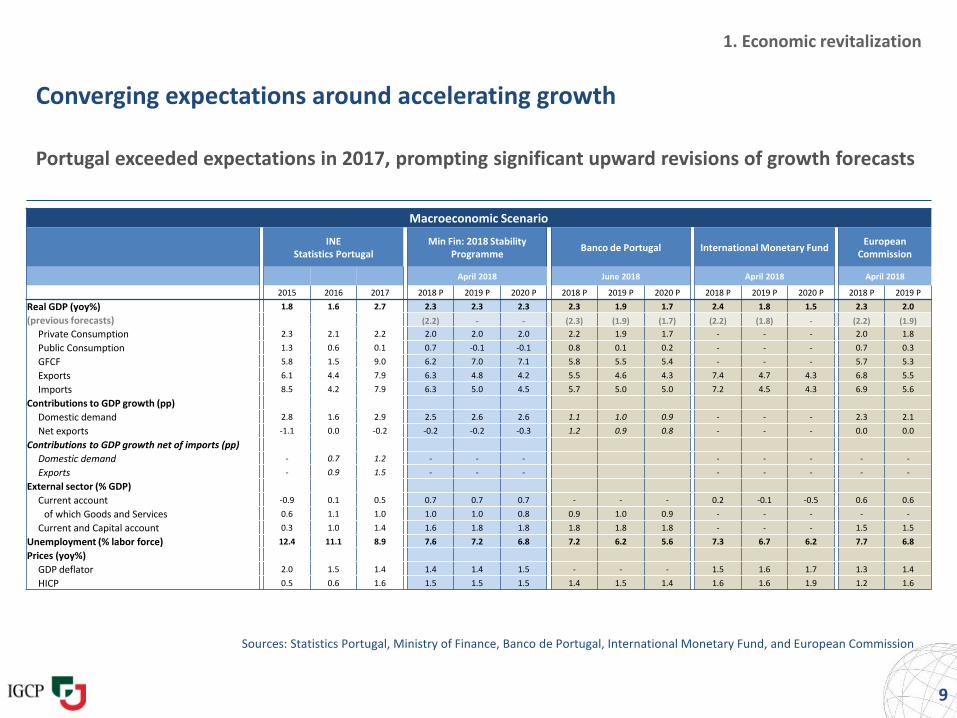
Converging expectations around accelerating growth
Portugal exceeded expectations in 2017, prompting significant upward revisions of growth forecasts
Sources: Statistics Portugal, Ministry of Finance, Banco de Portugal, International Monetary Fund, and European Commission
9
Macroeconomic Scenario
INEStatistics Portugal
Min Fin: 2018 Stability Programme
Banco de Portugal International Monetary FundEuropean
Commission
April 2018 June 2018 April 2018 April 2018
2015 2016 2017 2018 P 2019 P 2020 P 2018 P 2019 P 2020 P 2018 P 2019 P 2020 P 2018 P 2019 P
Real GDP (yoy%) 1.8 1.6 2.7 2.3 2.3 2.3 2.3 1.9 1.7 2.4 1.8 1.5 2.3 2.0
(previous forecasts) (2.2) - - (2.3) (1.9) (1.7) (2.2) (1.8) - (2.2) (1.9)
Private Consumption 2.3 2.1 2.2 2.0 2.0 2.0 2.2 1.9 1.7 - - - 2.0 1.8
Public Consumption 1.3 0.6 0.1 0.7 -0.1 -0.1 0.8 0.1 0.2 - - - 0.7 0.3
GFCF 5.8 1.5 9.0 6.2 7.0 7.1 5.8 5.5 5.4 - - - 5.7 5.3
Exports 6.1 4.4 7.9 6.3 4.8 4.2 5.5 4.6 4.3 7.4 4.7 4.3 6.8 5.5
Imports 8.5 4.2 7.9 6.3 5.0 4.5 5.7 5.0 5.0 7.2 4.5 4.3 6.9 5.6
Contributions to GDP growth (pp)
Domestic demand 2.8 1.6 2.9 2.5 2.6 2.6 1.1 1.0 0.9 - - - 2.3 2.1
Net exports -1.1 0.0 -0.2 -0.2 -0.2 -0.3 1.2 0.9 0.8 - - - 0.0 0.0
Contributions to GDP growth net of imports (pp)
Domestic demand - 0.7 1.2 - - - - - - - -
Exports - 0.9 1.5 - - - - - - - -
External sector (% GDP)
Current account -0.9 0.1 0.5 0.7 0.7 0.7 - - - 0.2 -0.1 -0.5 0.6 0.6
of which Goods and Services 0.6 1.1 1.0 1.0 1.0 0.8 0.9 1.0 0.9 - - - - -
Current and Capital account 0.3 1.0 1.4 1.6 1.8 1.8 1.8 1.8 1.8 - - - 1.5 1.5
Unemployment (% labor force) 12.4 11.1 8.9 7.6 7.2 6.8 7.2 6.2 5.6 7.3 6.7 6.2 7.7 6.8
Prices (yoy%)
GDP deflator 2.0 1.5 1.4 1.4 1.4 1.5 - - - 1.5 1.6 1.7 1.3 1.4
HICP 0.5 0.6 1.6 1.5 1.5 1.5 1.4 1.5 1.4 1.6 1.6 1.9 1.2 1.6
Outline
10
1.
1. Economic revitalization
2. Stronger growth foundations
3. Private sector turnaround
4. Fiscal stabilization
5. Resilient public debt structure
6. Improving market conditions
2.
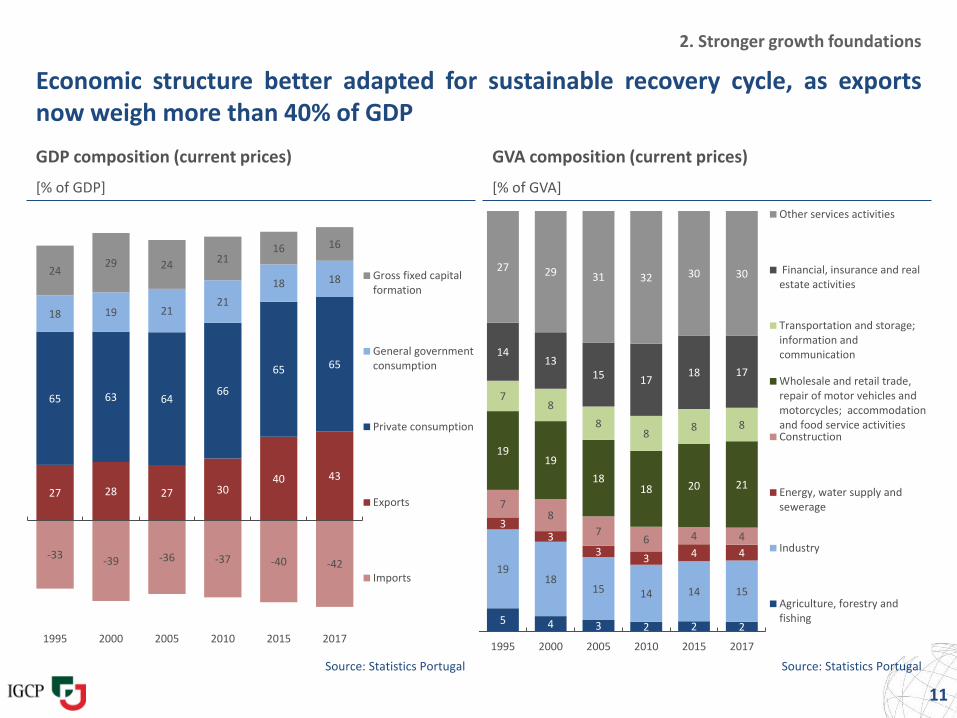
Economic structure better adapted for sustainable recovery cycle, as exportsnow weigh more than 40% of GDP
GDP composition (current prices) GVA composition (current prices)
[% of GDP] [% of GVA]
Source: Statistics Portugal Source: Statistics Portugal
11
2. Stronger growth foundations
-33-39 -36 -37 -40 -42
27 28 27 3040 43
65 63 6466
65 65
18 19 2121
18 1824
29 24 2116 16
1995 2000 2005 2010 2015 2017
Gross fixed capitalformation
General governmentconsumption
Private consumption
Exports
Imports
5 4 3 2 2 2
1918
15 14 14 15
33
33 4 4
78
76 4 4
1919
1818 20 21
78
88
8 8
1413
15 1718 17
27 29 31 32 30 30
1995 2000 2005 2010 2015 2017
Other services activities
Financial, insurance and realestate activities
Transportation and storage;information andcommunication
Wholesale and retail trade,repair of motor vehicles andmotorcycles; accommodationand food service activitiesConstruction
Energy, water supply andsewerage
Industry
Agriculture, forestry andfishing
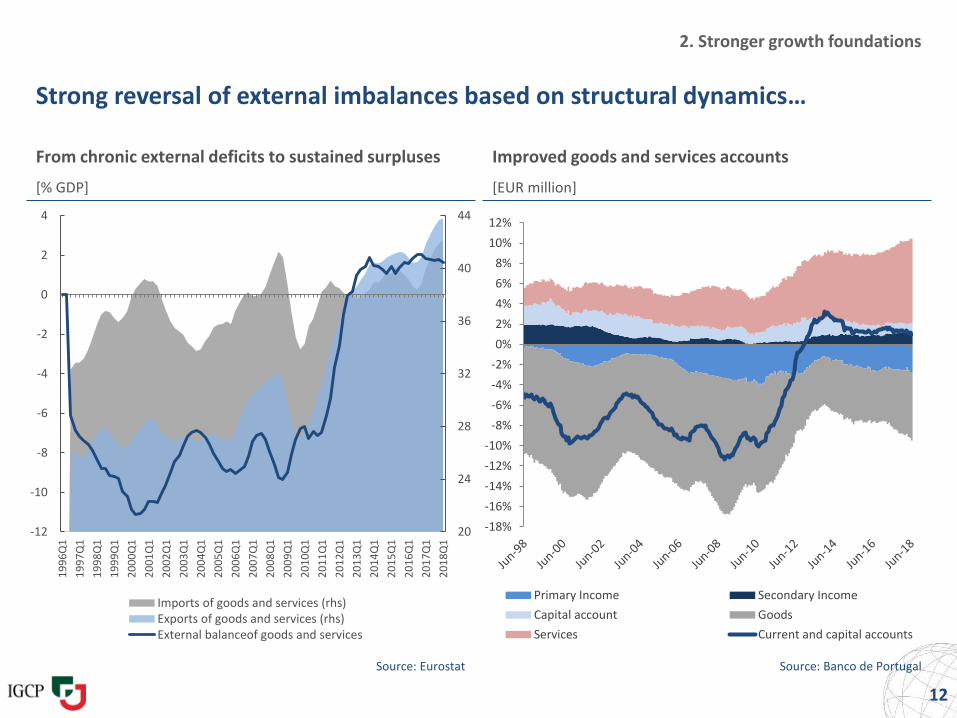
2. Stronger growth foundations
Strong reversal of external imbalances based on structural dynamics…
From chronic external deficits to sustained surpluses Improved goods and services accounts
[% GDP] [EUR million]
12
Source: Eurostat Source: Banco de Portugal
-18%
-16%
-14%
-12%
-10%
-8%
-6%
-4%
-2%
0%
2%
4%
6%
8%
10%
12%
Primary Income Secondary Income
Capital account Goods
Services Current and capital accounts
20
24
28
32
36
40
44
-12
-10
-8
-6
-4
-2
0
2
4
19
96
Q1
19
97
Q1
19
98
Q1
19
99
Q1
20
00
Q1
20
01
Q1
20
02
Q1
20
03
Q1
20
04
Q1
20
05
Q1
20
06
Q1
20
07
Q1
20
08
Q1
20
09
Q1
20
10
Q1
20
11
Q1
20
12
Q1
20
13
Q1
20
14
Q1
20
15
Q1
20
16
Q1
20
17
Q1
20
18
Q1
Imports of goods and services (rhs)Exports of goods and services (rhs)External balanceof goods and services
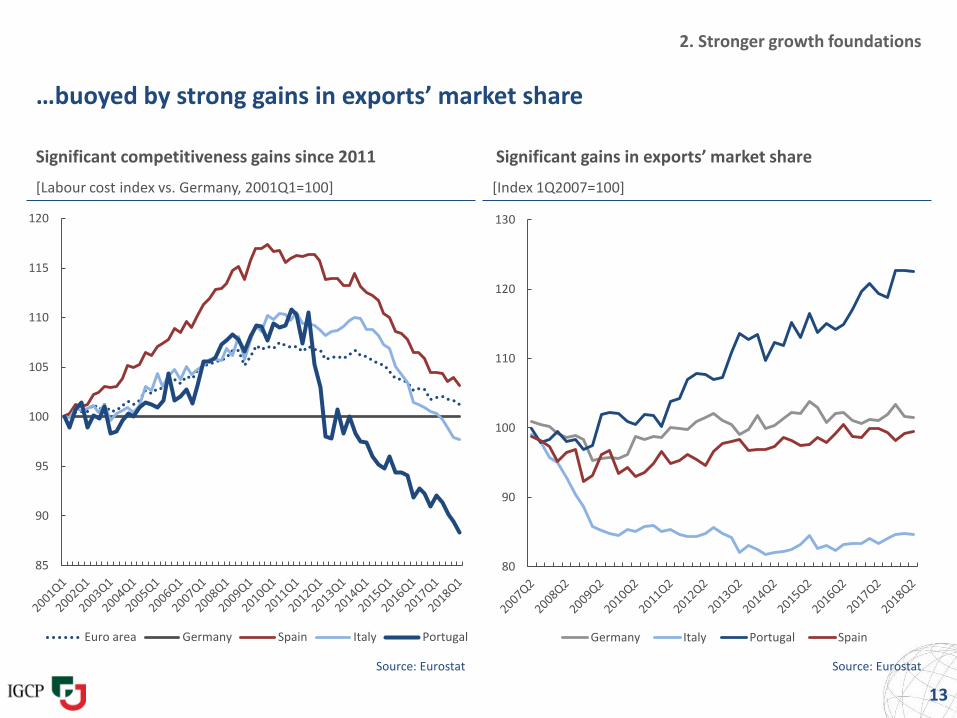
…buoyed by strong gains in exports’ market share
2. Stronger growth foundations
13
Significant gains in exports’ market share
[Index 1Q2007=100]
Source: Eurostat
[Labour cost index vs. Germany, 2001Q1=100]
Significant competitiveness gains since 2011
Source: Eurostat
85
90
95
100
105
110
115
120
Euro area Germany Spain Italy Portugal
80
90
100
110
120
130
Germany Italy Portugal Spain
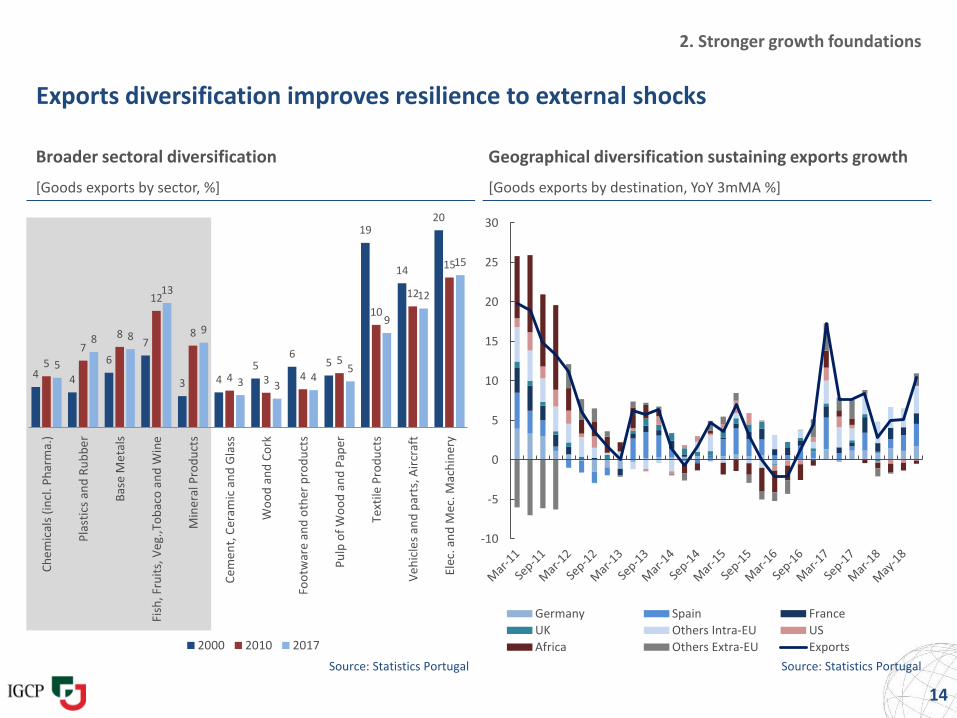
Exports diversification improves resilience to external shocks
Broader sectoral diversification
[Goods exports by sector, %]
Source: Statistics Portugal
14
2. Stronger growth foundations
Source: Statistics Portugal
Geographical diversification sustaining exports growth
[Goods exports by destination, YoY 3mMA %]
4 4
6
7
3 45
65
19
14
20
5
78
12
8
4 3 4
5
10
12
15
5
8 8
13
9
3 34
5
9
12
15
Ch
em
ical
s (i
ncl
. Ph
arm
a.)
Pla
stic
s an
d R
ub
be
r
Bas
e M
eta
ls
Fish
, Fru
its,
Ve
g.,T
ob
aco
an
d W
ine
Min
era
l Pro
du
cts
Ce
me
nt,
Cer
amic
an
d G
lass
Wo
od
an
d C
ork
Foo
twar
e an
d o
ther
pro
du
cts
Pu
lp o
f W
oo
d a
nd
Pap
er
Text
ile P
rod
uct
s
Ve
hic
les
and
par
ts, A
ircr
aft
Elec
. an
d M
ec. M
ach
iner
y
2000 2010 2017
-10
-5
0
5
10
15
20
25
30
Germany Spain France
UK Others Intra-EU US
Africa Others Extra-EU Exports
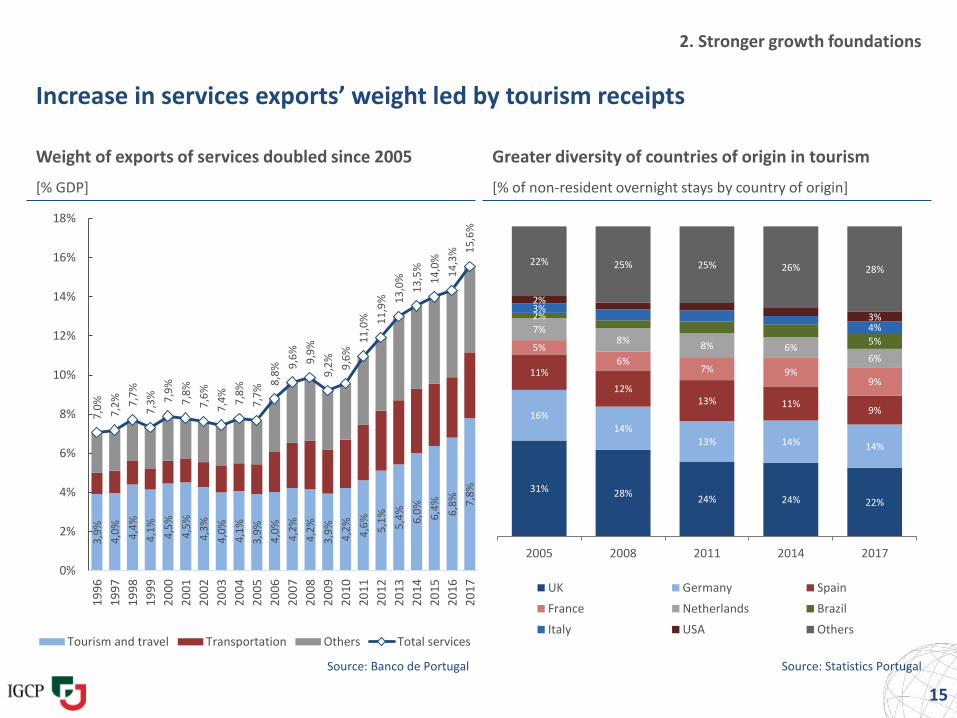
Increase in services exports’ weight led by tourism receipts
Weight of exports of services doubled since 2005 Greater diversity of countries of origin in tourism
[% GDP] [% of non-resident overnight stays by country of origin]
Source: Banco de Portugal Source: Statistics Portugal
15
2. Stronger growth foundations
31% 28%24% 24% 22%
16%14%
13% 14% 14%
11%
12%13% 11%
9%
5%
6%7% 9%
9%
7%8%
8% 6%6%
2%
5%
3%
4%
2%
3%
22% 25% 25% 26% 28%
2005 2008 2011 2014 2017
UK Germany Spain
France Netherlands Brazil
Italy USA Others
3,9
%
4,0
%
4,4
%
4,1
%
4,5
%
4,5
%
4,3
%
4,0
%
4,1
%
3,9
%
4,0
%
4,2
%
4,2
%
3,9
%
4,2
%
4,6
%
5,1
%
5,4
%
6,0
%
6,4
%
6,8
% 7,8
%
7,0
%
7,2
% 7,7
%
7,3
% 7,9
%
7,8
%
7,6
%
7,4
%
7,8
%
7,7
%
8,8
% 9,6
%
9,9
%
9,2
%
9,6
%
11
,0% 11
,9% 1
3,0
%
13
,5%
14
,0%
14
,3% 1
5,6
%
0%
2%
4%
6%
8%
10%
12%
14%
16%
18%
19
96
19
97
19
98
19
99
20
00
20
01
20
02
20
03
20
04
20
05
20
06
20
07
20
08
20
09
20
10
20
11
20
12
20
13
20
14
20
15
20
16
20
17
Tourism and travel Transportation Others Total services
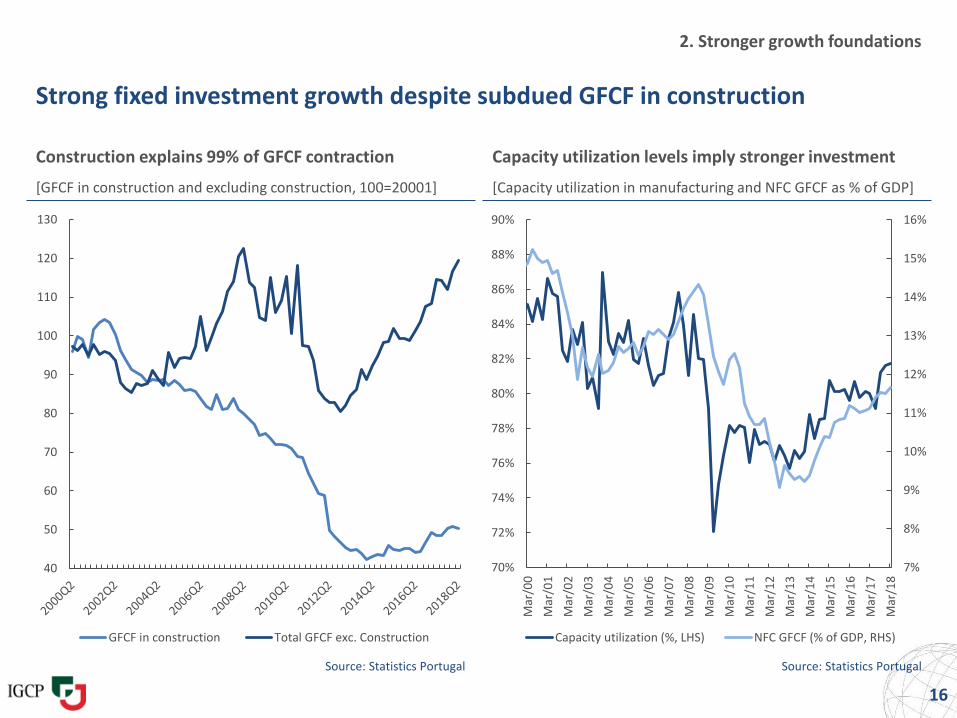
Strong fixed investment growth despite subdued GFCF in construction
Construction explains 99% of GFCF contraction
[GFCF in construction and excluding construction, 100=20001]
Source: Statistics Portugal Source: Statistics Portugal
16
2. Stronger growth foundations
Capacity utilization levels imply stronger investment
[Capacity utilization in manufacturing and NFC GFCF as % of GDP]
40
50
60
70
80
90
100
110
120
130
GFCF in construction Total GFCF exc. Construction
7%
8%
9%
10%
11%
12%
13%
14%
15%
16%
70%
72%
74%
76%
78%
80%
82%
84%
86%
88%
90%
Mar
/00
Mar
/01
Mar
/02
Mar
/03
Mar
/04
Mar
/05
Mar
/06
Mar
/07
Mar
/08
Mar
/09
Mar
/10
Mar
/11
Mar
/12
Mar
/13
Mar
/14
Mar
/15
Mar
/16
Mar
/17
Mar
/18
Capacity utilization (%, LHS) NFC GFCF (% of GDP, RHS)
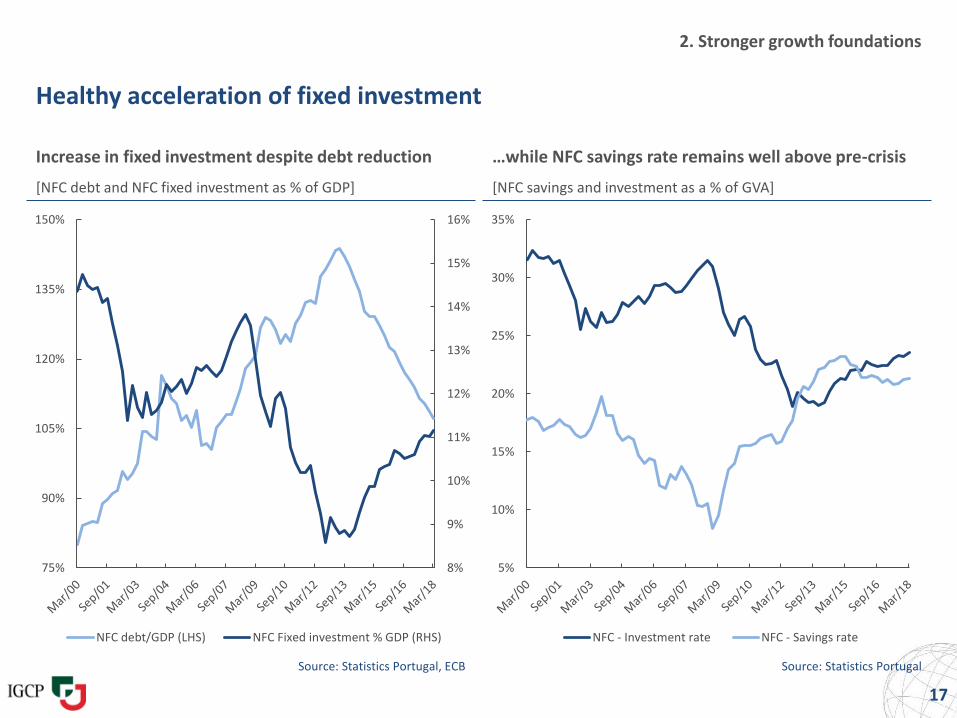
Healthy acceleration of fixed investment
Increase in fixed investment despite debt reduction
[NFC debt and NFC fixed investment as % of GDP]
Source: Statistics Portugal, ECB Source: Statistics Portugal
17
2. Stronger growth foundations
…while NFC savings rate remains well above pre-crisis
[NFC savings and investment as a % of GVA]
8%
9%
10%
11%
12%
13%
14%
15%
16%
75%
90%
105%
120%
135%
150%
NFC debt/GDP (LHS) NFC Fixed investment % GDP (RHS)
5%
10%
15%
20%
25%
30%
35%
NFC - Investment rate NFC - Savings rate
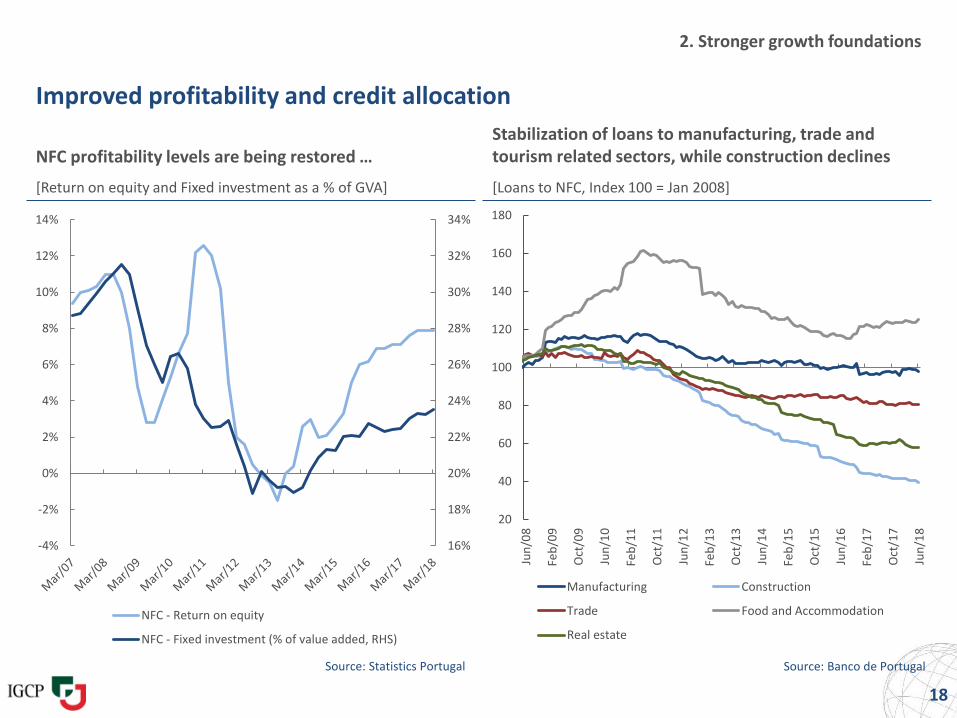
Improved profitability and credit allocation
NFC profitability levels are being restored …
[Return on equity and Fixed investment as a % of GVA]
Source: Statistics Portugal
18
2. Stronger growth foundations
Stabilization of loans to manufacturing, trade and tourism related sectors, while construction declines
[Loans to NFC, Index 100 = Jan 2008]
Source: Banco de Portugal
20
40
60
80
100
120
140
160
180
Jun
/08
Feb
/09
Oct
/09
Jun
/10
Feb
/11
Oct
/11
Jun
/12
Feb
/13
Oct
/13
Jun
/14
Feb
/15
Oct
/15
Jun
/16
Feb
/17
Oct
/17
Jun
/18
Manufacturing Construction
Trade Food and Accommodation
Real estate
16%
18%
20%
22%
24%
26%
28%
30%
32%
34%
-4%
-2%
0%
2%
4%
6%
8%
10%
12%
14%
NFC - Return on equity
NFC - Fixed investment (% of value added, RHS)
Outline
19
1.
1. Economic revitalization
2. Stronger growth foundations
3. Private sector turnaround
4. Fiscal stabilization
5. Resilient public debt structure
6. Improving market conditions
3.
3. Private sector turnaround
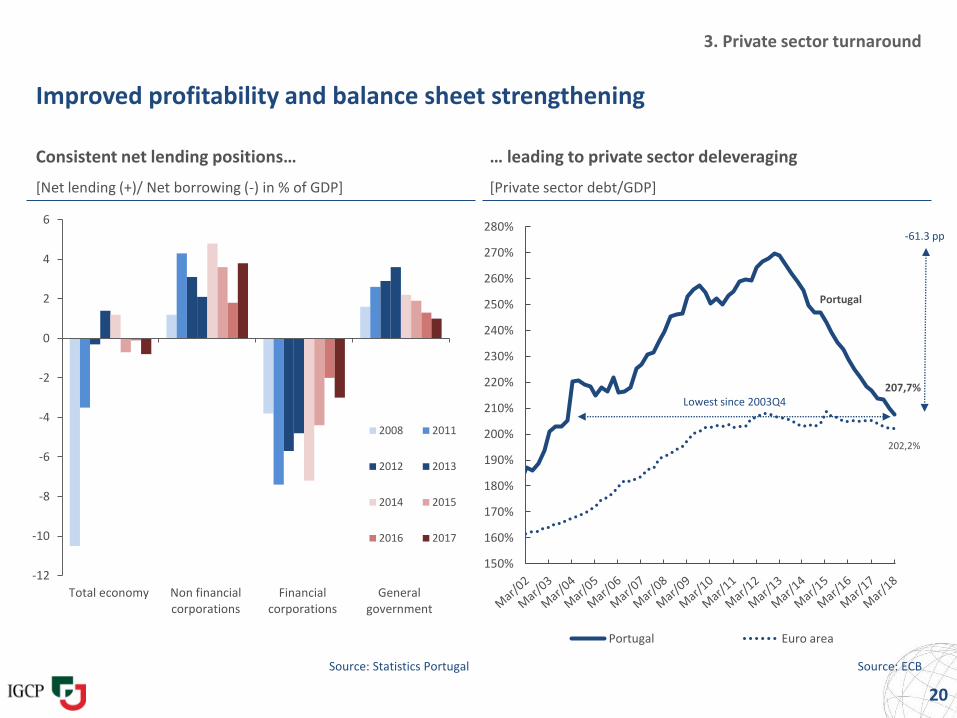
Improved profitability and balance sheet strengthening
20
[Net lending (+)/ Net borrowing (-) in % of GDP]
Consistent net lending positions…
[Private sector debt/GDP]
… leading to private sector deleveraging
Source: Statistics Portugal Source: ECB
Portugal
207,7%
202,2%
150%
160%
170%
180%
190%
200%
210%
220%
230%
240%
250%
260%
270%
280%
Portugal Euro area
Lowest since 2003Q4
-61.3 pp
-12
-10
-8
-6
-4
-2
0
2
4
6
Total economy Non financialcorporations
Financialcorporations
Generalgovernment
2008 2011
2012 2013
2014 2015
2016 2017
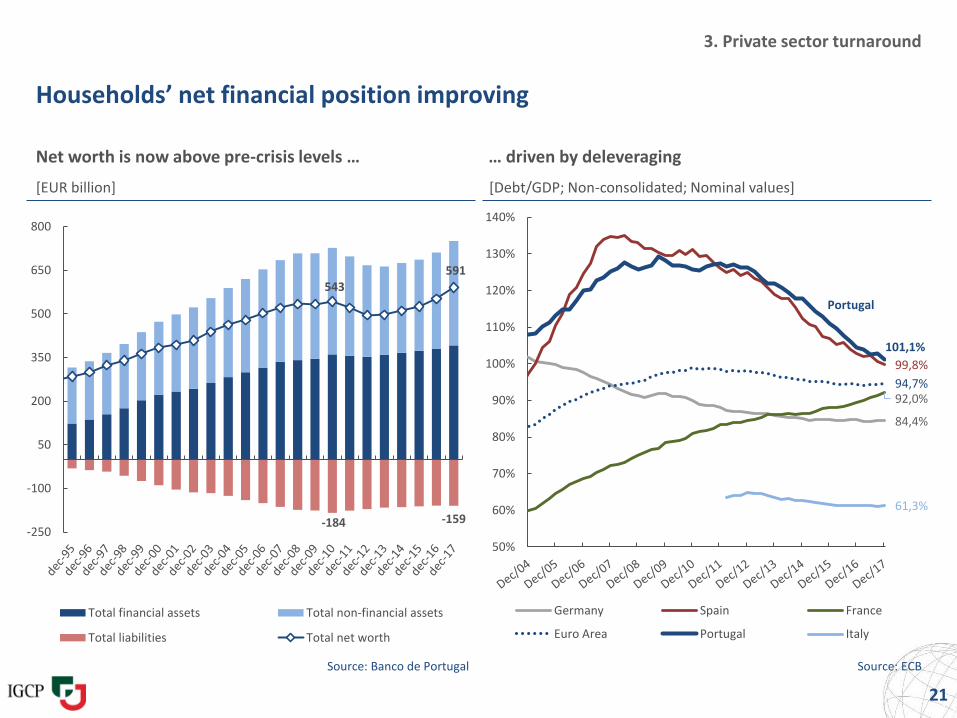
Households’ net financial position improving
Net worth is now above pre-crisis levels … … driven by deleveraging
[EUR billion]
Source: Banco de Portugal Source: ECB
21
3. Private sector turnaround
[Debt/GDP; Non-consolidated; Nominal values]
-184 -159
543591
-250
-100
50
200
350
500
650
800
Total financial assets Total non-financial assets
Total liabilities Total net worth
84,4%
99,8%
92,0%94,7%
Portugal
101,1%
61,3%
50%
60%
70%
80%
90%
100%
110%
120%
130%
140%
Germany Spain France
Euro Area Portugal Italy

Strengthening of corporates’ capital structure
Strong decline of debt stock
[Debt/GDP; Non-consolidated]
Source: ECB Source: Banco de Portugal
22
3. Private sector turnaround
Improved solvency position
[Capital ratio = Equity/Assets]
Portugal
107,2%
96,1%
134,2%
77,8%
62,5%
107,4%
50%
60%
70%
80%
90%
100%
110%
120%
130%
140%
150%
Portugal Spain France
Italy Germany Euro Area
30%
31%
32%
33%
34%
35%
36%
37%
38%
3. Private sector turnaround
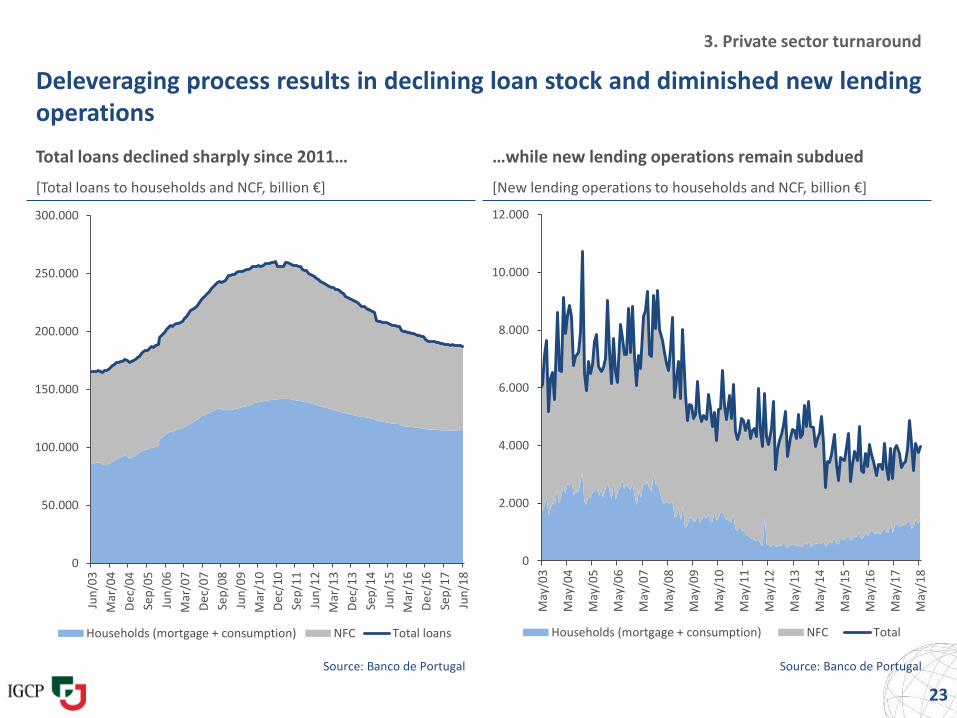
Deleveraging process results in declining loan stock and diminished new lendingoperations
Total loans declined sharply since 2011… …while new lending operations remain subdued
[Total loans to households and NCF, billion €] [New lending operations to households and NCF, billion €]
Source: Banco de Portugal Source: Banco de Portugal
23
0
50.000
100.000
150.000
200.000
250.000
300.000
Jun
/03
Mar
/04
De
c/0
4
Sep
/05
Jun
/06
Mar
/07
De
c/0
7
Sep
/08
Jun
/09
Mar
/10
De
c/1
0
Sep
/11
Jun
/12
Mar
/13
De
c/1
3
Sep
/14
Jun
/15
Mar
/16
De
c/1
6
Sep
/17
Jun
/18
Households (mortgage + consumption) NFC Total loans
0
2.000
4.000
6.000
8.000
10.000
12.000
May
/03
May
/04
May
/05
May
/06
May
/07
May
/08
May
/09
May
/10
May
/11
May
/12
May
/13
May
/14
May
/15
May
/16
May
/17
May
/18
Households (mortgage + consumption) NFC Total
150,7
135,1
122,6
111,8
102,1
96,1 95,592,5
2010 2011 2012 2013 2014 2015 2016 2017
3. Private sector turnaround
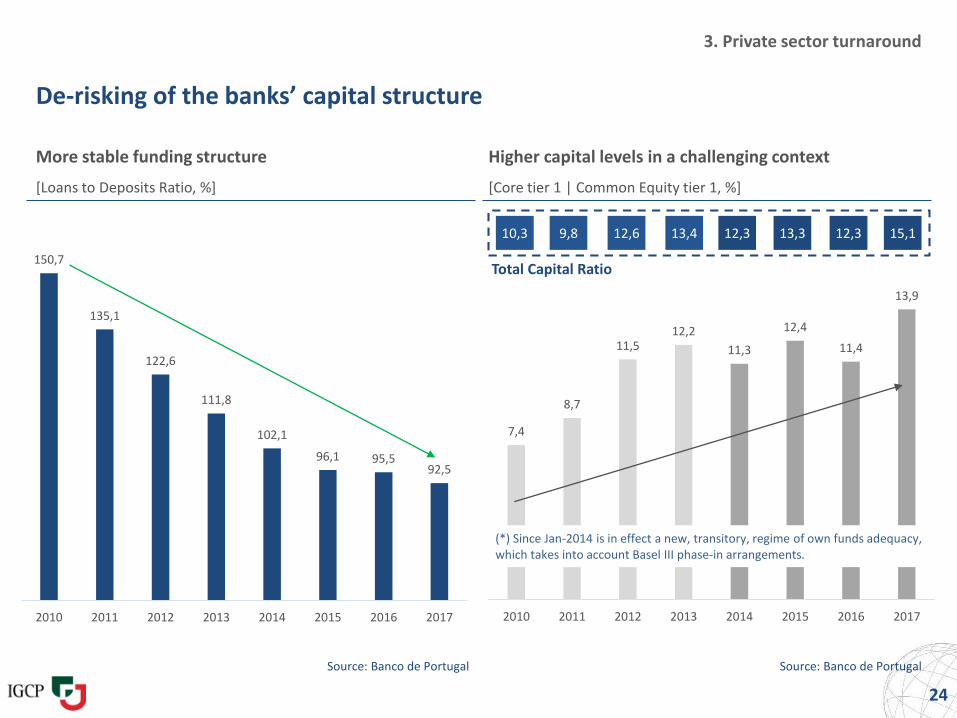
De-risking of the banks’ capital structure
24
[Loans to Deposits Ratio, %]
More stable funding structure
[Core tier 1 | Common Equity tier 1, %]
Higher capital levels in a challenging context
Source: Banco de PortugalSource: Banco de Portugal
7,4
8,7
11,512,2
11,3
12,4
11,4
13,9
2010 2011 2012 2013 2014 2015 2016 2017
13,4 12,3 13,3 12,3
Total Capital Ratio
12,69,810,3
(*) Since Jan-2014 is in effect a new, transitory, regime of own funds adequacy, which takes into account Basel III phase-in arrangements.
15,1
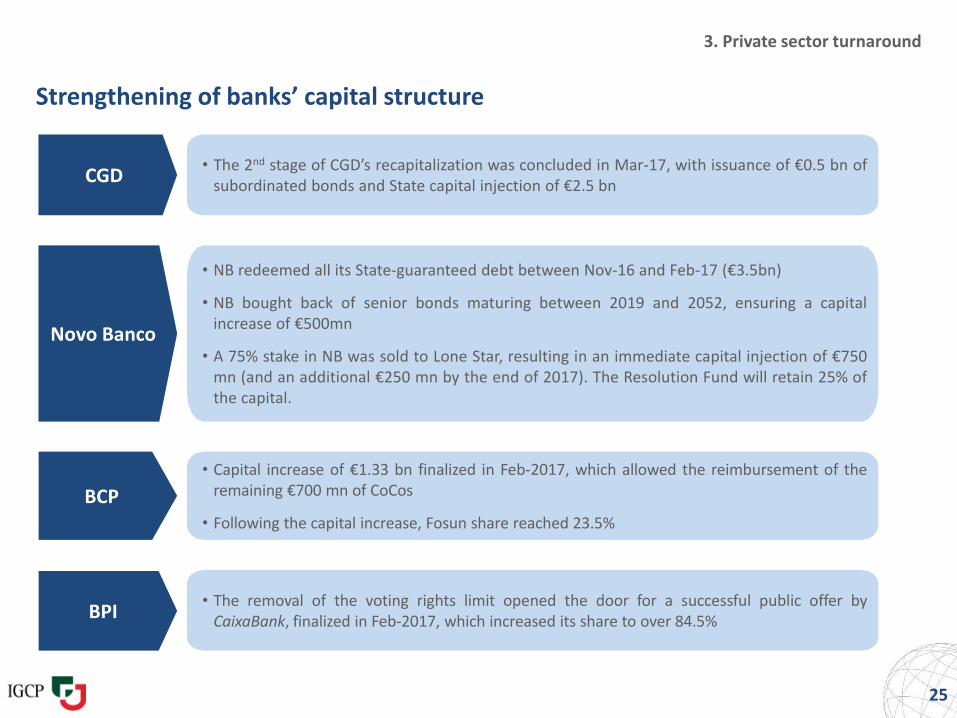
Strengthening of banks’ capital structure
25
• The 2nd stage of CGD’s recapitalization was concluded in Mar-17, with issuance of €0.5 bn ofsubordinated bonds and State capital injection of €2.5 bn
CGD
3. Private sector turnaround
• NB redeemed all its State-guaranteed debt between Nov-16 and Feb-17 (€3.5bn)
• NB bought back of senior bonds maturing between 2019 and 2052, ensuring a capitalincrease of €500mn
• A 75% stake in NB was sold to Lone Star, resulting in an immediate capital injection of €750mn (and an additional €250 mn by the end of 2017). The Resolution Fund will retain 25% ofthe capital.
Novo Banco
BCP
• Capital increase of €1.33 bn finalized in Feb-2017, which allowed the reimbursement of theremaining €700 mn of CoCos
• Following the capital increase, Fosun share reached 23.5%
BPI• The removal of the voting rights limit opened the door for a successful public offer by
CaixaBank, finalized in Feb-2017, which increased its share to over 84.5%
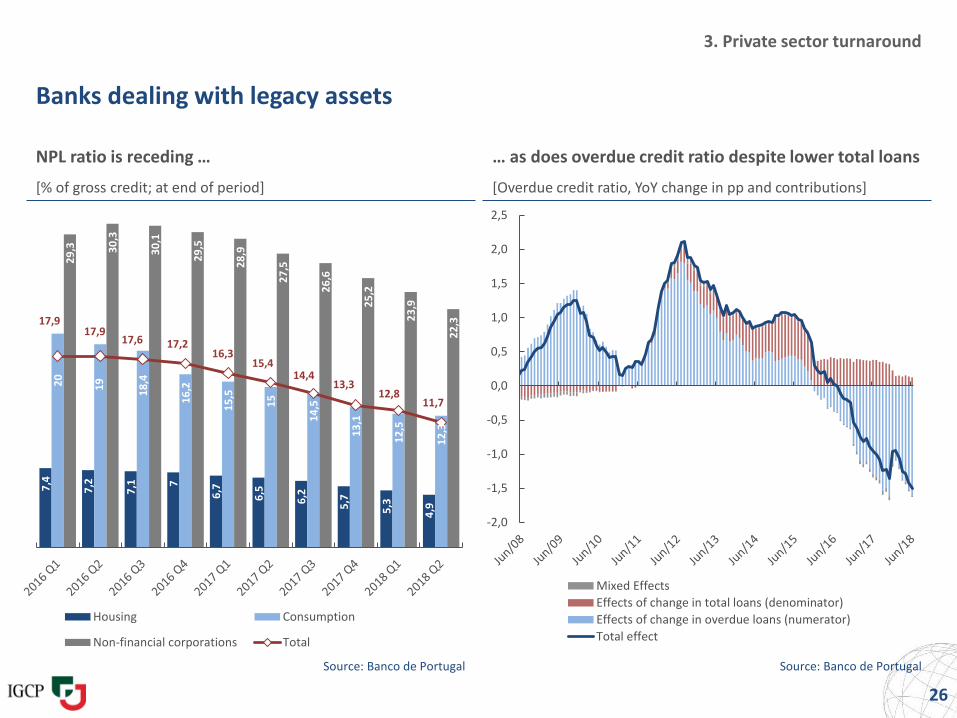
Banks dealing with legacy assets
NPL ratio is receding …
[% of gross credit; at end of period]
Source: Banco de Portugal
26
3. Private sector turnaround
… as does overdue credit ratio despite lower total loans
[Overdue credit ratio, YoY change in pp and contributions]
Source: Banco de Portugal
-2,0
-1,5
-1,0
-0,5
0,0
0,5
1,0
1,5
2,0
2,5
Mixed Effects
Effects of change in total loans (denominator)
Effects of change in overdue loans (numerator)
Total effect
7,4
7,2
7,1 7
6,7
6,5
6,2
5,7
5,3
4,9
20
19
18
,4
16
,2
15
,5
15
14
,5
13
,1
12
,5
12
,3
29
,3 30
,3
30
,1
29
,5
28
,9
27
,5
26
,6
25
,2
23
,9
22
,317,917,9
17,6 17,216,3
15,414,4
13,312,8
11,7
Housing Consumption
Non-financial corporations Total
27
3. Private sector turnaround
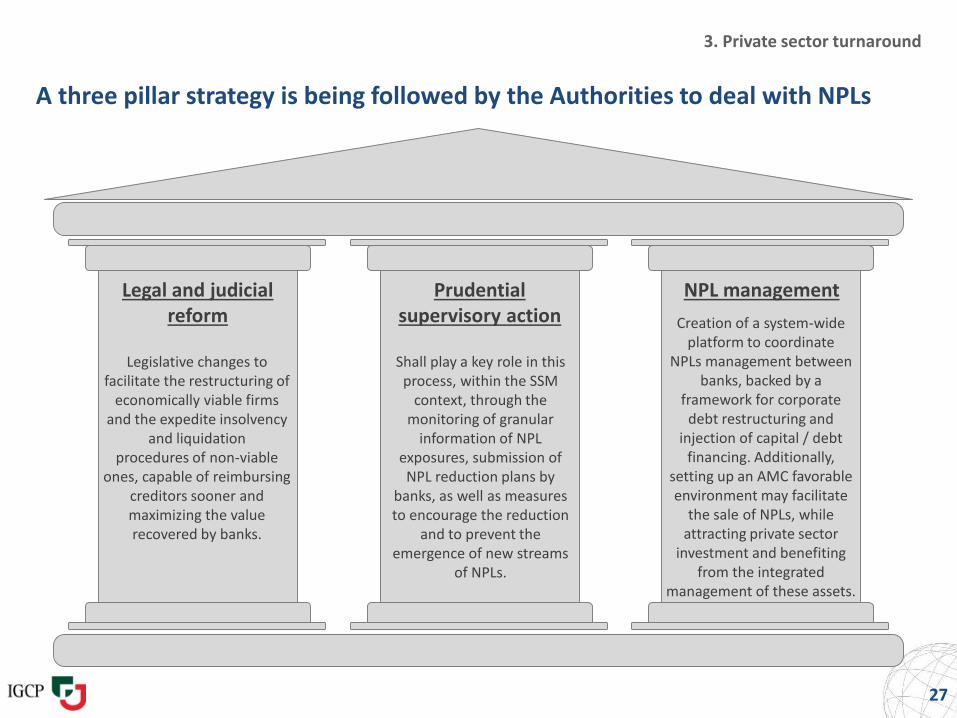
A three pillar strategy is being followed by the Authorities to deal with NPLs
Legal and judicial reform
NPL managementPrudential supervisory action
Legislative changes tofacilitate the restructuring of
economically viable firms and the expedite insolvency
and liquidationprocedures of non-viable
ones, capable of reimbursing creditors sooner and maximizing the value recovered by banks.
Shall play a key role in this process, within the SSM
context, through the monitoring of granular
information of NPL exposures, submission of NPL reduction plans by
banks, as well as measures to encourage the reduction
and to prevent the emergence of new streams
of NPLs.
Creation of a system-wide platform to coordinate
NPLs management between banks, backed by a
framework for corporate debt restructuring and
injection of capital / debt financing. Additionally,
setting up an AMC favorable environment may facilitate
the sale of NPLs, while attracting private sector
investment and benefiting from the integrated
management of these assets.
Outline
28
1.
1. Economic revitalization
2. Stronger growth foundations
3. Private sector turnaround
4. Fiscal stabilization
5. Resilient public debt structure
6. Improving market conditions
4.
EC
projections
EC
projections
4. Fiscal stabilization
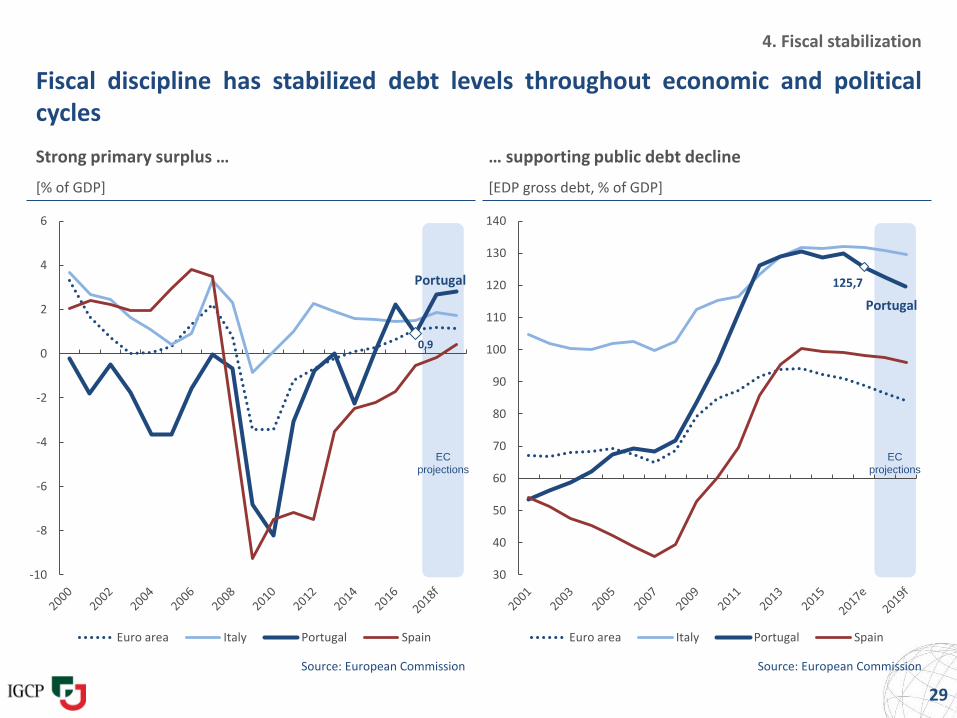
Fiscal discipline has stabilized debt levels throughout economic and politicalcycles
29
[% of GDP]
Strong primary surplus …
[EDP gross debt, % of GDP]
… supporting public debt decline
Source: European Commission Source: European Commission
0,9
Portugal
-10
-8
-6
-4
-2
0
2
4
6
Euro area Italy Portugal Spain
125,7
Portugal
30
40
50
60
70
80
90
100
110
120
130
140
Euro area Italy Portugal Spain
38%
40%
42%
44%
46%
48%
50%
52%
-12%
-10%
-8%
-6%
-4%
-2%
0%
2%
4%
2010 2012 2014 2016 2018 P 2020 P 2022 P
Total revenue (RHS)
Total expenditure excl NB, Banif and CGD (RHS)
Overall balance excl NB, Banif and CGD
4. Fiscal stabilization
Source: Statistics Portugal and Ministry of Finance Source: Statistics Portugal and Ministry of Finance
30
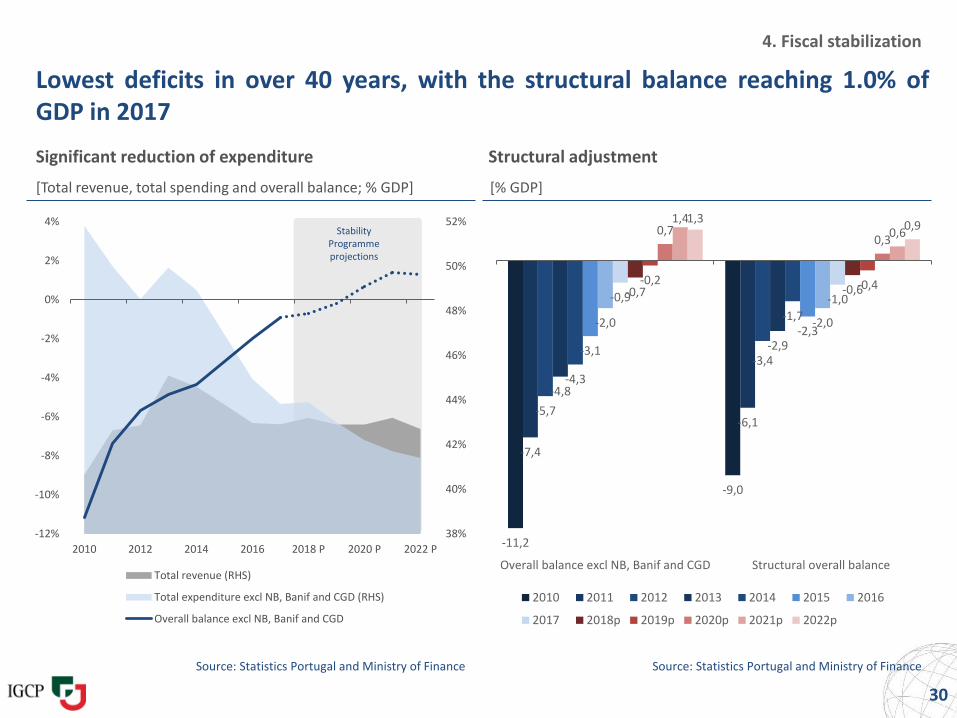
Lowest deficits in over 40 years, with the structural balance reaching 1.0% ofGDP in 2017
Structural adjustment
[% GDP][Total revenue, total spending and overall balance; % GDP]
Significant reduction of expenditure
Stability Programme projections
-11,2
-9,0
-7,4
-6,1-5,7
-3,4
-4,8
-2,9
-4,3
-1,7
-3,1
-2,3-2,0 -2,0
-0,9 -1,0-0,7 -0,6
-0,2 -0,4
0,70,3
1,40,6
1,30,9
Overall balance excl NB, Banif and CGD Structural overall balance
2010 2011 2012 2013 2014 2015 2016
2017 2018p 2019p 2020p 2021p 2022p
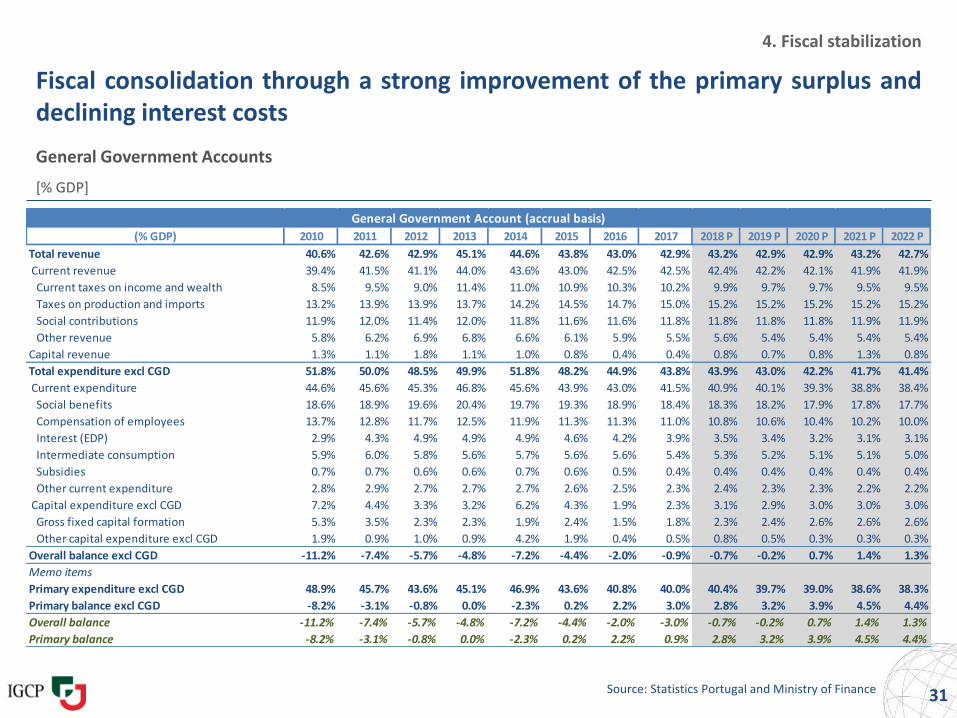
Fiscal consolidation through a strong improvement of the primary surplus anddeclining interest costs
General Government Accounts
[% GDP]
Source: Statistics Portugal and Ministry of Finance 31
4. Fiscal stabilization
General Government Account (accrual basis)
(% GDP) 2010 2011 2012 2013 2014 2015 2016 2017 2018 P 2019 P 2020 P 2021 P 2022 P
Total revenue 40.6% 42.6% 42.9% 45.1% 44.6% 43.8% 43.0% 42.9% 43.2% 42.9% 42.9% 43.2% 42.7%
Current revenue 39.4% 41.5% 41.1% 44.0% 43.6% 43.0% 42.5% 42.5% 42.4% 42.2% 42.1% 41.9% 41.9%
Current taxes on income and wealth 8.5% 9.5% 9.0% 11.4% 11.0% 10.9% 10.3% 10.2% 9.9% 9.7% 9.7% 9.5% 9.5%
Taxes on production and imports 13.2% 13.9% 13.9% 13.7% 14.2% 14.5% 14.7% 15.0% 15.2% 15.2% 15.2% 15.2% 15.2%
Social contributions 11.9% 12.0% 11.4% 12.0% 11.8% 11.6% 11.6% 11.8% 11.8% 11.8% 11.8% 11.9% 11.9%
Other revenue 5.8% 6.2% 6.9% 6.8% 6.6% 6.1% 5.9% 5.5% 5.6% 5.4% 5.4% 5.4% 5.4%
Capital revenue 1.3% 1.1% 1.8% 1.1% 1.0% 0.8% 0.4% 0.4% 0.8% 0.7% 0.8% 1.3% 0.8%
Total expenditure excl CGD 51.8% 50.0% 48.5% 49.9% 51.8% 48.2% 44.9% 43.8% 43.9% 43.0% 42.2% 41.7% 41.4%
Current expenditure 44.6% 45.6% 45.3% 46.8% 45.6% 43.9% 43.0% 41.5% 40.9% 40.1% 39.3% 38.8% 38.4%
Social benefits 18.6% 18.9% 19.6% 20.4% 19.7% 19.3% 18.9% 18.4% 18.3% 18.2% 17.9% 17.8% 17.7%
Compensation of employees 13.7% 12.8% 11.7% 12.5% 11.9% 11.3% 11.3% 11.0% 10.8% 10.6% 10.4% 10.2% 10.0%
Interest (EDP) 2.9% 4.3% 4.9% 4.9% 4.9% 4.6% 4.2% 3.9% 3.5% 3.4% 3.2% 3.1% 3.1%
Intermediate consumption 5.9% 6.0% 5.8% 5.6% 5.7% 5.6% 5.6% 5.4% 5.3% 5.2% 5.1% 5.1% 5.0%
Subsidies 0.7% 0.7% 0.6% 0.6% 0.7% 0.6% 0.5% 0.4% 0.4% 0.4% 0.4% 0.4% 0.4%
Other current expenditure 2.8% 2.9% 2.7% 2.7% 2.7% 2.6% 2.5% 2.3% 2.4% 2.3% 2.3% 2.2% 2.2%
Capital expenditure excl CGD 7.2% 4.4% 3.3% 3.2% 6.2% 4.3% 1.9% 2.3% 3.1% 2.9% 3.0% 3.0% 3.0%
Gross fixed capital formation 5.3% 3.5% 2.3% 2.3% 1.9% 2.4% 1.5% 1.8% 2.3% 2.4% 2.6% 2.6% 2.6%
Other capital expenditure excl CGD 1.9% 0.9% 1.0% 0.9% 4.2% 1.9% 0.4% 0.5% 0.8% 0.5% 0.3% 0.3% 0.3%
Overall balance excl CGD -11.2% -7.4% -5.7% -4.8% -7.2% -4.4% -2.0% -0.9% -0.7% -0.2% 0.7% 1.4% 1.3%
Memo items
Primary expenditure excl CGD 48.9% 45.7% 43.6% 45.1% 46.9% 43.6% 40.8% 40.0% 40.4% 39.7% 39.0% 38.6% 38.3%
Primary balance excl CGD -8.2% -3.1% -0.8% 0.0% -2.3% 0.2% 2.2% 3.0% 2.8% 3.2% 3.9% 4.5% 4.4%
Overall balance -11.2% -7.4% -5.7% -4.8% -7.2% -4.4% -2.0% -3.0% -0.7% -0.2% 0.7% 1.4% 1.3%
Primary balance -8.2% -3.1% -0.8% 0.0% -2.3% 0.2% 2.2% 0.9% 2.8% 3.2% 3.9% 4.5% 4.4%
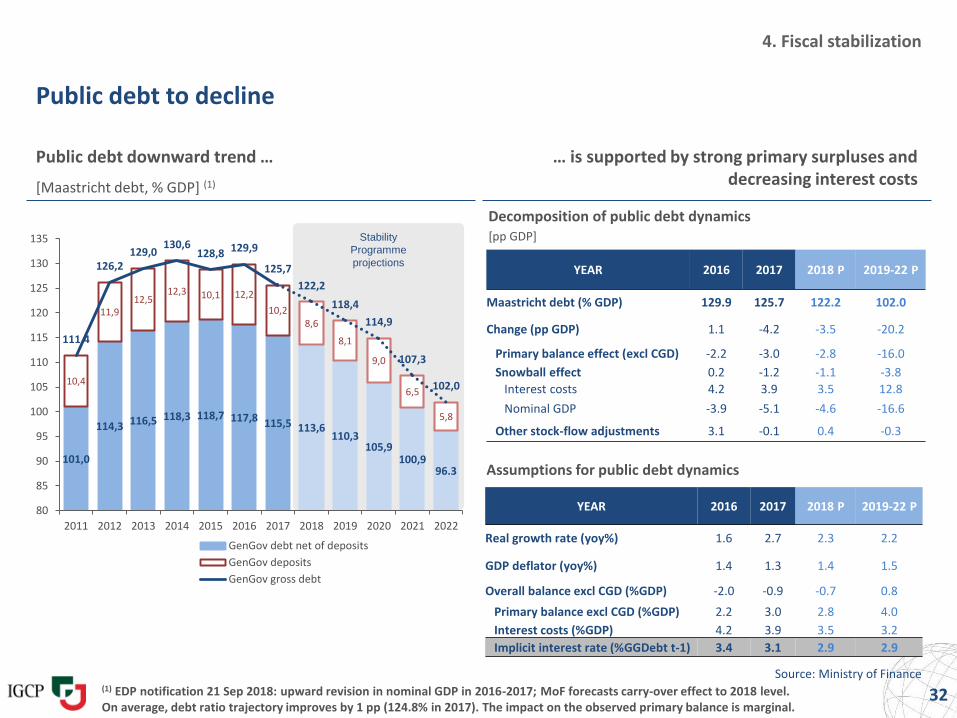
Public debt to decline
Public debt downward trend …
[Maastricht debt, % GDP] (1)
32Source: Ministry of Finance
Decomposition of public debt dynamics[pp GDP]
… is supported by strong primary surpluses and decreasing interest costs
4. Fiscal stabilization
Assumptions for public debt dynamics
YEAR 2016 2017 2018 P 2019-22 P
Real growth rate (yoy%) 1.6 2.7 2.3 2.2
GDP deflator (yoy%) 1.4 1.3 1.4 1.5
Overall balance excl CGD (%GDP) -2.0 -0.9 -0.7 0.8
Primary balance excl CGD (%GDP) 2.2 3.0 2.8 4.0
Interest costs (%GDP) 4.2 3.9 3.5 3.2
Implicit interest rate (%GGDebt t-1) 3.4 3.1 2.9 2.9
YEAR 2016 2017 2018 P 2019-22 P
Maastricht debt (% GDP) 129.9 125.7 122.2 102.0
Change (pp GDP) 1.1 -4.2 -3.5 -20.2
Primary balance effect (excl CGD) -2.2 -3.0 -2.8 -16.0
Snowball effect 0.2 -1.2 -1.1 -3.8
Interest costs 4.2 3.9 3.5 12.8
Nominal GDP -3.9 -5.1 -4.6 -16.6
Other stock-flow adjustments 3.1 -0.1 0.4 -0.3
Stability
Programme
projections
101,0
114,3 116,5 118,3 118,7 117,8 115,5 113,6110,3
105,9100,9
96.3
10,4
11,912,5
12,3 10,1 12,2
10,28,6
8,1
9,0
6,5
5,8
111,4
126,2129,0
130,6128,8 129,9
125,7
122,2
118,4
114,9
107,3
102,0
80
85
90
95
100
105
110
115
120
125
130
135
2011 2012 2013 2014 2015 2016 2017 2018 2019 2020 2021 2022
GenGov debt net of deposits
GenGov deposits
GenGov gross debt
(1) EDP notification 21 Sep 2018: upward revision in nominal GDP in 2016-2017; MoF forecasts carry-over effect to 2018 level.On average, debt ratio trajectory improves by 1 pp (124.8% in 2017). The impact on the observed primary balance is marginal.
Outline
33
1.
1. Economic revitalization
2. Stronger growth foundations
3. Private sector turnaround
4. Fiscal stabilization
5. Resilient public debt structure
6. Improving market conditions
5.
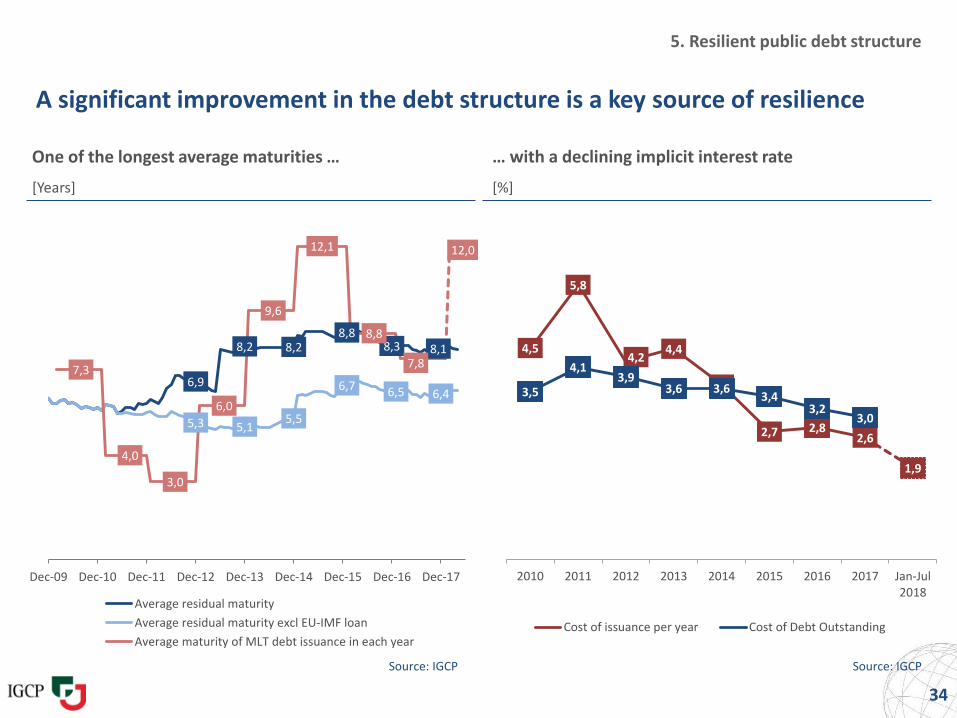
5. Resilient public debt structure
A significant improvement in the debt structure is a key source of resilience
34
One of the longest average maturities …
[Years]
Source: IGCP
6,9
8,2 8,28,8
8,3 8,1
5,3 5,15,5
6,7 6,5 6,4
7,3
4,0
3,0
6,0
9,6
12,1
8,8
7,8
12,0
Dec-09 Dec-10 Dec-11 Dec-12 Dec-13 Dec-14 Dec-15 Dec-16 Dec-17
Average residual maturity
Average residual maturity excl EU-IMF loan
Average maturity of MLT debt issuance in each year
… with a declining implicit interest rate
[%]
Source: IGCP
4,5
5,8
4,24,4
3,7
2,7 2,82,6
1,9
3,5
4,13,9
3,6 3,63,4
3,23,0
2010 2011 2012 2013 2014 2015 2016 2017 Jan-Jul2018
Cost of issuance per year Cost of Debt Outstanding
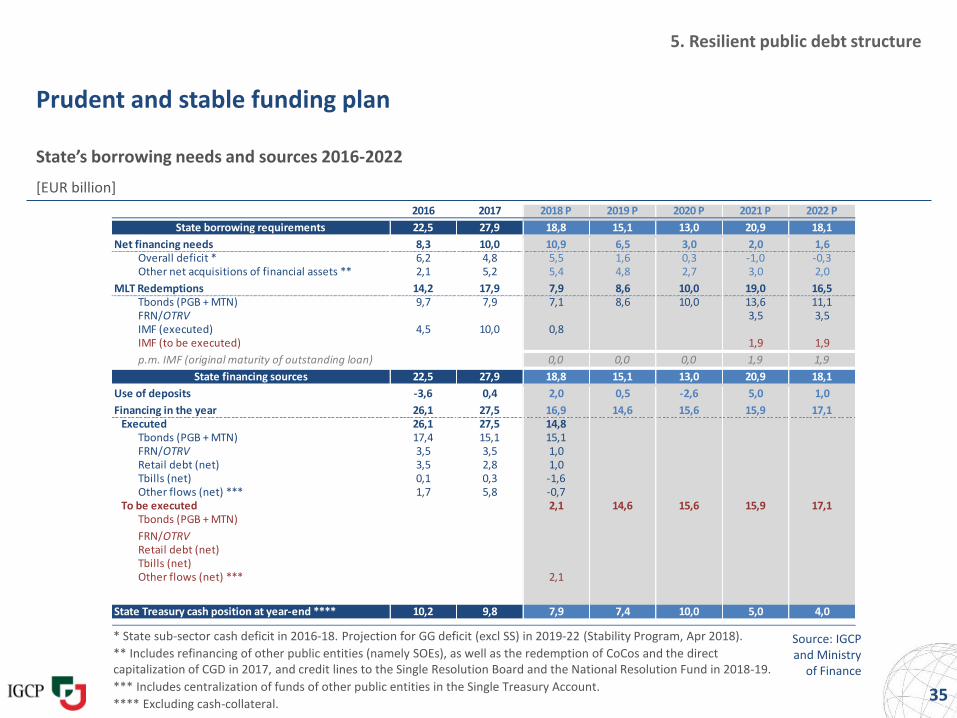
Prudent and stable funding plan
State’s borrowing needs and sources 2016-2022
[EUR billion]
Source: IGCPand Ministry
of Finance
35
5. Resilient public debt structure
* State sub-sector cash deficit in 2016-18. Projection for GG deficit (excl SS) in 2019-22 (Stability Program, Apr 2018).
** Includes refinancing of other public entities (namely SOEs), as well as the redemption of CoCos and the direct capitalization of CGD in 2017, and credit lines to the Single Resolution Board and the National Resolution Fund in 2018-19.
*** Includes centralization of funds of other public entities in the Single Treasury Account.
**** Excluding cash-collateral.
2016 2017 2018 P 2019 P 2020 P 2021 P 2022 P
State borrowing requirements 22,5 27,9 18,8 15,1 13,0 20,9 18,1
Net financing needs 8,3 10,0 10,9 6,5 3,0 2,0 1,6 Overall deficit * 6,2 4,8 5,5 1,6 0,3 -1,0 -0,3 Other net acquisitions of financial assets ** 2,1 5,2 5,4 4,8 2,7 3,0 2,0
MLT Redemptions 14,2 17,9 7,9 8,6 10,0 19,0 16,5 Tbonds (PGB + MTN) 9,7 7,9 7,1 8,6 10,0 13,6 11,1 FRN/OTRV 3,5 3,5 IMF (executed) 4,5 10,0 0,8 IMF (to be executed) 1,9 1,9
p.m. IMF (original maturity of outstanding loan) 0,0 0,0 0,0 1,9 1,9
State financing sources 22,5 27,9 18,8 15,1 13,0 20,9 18,1
Use of deposits -3,6 0,4 2,0 0,5 -2,6 5,0 1,0
Financing in the year 26,1 27,5 16,9 14,6 15,6 15,9 17,1Executed 26,1 27,5 14,8
Tbonds (PGB + MTN) 17,4 15,1 15,1 FRN/OTRV 3,5 3,5 1,0 Retail debt (net) 3,5 2,8 1,0 Tbills (net) 0,1 0,3 -1,6 Other flows (net) *** 1,7 5,8 -0,7
To be executed 2,1 14,6 15,6 15,9 17,1 Tbonds (PGB + MTN)
FRN/OTRV Retail debt (net) Tbills (net) Other flows (net) *** 2,1
State Treasury cash position at year-end **** 10,2 9,8 7,9 7,4 10,0 5,0 4,0
12% 41%45%
48%47%
25%
15%
48%
77%
47% 0%
20%
36%
45%
55%
46%
100%
55%
9%
17%
5% 14%…
11%
12%
23%8%
16%
17%
0
5
10
15
20
25
2010 2012 2014 2016 Jan-Sep18
Syndications Auctions Exchanges MTN Issuance OTRV/FRN
21% 51% 100%22%
2% -
25%
41% 53%
22%
9%
35%
44%
13%
8%
15%26%
10%
7%
38%
8%
25%
46%
46%
48%45%
56%
7%
17%
19% 8%2%
24%
0
5
10
15
20
25
2010 2012 2014 2016 Jan-Sep18
<4[ [4-6[ [6-9[ [9-13[ >=13
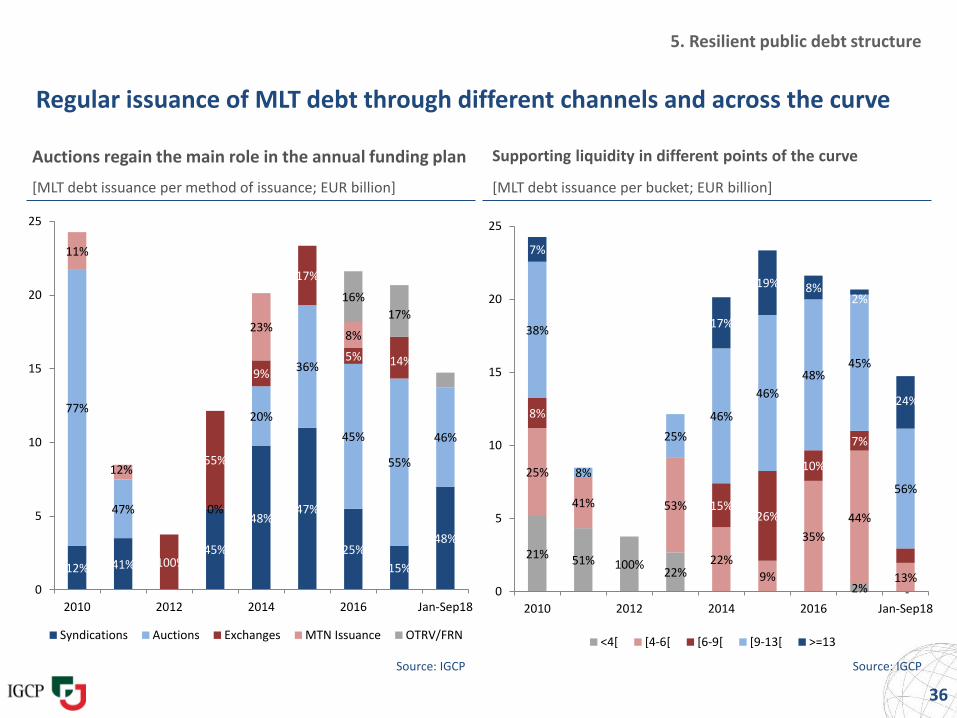
Regular issuance of MLT debt through different channels and across the curve
Auctions regain the main role in the annual funding plan Supporting liquidity in different points of the curve
[MLT debt issuance per method of issuance; EUR billion] [MLT debt issuance per bucket; EUR billion]
Source: IGCP Source: IGCP
36
5. Resilient public debt structure
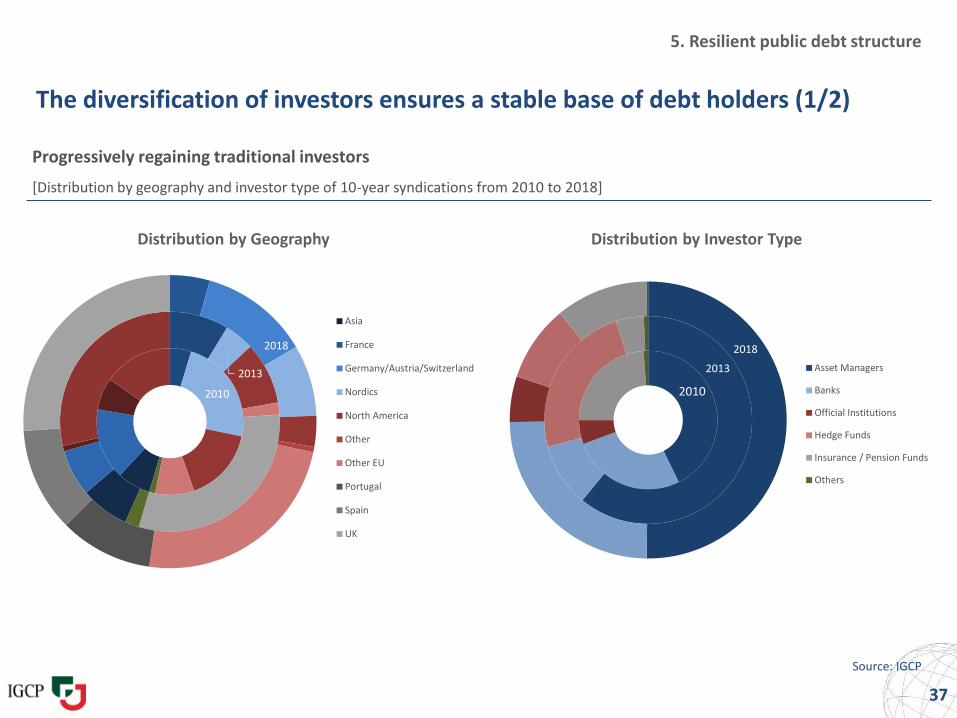
The diversification of investors ensures a stable base of debt holders (1/2)
Progressively regaining traditional investors
Source: IGCP
37
Distribution by Geography Distribution by Investor Type
5. Resilient public debt structure
[Distribution by geography and investor type of 10-year syndications from 2010 to 2018]
2010
2013
2018
Asia
France
Germany/Austria/Switzerland
Nordics
North America
Other
Other EU
Portugal
Spain
UK
2010
2013
2018
Asset Managers
Banks
Official Institutions
Hedge Funds
Insurance / Pension Funds
Others
[% of total State debt securities]
Source: IGCP Source: IGCP
38
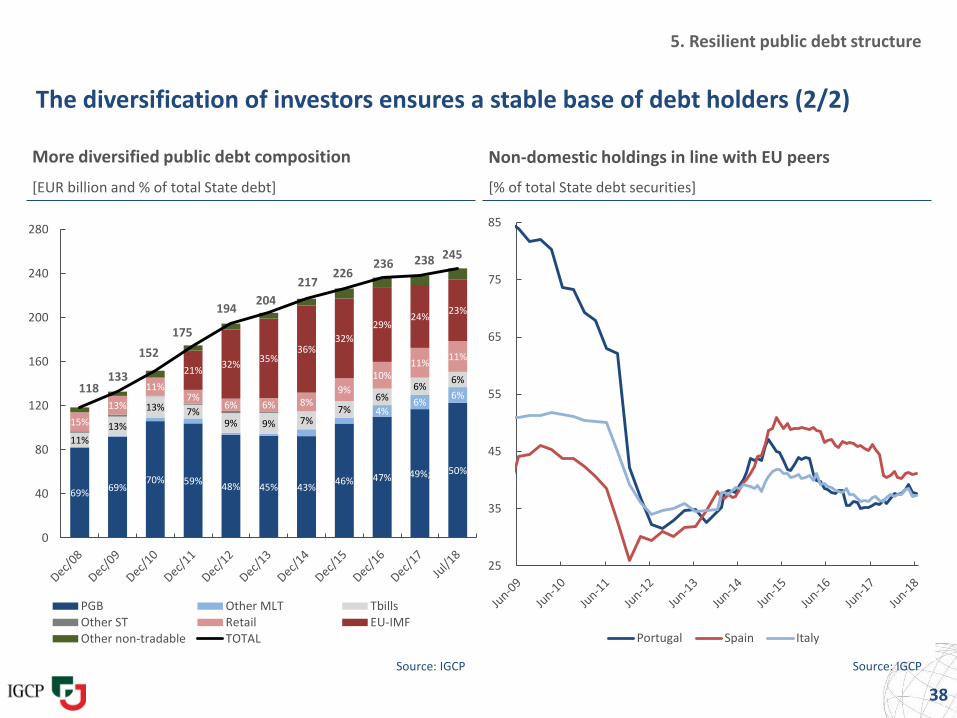
5. Resilient public debt structure
More diversified public debt composition
[EUR billion and % of total State debt]
Non-domestic holdings in line with EU peers
The diversification of investors ensures a stable base of debt holders (2/2)
69%69%
70% 59%48% 45% 43%
46% 47% 49%; 50%
4%6%
6%
11%
13%
13% 7%9% 9% 7%
7%6%
6%6%
15%
13%
11%7%
6% 6% 8%9%
10%11%
11%
21%32%
35%36%
32%
29%24%
23%
118133
152
175
194204
217226
236 238 245
0
40
80
120
160
200
240
280
PGB Other MLT TbillsOther ST Retail EU-IMFOther non-tradable TOTAL
25
35
45
55
65
75
85
Portugal Spain Italy
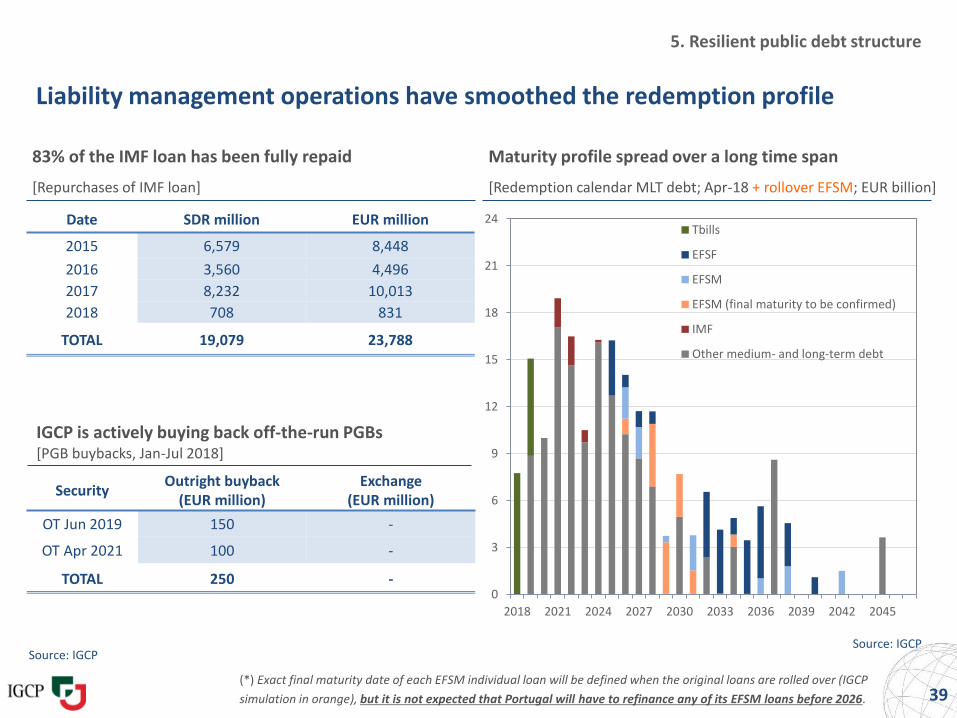
39
Liability management operations have smoothed the redemption profile
[Redemption calendar MLT debt; Apr-18 + rollover EFSM; EUR billion]
Source: IGCP
Maturity profile spread over a long time span
5. Resilient public debt structure
(*) Exact final maturity date of each EFSM individual loan will be defined when the original loans are rolled over (IGCP
simulation in orange), but it is not expected that Portugal will have to refinance any of its EFSM loans before 2026.
IGCP is actively buying back off-the-run PGBs
83% of the IMF loan has been fully repaid
[PGB buybacks, Jan-Jul 2018]
[Repurchases of IMF loan]
SecurityOutright buyback
(EUR million)Exchange
(EUR million)
OT Jun 2019 150 -
OT Apr 2021 100 -
TOTAL 250 -
Source: IGCP
Date SDR million EUR million
2015 6,579 8,448
2016 3,560 4,496
2017 8,232 10,013
2018 708 831
TOTAL 19,079 23,788
0
3
6
9
12
15
18
21
24
2018 2021 2024 2027 2030 2033 2036 2039 2042 2045
Tbills
EFSF
EFSM
EFSM (final maturity to be confirmed)
IMF
Other medium- and long-term debt
Outline
40
1.
1. Economic revitalization
2. Stronger growth foundations
3. Private sector turnaround
4. Fiscal stabilization
5. Resilient public debt structure
6. Improving market conditions
6.
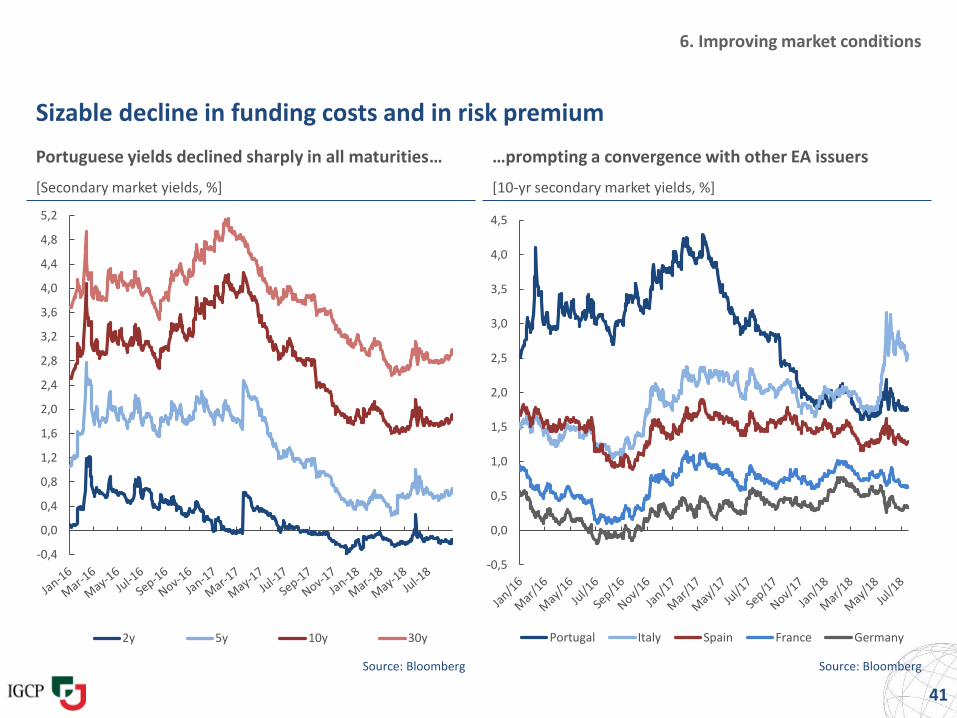
6. Improving market conditions
Sizable decline in funding costs and in risk premium
Portuguese yields declined sharply in all maturities… …prompting a convergence with other EA issuers
[Secondary market yields, %] [10-yr secondary market yields, %]
Source: Bloomberg Source: Bloomberg
41
-0,4
0,0
0,4
0,8
1,2
1,6
2,0
2,4
2,8
3,2
3,6
4,0
4,4
4,8
5,2
2y 5y 10y 30y
-0,5
0,0
0,5
1,0
1,5
2,0
2,5
3,0
3,5
4,0
4,5
Portugal Italy Spain France Germany
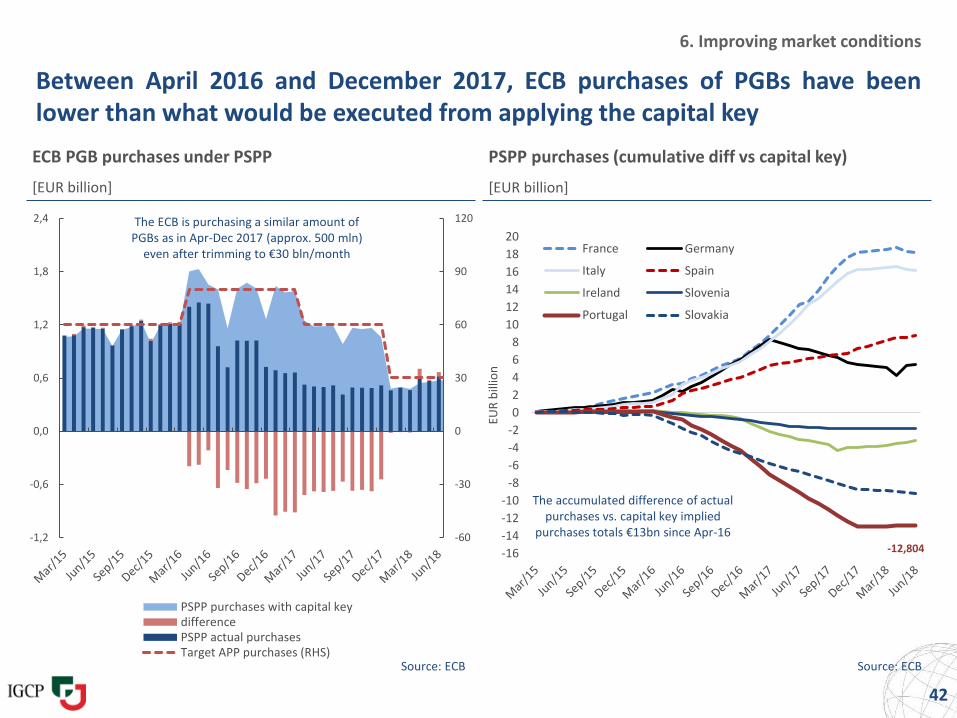
Between April 2016 and December 2017, ECB purchases of PGBs have beenlower than what would be executed from applying the capital key
Source: ECB Source: ECB
42
PSPP purchases (cumulative diff vs capital key)ECB PGB purchases under PSPP
[EUR billion][EUR billion]
6. Improving market conditions
-12,804-16
-14
-12
-10
-8
-6
-4
-2
0
2
4
6
8
10
12
14
16
18
20
EUR
bill
ion
France Germany
Italy Spain
Ireland Slovenia
Portugal Slovakia
-60
-30
0
30
60
90
120
-1,2
-0,6
0,0
0,6
1,2
1,8
2,4
PSPP purchases with capital keydifferencePSPP actual purchasesTarget APP purchases (RHS)
The ECB is purchasing a similar amount of PGBs as in Apr-Dec 2017 (approx. 500 mln)
even after trimming to €30 bln/month
The accumulated difference of actual purchases vs. capital key implied
purchases totals €13bn since Apr-16
0
20
40
60
80
100
120
140
160
02/01/2015 02/01/2016 02/01/2017 02/01/2018
10Y 5Y
0
500
1.000
1.500
2.000
Over-the-counter OT Platforms OT
OT 12M Moving Average
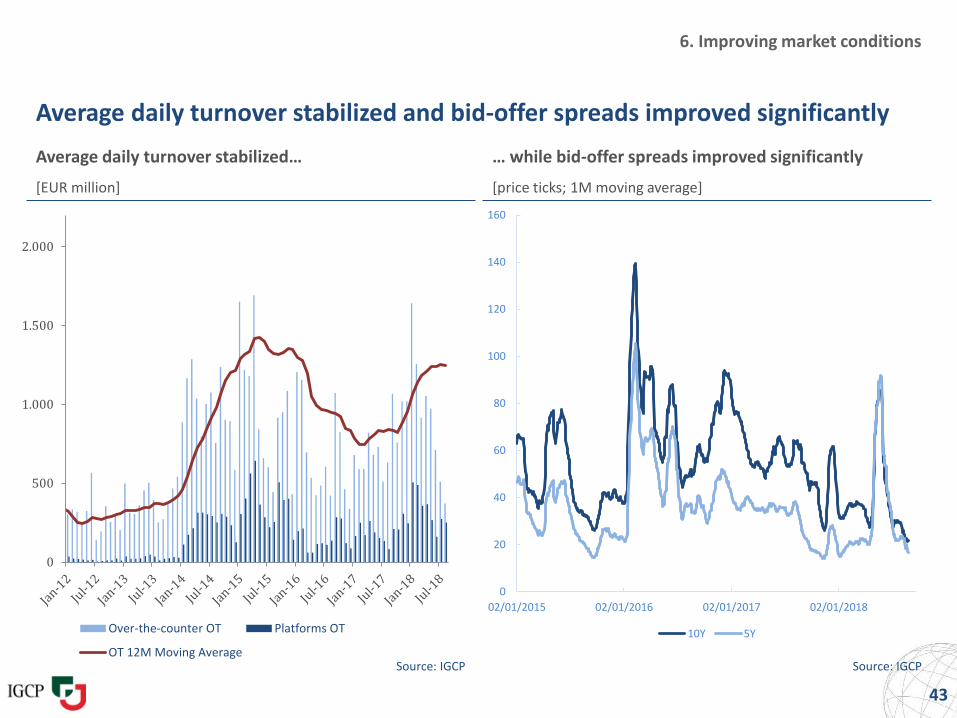
6. Improving market conditions
Average daily turnover stabilized and bid-offer spreads improved significantly
Average daily turnover stabilized… … while bid-offer spreads improved significantly
[EUR million] [price ticks; 1M moving average]
Source: IGCP Source: IGCP
43
-5.000
-4.000
-3.000
-2.000
-1.000
0
1.000
2.000
3.000
4.000
Dec/15 Mar/16 Jun/16 Sep/16 Dec/16 Mar/17 Jun/17 Sep/17 Dec/17 Mar/18 Jun/18
Banks Central Bank & Other Public Entity Pension Fund Insurance Company Fund Manager Hedge Fund Retail
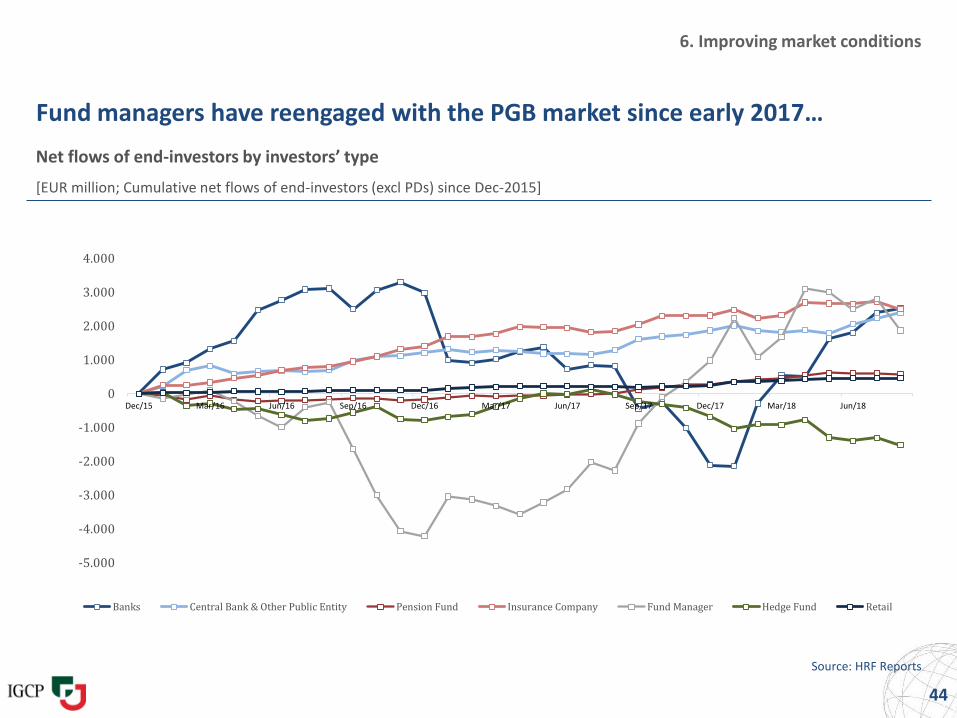
6. Improving market conditions
Fund managers have reengaged with the PGB market since early 2017…
Net flows of end-investors by investors’ type
[EUR million; Cumulative net flows of end-investors (excl PDs) since Dec-2015]
Source: HRF Reports
44
-3.000
-2.500
-2.000
-1.500
-1.000
-500
0
500
1.000
1.500
2.000
2.500
Germany/Austria/Swit North AmericaAsia BeneluxOther Nordics
-4.000
-3.000
-2.000
-1.000
0
1.000
2.000
3.000
4.000
5.000
6.000
7.000
Spain Other EU France Portugal UK
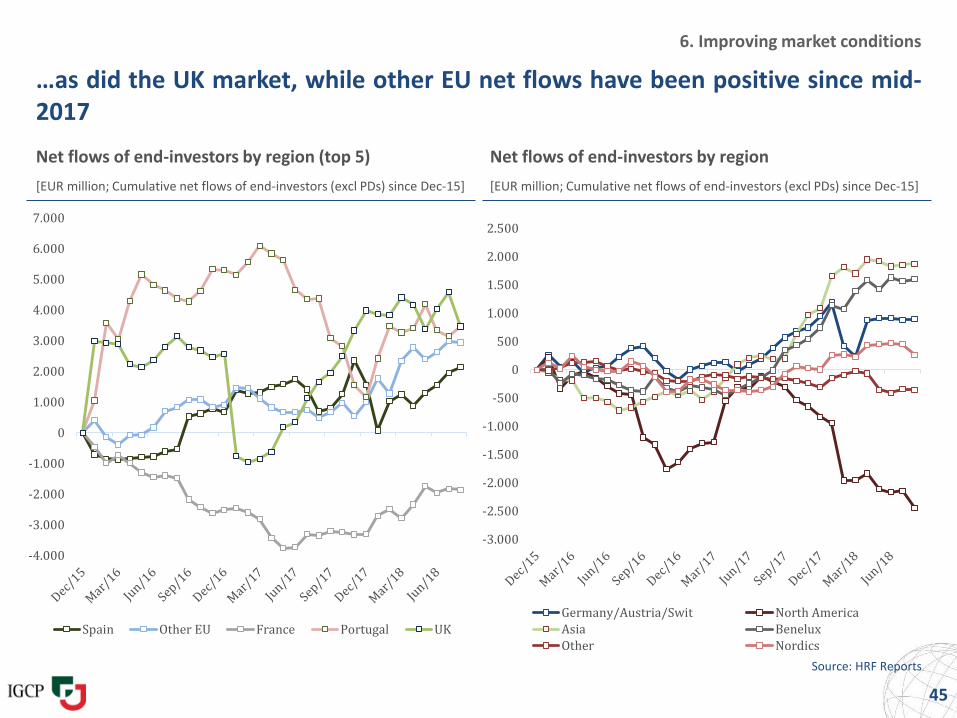
…as did the UK market, while other EU net flows have been positive since mid-2017
45
Net flows of end-investors by region (top 5)
[EUR million; Cumulative net flows of end-investors (excl PDs) since Dec-15] [EUR million; Cumulative net flows of end-investors (excl PDs) since Dec-15]
Net flows of end-investors by region
6. Improving market conditions
Source: HRF Reports
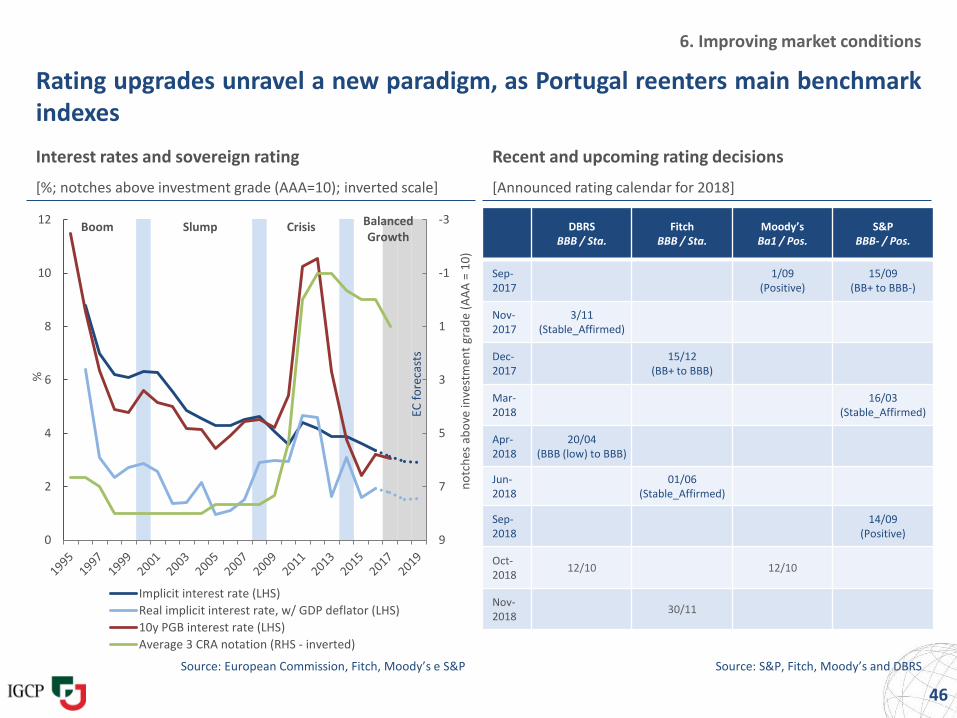
6. Improving market conditions
Rating upgrades unravel a new paradigm, as Portugal reenters main benchmarkindexes
Interest rates and sovereign rating Recent and upcoming rating decisions
[%; notches above investment grade (AAA=10); inverted scale] [Announced rating calendar for 2018]
Source: European Commission, Fitch, Moody’s e S&P Source: S&P, Fitch, Moody’s and DBRS
46
-3
-1
1
3
5
7
90
2
4
6
8
10
12
no
tch
es a
bo
ve in
vest
men
t gr
ade
(AA
A =
10
)
%
Implicit interest rate (LHS)
Real implicit interest rate, w/ GDP deflator (LHS)
10y PGB interest rate (LHS)
Average 3 CRA notation (RHS - inverted)
Boom Slump Crisis BalancedGrowth
EC f
ore
cast
s
DBRSBBB / Sta.
FitchBBB / Sta.
Moody’sBa1 / Pos.
S&PBBB- / Pos.
Sep-2017
1/09(Positive)
15/09(BB+ to BBB-)
Nov-2017
3/11(Stable_Affirmed)
Dec-2017
15/12(BB+ to BBB)
Mar-2018
16/03(Stable_Affirmed)
Apr-2018
20/04 (BBB (low) to BBB)
Jun-2018
01/06(Stable_Affirmed)
Sep-2018
14/09(Positive)
Oct-2018
12/10 12/10
Nov-2018
30/11
Appendix
47
A. Macroeconomic indicators
B. Structural reforms
C. Fiscal indicators
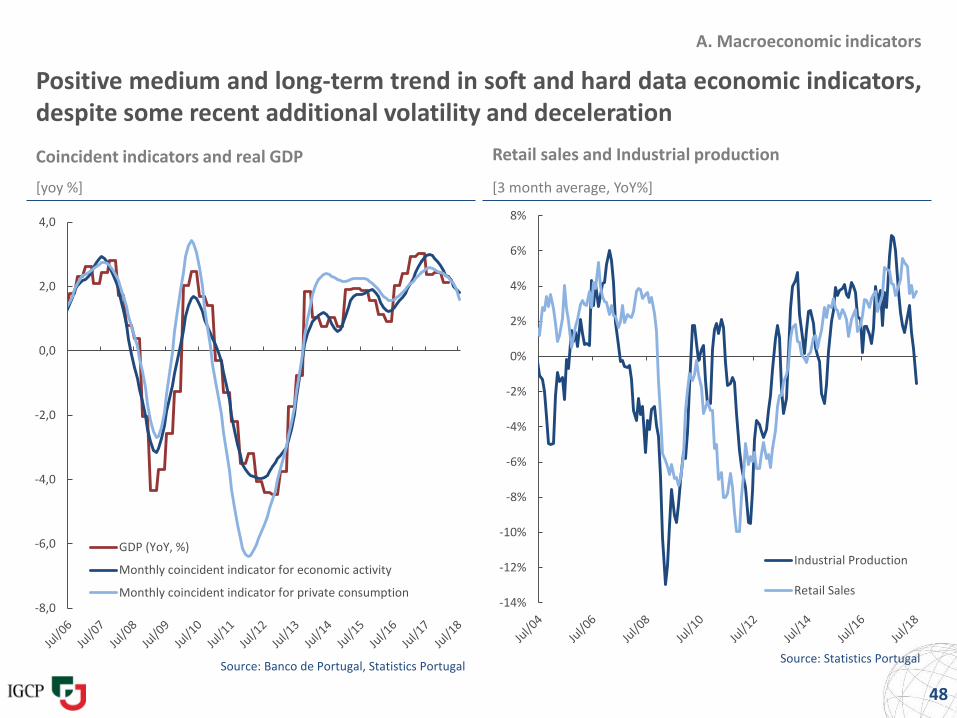
Positive medium and long-term trend in soft and hard data economic indicators,despite some recent additional volatility and deceleration
Coincident indicators and real GDP Retail sales and Industrial production
[yoy %] [3 month average, YoY%]
Source: Banco de Portugal, Statistics PortugalSource: Statistics Portugal
48
-14%
-12%
-10%
-8%
-6%
-4%
-2%
0%
2%
4%
6%
8%
Industrial Production
Retail Sales
-8,0
-6,0
-4,0
-2,0
0,0
2,0
4,0
GDP (YoY, %)
Monthly coincident indicator for economic activity
Monthly coincident indicator for private consumption
A. Macroeconomic indicators
-3,0
-2,0
-1,0
0,0
1,0
2,0
3,0
Diff Euro area (19 countries) Portugal
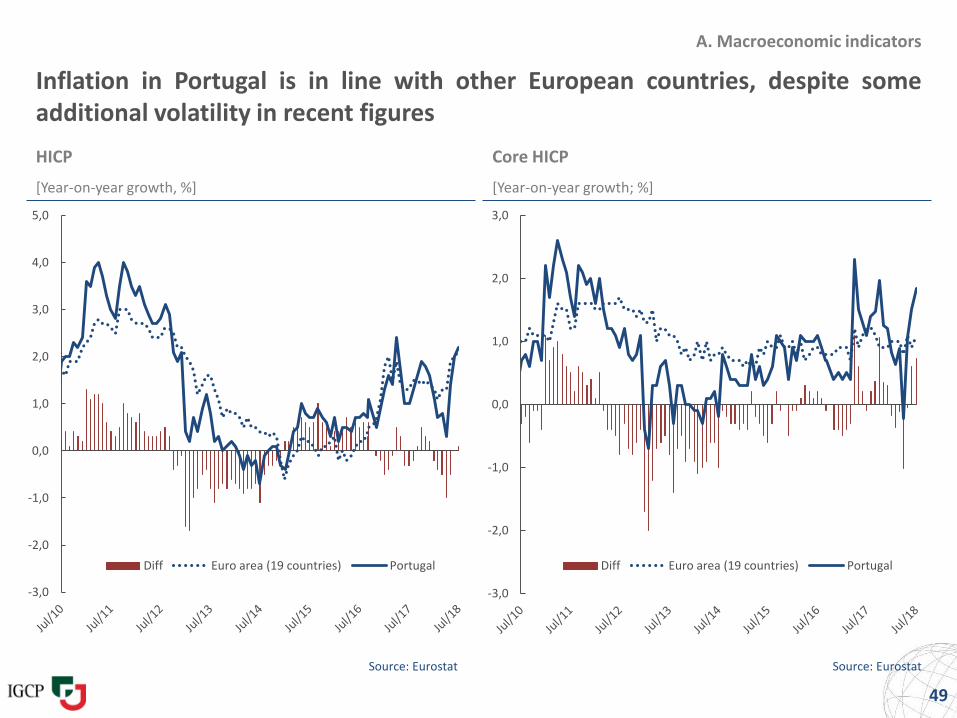
Inflation in Portugal is in line with other European countries, despite someadditional volatility in recent figures
HICP Core HICP
[Year-on-year growth, %] [Year-on-year growth; %]
Source: Eurostat Source: Eurostat
49
A. Macroeconomic indicators
-3,0
-2,0
-1,0
0,0
1,0
2,0
3,0
4,0
5,0
Diff Euro area (19 countries) Portugal
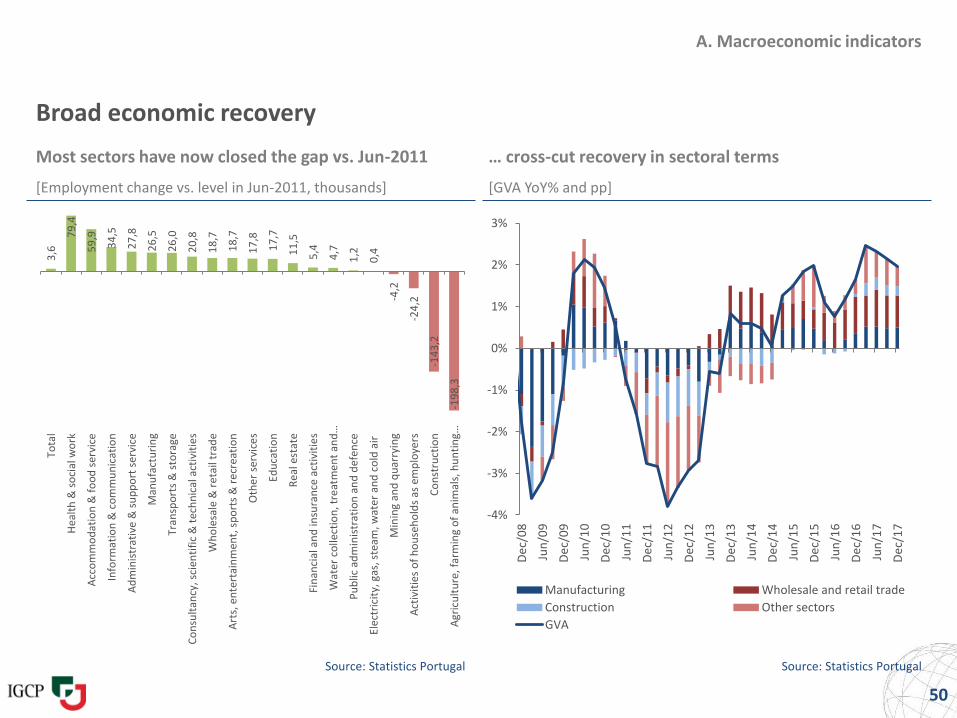
A. Macroeconomic indicators
Broad economic recovery
Most sectors have now closed the gap vs. Jun-2011
[Employment change vs. level in Jun-2011, thousands]
Source: Statistics Portugal Source: Statistics Portugal
50
[GVA YoY% and pp]
… cross-cut recovery in sectoral terms
-4%
-3%
-2%
-1%
0%
1%
2%
3%
De
c/0
8
Jun
/09
De
c/0
9
Jun
/10
De
c/1
0
Jun
/11
De
c/1
1
Jun
/12
De
c/1
2
Jun
/13
De
c/1
3
Jun
/14
De
c/1
4
Jun
/15
De
c/1
5
Jun
/16
De
c/1
6
Jun
/17
De
c/1
7
Manufacturing Wholesale and retail trade
Construction Other sectors
GVA
3,6
79
,4
59
,9
34
,5
27
,8
26
,5
26
,0
20
,8
18
,7
18
,7
17
,8
17
,7
11
,5
5,4
4,7
1,2
0,4
-4,2
-24
,2
-14
3,2
-19
8,3
Tota
l
Hea
lth
& s
oci
al w
ork
Acc
om
mo
dat
ion
& f
oo
d s
ervi
ce
Info
rmat
ion
& c
om
mu
nic
atio
n
Ad
min
istr
ativ
e &
su
pp
ort
se
rvic
e
Man
ufa
ctu
rin
g
Tran
spo
rts
& s
tora
ge
Co
nsu
ltan
cy, s
cien
tifi
c &
tec
hn
ical
act
ivit
ies
Wh
ole
sale
& r
eta
il tr
ade
Art
s, e
nte
rtai
nm
ent,
sp
ort
s &
re
crea
tio
n
Oth
er
serv
ice
s
Edu
cati
on
Rea
l est
ate
Fin
anci
al a
nd
insu
ran
ce a
ctiv
itie
s
Wat
er c
olle
ctio
n, t
reat
me
nt
and
…
Pu
blic
ad
min
istr
atio
n a
nd
def
ence
Elec
tric
ity,
gas
, ste
am, w
ate
r an
d c
old
air
Min
ing
and
qu
arry
ing
Act
ivit
ies
of
ho
use
ho
lds
as e
mp
loye
rs
Co
nst
ruct
ion
Agr
icu
ltu
re, f
arm
ing
of
anim
als,
hu
nti
ng…
100%-10,7%
-8,0%
-7,7%
-7,4%
-5,4%
-4,2%-4,2%
-3,6%-2,2%
-1,6% -1,1% 44%
Dec
-08
Man
ufa
ctu
rin
g, M
inin
g an
d q
uar
ryin
g
Elec
tric
ity,
gas
, wat
er
Wh
ole
sale
an
d r
etai
l tra
de
, re
pai
r o
fve
hic
les
Tech
nic
al, c
on
sult
ancy
an
d o
ther
act
ivit
ies
Tran
spo
rtat
ion
an
d s
tora
ge
Co
nst
ruct
ion
Rea
l est
ate
Acc
om
mo
dat
ion
, Fo
od
an
d b
eve
rage
Edu
cati
on
, he
alth
an
d o
the
r se
rvic
es
Info
rmat
ion
an
d c
om
mu
nic
atio
n
Agr
icu
ltu
re, f
ore
stry
an
d f
ish
ing
Dec
-12
44% -1,0% -0,4% -0,2%
65%
0,8% 1,2% 1,5% 1,9%2,5%
3,8%
5,5%
5,5%
Dec
-12
Elec
tric
ity,
gas
, wat
er
Co
nst
ruct
ion
Info
rmat
ion
an
d c
om
mu
nic
atio
n
Edu
cati
on
, he
alth
an
d o
the
r se
rvic
es
Agr
icu
ltu
re, f
ore
stry
an
d f
ish
ing
Tran
spo
rtat
ion
an
d s
tora
ge
Acc
om
mo
dat
ion
, Fo
od
an
d b
eve
rage
Rea
l est
ate
Wh
ole
sale
an
d r
etai
l tra
de
, re
pai
r o
f ve
hic
les
Man
ufa
ctu
rin
g, M
inin
g an
d q
uar
ryin
g
Tech
nic
al, c
on
sult
ancy
an
d o
ther
act
ivit
ies
Dec
-16
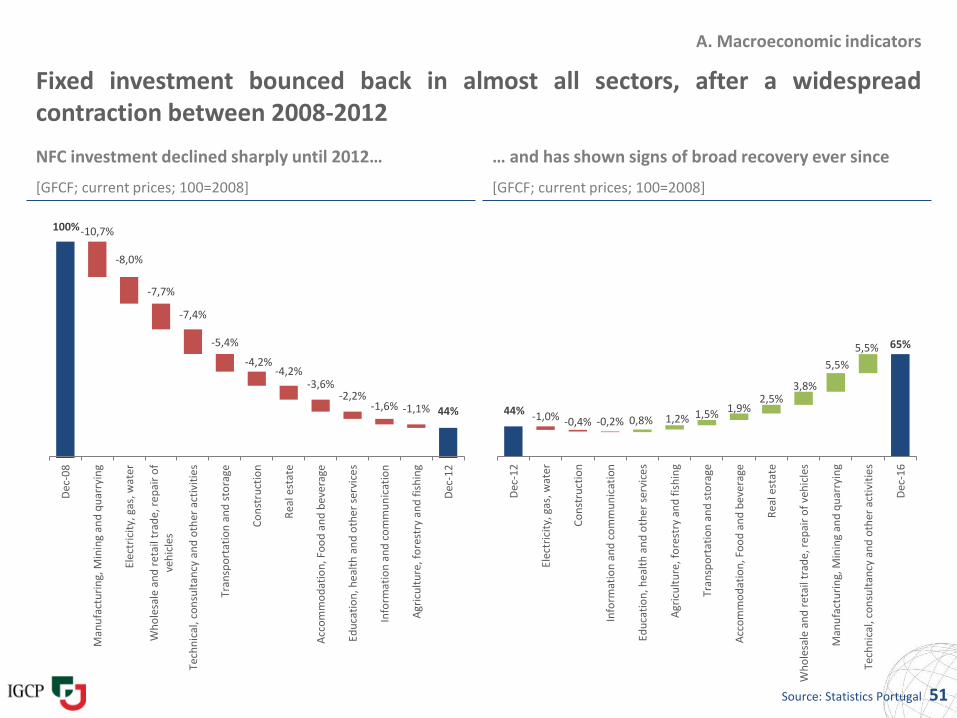
Fixed investment bounced back in almost all sectors, after a widespreadcontraction between 2008-2012
NFC investment declined sharply until 2012… … and has shown signs of broad recovery ever since
[GFCF; current prices; 100=2008] [GFCF; current prices; 100=2008]
Source: Statistics Portugal 51
A. Macroeconomic indicators
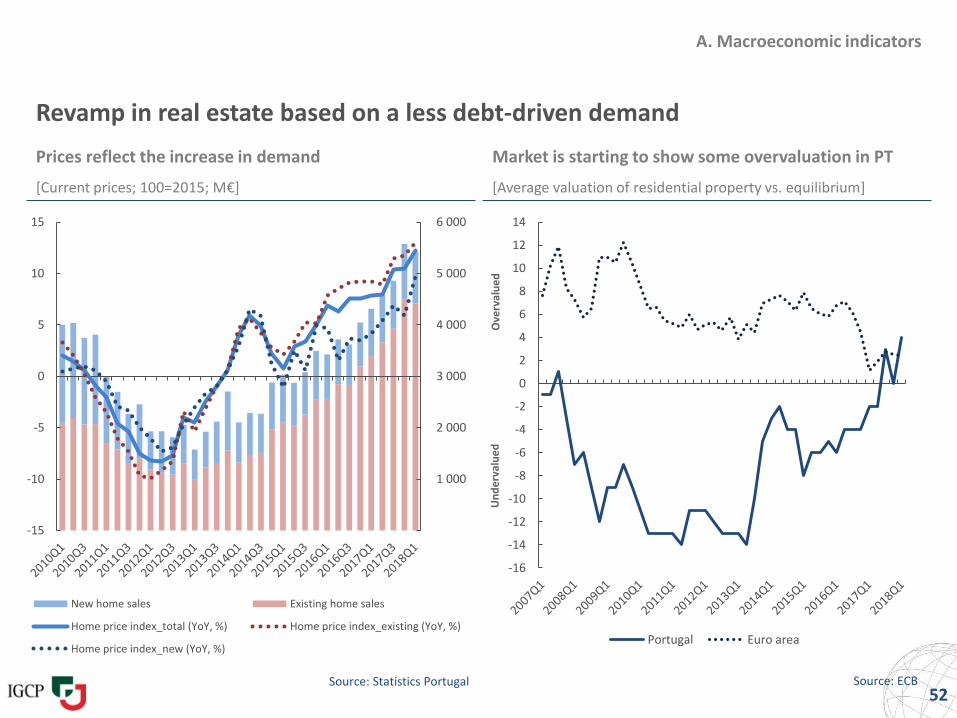
Revamp in real estate based on a less debt-driven demand
Prices reflect the increase in demand Market is starting to show some overvaluation in PT
[Current prices; 100=2015; M€] [Average valuation of residential property vs. equilibrium]
Source: ECB52
A. Macroeconomic indicators
Source: Statistics Portugal
1 000
2 000
3 000
4 000
5 000
6 000
-15
-10
-5
0
5
10
15
New home sales Existing home sales
Home price index_total (YoY, %) Home price index_existing (YoY, %)
Home price index_new (YoY, %)
-16
-14
-12
-10
-8
-6
-4
-2
0
2
4
6
8
10
12
14
Portugal Euro area
Un
de
rval
ue
dO
verv
alu
ed
-106,7
-81,3
-8,5
-140,0
-120,0
-100,0
-80,0
-60,0
-40,0
-20,0
0,0
Portugal Spain Italy
A. Macroeconomic indicators
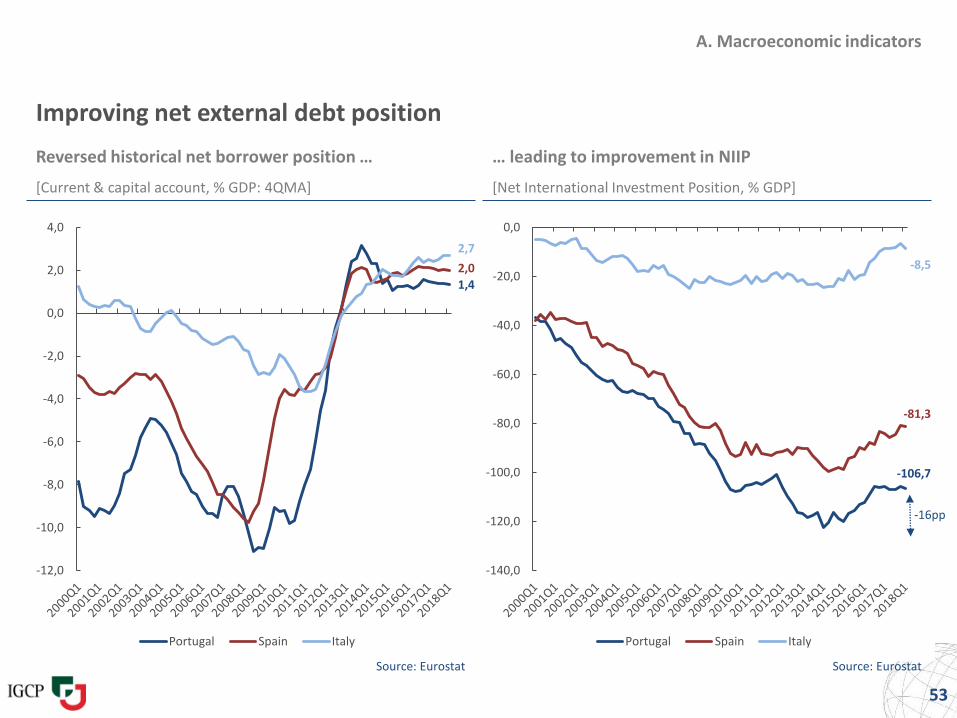
Improving net external debt position
Reversed historical net borrower position … … leading to improvement in NIIP
[Current & capital account, % GDP: 4QMA] [Net International Investment Position, % GDP]
53
-16pp
Source: Eurostat Source: Eurostat
1,4
2,0
2,7
-12,0
-10,0
-8,0
-6,0
-4,0
-2,0
0,0
2,0
4,0
Portugal Spain Italy
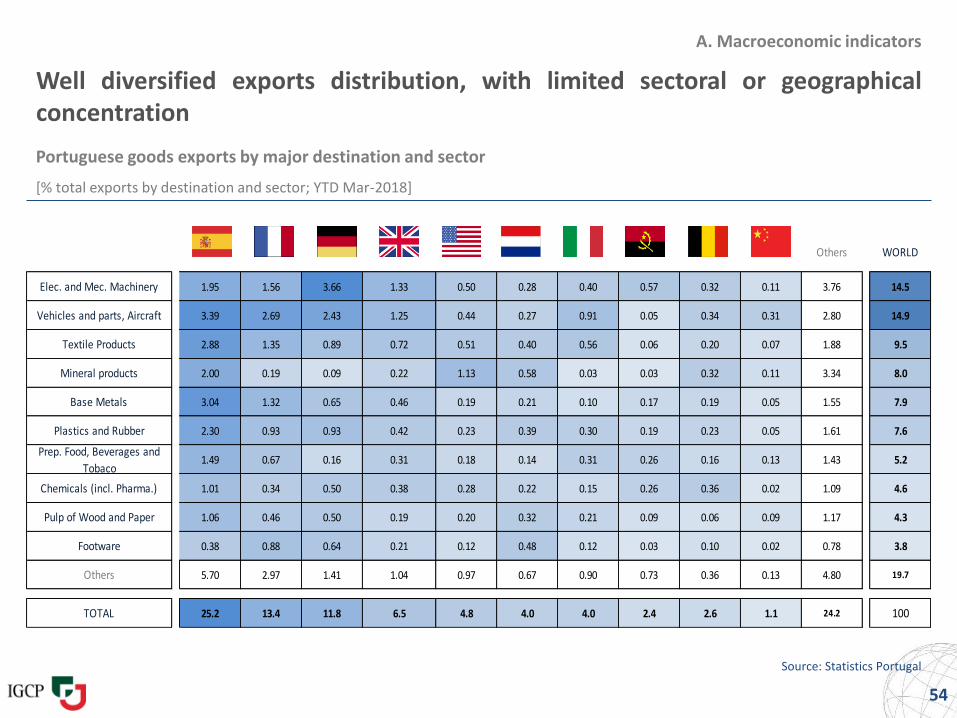
Well diversified exports distribution, with limited sectoral or geographicalconcentration
Portuguese goods exports by major destination and sector
[% total exports by destination and sector; YTD Mar-2018]
Source: Statistics Portugal
54
A. Macroeconomic indicators
Others WORLD
Elec. and Mec. Machinery 1.95 1.56 3.66 1.33 0.50 0.28 0.40 0.57 0.32 0.11 3.76 14.5
Vehicles and parts, Aircraft 3.39 2.69 2.43 1.25 0.44 0.27 0.91 0.05 0.34 0.31 2.80 14.9
Textile Products 2.88 1.35 0.89 0.72 0.51 0.40 0.56 0.06 0.20 0.07 1.88 9.5
Mineral products 2.00 0.19 0.09 0.22 1.13 0.58 0.03 0.03 0.32 0.11 3.34 8.0
Base Metals 3.04 1.32 0.65 0.46 0.19 0.21 0.10 0.17 0.19 0.05 1.55 7.9
Plastics and Rubber 2.30 0.93 0.93 0.42 0.23 0.39 0.30 0.19 0.23 0.05 1.61 7.6
Prep. Food, Beverages and
Tobaco1.49 0.67 0.16 0.31 0.18 0.14 0.31 0.26 0.16 0.13 1.43 5.2
Chemicals (incl. Pharma.) 1.01 0.34 0.50 0.38 0.28 0.22 0.15 0.26 0.36 0.02 1.09 4.6
Pulp of Wood and Paper 1.06 0.46 0.50 0.19 0.20 0.32 0.21 0.09 0.06 0.09 1.17 4.3
Footware 0.38 0.88 0.64 0.21 0.12 0.48 0.12 0.03 0.10 0.02 0.78 3.8
Others 5.70 2.97 1.41 1.04 0.97 0.67 0.90 0.73 0.36 0.13 4.80 19.7
TOTAL 25.2 13.4 11.8 6.5 4.8 4.0 4.0 2.4 2.6 1.1 24.2 100
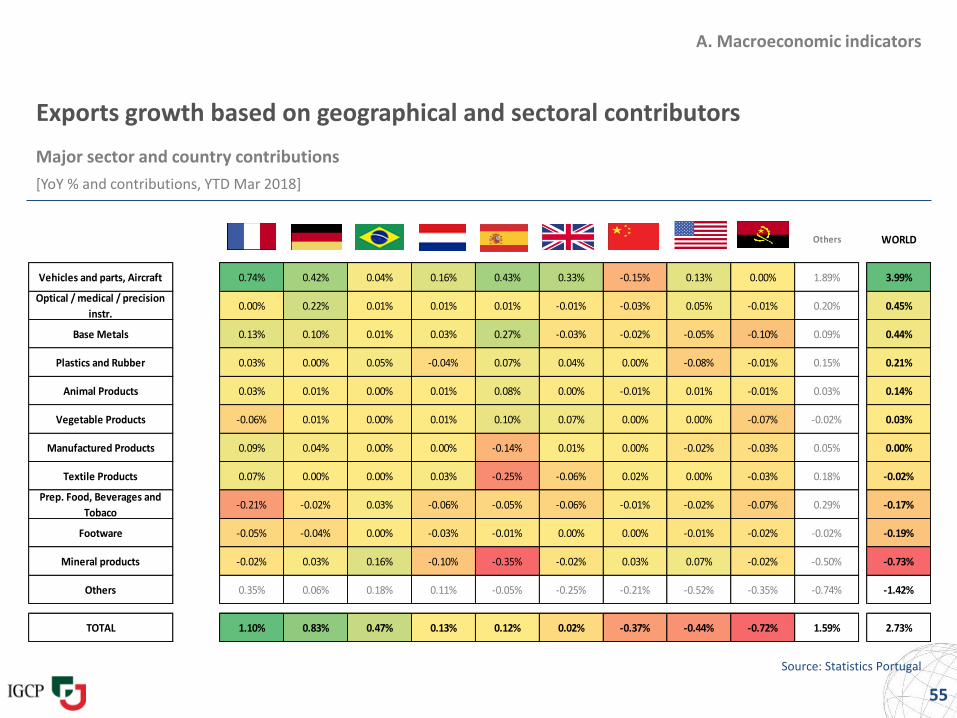
Exports growth based on geographical and sectoral contributors
Major sector and country contributions
[YoY % and contributions, YTD Mar 2018]
Source: Statistics Portugal
55
A. Macroeconomic indicators
France Germany Brazil Netherlands Spain United Kingdom China United States Angola Others WORLD
Vehicles and parts, AircraftVehicles,
aircraft, 0.74% 0.42% 0.04% 0.16% 0.43% 0.33% -0.15% 0.13% 0.00% 1.89% 3.99%
Optical / medical / precision
instr.
Optical,
photogra0.00% 0.22% 0.01% 0.01% 0.01% -0.01% -0.03% 0.05% -0.01% 0.20% 0.45%
Base MetalsBase
metals 0.13% 0.10% 0.01% 0.03% 0.27% -0.03% -0.02% -0.05% -0.10% 0.09% 0.44%
Plastics and RubberPlastics
and 0.03% 0.00% 0.05% -0.04% 0.07% 0.04% 0.00% -0.08% -0.01% 0.15% 0.21%
Animal ProductsLive
animals; 0.03% 0.01% 0.00% 0.01% 0.08% 0.00% -0.01% 0.01% -0.01% 0.03% 0.14%
Vegetable ProductsVegetabl
e -0.06% 0.01% 0.00% 0.01% 0.10% 0.07% 0.00% 0.00% -0.07% -0.02% 0.03%
Manufactured ProductsMiscella
neous 0.09% 0.04% 0.00% 0.00% -0.14% 0.01% 0.00% -0.02% -0.03% 0.05% 0.00%
Textile ProductsTextiles
and 0.07% 0.00% 0.00% 0.03% -0.25% -0.06% 0.02% 0.00% -0.03% 0.18% -0.02%
Prep. Food, Beverages and
Tobaco
Prepared
foodstuff-0.21% -0.02% 0.03% -0.06% -0.05% -0.06% -0.01% -0.02% -0.07% 0.29% -0.17%
FootwareFootwea
r, -0.05% -0.04% 0.00% -0.03% -0.01% 0.00% 0.00% -0.01% -0.02% -0.02% -0.19%
Mineral productsMineral
products-0.02% 0.03% 0.16% -0.10% -0.35% -0.02% 0.03% 0.07% -0.02% -0.50% -0.73%
Others 0.35% 0.06% 0.18% 0.11% -0.05% -0.25% -0.21% -0.52% -0.35% -0.74% -1.42%
TOTAL Total 1.10% 0.83% 0.47% 0.13% 0.12% 0.02% -0.37% -0.44% -0.72% 1.59% 2.73%
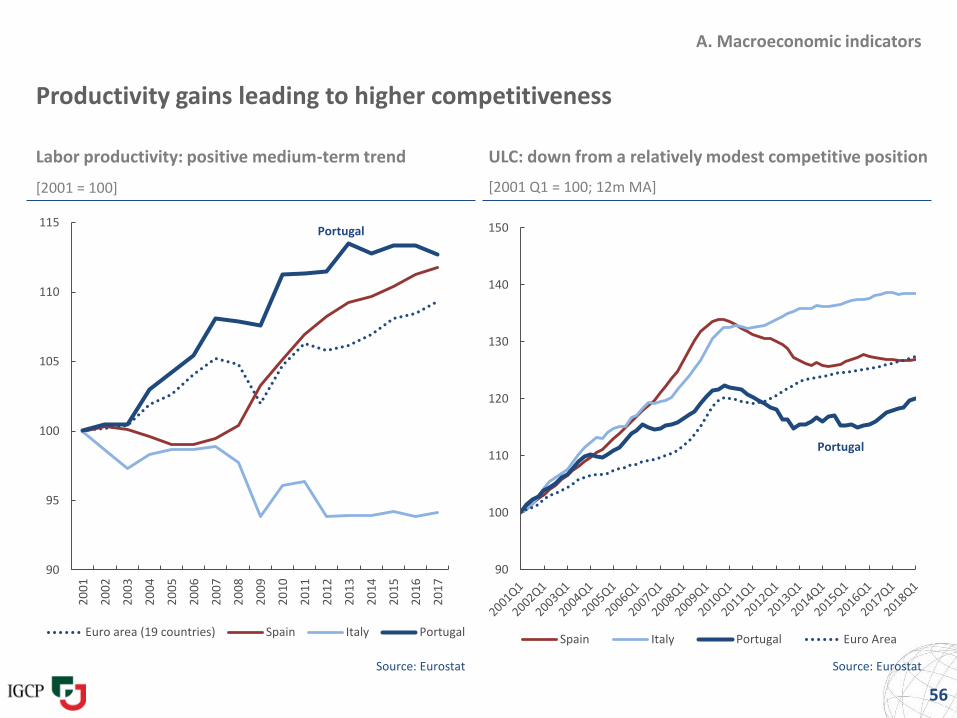
Productivity gains leading to higher competitiveness
Labor productivity: positive medium-term trend ULC: down from a relatively modest competitive position
[2001 = 100] [2001 Q1 = 100; 12m MA]
Source: Eurostat Source: Eurostat
56
A. Macroeconomic indicators
Portugal
90
95
100
105
110
115
20
01
20
02
20
03
20
04
20
05
20
06
20
07
20
08
20
09
20
10
20
11
20
12
20
13
20
14
20
15
20
16
20
17
Euro area (19 countries) Spain Italy Portugal
Portugal
90
100
110
120
130
140
150
Spain Italy Portugal Euro Area
Appendix
57
A. Macroeconomic indicators
B. Structural indicators
C. Fiscal indicators
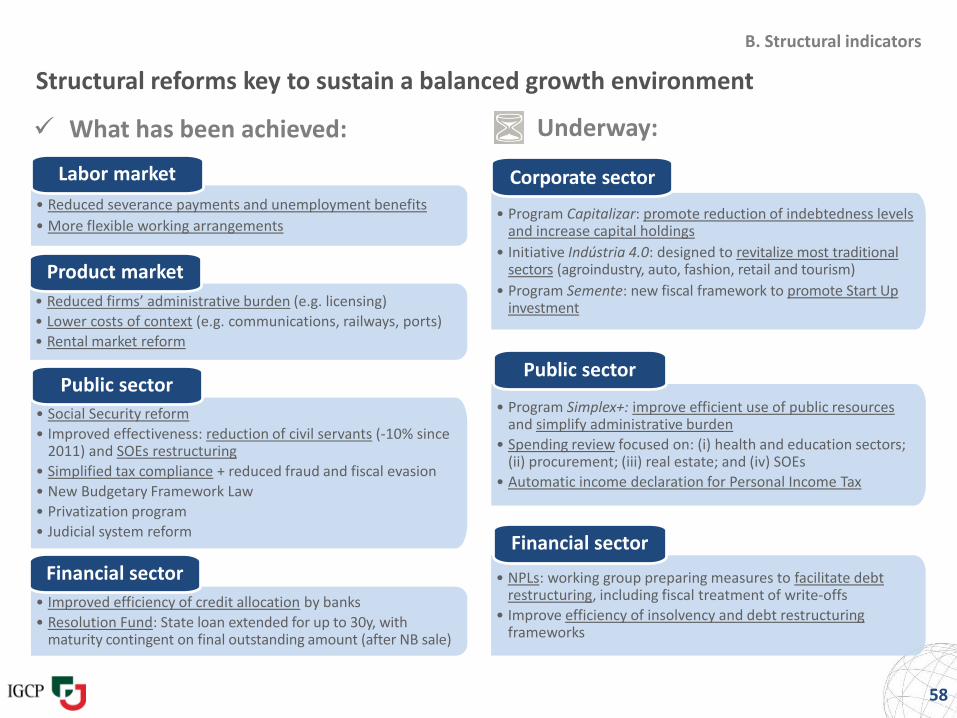
Structural reforms key to sustain a balanced growth environment
58
What has been achieved: Underway:
B. Structural indicators
• Improved efficiency of credit allocation by banks
• Resolution Fund: State loan extended for up to 30y, with maturity contingent on final outstanding amount (after NB sale)
Financial sector
• Social Security reform
• Improved effectiveness: reduction of civil servants (-10% since 2011) and SOEs restructuring
• Simplified tax compliance + reduced fraud and fiscal evasion
• New Budgetary Framework Law
• Privatization program
• Judicial system reform
Public sector
• Reduced firms’ administrative burden (e.g. licensing)
• Lower costs of context (e.g. communications, railways, ports)
• Rental market reform
Product market
• Reduced severance payments and unemployment benefits
• More flexible working arrangements
Labor market
• Program Capitalizar: promote reduction of indebtedness levels and increase capital holdings
• Initiative Indústria 4.0: designed to revitalize most traditional sectors (agroindustry, auto, fashion, retail and tourism)
• Program Semente: new fiscal framework to promote Start Up investment
Corporate sector
• Program Simplex+: improve efficient use of public resourcesand simplify administrative burden
• Spending review focused on: (i) health and education sectors; (ii) procurement; (iii) real estate; and (iv) SOEs
• Automatic income declaration for Personal Income Tax
Public sector
• NPLs: working group preparing measures to facilitate debt restructuring, including fiscal treatment of write-offs
• Improve efficiency of insolvency and debt restructuring frameworks
Financial sector
B. Structural indicators
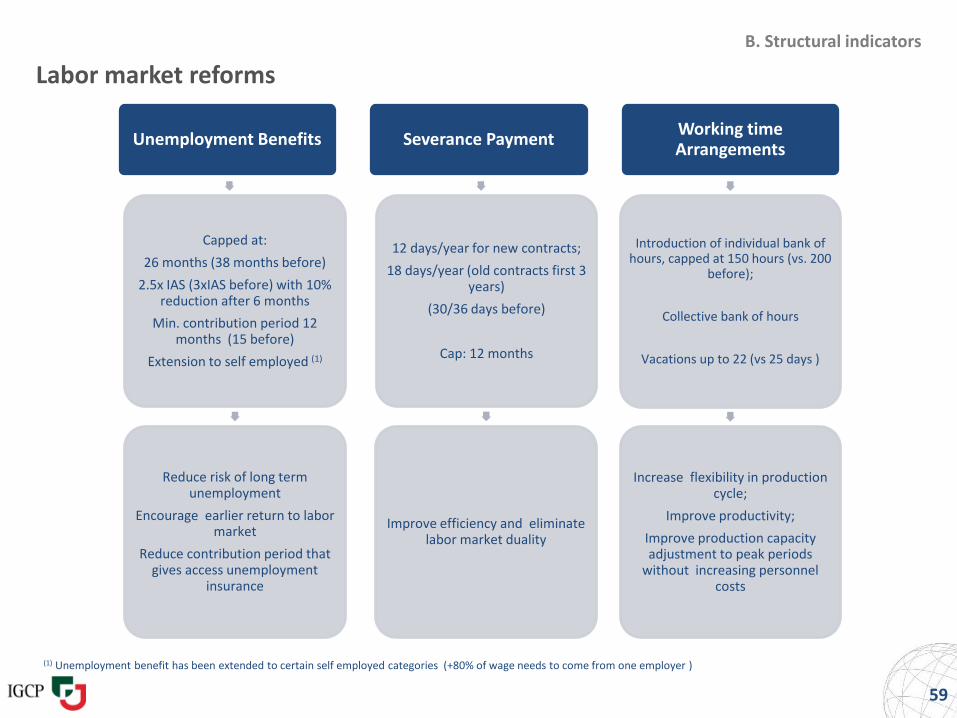
Labor market reforms
59
(1) Unemployment benefit has been extended to certain self employed categories (+80% of wage needs to come from one employer )
Unemployment Benefits
Capped at:
26 months (38 months before)
2.5x IAS (3xIAS before) with 10% reduction after 6 months
Min. contribution period 12 months (15 before)
Extension to self employed (1)
Reduce risk of long term unemployment
Encourage earlier return to labor market
Reduce contribution period that gives access unemployment
insurance
Severance Payment
12 days/year for new contracts;
18 days/year (old contracts first 3 years)
(30/36 days before)
Cap: 12 months
Improve efficiency and eliminate labor market duality
Working time Arrangements
Introduction of individual bank of hours, capped at 150 hours (vs. 200
before);
Collective bank of hours
Vacations up to 22 (vs 25 days )
Increase flexibility in production cycle;
Improve productivity;
Improve production capacity adjustment to peak periods
without increasing personnel costs
B. Structural indicators
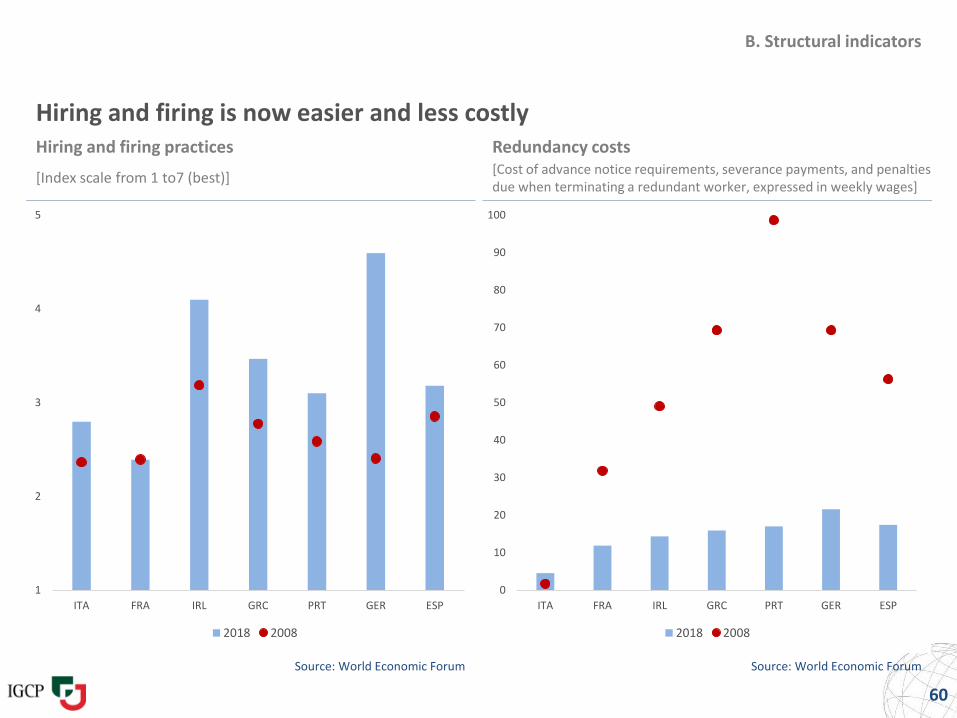
Hiring and firing is now easier and less costly
Source: World Economic Forum Source: World Economic Forum
60
Hiring and firing practices
[Index scale from 1 to7 (best)]
Redundancy costs[Cost of advance notice requirements, severance payments, and penalties due when terminating a redundant worker, expressed in weekly wages]
1
2
3
4
5
ITA FRA IRL GRC PRT GER ESP
2018 2008
0
10
20
30
40
50
60
70
80
90
100
ITA FRA IRL GRC PRT GER ESP
2018 2008
Appendix
61
A. Macroeconomic indicators
B. Structural reforms
C. Fiscal indicators
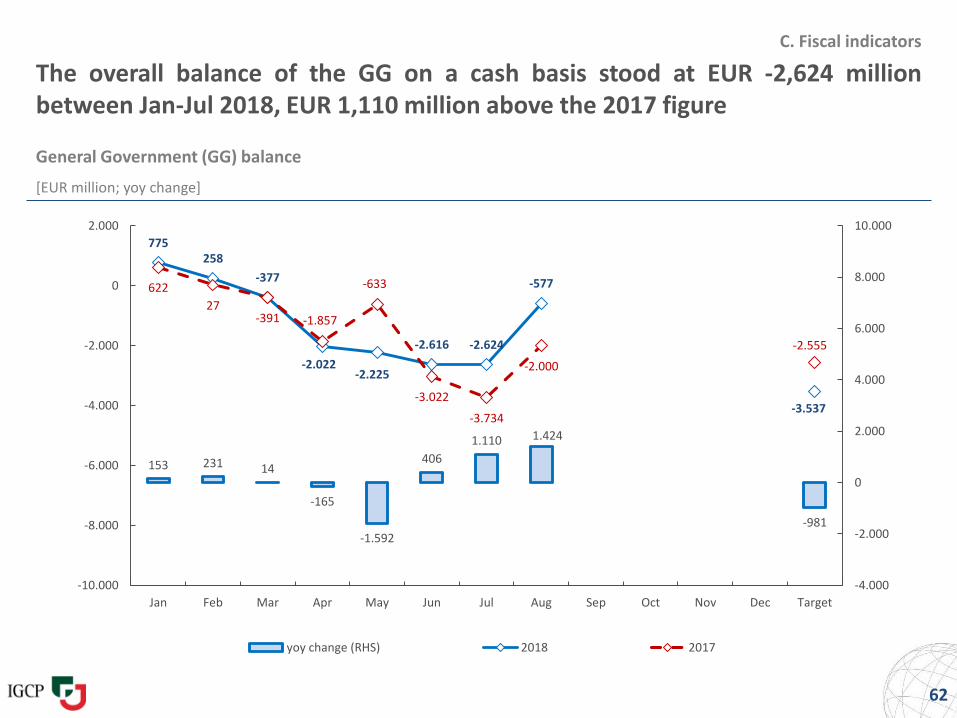
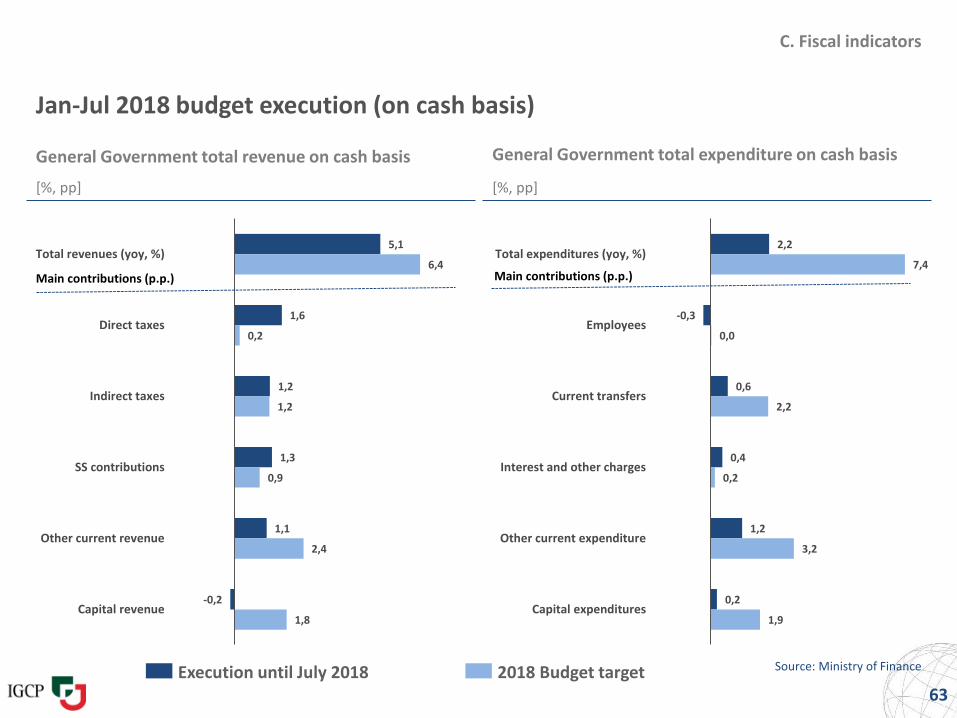
The overall balance of the GG on a cash basis stood at EUR -2,624 millionbetween Jan-Jul 2018, EUR 1,110 million above the 2017 figure
General Government (GG) balance
[EUR million; yoy change]
62
C. Fiscal indicators
153 231 14
-165
-1.592
406
1.110 1.424
-981
775258
-377
-2.022-2.225
-2.616 -2.624
-577
-3.537
622
27-391 -1.857
-633
-3.022
-3.734
-2.000
-2.555
-4.000
-2.000
0
2.000
4.000
6.000
8.000
10.000
-10.000
-8.000
-6.000
-4.000
-2.000
0
2.000
Jan Feb Mar Apr May Jun Jul Aug Sep Oct Nov Dec Target
yoy change (RHS) 2018 2017
2,2
-0,3
0,6
0,4
1,2
0,2
7,4
0,0
2,2
0,2
3,2
1,9
Total expenditures (yoy, %)
Employees
Current transfers
Interest and other charges
Other current expenditure
Capital expenditures
Main contributions (p.p.)
5,1
1,6
1,2
1,3
1,1
-0,2
6,4
0,2
1,2
0,9
2,4
1,8
Total revenues (yoy, %)
Direct taxes
Indirect taxes
SS contributions
Other current revenue
Capital revenue
Main contributions (p.p.)
Jan-Jul 2018 budget execution (on cash basis)
General Government total revenue on cash basis General Government total expenditure on cash basis
[%, pp] [%, pp]
Source: Ministry of Finance
63Execution until July 2018 2018 Budget target
C. Fiscal indicators
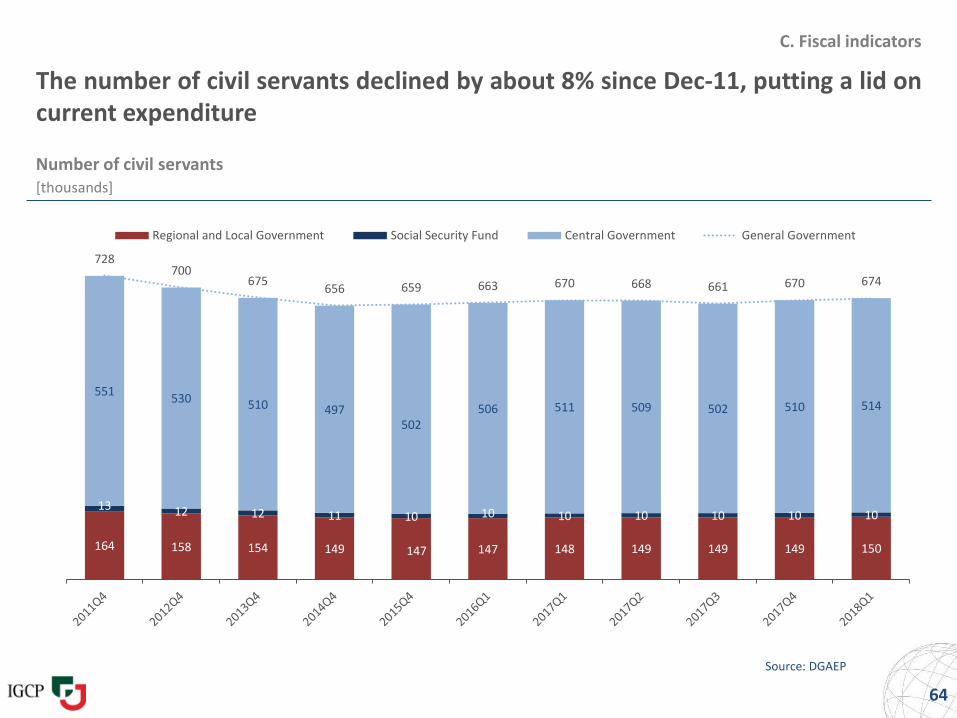
The number of civil servants declined by about 8% since Dec-11, putting a lid oncurrent expenditure
Number of civil servants[thousands]
Source: DGAEP
64
C. Fiscal indicators
164 158 154 149 147 147 148 149 149 149 150
13 12 12 11 10 10 10 10 10 10 10
551530 510 497
502506 511 509 502 510 514
728700
675656 659 663 670 668 661 670 674
Regional and Local Government Social Security Fund Central Government General Government
C. Fiscal indicators
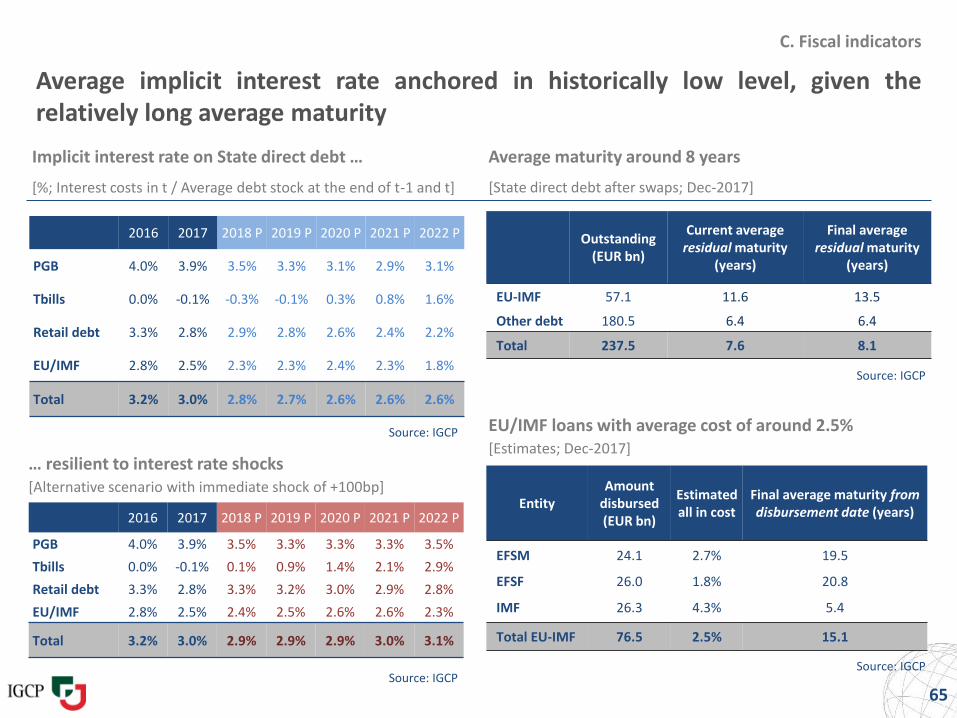
Average implicit interest rate anchored in historically low level, given therelatively long average maturity
Average maturity around 8 yearsImplicit interest rate on State direct debt …
[State direct debt after swaps; Dec-2017][%; Interest costs in t / Average debt stock at the end of t-1 and t]
Source: IGCP
Source: IGCP
65
EntityAmount
disbursed (EUR bn)
Estimated all in cost
Final average maturity from disbursement date (years)
EFSM 24.1 2.7% 19.5
EFSF 26.0 1.8% 20.8
IMF 26.3 4.3% 5.4
Total EU-IMF 76.5 2.5% 15.1
EU/IMF loans with average cost of around 2.5%[Estimates; Dec-2017]
Outstanding (EUR bn)
Current average residual maturity
(years)
Final average residual maturity
(years)
EU-IMF 57.1 11.6 13.5
Other debt 180.5 6.4 6.4
Total 237.5 7.6 8.1
2016 2017 2018 P 2019 P 2020 P 2021 P 2022 P
PGB 4.0% 3.9% 3.5% 3.3% 3.1% 2.9% 3.1%
Tbills 0.0% -0.1% -0.3% -0.1% 0.3% 0.8% 1.6%
Retail debt 3.3% 2.8% 2.9% 2.8% 2.6% 2.4% 2.2%
EU/IMF 2.8% 2.5% 2.3% 2.3% 2.4% 2.3% 1.8%
Total 3.2% 3.0% 2.8% 2.7% 2.6% 2.6% 2.6%
… resilient to interest rate shocks[Alternative scenario with immediate shock of +100bp]
2016 2017 2018 P 2019 P 2020 P 2021 P 2022 P
PGB 4.0% 3.9% 3.5% 3.3% 3.3% 3.3% 3.5%
Tbills 0.0% -0.1% 0.1% 0.9% 1.4% 2.1% 2.9%
Retail debt 3.3% 2.8% 3.3% 3.2% 3.0% 2.9% 2.8%
EU/IMF 2.8% 2.5% 2.4% 2.5% 2.6% 2.6% 2.3%
Total 3.2% 3.0% 2.9% 2.9% 2.9% 3.0% 3.1%
Source: IGCP
Source: IGCP
Web site: www.igcp.ptBloomberg pages: IGCPReuters pages: IGCP01
66
Disclaimer
The information and opinions contained in this presentation have been compiled or arrived at from sources believed to be reliable and ingood faith, but no representation or warranty, express or implied, is made as to their accuracy, completeness or correctness.
All opinions and estimates contained in this document are published for the assistance of recipients, but are not to be relied upon asauthoritative or taken in substitution for the exercise of judgment by a recipient and, therefore, do not form the basis of any contract orcommitment whatsoever.
IGCP does not accept any liability whatsoever for any direct or consequential loss arising from any use of this document or its contents.


![PORTUGAL - IGCP, E.P.E. - IGCP€¦ · …buoyed by strong gains in exports’market share 2. Stronger growth foundations 12 Significant gains in exports’ market share [Index 2007Q1=100]](https://img.pdfslide.net/doc/110x75/5f0c30927e708231d4342edd/portugal-igcp-epe-igcp-buoyed-by-strong-gains-in-exportsamarket-share.jpg)