Embed Size (px)
Citation preview

PORTUGUESE BANKING SECTOR OVERVIEW
MARCH 2012

MARCH 2012
AGENDA
PORTUGUESE BANKING SECTOR OVERVIEW
I. Importance of the banking sector for the economy
II. Credit activity
III. Funding
IV. Solvency
V. State guarantee and recapitalisation schemes for credit institutions

MARCH 2012
PORTUGUESE BANKING SECTOR OVERVIEW
I. Importance of the Banking Sector for the Economy

The financial crisis didn’t slow down the Portuguese banks’ total assets growth, contrary to what happened in the Euro area.
4 MARCH 2012 PORTUGUESE BANKING SECTOR OVERVIEW
Source: ECB
Banking sector’s total assets evolution (December 2005=100)
90
100
110
120
130
140
150
160
170
Dec-05 Jun-06 Dec-06 Jun-07 Dec-07 Jun-08 Dec-08 Jun-09 Dec-09 Jun-10 Dec-10 Jun-11 Dec-11
Index
Portugal Euro area
Average annual growth rate (YoY)
Portugal = 9.5% Euro area = 11.1%
Average annual growth rate (YoY)
Portugal = 7.5% Euro area = 1.5%

The Portuguese banking sector plays an important role in the economy; nevertheless, its weight on the national GDP is still below Euro area’s ratio.
5 MARCH 2012 PORTUGUESE BANKING SECTOR OVERVIEW
Portugal
Euro area
0%
100%
200%
300%
400%
1998 1999 2000 2001 2002 2003 2004 2005 2006 2007 2008 2009 2010 2011
Source: ECB
Banking sector’s assets relative to GDP* for Portugal and Euro area
Contrary to the recent stagnation of the Euro
area’s banking assets over GDP ratio, Portuguese banks’ weight on the
national GDP kept growing.
* Nominal Gross Domestic Product.

In Portugal, the contribution of financial intermediation activities for the national Gross Value Added stays well above the one of the Euro area.
6 MARCH 2012 PORTUGUESE BANKING SECTOR OVERVIEW
Financial intermediation GVA relative to total GVA for Portugal and selected European Union countries*
In Portugal, financial service activities (except insurance and
pension funding and including the ones carried out by Banco de
Portugal), contribute to approximately 6% of the national
Gross Value Added. This weight is relatively high when compared to
other euro area countries.
0% 2% 4% 6% 8% 10% 12%
Germany
France
Euro area
Italy
Spain
Greece
Portugal
United Kingdom
Ireland
Financial intermediation activities (except insurance and pension funding)
Insurance, pension funding and activities auxiliary to financial intermediation
Source: Eurostat, Statistics Portugal (INE), Central Statistics Office Ireland
* Data refers to year 2008.

MARCH 2012
PORTUGUESE BANKING SECTOR OVERVIEW
II. Credit Activity
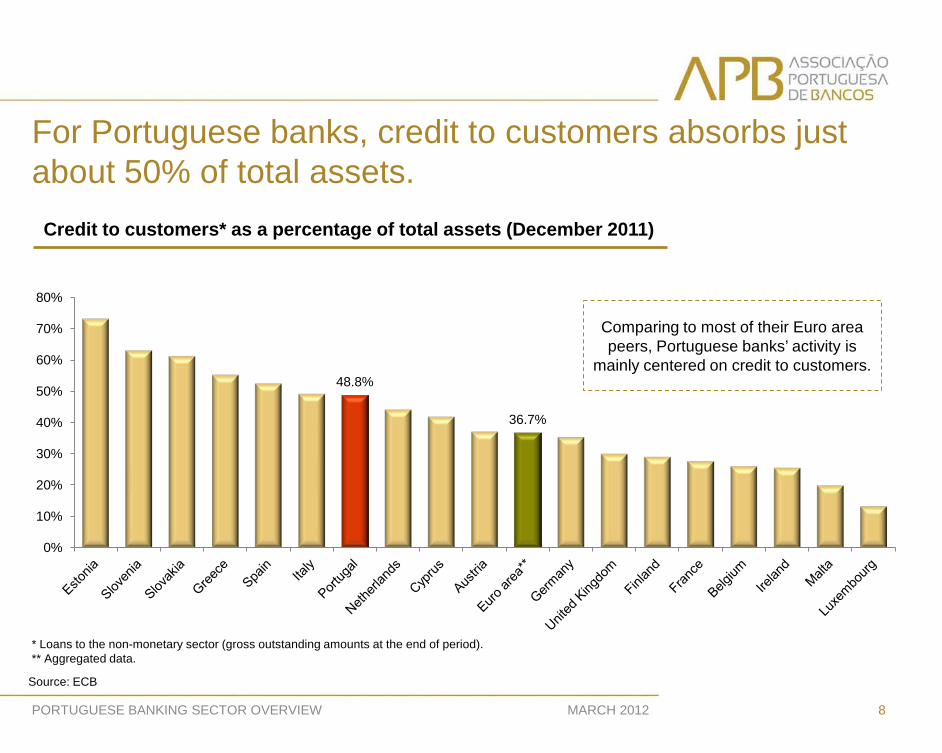
For Portuguese banks, credit to customers absorbs just about 50% of total assets.
8 MARCH 2012 PORTUGUESE BANKING SECTOR OVERVIEW
Credit to customers* as a percentage of total assets (December 2011)
48.8%
36.7%
0%
10%
20%
30%
40%
50%
60%
70%
80%
Comparing to most of their Euro area peers, Portuguese banks’ activity is
mainly centered on credit to customers.
Source: ECB
* Loans to the non-monetary sector (gross outstanding amounts at the end of period). ** Aggregated data.

During the period that preceded the financial crisis, credit volumes have followed a strong increasing trend, both in Portugal and in the Euro area.
MARCH 2012 9
Source: ECB
PORTUGUESE BANKING SECTOR OVERVIEW
90
95
100
105
110
115
120
125
130
135
140
Dec-05 Jun-06 Dec-06 Jun-07 Dec-07 Jun-08 Dec-08 Jun-09 Dec-09 Jun-10 Dec-10 Jun-11 Dec-11
Index
Portugal (100 = 253,683 M€) Euro area (100 = 13,678,287 M€)
Average annual growth rate (YoY) Portugal = 1.4%
Euro area = 1.7%
In the summer of 2008, credit
growth began to show signs of slowdown.
In Portugal, credit volume has even been decreasing
since the 2nd quarter of 2011.
Trends in credit* in Portugal and in the Euro Area (Dec. 2005=100)
* Loans to the monetary and non-monetary sectors (gross outstanding amounts at the end of period).

Despite the reduction in the Credit to GDP ratio in 2011, the Portuguese economy still presents relatively high levels of bank debt when compared with the Euro area.
10 MARCH 2012 PORTUGUESE BANKING SECTOR OVERVIEW
Source: ECB, Eurostat
Credit to Customers* / GDP** ratio
* Loans to the non-monetary sector (gross outstanding amounts at the end of period). ** Nominal Gross Domestic Product.
0%
50%
100%
150%
200%
250%
Ireland Spain United Kingdom
Portugal Euro area Italy Greece Germany France
% GDP**
2000 2007 2010 2011
At the end of 2011, credit to customers in Portugal represented around 163% of the nominal GDP.
Since 2000 this ratio increased by approximately 45 percentage points.
Nevertheless, Portugal’s Credit to Customers/ GDP ratio dropped in the last two years.

Stocks of credit to households and non-financial corporations reveal divergent trends than stocks of credit to the general Government.
11 MARCH 2012 PORTUGUESE BANKING SECTOR OVERVIEW
In April 2011, when Portugal asked for international
financial assistance, credit volumes to general
government hit its peak.
Trends in credit volumes* by institutional sector (Dec. 2005=100)
General Government**
Households
Non-financial corporations***
0
50
100
150
200
250
300
350
400
Dec-05 Jun-06 Dec-06 Jun-07 Dec-07 Jun-08 Dec-08 Jun-09 Dec-09 Jun-10 Dec-10 Jun-11 Dec-11
Index
The agreement on a financial support programme for Greece in May 2010 seriously
worsened the Portuguese Republic’s conditions in obtaining financing through financial markets. On that period, the 10yr bond yield hit its maximum since Portugal
adopted the euro, 6.29%, leading to the abrupt growth in credit to general government.
Source: Banco de Portugal
* Gross outstanding amounts at the end of period. ** Only includes loans (does not include public debt securities). *** Includes state-owned non-financial corporations.
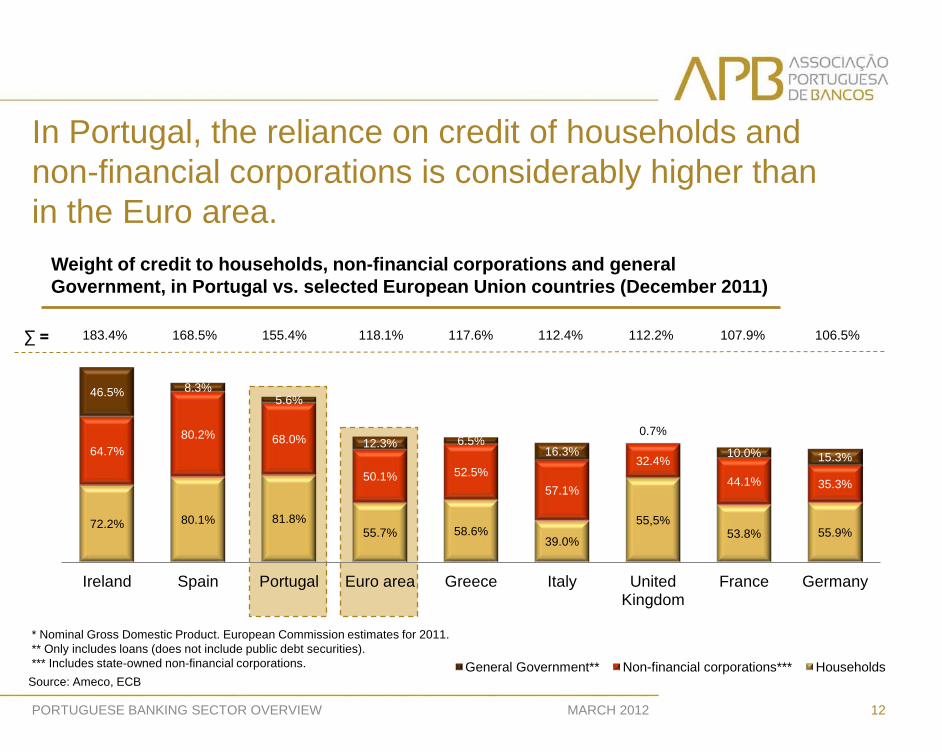
In Portugal, the reliance on credit of households and non-financial corporations is considerably higher than in the Euro area.
12 MARCH 2012 PORTUGUESE BANKING SECTOR OVERVIEW
Source: Ameco, ECB
* Nominal Gross Domestic Product. European Commission estimates for 2011. ** Only includes loans (does not include public debt securities). *** Includes state-owned non-financial corporations.
72.2% 80.1% 81.8% 55.7% 58.6%
39.0%
55,5% 53.8% 55.9%
64.7% 80.2% 68.0%
50.1% 52.5% 57.1%
32.4%
44.1% 35.3%
46.5% 8.3% 5.6%
12.3% 6.5% 16.3%
0.7%
10.0% 15.3%
Ireland Spain Portugal Euro area Greece Italy United Kingdom
France Germany
General Government** Non-financial corporations*** Households
Weight of credit to households, non-financial corporations and general Government, in Portugal vs. selected European Union countries (December 2011)
∑ = 168.5% 155.4% 118.1% 117.6% 112.4% 112.2% 107.9% 106.5% 183.4%
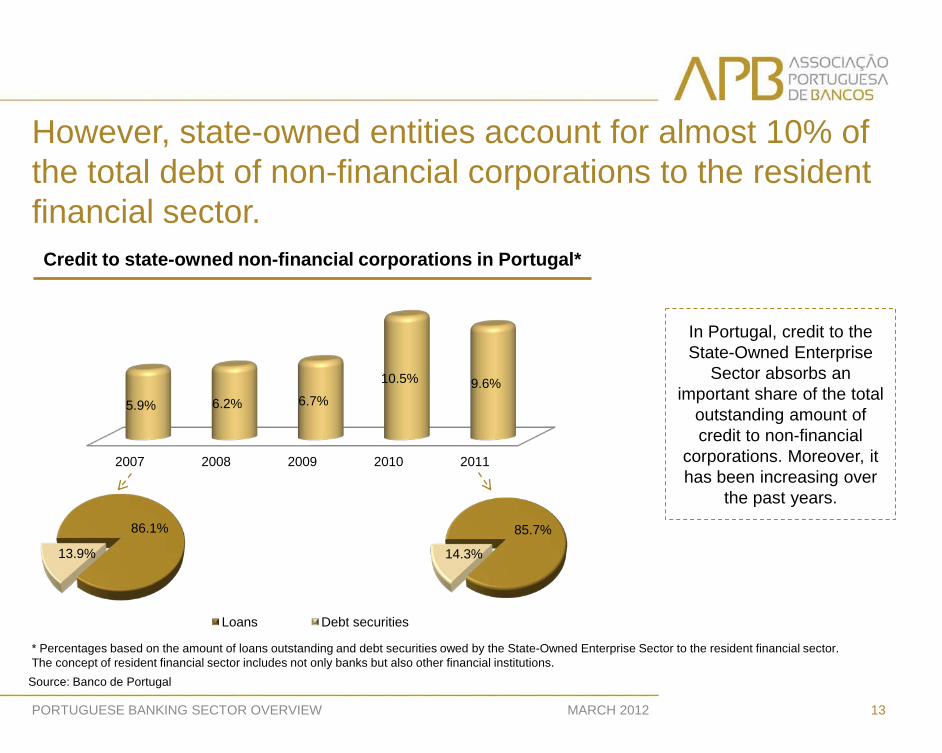
However, state-owned entities account for almost 10% of the total debt of non-financial corporations to the resident financial sector.
13 MARCH 2012 PORTUGUESE BANKING SECTOR OVERVIEW
Source: Banco de Portugal
2007 2008 2009 2010 2011
5.9% 6.2% 6.7%
10.5% 9.6%
In Portugal, credit to the State-Owned Enterprise
Sector absorbs an important share of the total
outstanding amount of credit to non-financial
corporations. Moreover, it has been increasing over
the past years.
Credit to state-owned non-financial corporations in Portugal*
* Percentages based on the amount of loans outstanding and debt securities owed by the State-Owned Enterprise Sector to the resident financial sector. The concept of resident financial sector includes not only banks but also other financial institutions.
86.1%
13.9%
Loans Debt securities
85.7%
14.3%

Credit to households is primarily mortgages, whereas credit to NFC is mainly intended to construction and real estate.
14 MARCH 2012 PORTUGUESE BANKING SECTOR OVERVIEW
Non-financial
corporations 34%
General Government
3%
Others** 21%
Households 42%
Total credit* Others 8%
Consumer Credit 11%
Mortgages 81%
Credit to households
Source: Banco de Portugal
Construction & real estate
34%
Trade, accomodation
and food services
18%
Industry 13%
Agriculture, forestry and
fishing 2%
Others 33%
Credit to non-financial corporations
*Loans to the monetary and non-monetary sectors including non residents (gross outstanding amounts at the end of December 2011).

In Portugal, mortgages account for a bigger share on the outstanding amount of loans to households than in the Euro area.
15 MARCH 2012 PORTUGUESE BANKING SECTOR OVERVIEW
Source: ECB
The weight of consumer credit on the stock of
loans to households
decreased in the Euro area.
Nevertheless, the relevance of
this type of credit is still inferior in
Portugal when compared with its Euro area
peers.
Portugal Euro area
79.1% 80.5% 81.0%
10.8% 10.9% 10.7%
10.1% 8.6% 8.3%
2007 2010 2011
71.4% 71.7% 72.2%
12.9% 12.4% 11.7%
15.7% 15.9% 16.1%
2007 2010 2011
Others Consumption Mortgage

The trend of residential property prices in Portugal shows a more stable pattern than the one of other Euro area countries.
16 MARCH 2012 PORTUGUESE BANKING SECTOR OVERVIEW
Source: ECB
Residential property prices in Portugal and selected Euro area countries (Mar. 2000=100)
When the sub-prime crisis erupted, residential property prices in Portugal remained relatively constant. The real estate sector had not been influenced by a speculative boom, as happened in Spain or in Ireland.
Portugal
Spain
Ireland
Euro area
50
100
150
200
250
Index

Within the Euro area, the real estate sector absorbs the largest portion of the outstanding amount of loans to non-financial institutions.
17 MARCH 2012 PORTUGUESE BANKING SECTOR OVERVIEW
Portugal Euro area
Source: Banco de Portugal, ECB
Agriculture & industry Construction Real estate, professional, technical and administrative activities Trade, accommodation and food service activities Others
22.0% 20.4% 20.1%
15.0% 14.8% 14.9%
31.1% 33.2% 33.1%
9.7% 9.3% 9.2%
22.2% 22.3% 22.7%
2007 2010 June 2011
19.3% 21.2% 21.3%
18.1% 18.3% 18.5%
21.8% 20.2% 20.2%
23.8% 21.0% 20.7%
17.0% 19.3% 19.3%
2007 2010 June 2011
45.6% 40.9% 40.8% 42.3%
In Portugal, the proportion of the construction and
real estate sectors, in
aggregated terms, has been
decreasing since 2007. In contrary,
the weight of these sectors of activity on the
total credit to non-financial
corporations of the euro area,
increased because of the
real estate sector.

Source: Banco de Portugal
NPL’S grew since 2008 mainly in the corporate segment.
18 MARCH 2012 PORTUGUESE BANKING SECTOR OVERVIEW
Non-performing loans* as a percentage of the corresponding credit
* Overdue installments and other future installments of doubtful collection.
0%
1%
2%
3%
4%
5%
6%
7%
8% Non-financial corporations
Mortgages
Total
Meanwhile, mortgages NPL’s
remained relatively stable.
Non-financial corporations NPL’s
started to grow rapidly especially at
the end of 2008.

MARCH 2012
PORTUGUESE BANKING SECTOR OVERVIEW
III. Funding

Deposits from customers constitute the most important part of the financing structure of Portuguese banks.
20 MARCH 2012 PORTUGUESE BANKING SECTOR OVERVIEW
Source: ECB
Financing structure of Portuguese and other European Union countries’ banks (December 2011)
* Includes external liabilities, i.e., liabilities issued by non-residents in the Euro area.
48% 42% 39% 37% 34% 33% 30%
23% 16%
27% 34%
23% 33% 43%
35%
18% 43%
38%
10% 7%
11% 5%
9%
7%
9%
6%
10%
15% 16% 28% 25%
13% 25%
43%
28% 36%
Spain Portugal Greece Germany Italy Euro area United Kingdom
France Ireland
Deposits Wholesale Capital Others*
Compared with the European context,
the Portuguese banking system has
a bigger share of deposits from
customers in its financing structure.
Therefore, wholesale funding plays a less
important role.

The trend followed by deposits from customers in Portugal reveals some differences compared with the Euro area.
21 MARCH 2012 PORTUGUESE BANKING SECTOR OVERVIEW
Evolution of deposits* in Portugal and in the Euro area (Dec. 2005=100)
* Deposits from the non-monetary sector (outstanding amounts at the end of period).
Source: ECB
80
100
120
140
160
180
Dec-05 Jun-06 Dec-06 Jun-07 Dec-07 Jun-08 Dec-08 Jun-09 Dec-09 Jun-10 Dec-10 Jun-11 Dec-11
Index
Portugal (100 = 155,185 M€) Euro area (100 = 7,386,698 M€)
After mid-2010, deposits in Portugal began
growing at a significantly higher rate than the ones
of the Euro area.

The use of wholesale funding among Portuguese banks grew at a significantly higher rate when compared with its Euro area peers.
22 MARCH 2012 PORTUGUESE BANKING SECTOR OVERVIEW
Evolution of wholesale funding* in Portugal and in the Euro area (Dec. 2005=100)
Source: ECB
* Wholesale includes deposits from the monetary sector, debt securities issued and money market funds (outstanding amounts at the end of period).
Average annual growth rate (YoY) Portugal = 14.7% Euro area = 9.2%
Average annual growth rate (YoY) Portugal = 9.7%
Euro area= -3.6%
60
80
100
120
140
160
180
200
220
240
Dec-05 Jun-06 Dec-06 Jun-07 Dec-07 Jun-08 Dec-08 Jun-09 Dec-09 Jun-10 Dec-10 Jun-11 Dec-11
Index
Portugal (100 = 83,887 M€) Euro area (100 = 9,382,724 M€)
The growth of deposits in Portugal was not sufficient to compensate the growth of national
banks’ assets, leading to a higher use of wholesale funding.
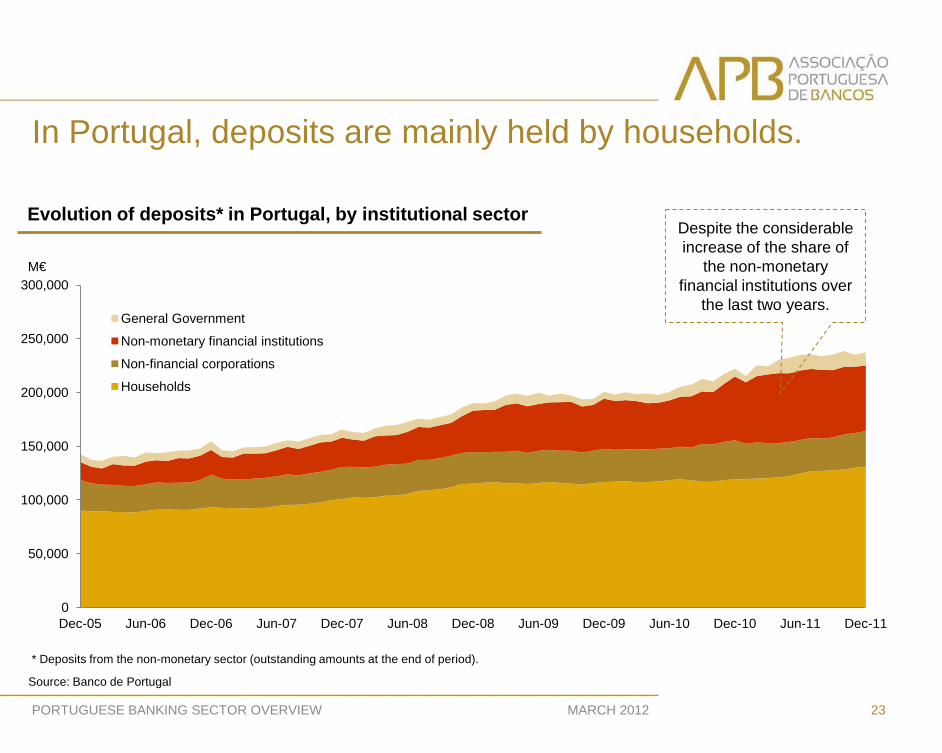
In Portugal, deposits are mainly held by households.
23 MARCH 2012 PORTUGUESE BANKING SECTOR OVERVIEW
0
50,000
100,000
150,000
200,000
250,000
300,000
Dec-05 Jun-06 Dec-06 Jun-07 Dec-07 Jun-08 Dec-08 Jun-09 Dec-09 Jun-10 Dec-10 Jun-11 Dec-11
M€
General Government
Non-monetary financial institutions
Non-financial corporations
Households
Source: Banco de Portugal
Evolution of deposits* in Portugal, by institutional sector Despite the considerable increase of the share of
the non-monetary financial institutions over
the last two years.
* Deposits from the non-monetary sector (outstanding amounts at the end of period).

Deposits with maturities less than one year are the most notable, in spite of the recent growth in the share of deposits with longer maturities.
24 MARCH 2012 PORTUGUESE BANKING SECTOR OVERVIEW
0
50,000
100,000
150,000
200,000
250,000
300,000
Dec-05 Jun-06 Dec-06 Jun-07 Dec-07 Jun-08 Dec-08 Jun-09 Dec-09 Jun-10 Dec-10 Jun-11 Dec-11
M€
Over 2 years From 1 to 2 years Up to 1 year Overnight deposits Reedemable at notice
Evolution of deposits* in Portugal, by maturity
Source: Banco de Portugal
* Deposits from the non-monetary sector (outstanding amounts at the end of period).

The growth in deposits from households coincides with the decrease in their units issued by investment funds.
25 MARCH 2012 PORTUGUESE BANKING SECTOR OVERVIEW
-40%
-30%
-20%
-10%
0%
10%
20%
30%
Dec-05 Jun-06 Dec-06 Jun-07 Dec-07 Jun-08 Dec-08 Jun-09 Dec-09 Jun-10 Dec-10 Jun-11 Dec-11
Deposits Units issued by investment funds
Households deposits and units issued by investment funds growth rates, in Portugal (YoY)
Source: Banco de Portugal
This trend exposes a substitution effect between investment and
savings products with different risk profiles, revealing a bigger preference
for less risky assets.

115.3%
122.6%
130.7% 134.7%
136.5%
143.5%
152.1% 155.7%
159.4% 160.8% 157.7%
146.4%
105%
115%
125%
135%
145%
155%
165%
2000 2001 2002 2003 2004 2005 2006 2007 2008 2009 2010 Set 2011
The decrease of the Loan-to-Deposit ratio reflects the deleverage of the Portuguese banking sector.
26 MARCH 2012 PORTUGUESE BANKING SECTOR OVERVIEW
* Credit volumes net of impairments (includes securitized non derecognized credit). Outstanding amounts at the end of period.
Loan*-to-Deposit ratio, on a consolidated basis
Due to the Economic Adjustment Programme for Portugal, Banco de Portugal requires the eight largest
Portuguese banking groups to reduce this ratio to 120% until 2014.
Source: Banco de Portugal
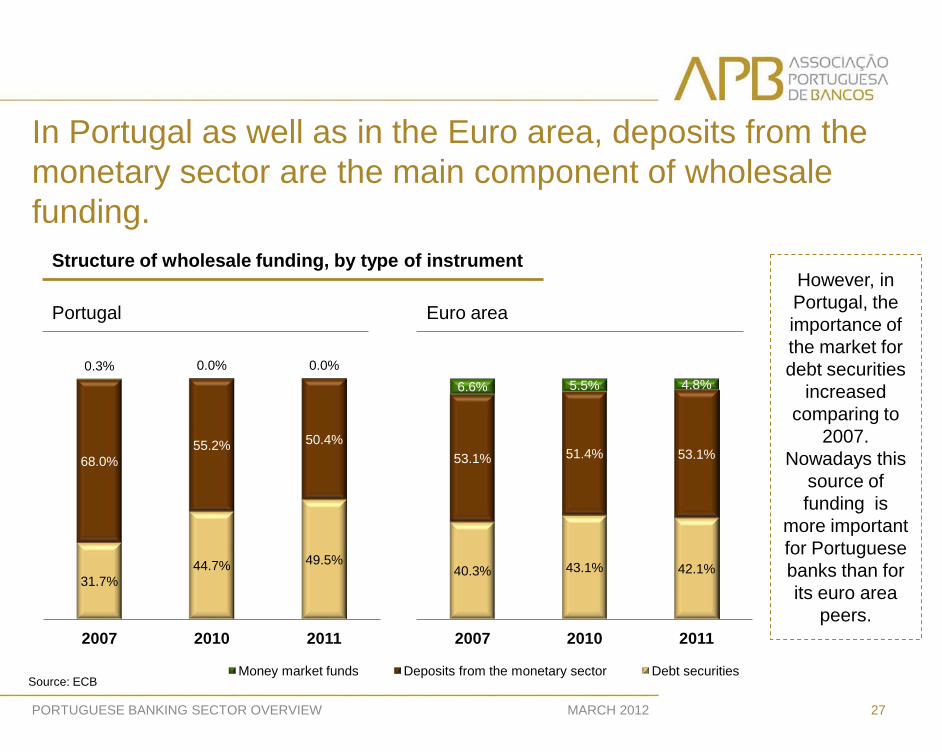
In Portugal as well as in the Euro area, deposits from the monetary sector are the main component of wholesale funding.
27 MARCH 2012 PORTUGUESE BANKING SECTOR OVERVIEW
Portugal Euro area
However, in Portugal, the importance of the market for debt securities
increased comparing to
2007. Nowadays this
source of funding is
more important for Portuguese banks than for its euro area
peers.
Structure of wholesale funding, by type of instrument
Source: ECB
40.3% 43.1% 42.1%
53.1% 51.4% 53.1%
6.6% 5.5% 4.8%
2007 2010 2011
Money market funds Deposits from the monetary sector Debt securities
31.7% 44.7% 49.5%
68.0% 55.2% 50.4%
0.3% 0.0% 0.0%
2007 2010 2011
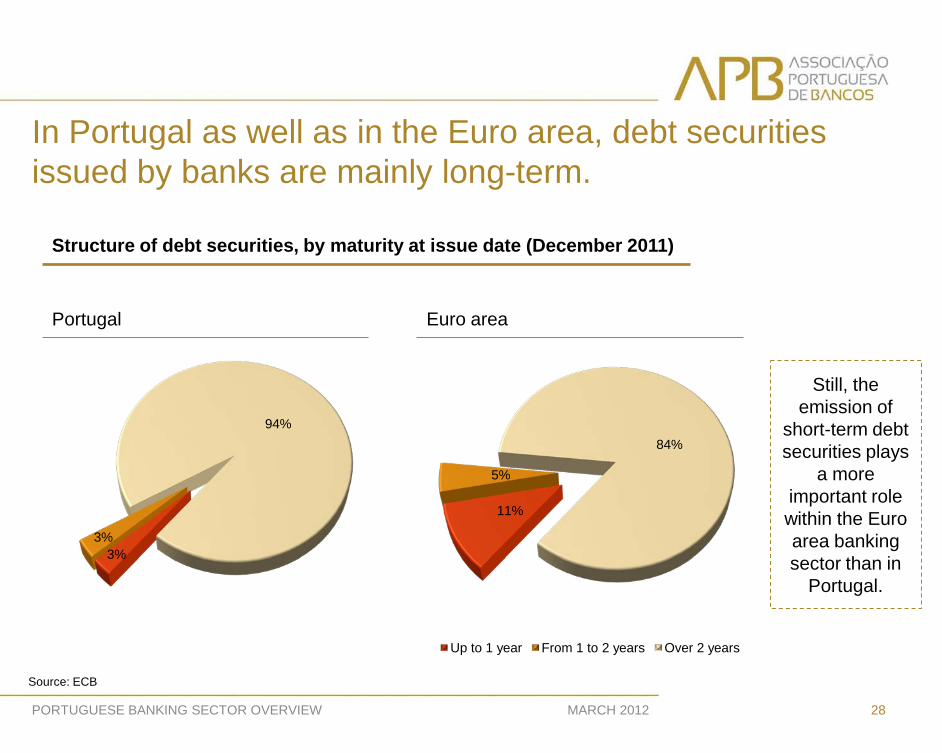
In Portugal as well as in the Euro area, debt securities issued by banks are mainly long-term.
28 MARCH 2012 PORTUGUESE BANKING SECTOR OVERVIEW
3% 3%
94%
11%
5%
84%
Up to 1 year From 1 to 2 years Over 2 years
Still, the emission of
short-term debt securities plays
a more important role within the Euro area banking sector than in
Portugal.
Portugal Euro area
Structure of debt securities, by maturity at issue date (December 2011)
Source: ECB

Over the past few years, covered bonds became increasingly important funding sources for Portuguese banks.
5%
95%
Public sector Mortgages
29 MARCH 2012 PORTUGUESE BANKING SECTOR OVERVIEW
0
5,000
10,000
15,000
20,000
25,000
30,000
2006 2007 2008 2009 2010
M€
Outstanding amounts at the end of period Issuance
Source: European Covered Bond Council, Factbook, 2010
Issuance and outstanding amounts of covered bonds in Portugal
Covered bonds by type of underlying asset (2010)
At the end of 2010, the outstanding amount of covered
bonds represented approximately 5.9% of
Portuguese banks’ assets.

0
5,000
10,000
15,000
20,000
25,000
30,000
35,000
40,000
45,000
50,000 M€
The restrictions on the access to interbank markets contributed to a significant increase of Portuguese banks’ dependency on ECB.
30 MARCH 2012 PORTUGUESE BANKING SECTOR OVERVIEW
Liquidity-providing operations from the European Central Bank to Portuguese banks*
* Outstanding amounts at the end of period.
Source: Banco de Portugal
0%
1%
2%
3%
4%
5%
6%
7%
8%
9%
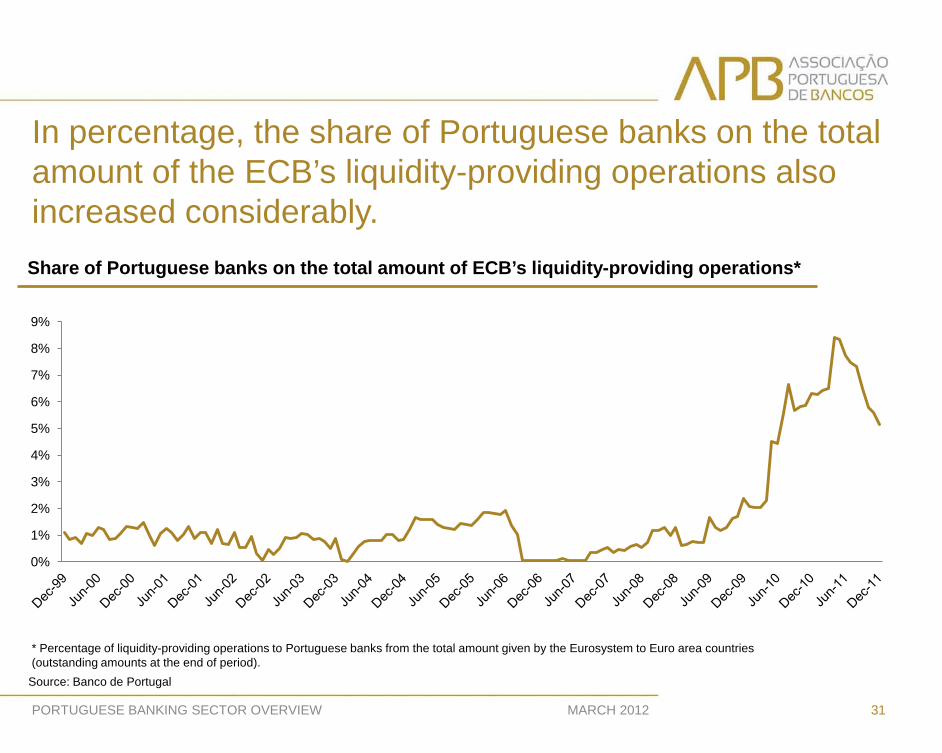
In percentage, the share of Portuguese banks on the total amount of the ECB’s liquidity-providing operations also increased considerably.
31 MARCH 2012 PORTUGUESE BANKING SECTOR OVERVIEW
Share of Portuguese banks on the total amount of ECB’s liquidity-providing operations*
* Percentage of liquidity-providing operations to Portuguese banks from the total amount given by the Eurosystem to Euro area countries (outstanding amounts at the end of period).
Source: Banco de Portugal

MARCH 2012
PORTUGUESE BANKING SECTOR OVERVIEW
IV. Solvency

Portuguese banks’ assets risk level has been decreasing over the past few years.
33 MARCH 2012 PORTUGUESE BANKING SECTOR OVERVIEW
Source: ECB
Risk weighted assets as a percentage of total assets*
71.2% 71.5%
69.5%
67.5%
2007 2008 2009 2010
The Risk Weighted Assets / Total Assets ratio for
Portuguese banks suffered a considerable decrease over the past years. This trend reflects a decline of the average risk
level of the assets that constitute Portuguese banks’
balance sheet.
* Risk weighted assets include off-balance sheet items. Data for domestic banking groups and stand-alone banks, on a consolidated basis which excludes insurance companies.
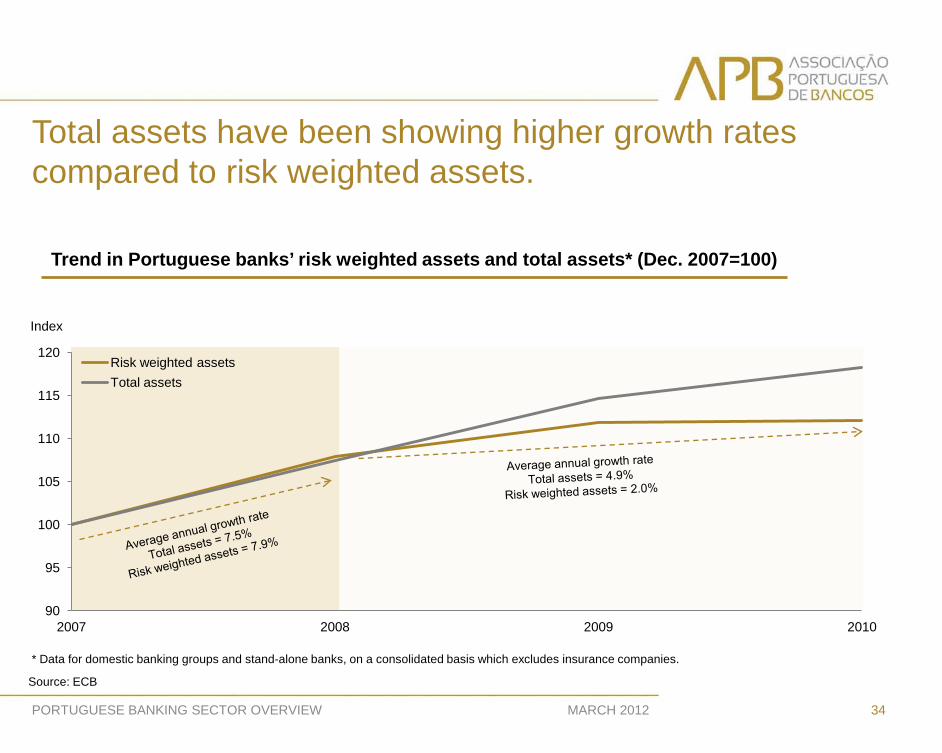
Total assets have been showing higher growth rates compared to risk weighted assets.
MARCH 2012 34
Trend in Portuguese banks’ risk weighted assets and total assets* (Dec. 2007=100)
PORTUGUESE BANKING SECTOR OVERVIEW
* Data for domestic banking groups and stand-alone banks, on a consolidated basis which excludes insurance companies.
Source: ECB
90
95
100
105
110
115
120
2007 2008 2009 2010
Index
Risk weighted assets Total assets

Portuguese bank’s total own funds have been increasing mainly due to Tier 1 capital, particularly after 2008.
35 MARCH 2012 PORTUGUESE BANKING SECTOR OVERVIEW
Trend in Portuguese banks’ own funds* (Dec. 2007=100)
* Data on a consolidated basis.
Source: Banco de Portugal
90
100
110
120
130
140
2007 2008 2009 2010
Index
Core Tier 1
Tier 1
Total own funds
Average annual growth rate Core Tier 1 = 2.0%
Tier 1 = 1.9% Total own funds = -3.2%

2007 2008 2009 2010 Jun-11
10.3 9.1 10.3 10.2
9.9 10.2
11.7 13.2 13.6 13.8
Overall Solvency ratio (%)
2007 2008 2009 2010 Jun-11
6.7 6.2 7.4 7.9 8.1 8.0 8.3 9.9 10.0 10.9
Tier 1 ratio (%)
Portugal
EU 27
Historically, the capital levels of Portuguese banks’ have stayed above the minimum legal requirements.
36 MARCH 2012 PORTUGUESE BANKING SECTOR OVERVIEW
Source: ECB
Basel II agreement requires financial institutions to maintain the Tier 1 ratio
equal or above 4% and the Overall Solvency ratio not below 8%.
* Data for domestic banking groups and stand-alone banks, on a consolidated basis which excludes insurance companies.

The core Tier 1 ratio of the 4 largest Portuguese banks has been increasing.
37 MARCH 2012 PORTUGUESE BANKING SECTOR OVERVIEW
Source: APB, banks’ annual reports
While in previous years the increase in the core Tier 1 ratio of the 4 largest Portuguese banking groups
occurred through higher capital levels; in 2011, there was a double effect from the growth of capital and
the reduction of the risk weighted assets.
7.0%
7.5%
8.0%
8.5%
9.0%
9.5%
-0.5
0
0.5
1
1.5
2
2009 2010 2011
p.p.
Contribution to core Tier 1 ratio from change in risk weighted assets Contribution to core Tier 1 ratio from change in capital Total change in core Tier 1 ratio Core Tier 1 ratio (right-hand scale)
Evolution of core Tier 1 ratio for the 4 largest Portuguese banks*
* Data on a consolidated basis.

Portuguese banks face new capital requirements within the scope of the Economic and Financial Assistance Program.
38 MARCH 2012 PORTUGUESE BANKING SECTOR OVERVIEW
Core Tier 1 ratio requirements
31.12.2011 9%
31.12.2012 10%
Source: APB, Banco de Portugal
Impacts
Additional impairments
recognized on the loans portfolio
Increase of the own funds
requirements for credit risk
Transfer of banks’ Pension
Schemes to the Social Security
Haircut Greece debt
These impacts will be recognized for prudential purposes during the 1st semester of 2012, reflecting
in the core Tier 1 ratio then.
Besides the increase of the core Tier 1 ratio that must be fulfilled, other factors contribute to augment the capital needs of the Portuguese banks, namely:
Results of the Special
Inspections Programme carried out in the 8 largest
banking groups, in 2011. This
assessment aimed to
validate the data that
supports the calculation of the solvency
position of the institutions.

Simultaneously, the EBA also imposed higher capital requirements for European banks to be fulfilled by June 2012.
Core Tier 1 ratio
9%
Buffer sovereign
debt exposures
Additional capital needs
39 MARCH 2012 PORTUGUESE BANKING SECTOR OVERVIEW
In order to deal with the sovereign crisis that affects Europe, the European Banking Authority, together with other European entities, established several measures that aim to strengthen the banking sector resilience. New capital requirements were therefore introduced under two different measures, namely: Increase of the core Tier 1 ratio
from 4.5% to 9%; Establishment of a capital buffer
for sovereign debt exposures as of 30th September 2011.
Source EBA
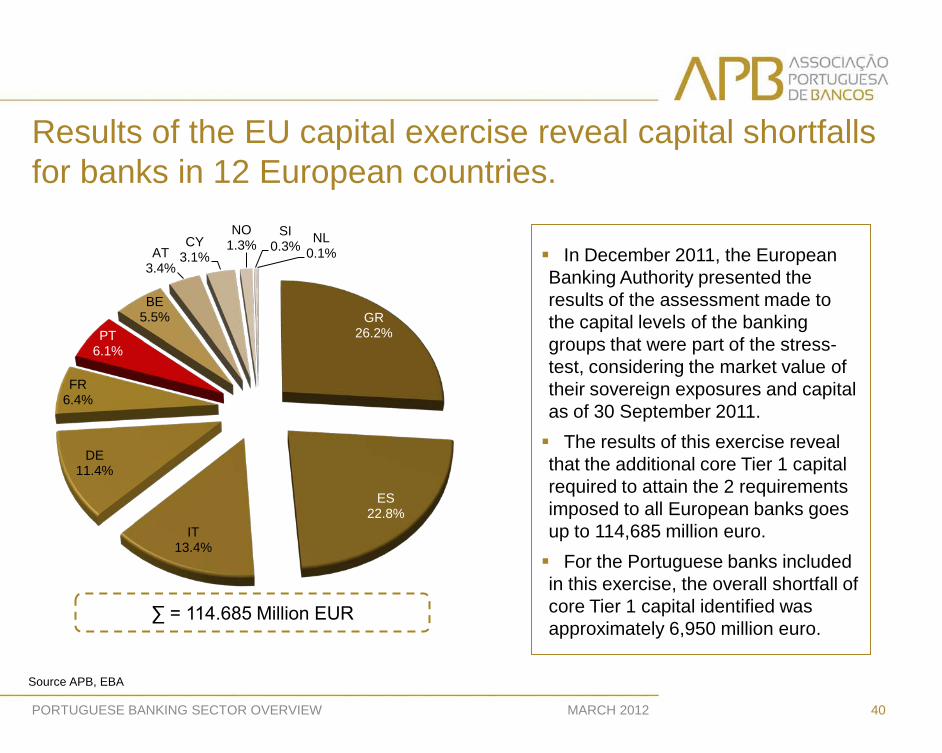
Results of the EU capital exercise reveal capital shortfalls for banks in 12 European countries.
40 MARCH 2012 PORTUGUESE BANKING SECTOR OVERVIEW
GR 26.2%
ES 22.8%
IT 13.4%
DE 11.4%
FR 6.4%
PT 6.1%
BE 5.5%
AT 3.4%
CY 3.1%
NO 1.3%
SI 0.3% NL
0.1%
∑ = 114.685 Million EUR
Source APB, EBA
In December 2011, the European Banking Authority presented the results of the assessment made to the capital levels of the banking groups that were part of the stress-test, considering the market value of their sovereign exposures and capital as of 30 September 2011. The results of this exercise reveal that the additional core Tier 1 capital required to attain the 2 requirements imposed to all European banks goes up to 114,685 million euro. For the Portuguese banks included in this exercise, the overall shortfall of core Tier 1 capital identified was approximately 6,950 million euro.
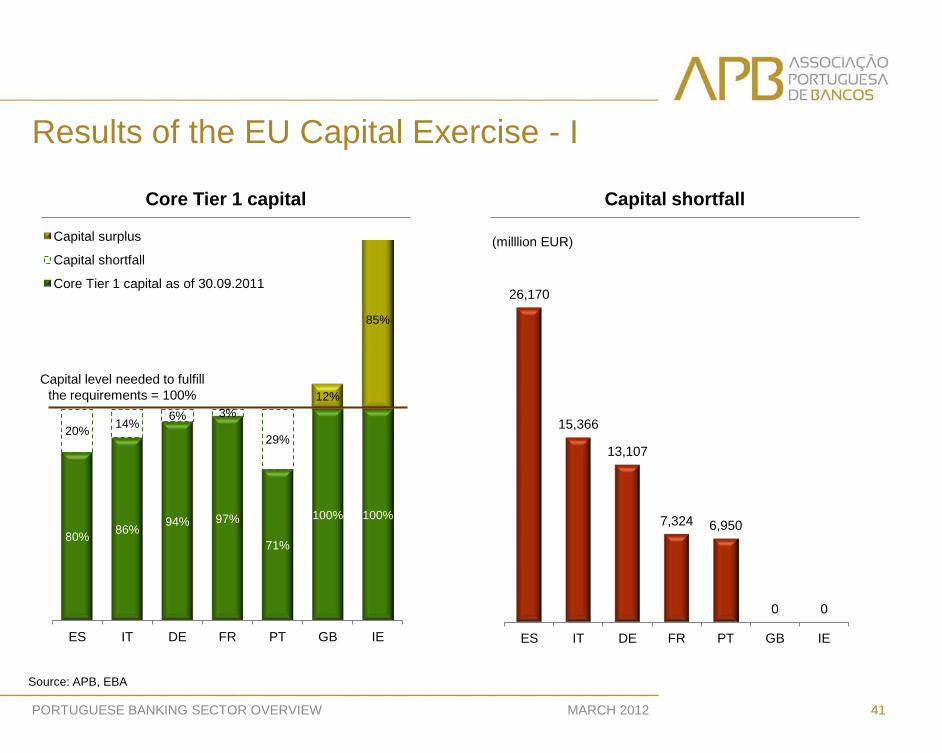
Results of the EU Capital Exercise - I
41 MARCH 2012 PORTUGUESE BANKING SECTOR OVERVIEW
Capital shortfall Core Tier 1 capital
80% 86% 94% 97%
71%
100% 100%
20% 14% 6% 3%
29%
12%
85%
ES IT DE FR PT GB IE
Capital surplus
Capital shortfall
Core Tier 1 capital as of 30.09.2011
Source: APB, EBA
26,170
15,366
13,107
7,324 6,950
0 0
ES IT DE FR PT GB IE
Capital level needed to fulfill the requirements = 100%
(milllion EUR)
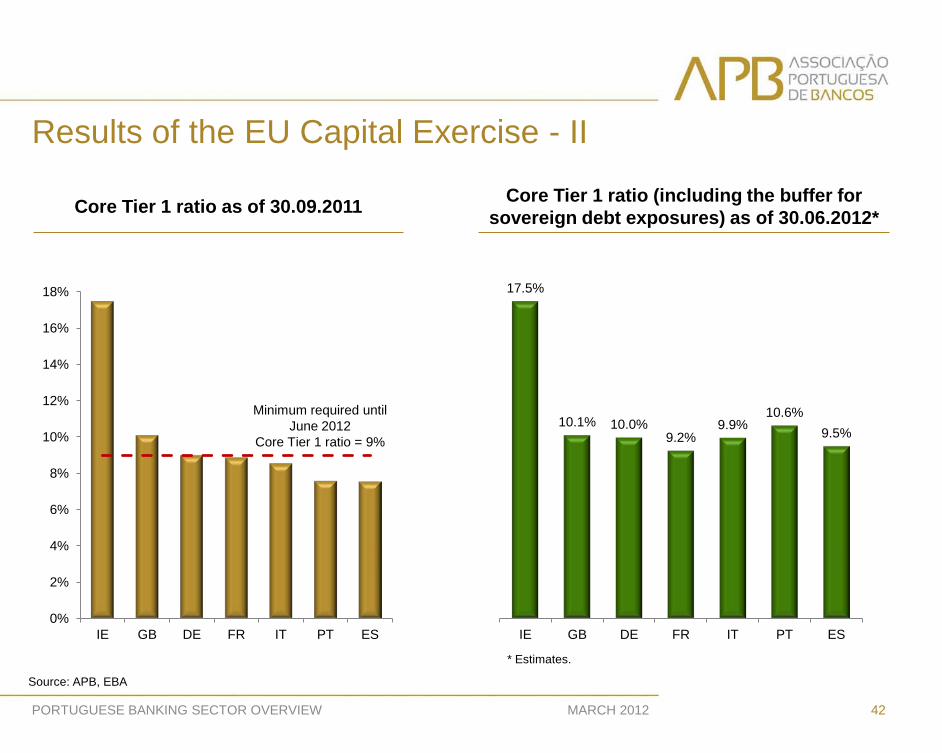
Results of the EU Capital Exercise - II
42 MARCH 2012 PORTUGUESE BANKING SECTOR OVERVIEW
Core Tier 1 ratio (including the buffer for sovereign debt exposures) as of 30.06.2012* Core Tier 1 ratio as of 30.09.2011
Source: APB, EBA
17.5%
10.1% 10.0% 9.2%
9.9% 10.6%
9.5%
IE GB DE FR IT PT ES 0%
2%
4%
6%
8%
10%
12%
14%
16%
18%
IE GB DE FR IT PT ES
Minimum required until June 2012
Core Tier 1 ratio = 9%
* Estimates.

For Portuguese banks, the capital needs stem from exposure to sovereign debt as well as the increase of the minimum ratio requirements.
43 MARCH 2012 PORTUGUESE BANKING SECTOR OVERVIEW
6,561 9,674 7,563
3,512 3,718 4,774
112 2,457
0 4 183
19,610
5,692 5,544
3,812 3,232 1,539
3,812
1,075 1,520 317 -24
Spain (ES)
Italy (IT)
Germany (DE)
France (FR)
Portugal (PT)
Belgium (BE)
Austria (AU)
Cyprus (CY)
Norway (NO)
Slovenia (SI)
Netherlands (NL)
Establishment of the buffer for sovereign debt exposures Increase of the core Tier 1 ratio and change in the calculation of the risk weighted assets
∑ = 15,366 13,107 7,324 6,950 6,313 3,923 3,531 1,520 26,170 320 159
Source: APB, EBA
Drivers of the capital needs, by country
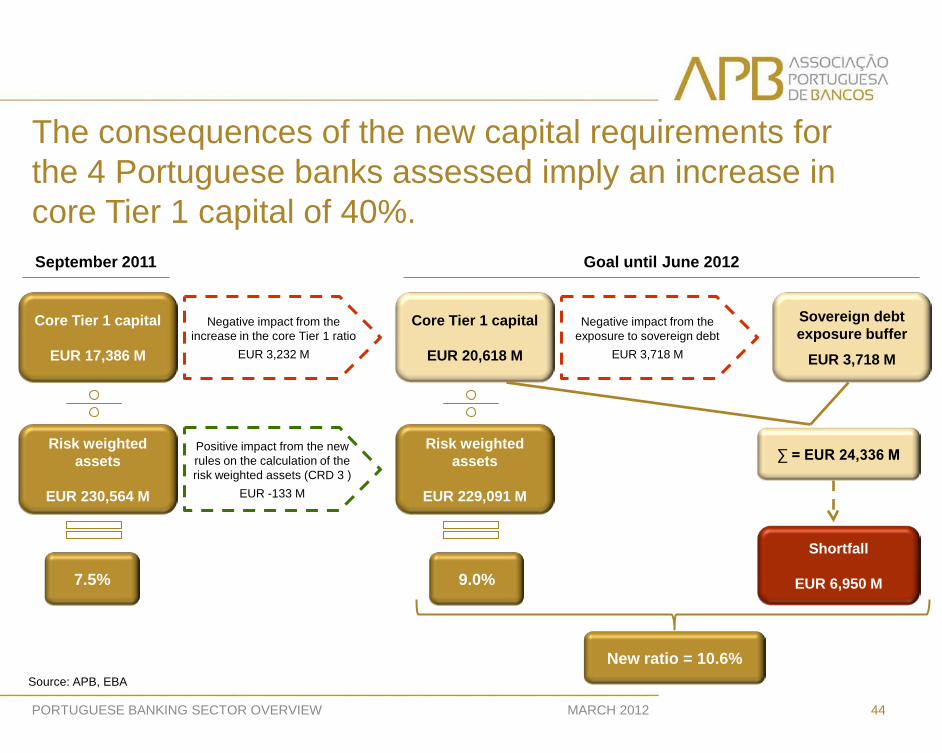
The consequences of the new capital requirements for the 4 Portuguese banks assessed imply an increase in core Tier 1 capital of 40%.
44 MARCH 2012 PORTUGUESE BANKING SECTOR OVERVIEW
Core Tier 1 capital
EUR 17,386 M
Negative impact from the increase in the core Tier 1 ratio
EUR 3,232 M
Risk weighted assets
EUR 230,564 M
Positive impact from the new rules on the calculation of the risk weighted assets (CRD 3 )
EUR -133 M
7.5%
Core Tier 1 capital
EUR 20,618 M
Risk weighted assets
EUR 229,091 M
9.0%
September 2011 Goal until June 2012
Sovereign debt exposure buffer
EUR 3,718 M
∑ = EUR 24,336 M
Shortfall
EUR 6,950 M
Source: APB, EBA
Negative impact from the exposure to sovereign debt
EUR 3,718 M
New ratio = 10.6%
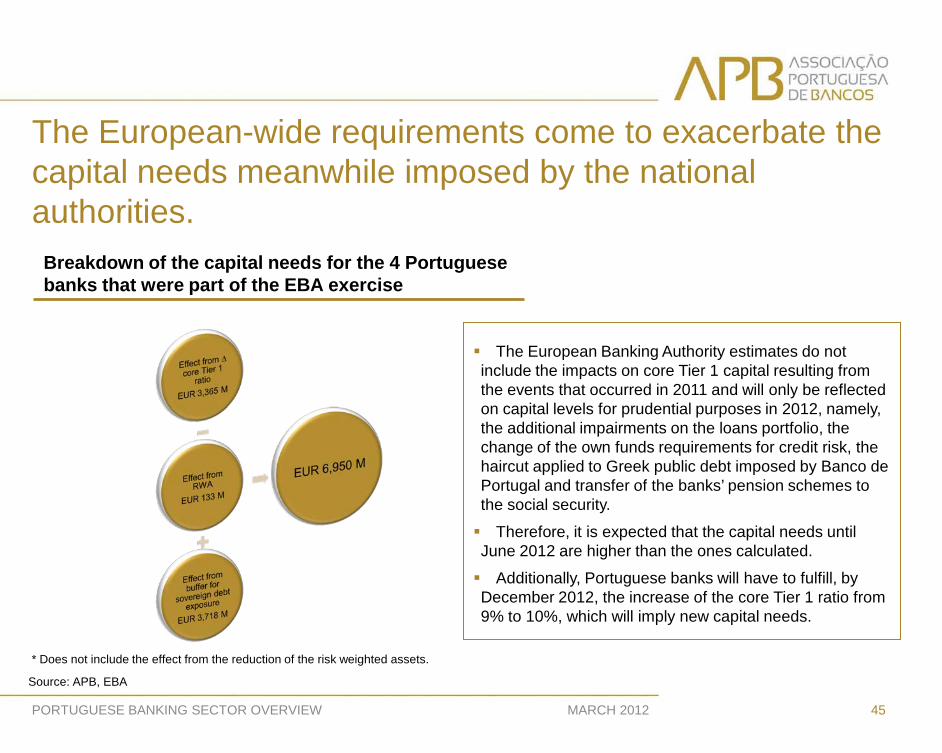
The European-wide requirements come to exacerbate the capital needs meanwhile imposed by the national authorities.
45 MARCH 2012 PORTUGUESE BANKING SECTOR OVERVIEW
The European Banking Authority estimates do not include the impacts on core Tier 1 capital resulting from the events that occurred in 2011 and will only be reflected on capital levels for prudential purposes in 2012, namely, the additional impairments on the loans portfolio, the change of the own funds requirements for credit risk, the haircut applied to Greek public debt imposed by Banco de Portugal and transfer of the banks’ pension schemes to the social security.
Therefore, it is expected that the capital needs until June 2012 are higher than the ones calculated.
Additionally, Portuguese banks will have to fulfill, by December 2012, the increase of the core Tier 1 ratio from 9% to 10%, which will imply new capital needs.
Source: APB, EBA
* Does not include the effect from the reduction of the risk weighted assets.
Breakdown of the capital needs for the 4 Portuguese banks that were part of the EBA exercise

MARCH 2012
PORTUGUESE BANKING SECTOR OVERVIEW
V. State Guarantee and Recapitalisation Schemes for Credit Institutions

47 MARCH 2012 PORTUGUESE BANKING SECTOR OVERVIEW
Timeline of the Portuguese State guarantee and recapitalization schemes for credit institutions
October 2008
May 2009
February 2010
March 2010
July 2010
January 2011
June 2011
• Scheme approved till Dec 2009 • EUR 20 B
• Budget changed • EUR 16 B
• Scheme approved till Nov 2009 • EUR 4 B
• Extension till Jun 2010 • Budget changed • EUR 9.15 B
• Extension till Jun 2010 • Budget changed • EUR 3 B*
• Extension till Dec 2010
• Extension till Dec 2010
• Extension till Jun 2011
•Extension till Jun 2011
• Extension 31 Dec 2011 • Budget changed • EUR 35 B
• Extension 31 Dec 2011 • Budget changed • EUR 12 B
Guarantee Scheme
Recapitalisation Scheme
Economic Adjustment Programme
* The usage of both schemes cannot exceed EUR 9.15 B.
Law nº 60-A/2008
Law nº 63-A/2008
Law nº 3-B/2010
Law nº 48/2011

Portuguese banks went through the financial crisis without any State support in terms of recapitalization…
By the end of June 2011:
6 banks (of which, CGD is State-owned) had used the State guarantee scheme;
2 operations that amounted to EUR 75 M were over (one in 2009 and the other in 2010);
Outstanding guarantees totaled up to EUR 4,875 M, which corresponded to 53% of the budget.
48 MARCH 2012 PORTUGUESE BANKING SECTOR OVERVIEW
State Support Scheme used until end of June 2011
EUR 9.15
billion
EUR 3 billion
Σ= EUR 4.95 B
* Not used by privately owned banks. In December 2010, CGD increased its capital by EUR 550 M, from which EUR 56 M were from the scheme budget.
> EUR 1,000 M 3 operations in 2008
< EUR 1,000 M > EUR 100 M
2 operations in 2009
< EUR 100 M 1 operation in 2008,
2 operations in 2009
Not used*

… meanwhile, the public debt crisis lead to the increase in the usage of guarantees from the State.
Since July 2011: 6 banks used the
State guarantee scheme for new operations;
New operations amounted to EUR 8,880 M, which corresponds to 25.4% of the budget.
In December 2011, the guarantees in effect (accumulated from previous years) total up to EUR 12,505 M.
49 MARCH 2012 PORTUGUESE BANKING SECTOR OVERVIEW
State Support Scheme used since July 2011
EUR 35
billion
EUR 12
billion
Σ= EUR 8.88 B
> EUR 1,000 M 4 new operations
< EUR 1,000 M > EUR 100 M
2 new operations
< EUR 100 M 2 new operations
Not used
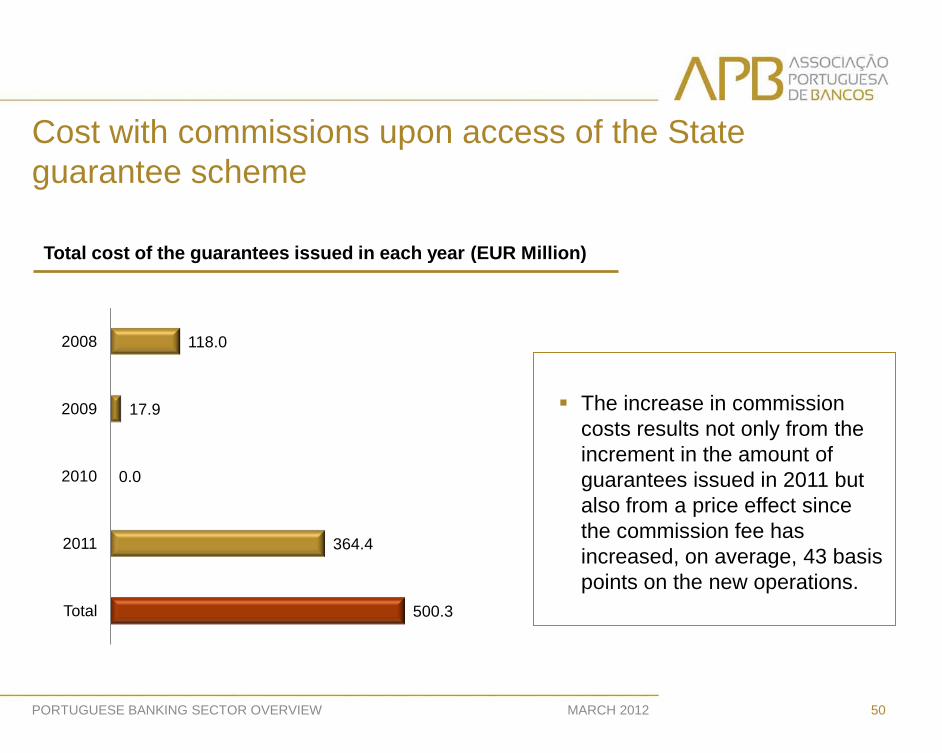
Cost with commissions upon access of the State guarantee scheme
50 MARCH 2012 PORTUGUESE BANKING SECTOR OVERVIEW
Total cost of the guarantees issued in each year (EUR Million)
The increase in commission costs results not only from the increment in the amount of guarantees issued in 2011 but also from a price effect since the commission fee has increased, on average, 43 basis points on the new operations.
118.0
17.9
0.0
364.4
500.3
2008
2009
2010
2011
Total

Commissions paid and due upon access of the State guarantee scheme
51 MARCH 2012 PORTUGUESE BANKING SECTOR OVERVIEW
Annual commissions paid and due* (EUR Million)
* Estimates.
0.0
11.3
45.2
62.6
119.1
103.8
69.4
52.1
2008
2009
2010
2011
Cumulative paid until end 2011
2012
2013
2014
∑ = EUR 500.3 Million

PORTUGUESE BANKING SECTOR OVERVIEW
MARCH 2012


![Polyglossia: Modern multilingual typesetting with XeLaTeX ... · pl polish pms piedmontese pt portuguese pt-BR portuguese variant=brazilian pt-PT portuguese variant=portuguese[default]](https://img.pdfslide.net/doc/110x75/5f1e5400ad8c1463ff31ecd7/polyglossia-modern-multilingual-typesetting-with-xelatex-pl-polish-pms-piedmontese.jpg)