Embed Size (px)
Citation preview

1900 Minnesota Court, Suite 210
Mississauga, Ontario L5N 3C9 Canada
Tel: (905) 819 7777 Fax: (905) 819 7409
[email protected] www.russelmetals.com
Annual Report 2007
POSITIONED FOR GROWTH
RU
SS
EL
M
ET
AL
S
IN
C.
2
00
7
AN
NU
AL
R
EP
OR
T

RUSSEL METALS is one of
the largest metals distribution
companies in North America.
We conduct business primarily
in three metals distribution
segments: metals service
centers; energy tubular products;
and steel distributors.
METAL SERVICES CENTERSWe provide processing and distribution services to a broad base ofmore than 27,000 end users through a network of 53 Canadian and12 U.S. locations. Our metals service centers carry a broad line ofproducts in a wide range of sizes, shapes and specifications,including carbon hot rolled and cold finished steel, pipe and tubularproducts, stainless steel and aluminum. We purchase theseproducts primarily from steel producers in North America andprocess and package them in accordance with end userspecifications. We service all major geographic regions of Canadaand the Southeastern and Midwestern regions in the United States.
ENERGY TUBULAR PRODUCTSThese operations distribute oil country tubular goods (OCTG), linepipe, tubes, valves and fittings, primarily to the energy industry inWestern Canada and the western United States, from 5 Canadianand 2 U.S. locations. We purchase these products either from thepipe processing arms of North American steel mills, independentmanufacturers of pipe and pipe accessories or international steel mills.
STEEL DISTRIBUTORSOur steel distributors act as master distributors selling steel in large volumes to other steel ser vice centers and equipmentmanufacturers mainly on an “as is” basis. Our U.S. operationprocesses some coil for its customer base at its cut-to-length facilityin Houston, Texas. Our steel distributors source their steel bothdomestically and off shore. The main steel products sourced by thissegment are structural beam, plate, coils, pipe and tubing.
Board of Directors
Alain BenedettiCorporate Director
Alice D. LabergeCorporate Director
James F. DinningChairman of the BoardWestern Financial Group Inc.
Lise LachapelleCorporate Director
Carl R. FioraCorporate Director,steel industry executive
John W. RobinsonCorporate Director,steel industry executive
Anthony F. GriffithsCorporate Director,Chairman of the BoardRussel Metals Inc.
Edward M. Siegel, Jr.President and Chief ExecutiveOfficer, Russel Metals Inc.
Officers
Anthony F. GriffithsChairman of the BoardToronto
Lesley M.S. ColemanVice President, Controller andAssistant SecretaryMississauga
Edward M. Siegel, Jr.President and Chief Executive OfficerMississauga
William M. O’ReillySecretaryDavies Ward Phillips & Vineberg LLPToronto
Brian R. HedgesExecutive Vice President andChief Operating OfficerMississauga
Elaine G. ToomeyAssistant SecretaryMississauga
Marion E. BrittonVice President and Chief Financial OfficerMississauga
Shareholder InformationStock Symbol: The Toronto Stock Exchange – RUS
Transfer Agent and RegistrarCIBC Mellon Trust Company P.O. Box 7010, Adelaide Street Postal Stn., Toronto, Ontario, Canada M5C 2W9Answer line: Toronto (416) 643-5500Toll Free: 1-800-387-0825E-mail: [email protected] Internet: www.cibcmellon.ca
Head Office1900 Minnesota Court, Suite 210, Mississauga, Ontario, Canada, L5N 3C9Tel: (905) 819-7777 Fax: (905) 819-7409 E-mail: [email protected] Internet: www.russelmetals.com
Corporate GovernanceDetailed disclosure concerning the Company’s governance practices may be found in the Management Proxy Circular.
> russel metals inc. directory
Energy image on ifc courtesy of Suncor Energy Inc. ©
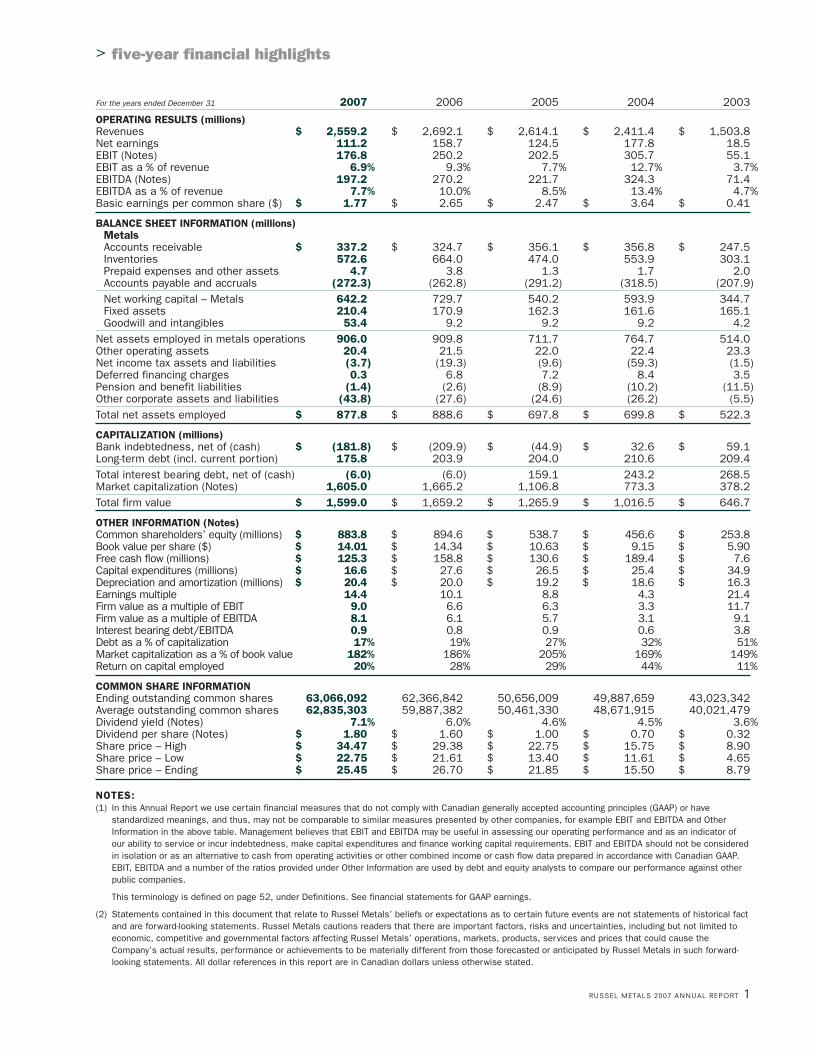
For the years ended December 31 2007 2006 2005 2004 2003
OPERATING RESULTS (millions)Revenues $ 2,559.2 $ 2,692.1 $ 2,614.1 $ 2,411.4 $ 1,503.8 Net earnings 111.2 158.7 124.5 177.8 18.5 EBIT (Notes) 176.8 250.2 202.5 305.7 55.1 EBIT as a % of revenue 6.9% 9.3% 7.7% 12.7% 3.7%EBITDA (Notes) 197.2 270.2 221.7 324.3 71.4 EBITDA as a % of revenue 7.7% 10.0% 8.5% 13.4% 4.7%Basic earnings per common share ($) $ 1.77 $ 2.65 $ 2.47 $ 3.64 $ 0.41
BALANCE SHEET INFORMATION (millions)MetalsAccounts receivable $ 337.2 $ 324.7 $ 356.1 $ 356.8 $ 247.5 Inventories 572.6 664.0 474.0 553.9 303.1 Prepaid expenses and other assets 4.7 3.8 1.3 1.7 2.0 Accounts payable and accruals (272.3) (262.8) (291.2) (318.5) (207.9)Net working capital – Metals 642.2 729.7 540.2 593.9 344.7 Fixed assets 210.4 170.9 162.3 161.6 165.1 Goodwill and intangibles 53.4 9.2 9.2 9.2 4.2
Net assets employed in metals operations 906.0 909.8 711.7 764.7 514.0 Other operating assets 20.4 21.5 22.0 22.4 23.3 Net income tax assets and liabilities (3.7) (19.3) (9.6) (59.3) (1.5)Deferred financing charges 0.3 6.8 7.2 8.4 3.5 Pension and benefit liabilities (1.4) (2.6) (8.9) (10.2) (11.5)Other corporate assets and liabilities (43.8) (27.6) (24.6) (26.2) (5.5)Total net assets employed $ 877.8 $ 888.6 $ 697.8 $ 699.8 $ 522.3
CAPITALIZATION (millions)Bank indebtedness, net of (cash) $ (181.8) $ (209.9) $ (44.9) $ 32.6 $ 59.1 Long-term debt (incl. current portion) 175.8 203.9 204.0 210.6 209.4 Total interest bearing debt, net of (cash) (6.0) (6.0) 159.1 243.2 268.5 Market capitalization (Notes) 1,605.0 1,665.2 1,106.8 773.3 378.2 Total firm value $ 1,599.0 $ 1,659.2 $ 1,265.9 $ 1,016.5 $ 646.7
OTHER INFORMATION (Notes)Common shareholders’ equity (millions) $ 883.8 $ 894.6 $ 538.7 $ 456.6 $ 253.8 Book value per share ($) $ 14.01 $ 14.34 $ 10.63 $ 9.15 $ 5.90 Free cash flow (millions) $ 125.3 $ 158.8 $ 130.6 $ 189.4 $ 7.6 Capital expenditures (millions) $ 16.6 $ 27.6 $ 26.5 $ 25.4 $ 34.9 Depreciation and amortization (millions) $ 20.4 $ 20.0 $ 19.2 $ 18.6 $ 16.3 Earnings multiple 14.4 10.1 8.8 4.3 21.4 Firm value as a multiple of EBIT 9.0 6.6 6.3 3.3 11.7 Firm value as a multiple of EBITDA 8.1 6.1 5.7 3.1 9.1 Interest bearing debt/EBITDA 0.9 0.8 0.9 0.6 3.8 Debt as a % of capitalization 17% 19% 27% 32% 51%Market capitalization as a % of book value 182% 186% 205% 169% 149%Return on capital employed 20% 28% 29% 44% 11%
COMMON SHARE INFORMATIONEnding outstanding common shares 63,066,092 62,366,842 50,656,009 49,887,659 43,023,342Average outstanding common shares 62,835,303 59,887,382 50,461,330 48,671,915 40,021,479Dividend yield (Notes) 7.1% 6.0% 4.6% 4.5% 3.6%Dividend per share (Notes) $ 1.80 $ 1.60 $ 1.00 $ 0.70 $ 0.32 Share price – High $ 34.47 $ 29.38 $ 22.75 $ 15.75 $ 8.90 Share price – Low $ 22.75 $ 21.61 $ 13.40 $ 11.61 $ 4.65 Share price – Ending $ 25.45 $ 26.70 $ 21.85 $ 15.50 $ 8.79
NOTES:(1) In this Annual Report we use certain financial measures that do not comply with Canadian generally accepted accounting principles (GAAP) or have
standardized meanings, and thus, may not be comparable to similar measures presented by other companies, for example EBIT and EBITDA and OtherInformation in the above table. Management believes that EBIT and EBITDA may be useful in assessing our operating performance and as an indicator ofour ability to service or incur indebtedness, make capital expenditures and finance working capital requirements. EBIT and EBITDA should not be consideredin isolation or as an alternative to cash from operating activities or other combined income or cash flow data prepared in accordance with Canadian GAAP.EBIT, EBITDA and a number of the ratios provided under Other Information are used by debt and equity analysts to compare our performance against otherpublic companies.
This terminology is defined on page 52, under Definitions. See financial statements for GAAP earnings.
(2) Statements contained in this document that relate to Russel Metals’ beliefs or expectations as to certain future events are not statements of historical factand are forward-looking statements. Russel Metals cautions readers that there are important factors, risks and uncertainties, including but not limited toeconomic, competitive and governmental factors affecting Russel Metals’ operations, markets, products, services and prices that could cause theCompany’s actual results, performance or achievements to be materially different from those forecasted or anticipated by Russel Metals in such forward-looking statements. All dollar references in this report are in Canadian dollars unless otherwise stated.
RUSSEL METALS 2007 ANNUAL REPORT 1
> five-year financial highlights

> report to shareholdersFor the year ended December 31, 2007
On September 28, 2007, the Company completed its first major acquisition since Acier Leroux in 2003 with
the purchase of JMS Metal Services for $109 million in cash. JMS Metal Services is a full-line distributor of
carbon steel and non-ferrous products with eight strategically located processing and distribution facilities
in Alabama, Arkansas, Georgia, Kentucky and Tennessee. The JMS Metal Services group of companies has
been renamed JMS Russel Metals, and we welcome our new employee group with John Reid as President.
These operations provide us with a platform for future growth in a new geographic region, the Southeastern
and Midwestern United States.
The JMS Russel Metals operations were immediately accretive to earnings. Since the acquisition occurred
on the last business day of the third quarter, the results of JMS Russel Metals are included in the
operating results only for the fourth quarter.
Historically, the Company rationalizes certain operations following an acquisition. Since JMS Russel Metals is
in a new geographical region, there will be no rationalization of operations as a result of the acquisition. We
will move the JMS Russel Metals operations onto our centralized computer systems in the first half of 2008.
Russel Metals – Year 2007 OperationsIn 2007, our net earnings were $111 million, or $1.77 per common share. These results were lower than
our net earnings of $159 million, or $2.65 per common share, recorded in 2006.
The slowdown in conventional gas drilling in Alberta and the weak forestry sector in British Columbia
negatively impacted earnings of our service centers in those provinces. The strong Canadian dollar should
have impacted our Ontario customers but, to date, our segment of the Ontario market, which includes very
little automotive, has held up quite nicely. The U.S. dollar weakness, strong international steel pricing and
excessive inventories caused many of our steel distributor customers to curtail their purchasing activities.
Our energy tubular products segment continued to have strong results, led by our U.S. operation, Pioneer
Pipe, which services conventional gas drilling, and the Canadian operation, Comco Pipe & Supply Company,
which services the oil sands in Northern Alberta. Comco Pipe & Supply Company ended 2007 with the
strongest results in its history. The operations that service primarily the gas drilling industry in Western Canada
experienced lower demand levels due to lower rig counts and drilling activity. Excess inventory, Canadian
positioned for future opportunities
In 2007, the North American steel industry experienced a year of further
consolidation, relatively stable steel prices and soft demand. The consolidation
frenzy that the steel industry experienced in 2006 continued into 2007 but
tapered off somewhat near the end of the year. The credit crisis in the U.S.
spilled over to the world economy and capital markets, cooling down both the
debt and private equity markets.
2 RUSSEL METALS 2007 ANNUAL REPORT
RUSSEL METALS 2007 ANNUAL REPORT 3
dollar strength and concern about Alberta Royalty increases led to decreased investment in Alberta
conventional gas drilling activities. A bright side to this picture is the Canadian government announcement in
January 2008 that it will review carbon steel welded pipe imported from China, which should help to tighten
supply and reduce excess inventories in the sector.
For most of 2007 inventory reduction was a high priority of our management team. Throughout the year we
have continued to align our inventories with our perception of forward demand. Inventory levels improved
significantly, decreasing by $89 million on a same store basis excluding foreign exchange.
The Company’s cash flows are counter-cyclical due to changes in working capital on the balance sheet.
Current assets, excluding cash, comprise 76% of our net assets. This enables us to generate significant
cash flow in periods of economic weakness; however, we use significant cash in periods of economic
expansion. In 2007, the Company generated significant positive cash flows from operations of $211 million
and free cash flow of $125 million supporting payment of $110 million to shareholders by way of our
industry-leading dividend.
Shareholder ReturnsThe maintenance of a strong dividend policy has been, and continues to be, a primary goal. For the sixth
consecutive year, we increased the annual dividend. Our annual dividend of $1.80 per share has continued
to make our common shares one of the top yielding securities in the S&P/TSX Composite Index.
We believe that our cash flow, balance sheet and debt to equity ratio support our dividend policy.
The payment of dividends reduces the restricted payments basket in our U.S. Senior Notes indenture.
At December 31, 2007, this basket had available in excess of $400 million for the payment of dividends.
On February 18, 2008, we filed a notice of intention to initiate a normal course issuer bid, which allows us
to purchase up to six million of our common shares. Our share price has recently traded at prices which we
believe do not truly reflect the value of the Company. The purchase of six million shares will not jeopardize
our ability to pay our dividend. Debt to total capitalization would be approximately 19%. We would still have
the ability to finance acquisitions of a size comparable to our recent acquisition of JMS Metal Services.
Succession PlanningRecently, the Company announced that Brian Hedges, previously our Chief Financial Officer, has been
appointed Chief Operating Officer. In addition, Marion Britton, previously our Chief Accounting Officer, has
been appointed Chief Financial Officer. We are delighted that, with these appointments, succession planning
is in place and that our goals, direction, and culture will be reinforced and enhanced. The Company will
continue to emphasize shareholder returns and to ensure that earnings are returned to shareholders
through a strong dividend policy. Both Brian and Marion have been critical contributors since the current
management team was formed in 1997.
> report to shareholders cont’d
For the year ended December 31, 2007
EnvironmentThe profile of environmental issues throughout the world is on the rise. Shareholders are holding companies
responsible for decisions that affect the environment. The reduction of greenhouse gases has become a
high priority. As a distributor, we are not a producer of significant greenhouse gases, but we have been
taking action to reduce our greenhouse emissions. We have started to utilize smart terminals in our truck
fleet. These computer GPS based systems optimize vehicle routing and monitor speeds to help reduce
emissions.
Our Service Center customer base exceeds 18,000 customers in Canada and will be impacted by
environmental issues in the same manner as the Canadian economy. Some of the 18,000 customers will
benefit and others will be penalized but at this point in the evolution the final impact is not predictable.
Environmental issues are given a high priority at Russel Metals. Our Board has an Environmental Management
and Health & Safety Committee whose purpose is to review compliance policies and procedures in
accordance with legislative and regulatory requirements. On a quarterly basis, our environmental coordinator
reports to the Board of Directors on new legislation and environmental issues relating to our operations. We
proactively manage environmental and health and safety issues throughout our operations.
Corporate GovernanceWe were pleased to announce the appointment of Ms. Alice Laberge to our Board during 2007. As previously
announced, Ms. Laberge’s financial expertise will complement our current slate of directors. I would like to
personally welcome Alice to the Board.
Mr. Robbert Hartog, a long-term director and former audit committee chair, passed away on January 27, 2008.
Mr. Hartog joined our Board on May 14, 1997 and his guidance and counsel was invaluable throughout his
tenure. He will be sadly missed.
The Company continues to stress strong corporate governance as a primary goal. Once again the Company was
recognized with a high ranking in The Globe and Mail’s Board Games analysis of Canada’s top corporations.
4 RUSSEL METALS 2007 ANNUAL REPORT
RUSSEL METALS 2007 ANNUAL REPORT 5
OutlookWe are starting to see revenue improvement and margin enhancement due to price increases. With the
unsettled outlook for the North American economy, we cannot forecast past the first quarter of 2008 at this
time; however, we anticipate continuing enhancement of our margins in the first quarter in line with price
increases announced by the North American steel mills which will provide higher margins on our existing
inventories. Furthermore, JMS Russel Metals operations, acquired at the end of the third quarter in 2007,
are expected to provide additional accretion on a comparative basis versus the first three quarters in 2007.
E.M. Siegel, Jr.
President and Chief Executive Officer
February 18, 2008
6 RUSSEL METALS 2007 ANNUAL REPORT
> management’s discussion and analysis of financial condition and results of operationsFor the year ended December 31, 2007
The Management’s Discussion and Analysis of Financial Condition and Results of Operations of Russel Metals Inc. and itssubsidiaries provides information to assist the reader and should be read in conjunction with the audited Consolidated FinancialStatements for the year ended December 31, 2007, including the notes thereto. Statements contained in this document that relateto our beliefs or expectations as to certain future events are not statements of historical fact and are forward-looking statements.We caution readers that there are important factors, risks and uncertainties, including but not limited to economic, competitive andgovernmental factors affecting our operations, markets, products, services and prices that could cause our actual results,performance or achievements to be materially different from those forecasted or anticipated by us in such forward-lookingstatements. All dollar references in this report are in Canadian dollars unless otherwise stated.
This Management’s Discussion and Analysis of Financial Condition and Results of Operations includes a number of measures thatare not prescribed by generally accepted accounting principles (GAAP) and as such may not be comparable to similar measurespresented by other companies. We believe these measures are commonly employed to measure performance in our industry and areused by analysts, investors, lenders and other interested parties to evaluate financial performance and our ability to incur andservice debt to support our business activities. The measures we use are specifically defined where they are first used in this report.
While we believe that non-GAAP measures are helpful supplemental information, they should not be considered in isolation as analternative to net income, cash flows generated by operating, investing or financing activities, or other financial statement datapresented in accordance with GAAP.
> Additional information related to Russel Metals Inc., including our Annual Information Form, may be obtained from SEDAR atwww.sedar.com or on our website at www.russelmetals.com.
Overview
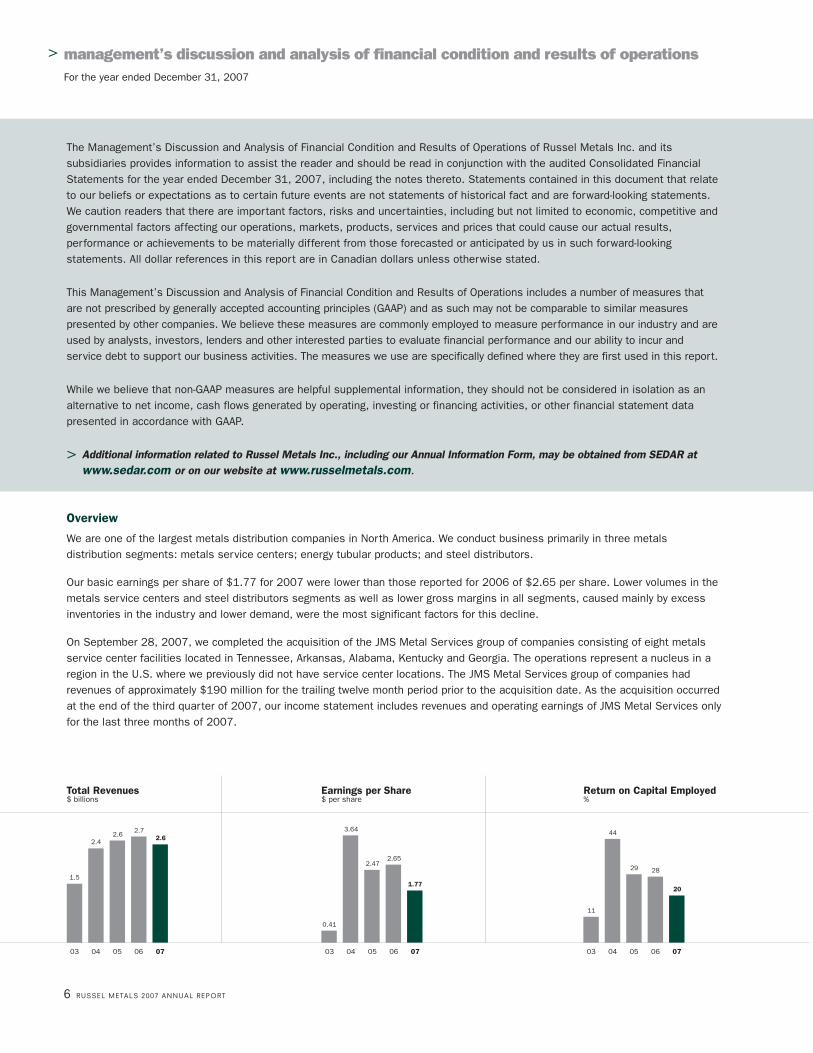
We are one of the largest metals distribution companies in North America. We conduct business primarily in three metalsdistribution segments: metals service centers; energy tubular products; and steel distributors.
Our basic earnings per share of $1.77 for 2007 were lower than those reported for 2006 of $2.65 per share. Lower volumes in themetals service centers and steel distributors segments as well as lower gross margins in all segments, caused mainly by excessinventories in the industry and lower demand, were the most significant factors for this decline.
On September 28, 2007, we completed the acquisition of the JMS Metal Services group of companies consisting of eight metalsservice center facilities located in Tennessee, Arkansas, Alabama, Kentucky and Georgia. The operations represent a nucleus in aregion in the U.S. where we previously did not have service center locations. The JMS Metal Services group of companies hadrevenues of approximately $190 million for the trailing twelve month period prior to the acquisition date. As the acquisition occurredat the end of the third quarter of 2007, our income statement includes revenues and operating earnings of JMS Metal Services onlyfor the last three months of 2007.
0706050403 0706050403 0706050403
1.5
2.72.6
2.42.6
0.41
3.64
2.472.65
1.77
44
11
29 28
20
Return on Capital Employed%
Earnings per Share$ per share
Total Revenues$ billions
RUSSEL METALS 2007 ANNUAL REPORT 7
Summarized Financial InformationThe table discloses selected information related to revenues, earnings and common share information over the last eight quarters.
2007Year
Three Months Ended Ended
(millions, except per share data and volumes) Mar. 31 June 30 Sept. 30 Dec. 31 Dec. 31
Revenues $ 683.7 $ 652.8 $ 624.3 $ 598.4 $ 2,559.2
Earnings from operations 46.0 48.9 46.8 37.6 179.3
Net earnings
-- continuing operations 28.7 29.3 27.9 23.7 109.6
Net earnings 28.7 29.3 27.9 25.3 111.2
Basic earnings per common share
-- continuing operations $ 0.46 $ 0.47 $ 0.44 $ 0.38 $ 1.74
Basic earnings per common share $ 0.46 $ 0.47 $ 0.44 $ 0.40 $ 1.77
Diluted earnings per common share
-- continuing operations $ 0.46 $ 0.46 $ 0.44 $ 0.37 $ 1.73
Diluted earnings per common share $ 0.46 $ 0.46 $ 0.44 $ 0.40 $ 1.76
Market price of common shares
High $ 28.55 $ 34.47 $ 33.35 $ 32.47 $ 34.47
Low $ 25.27 $ 27.75 $ 26.50 $ 22.75 $ 22.75
Number of common shares traded 20,036,046 21,195,621 13,412,506 16,500,623 71,144,796
20 06Year
Three Months Ended Ended
(millions, except per share data and volumes) Mar. 31 June 30 Sept. 30 Dec. 31 Dec. 31
Revenues $ 740.7 $ 685.9 $ 672.3 $ 593.2 $ 2,692.1
Earnings from operations 61.2 70.0 69.2 48.6 249.0
Net earnings
-- continuing operations 37.3 46.2 44.6 30.6 158.7
Net earnings 37.3 46.2 44.6 30.6 158.7
Basic earnings per common share
-- continuing operations $ 0.71 $ 0.74 $ 0.72 $ 0.49 $ 2.65
Basic earnings per common share $ 0.71 $ 0.74 $ 0.72 $ 0.49 $ 2.65
Diluted earnings per common share
-- continuing operations $ 0.70 $ 0.74 $ 0.71 $ 0.49 $ 2.63
Diluted earnings per common share $ 0.70 $ 0.74 $ 0.71 $ 0.49 $ 2.63
Market price of common shares
High $ 27.50 $ 27.47 $ 29.05 $ 29.38 $ 29.38
Low $ 21.61 $ 22.15 $ 24.30 $ 25.95 $ 21.61
Number of common shares traded 17,295,366 18,556,903 16,513,705 15,387,461 67,753,435

Results of OperationsThe following table provides operating profits before interest, taxes and restructuring costs. The corporate expenses included arenot allocated to specific operating segments. Gross margins (revenue minus cost of sales) as a percentage of revenues for theoperating segments are also shown below. The table shows the segments as they are reported to management and they areconsistent with the segment reporting in our consolidated financial statements.
2007 2006
Change Changeas a % as a %
(millions, except percentages) 2007 2006 2005 of 2006 of 2005
Segment Revenues
Metals service centers $ 1,435.2 $ 1,507.9 $ 1,538.5 (5%) (2%)
Energy tubular products 677.2 614.3 595.2 10% 3%
Steel distributors 436.1 559.4 468.7 (22%) (19%)
Other 10.7 10.5 11.7
$ 2,559.2 $ 2,692.1 $ 2,614.1 (5%) 3%
Segment Operating Profits
Metals service centers $ 101.9 $ 126.4 $ 115.2 (19%) 10%
Energy tubular products 54.5 62.2 54.0 (12%) 15%
Steel distributors 39.1 76.7 46.6 (49%) 65%
Corporate expenses (18.6) (18.2) (16.8) (2%) (8%)
Other 2.4 1.9 2.4
Operating profits from continuing operations $ 179.3 $ 249.0 $ 201.4 (28%) 24%
Segment Gross Margin as a % of Revenues
Metals service centers 24.1% 25.1% 23.1%
Energy tubular products 14.4% 16.5% 14.6%
Steel distributors 13.5% 18.3% 14.3%
Total operations 19.9% 21.9% 19.8%
Segment Operating Profits as a % of Revenues
Metals service centers 7.1% 8.4% 7.5%
Energy tubular products 8.0% 10.1% 9.1%
Steel distributors 9.0% 13.7% 9.9%
Total operations 7.0% 9.3% 7.7%
> management’s discussion and analysis cont’d
For the year ended December 31, 2007
Return on Averaged Capital Employed
0706050403 0706050403 0706050403
Steel Distributors%
Energy Tubular Products%
Metals Service Centers%
13
2926
50
14
41
29 29
70
13
31
49
21 2126
8 RUSSEL METALS 2007 ANNUAL REPORT
RUSSEL METALS 2007 ANNUAL REPORT 9
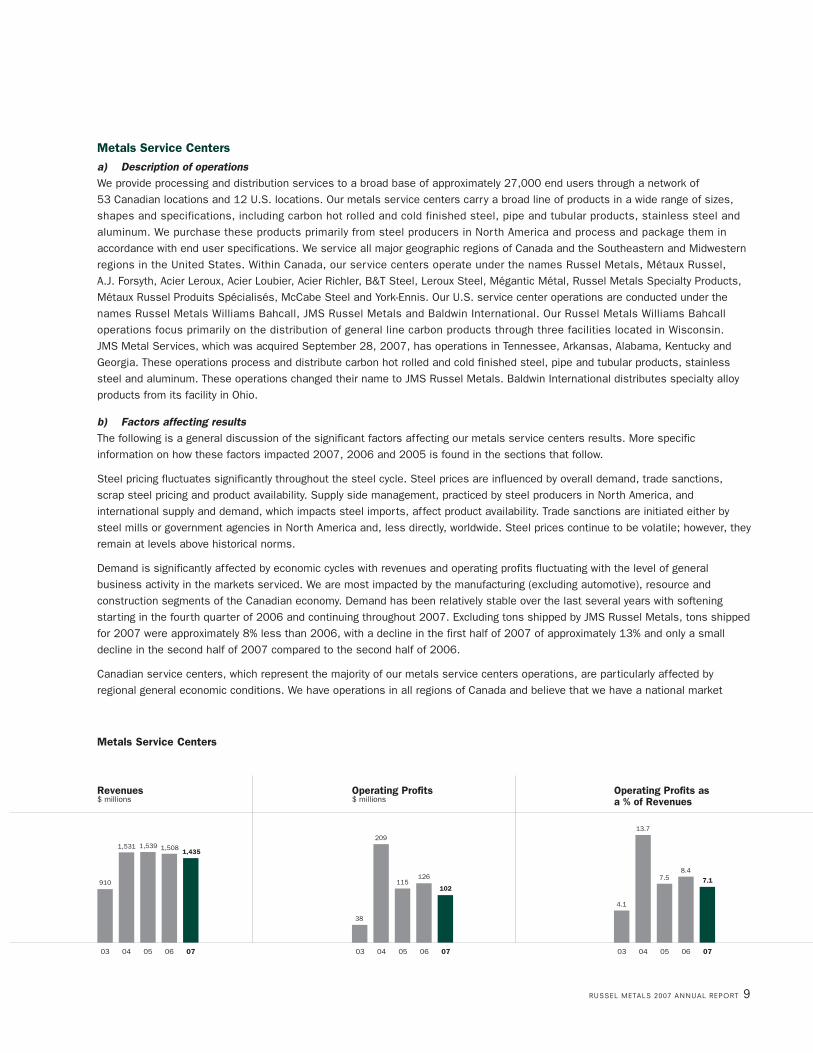
Metals Service Centersa) Description of operationsWe provide processing and distribution services to a broad base of approximately 27,000 end users through a network of 53 Canadian locations and 12 U.S. locations. Our metals service centers carry a broad line of products in a wide range of sizes,shapes and specifications, including carbon hot rolled and cold finished steel, pipe and tubular products, stainless steel andaluminum. We purchase these products primarily from steel producers in North America and process and package them inaccordance with end user specifications. We service all major geographic regions of Canada and the Southeastern and Midwesternregions in the United States. Within Canada, our service centers operate under the names Russel Metals, Métaux Russel, A.J. Forsyth, Acier Leroux, Acier Loubier, Acier Richler, B&T Steel, Leroux Steel, Mégantic Métal, Russel Metals Specialty Products,Métaux Russel Produits Spécialisés, McCabe Steel and York-Ennis. Our U.S. service center operations are conducted under thenames Russel Metals Williams Bahcall, JMS Russel Metals and Baldwin International. Our Russel Metals Williams Bahcalloperations focus primarily on the distribution of general line carbon products through three facilities located in Wisconsin. JMS Metal Services, which was acquired September 28, 2007, has operations in Tennessee, Arkansas, Alabama, Kentucky andGeorgia. These operations process and distribute carbon hot rolled and cold finished steel, pipe and tubular products, stainlesssteel and aluminum. These operations changed their name to JMS Russel Metals. Baldwin International distributes specialty alloyproducts from its facility in Ohio.
b) Factors affecting resultsThe following is a general discussion of the significant factors affecting our metals service centers results. More specificinformation on how these factors impacted 2007, 2006 and 2005 is found in the sections that follow.
Steel pricing fluctuates significantly throughout the steel cycle. Steel prices are influenced by overall demand, trade sanctions,scrap steel pricing and product availability. Supply side management, practiced by steel producers in North America, andinternational supply and demand, which impacts steel imports, affect product availability. Trade sanctions are initiated either bysteel mills or government agencies in North America and, less directly, worldwide. Steel prices continue to be volatile; however, theyremain at levels above historical norms.
Demand is significantly affected by economic cycles with revenues and operating profits fluctuating with the level of generalbusiness activity in the markets serviced. We are most impacted by the manufacturing (excluding automotive), resource andconstruction segments of the Canadian economy. Demand has been relatively stable over the last several years with softeningstarting in the fourth quarter of 2006 and continuing throughout 2007. Excluding tons shipped by JMS Russel Metals, tons shippedfor 2007 were approximately 8% less than 2006, with a decline in the first half of 2007 of approximately 13% and only a smalldecline in the second half of 2007 compared to the second half of 2006.
Canadian service centers, which represent the majority of our metals service centers operations, are particularly affected byregional general economic conditions. We have operations in all regions of Canada and believe that we have a national market
0706050403 0706050403 0706050403
Operating Profits as a % of Revenues
Operating Profits$ millions
Revenues$ millions
910
1,5081,5391,531
38
209
115126
13.7
4.1
7.58.4
1,435
1027.1
Metals Service Centers
share above 25%. This large market share and our diverse customer base of approximately 18,000 customers suggest that ourresults should mirror the performance of the regional economies of Canada excluding the automotive sector in which we are not asignificant participant.
Our U.S. operations have approximately 9,000 customers and with the addition of the JMS Russel Metals operations we have anincreased presence in the U.S.
Our Canadian operations are affected by the U.S. dollar exchange rate since some products are sourced outside of Canada and arepriced in U.S. dollars. The strength of the Canadian dollar during the second half of 2007 resulted in some products that we purchasedbeing subsequently available in the marketplace at a lower cost, resulting in lower gross margins during the second half of 2007.
c) Metals service centers segment results -- 2007 compared to 2006Revenues for 2007 decreased by 7% compared to 2006, excluding revenues related to JMS Russel Metals which was acquired inSeptember 2007, mainly due to demand. Overall tons shipped for 2007 were approximately 8% lower than those shipped in 2006.Tons shipped declined in all regions with Ontario representing the largest decline in tons shipped and the U.S. service centershaving the least decline in tons shipped. The decline in tons shipped in Ontario, which started in the third quarter of 2006,stabilized in the fourth quarter of 2007.
Our British Columbia region decline in tons for the year is similar to the decline in the segment; however, the decline occurred in thelast half of 2007 and was related to reduced demand in the forestry sector.
The average selling price of metal for 2007 was approximately the same as the average selling price for 2006. Selling pricesdeclined to current levels in the third quarter of 2005 and have moved up and down within a 5% band of this level during the lasttwo and one-half years.
Gross margin as a percentage of revenues at 24.1% for 2007 represents a decline compared to 25.1% for 2006. Lower demandresulting in excess inventories in the service center industry has resulted in margin pressure.
The average revenue per invoice for 2007 was approximately $1,801 compared to $1,906 for 2006.
We believe that the strength of the Canadian dollar in 2007 adversely impacted those of our customers in Ontario and Quebec whosell finished products outside of Canada and, consequently, we experienced reduced volumes in these regions. To date, the changein the Canadian dollar versus the U.S. dollar has not been a significant factor in relation to inventory costs in the metals servicecenters as inventory is purchased for our Canadian operations from Canadian or U.S. suppliers based on the landed cost at thespecific location in Canada. The strength of the Canadian dollar during the last half of 2007 has reduced the replacement cost forcertain products sourced from the U.S. This has put pressure on selling prices and gross margins as customers expect the lowerexchange rate to immediately be factored into the price they pay for metal.
Operating expenses in our metals service centers segment decreased by $16.9 million, or 7%, compared to 2006, prior to theoperating expenses of JMS Russel Metals operations. This was primarily due to lower compensation expense. Our compensationplans are based on pay for performance and our compensation expenses declined with the lower profits in our operations. Inaddition, we had lower plant and trucking expenses related to lower volumes and lower bad debts in 2007 as one large claim in 2006 was not repeated.
Metals service centers operating profits for 2007 of $101.9 million were $24.5 million lower than 2006, mainly related to lowervolumes and gross margins partially offset by lower operating expenses.
d) Metals service centers segment results -- 2006 compared to 2005Revenues for 2006 were 2% lower than revenues for 2005. The average selling price of steel for 2006 declined approximately 3%from the average selling price for 2005. The average selling price declined each quarter for the first three quarters in 2005.Average selling price remained relatively constant after that, with the average selling prices for the 2006 year being equivalent tothe average selling price for the fourth quarter of 2005.
Overall tons shipped for 2006 were approximately 1% higher than those shipped in 2005. Tons shipped in Alberta and BritishColumbia were both up 10% due to oil and gas related activity in Alberta and infrastructure build in both provinces. Volumes were
10 RUSSEL METALS 2007 ANNUAL REPORT
> management’s discussion and analysis cont’d
For the year ended December 31, 2007

RUSSEL METALS 2007 ANNUAL REPORT 11
strong at our Russel Metals Williams Bahcall operations with an increase of approximately 12% in tons shipped due to improvedcustomer demand in the Wisconsin region. Tons shipped declined approximately 9% in our Atlantic region due to lack of projectwork in this area. All other regions had tons shipped that approximated those of 2005.
Gross margin as a percentage of revenues improved from 23.1% for 2005 to 25.1% for 2006 related to stable inventory costsduring 2006 compared to 2005 when we had higher cost inventory on hand as purchasing prices were declining.
The average revenue per invoice for 2006 was approximately $1,906 compared to the average for 2005 of approximately $1,888.
Operating expenses in our metals service centers segment increased by $11.8 million, or 5%, compared to 2005. This wasprimarily due to higher compensation expense, delivery costs and bad debt expense. The increase in compensation expense relatesto higher wages in regions where the volumes are up, as well as higher costs to maintain staff in Western Canada and higheramounts within our pay for performance plans. The increase in bad debt expense occurred in the first quarter of 2006 related to aspecific customer.
Metals service centers operating profits for 2006 of $126.4 million were $11.2 million higher than 2005, related to lower cost ofgoods sold and the elimination in 2006 of inventory holding losses experienced in 2005.
Energy Tubular Products
a) Description of operationsThese operations distribute oil country tubular goods (OCTG), line pipe, tubes, valves and fittings, primarily to the energy industry in Western Canada and the western United States, from 5 Canadian and 2 U.S. locations. We purchase these products either fromthe pipe processing arms of North American steel mills, independent manufacturers of pipe and pipe accessories or internationalsteel mills. Our energy tubular products segment operates under the names Comco Pipe and Supply Company, Fedmet Tubulars,Triumph Tubular & Supply, Pioneer Pipe and Spartan Steel.
b) Factors affecting resultsThe following is a general discussion of the factors affecting our energy tubular products segment operations. More specificinformation on how these factors impacted 2007, 2006 and 2005 is found in the sections that follow.
Oil and gas prices, which are among the factors that can impact oil rig count and subsequent drilling activities particularly inWestern Canada, have the ability to significantly affect demand for our products. Rig activity was significantly lower in 2007 versus2006 and 2005. Rig activity in 2007 declined to levels lower than those experienced at any time in the last 10 years. Oil and gasprices denominated in Canadian dollars, which dropped during 2006, have shown only modest improvement in 2007.
Our Canadian operations are affected by the U.S. dollar exchange rate since some products are sourced outside Canada and arepriced in U.S. dollars. The appreciation of the Canadian dollar has reduced the average cost of metal purchased. This reduction incost has resulted in pressure on selling prices, resulting in lower margins on inventory purchased earlier in the year.
Energy Tubular Products
0706050403 0706050403 0706050403
Operating Profits asa % of Revenues
Operating Profits$ millions
Revenues $ millions
298
614595
395
14
47
54
62
11.9
4.6
10.1
677
55
8.0
9.1
The Province of Alberta announced higher royalty payments to the Alberta provincial government starting in 2009. This, along withpricing and foreign exchange rates, has impacted the level of oil and gas rig activity, oil sands activity and investment in this sectorin the second half of 2007.
Oil and gas drilling in Western Canada usually peaks during the period from October to March; thus our revenues and operatingprofits have historically been higher during these two quarters. The first quarter remained strong in both 2006 and 2007; however,the fourth quarter was not stronger than the third quarter in both years. This was caused by a decline in volumes for the traditionalWestern Canada oil and gas drilling pipe and an increase in volumes related to oil sands projects in northern Alberta, gas drilling in western U.S. and sales to the utilities sector which do not follow the seasonal patterns of oil and gas drilling. Oil and gas drilling in Western Canada was significantly lower in 2007; however, activity in the oil sands of northern Alberta and line pipevolumes in the U.S. have offset this decline.
Pricing is influenced by overall demand, trade sanctions and product availability. Trade sanctions are initiated either by steel mills orgovernment agencies in North America. Trade sanctions have not been a factor for pipe products during the reported period; however, itmay improve pricing in 2008 as both Canada and the U.S. initiated actions against Chinese pipe at the end of 2007 or early 2008.
c) Energy tubular products segment results -- 2007 compared to 2006Revenues increased 10% to $677.2 million in 2007 compared to 2006. The increase in revenues is a result of volume increases in2007 related to large transactional sales at lower margins in both Canada and the U.S.
Comco Pipe, which services the oil exploration activities in the oil sands of northern Alberta, had a record year in volumes andoperating profits. Our U.S. operation distributing line pipe to the oil and gas industry had increased volumes resulting in strong profits.
These volume increases were partially offset by lower volumes shipped from our two operations in Western Canada due to lower oiland gas drilling activity and excess inventory in the region. Trade actions on Chinese pipe imports at year end in both Canada andthe U.S. are expected to help reduce inventory levels in the sector in 2008.
Gross margin as a percentage of revenues was 14.4% for 2007, a decrease from 16.5% for 2006. The lower margin mainly relatesto the increased cost of goods sold resulting from higher tubing and casing prices and lower margins on the large line pipetransactions in the U.S. during 2007.
Operating expenses were higher by $4.3 million for 2007 compared to 2006, due to higher delivery costs related to our U.S.operations and higher employee costs in our operations with higher volumes.
Operating profits were $54.5 million for 2007 compared to $62.2 million for 2006. The decrease in operating profits was due toboth lower margins and higher expenses.
d) Energy tubular products segment results -- 2006 compared to 2005Revenues increased 3% to $614.3 million for 2006 compared to 2005. The increase in revenues was related to strong volumessold to the oil and gas drilling industry in both Western Canada and the western United States. The second and third quarter of2005 had significant revenues related to infrastructure build for the oil sands of northern Alberta that was not present in 2006.
Gross margin as a percentage of revenue was 16.5% for 2006, an increase from 14.6% for 2005. This improved margin wasgenerated by higher margins on tubular products in short supply. The 2006 results include a smaller portion of lower margin energyproject revenues, resulting in a higher gross margin as a percentage of revenues. Gross margin dollars increased 16% in 2006mainly related to higher volumes.
Operating expenses were higher by $5.9 million for 2006 compared to 2005 due to higher delivery costs related to volumeincreases and variable compensation related to higher profitability.
Operating profits increased by $8.2 million, or 15%, to $62.2 million for 2006, compared to 2005. This increase in operatingprofits was driven by higher volumes and gross margins.
12 RUSSEL METALS 2007 ANNUAL REPORT
> management’s discussion and analysis cont’d
For the year ended December 31, 2007
RUSSEL METALS 2007 ANNUAL REPORT 13
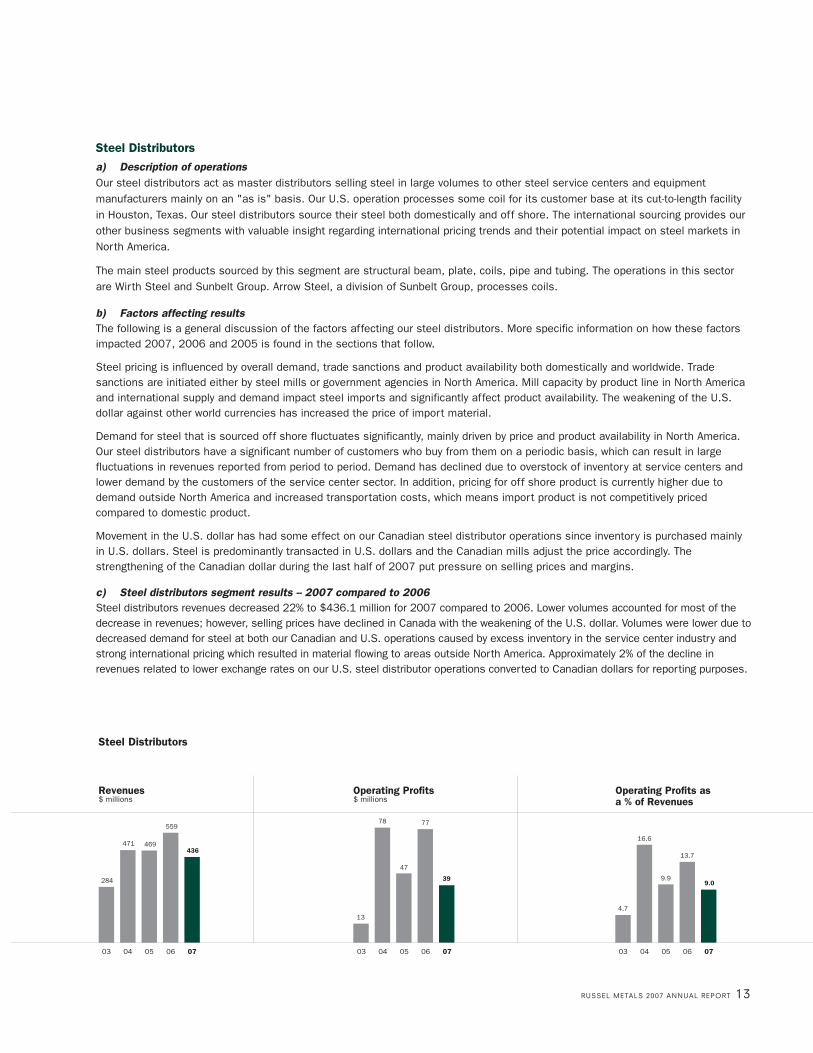
Steel Distributorsa) Description of operationsOur steel distributors act as master distributors selling steel in large volumes to other steel service centers and equipmentmanufacturers mainly on an "as is" basis. Our U.S. operation processes some coil for its customer base at its cut-to-length facilityin Houston, Texas. Our steel distributors source their steel both domestically and off shore. The international sourcing provides ourother business segments with valuable insight regarding international pricing trends and their potential impact on steel markets inNorth America.
The main steel products sourced by this segment are structural beam, plate, coils, pipe and tubing. The operations in this sectorare Wirth Steel and Sunbelt Group. Arrow Steel, a division of Sunbelt Group, processes coils.
b) Factors affecting resultsThe following is a general discussion of the factors affecting our steel distributors. More specific information on how these factorsimpacted 2007, 2006 and 2005 is found in the sections that follow.
Steel pricing is influenced by overall demand, trade sanctions and product availability both domestically and worldwide. Tradesanctions are initiated either by steel mills or government agencies in North America. Mill capacity by product line in North Americaand international supply and demand impact steel imports and significantly affect product availability. The weakening of the U.S.dollar against other world currencies has increased the price of import material.
Demand for steel that is sourced off shore fluctuates significantly, mainly driven by price and product availability in North America.Our steel distributors have a significant number of customers who buy from them on a periodic basis, which can result in largefluctuations in revenues reported from period to period. Demand has declined due to overstock of inventory at service centers andlower demand by the customers of the service center sector. In addition, pricing for off shore product is currently higher due todemand outside North America and increased transportation costs, which means import product is not competitively pricedcompared to domestic product.
Movement in the U.S. dollar has had some effect on our Canadian steel distributor operations since inventory is purchased mainlyin U.S. dollars. Steel is predominantly transacted in U.S. dollars and the Canadian mills adjust the price accordingly. Thestrengthening of the Canadian dollar during the last half of 2007 put pressure on selling prices and margins.
c) Steel distributors segment results -- 2007 compared to 2006Steel distributors revenues decreased 22% to $436.1 million for 2007 compared to 2006. Lower volumes accounted for most of thedecrease in revenues; however, selling prices have declined in Canada with the weakening of the U.S. dollar. Volumes were lower due todecreased demand for steel at both our Canadian and U.S. operations caused by excess inventory in the service center industry andstrong international pricing which resulted in material flowing to areas outside North America. Approximately 2% of the decline inrevenues related to lower exchange rates on our U.S. steel distributor operations converted to Canadian dollars for reporting purposes.
Steel Distributors
0706050403 0706050403 07 06050403
Operating Profits$ millions
Revenues $ millions
Operating Profits asa % of Revenues
284
559
469471
13
78
47
77
16.6
4.7
9.9
13.7436
399.0
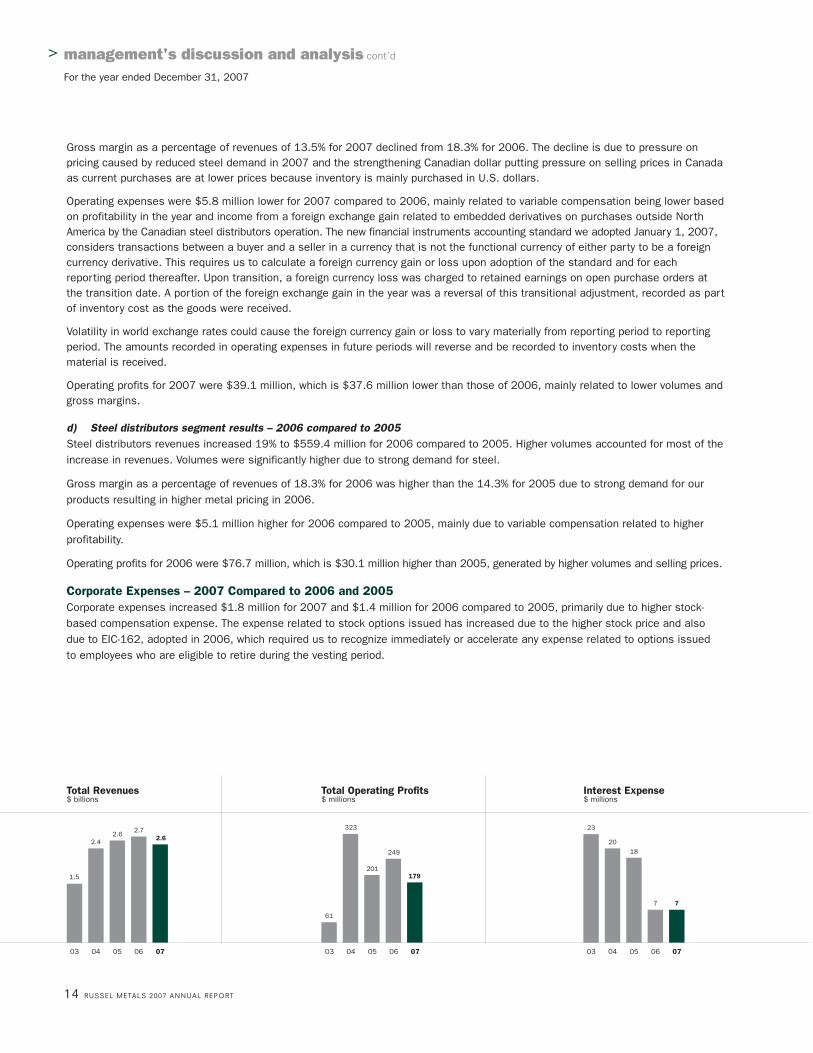
Gross margin as a percentage of revenues of 13.5% for 2007 declined from 18.3% for 2006. The decline is due to pressure onpricing caused by reduced steel demand in 2007 and the strengthening Canadian dollar putting pressure on selling prices in Canadaas current purchases are at lower prices because inventory is mainly purchased in U.S. dollars.
Operating expenses were $5.8 million lower for 2007 compared to 2006, mainly related to variable compensation being lower basedon profitability in the year and income from a foreign exchange gain related to embedded derivatives on purchases outside NorthAmerica by the Canadian steel distributors operation. The new financial instruments accounting standard we adopted January 1, 2007,considers transactions between a buyer and a seller in a currency that is not the functional currency of either party to be a foreigncurrency derivative. This requires us to calculate a foreign currency gain or loss upon adoption of the standard and for eachreporting period thereafter. Upon transition, a foreign currency loss was charged to retained earnings on open purchase orders atthe transition date. A portion of the foreign exchange gain in the year was a reversal of this transitional adjustment, recorded as partof inventory cost as the goods were received.
Volatility in world exchange rates could cause the foreign currency gain or loss to vary materially from reporting period to reportingperiod. The amounts recorded in operating expenses in future periods will reverse and be recorded to inventory costs when thematerial is received.
Operating profits for 2007 were $39.1 million, which is $37.6 million lower than those of 2006, mainly related to lower volumes andgross margins.
d) Steel distributors segment results -- 2006 compared to 2005Steel distributors revenues increased 19% to $559.4 million for 2006 compared to 2005. Higher volumes accounted for most of theincrease in revenues. Volumes were significantly higher due to strong demand for steel.
Gross margin as a percentage of revenues of 18.3% for 2006 was higher than the 14.3% for 2005 due to strong demand for ourproducts resulting in higher metal pricing in 2006.
Operating expenses were $5.1 million higher for 2006 compared to 2005, mainly due to variable compensation related to higherprofitability.
Operating profits for 2006 were $76.7 million, which is $30.1 million higher than 2005, generated by higher volumes and selling prices.
Corporate Expenses -- 2007 Compared to 2006 and 2005Corporate expenses increased $1.8 million for 2007 and $1.4 million for 2006 compared to 2005, primarily due to higher stock-based compensation expense. The expense related to stock options issued has increased due to the higher stock price and alsodue to EIC-162, adopted in 2006, which required us to recognize immediately or accelerate any expense related to options issuedto employees who are eligible to retire during the vesting period.
14 RUSSEL METALS 2007 ANNUAL REPORT
> management’s discussion and analysis cont’d
For the year ended December 31, 2007
0706050403 0706050403 0706050403
Interest Expense $ millions
Total Operating Profits$ millions
Total Revenues$ billions
1.5
2.72.6
2.4
61
323
201
249
20
23
18
7
2.6
179
7

0706050403 0706050403 0706050403
Dividend Yield%
Common Share Price$ per share
Dividends Paid per Common Share$ per share
0.29
1.50
0.90
0.508.79
15.50
21.85
26.70
3.33.3
4.1
5.6
1.75 25.45 6.9
RUSSEL METALS 2007 ANNUAL REPORT 15
Other -- 2007 Compared to 2006 and 2005Other revenues and income represent the results of our bulk commodities handling terminal in Thunder Bay, Ontario. Revenues andoperating profits for 2007 compared to 2006 have improved primarily related to higher volumes handled in 2007 and the absenceof severance costs relating to downsizing recorded in the first quarter of 2006.
Consolidated Results -- 2007 Compared to 2006 and 2005Operating profits from operations before other costs or income for 2007 were $179.3 million compared to $249.0 million in 2006 and $201.4 million in 2005. Lower volumes in the metals service centers and steel distributors segments account for most of this decline. Weaker margins in 2007 resulted in operating earnings for each of our three segments being lower than the results for the same period in 2006.
Interest ExpenseThe following table shows the components of our interest expense:
(millions) 2007 2006 2005
Interest on long-term debt $ 15.3 $ 14.8 $ 15.2
Other interest (net) (8.2) (8.1) 2.3
Total interest $ 7.1 $ 6.7 $ 17.5
Consolidated interest expense for 2007 increased by $0.4 million to $7.1 million compared to 2006. We have had cash on handand, correspondingly, interest income since March 2006 when we issued 11 million common shares. Interest income for 2007 wassimilar to 2006 as the reduction in cash related to the acquisition of JMS Metal Services at September 28, 2007 was offset by areduction in working capital in the fourth quarter of 2007.
Unrealized Loss on InvestmentPrior to August 23, 2007, a portion of our cash and cash equivalents was held in non-bank Canadian asset-backed commercialpaper. On August 23, 2007, we were notified that the principal of $11.0 million was not able to be repaid due to a disruption in theCanadian market for asset-backed commercial paper. The Montreal Group, representing banks, asset-backed commercial paperproviders and major investors, requested that we, along with other participants, agree to a standstill agreement. At this point, thedetails of the trust we have invested in have not been disclosed. As required by GAAP, we have made a fair value determination ofthis investment which is classified as held-for-trading. As no active market exists for this investment, we used a probability-weightedvaluation technique to obtain a fair value. This technique considers the time value of money and the credit risk associated with theinvestment. We used the following assumptions in our valuation: the trust is a going concern, the senior notes will be AAA rated andthe notes will be interest bearing; however, interest received will be net of restructuring costs and standby fees on the marginfacility. Based on our assumptions, a write-down of $1.1 million was recorded and the asset was reclassified to other assets on ourbalance sheet. As we have substantial cash and available credit, this had no material impact on our liquidity.
Ineffectiveness on Cash Flow HedgesAs required under the standard for financial instruments and hedges, we evaluated the effectiveness of our swaps which hedge ourU.S. Senior Notes. Due to the significant movement in the Canadian dollar versus the U.S. dollar and the reduction in the U.S.prime rate for interest, we determined that a portion of our hedge was ineffective and a loss of $0.9 million was recorded. Inaddition, the value of our call option related to the Senior Notes was reduced resulting in a loss of $0.5 million.
RestructuringIn May 2006, we sold our Milton, Ontario facility, which was closed during 2005. The gain on sale before income taxes wasapproximately $1.2 million.
Income TaxesOur provision for income taxes for 2007 was $60.1 million, which was $24.7 million lower than that of 2006, related to lowerearnings. Our income tax rate for 2007 was 35.4%. This is slightly higher than our normalized effective income tax rate for 2007,as the rate was increased by non-deductible expenses related to stock options issued in the second quarter of 2007. The rate wasfavourably impacted by a Canadian Federal tax rate reduction enacted in the fourth quarter of 2007, which reduced our future taxliabilities by approximately $0.5 million resulting in lower tax expense. We estimate our normalized effective income tax rate to be34.0% for 2008, which reflects the tax budget changes enacted in 2007.
For 2006, the income tax rate was 34.8%. Our income tax rate for 2006 was favourably impacted, as we were able to utilizeunrecorded capital losses against a one-time capital gain on the sale of our Milton facility, resulting in lower income tax expense onthe transaction. During the second quarter of 2006, the Canadian Federal budget, which proposed rate reductions in 2008 to2010, was enacted. This change reduced our future tax liabilities by approximately $0.4 million resulting in lower income taxexpense in 2006. Our income tax rate was negatively impacted by non-deductible expenses related to stock options issued in thefirst and second quarters of 2006.
Discontinued OperationsDuring the fourth quarter of 2007, an outstanding legal issue related to the U.S. operations acquired with the Acier Lerouxacquisition was settled in our favour. An unused provision of $1.6 million related to this matter was recorded as income fromdiscontinued operations in 2007.
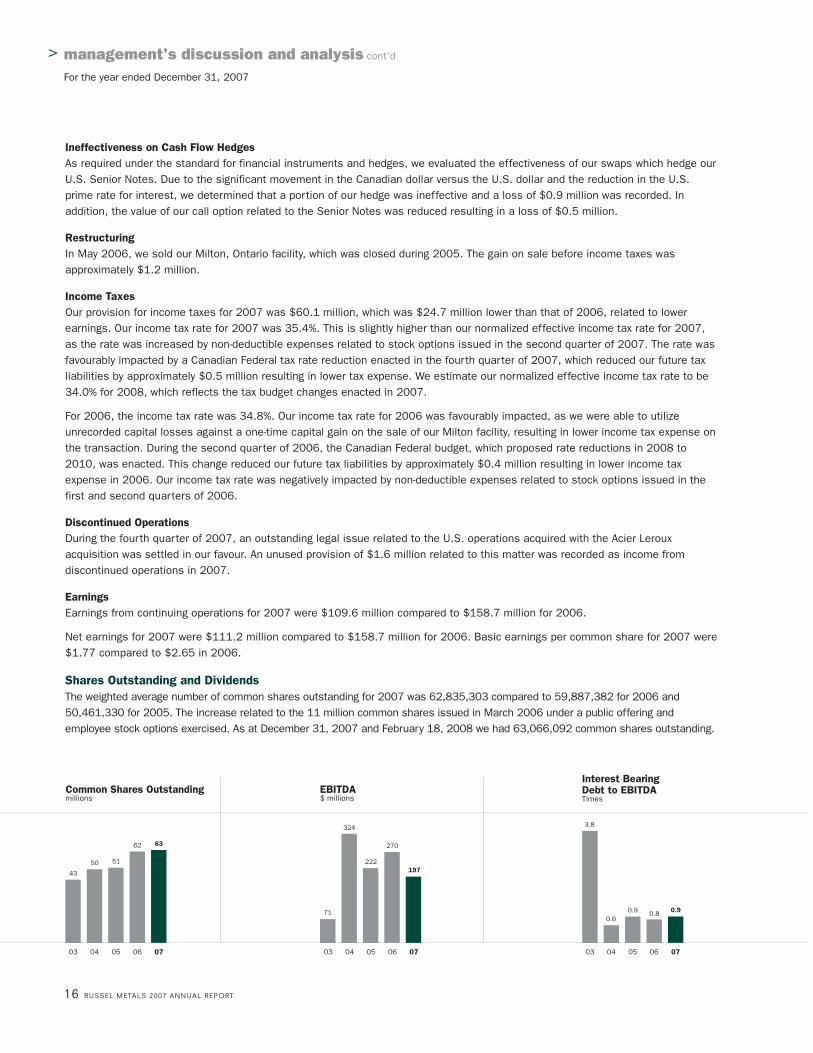
EarningsEarnings from continuing operations for 2007 were $109.6 million compared to $158.7 million for 2006.
Net earnings for 2007 were $111.2 million compared to $158.7 million for 2006. Basic earnings per common share for 2007 were$1.77 compared to $2.65 in 2006.
Shares Outstanding and DividendsThe weighted average number of common shares outstanding for 2007 was 62,835,303 compared to 59,887,382 for 2006 and50,461,330 for 2005. The increase related to the 11 million common shares issued in March 2006 under a public offering andemployee stock options exercised. As at December 31, 2007 and February 18, 2008 we had 63,066,092 common shares outstanding.
16 RUSSEL METALS 2007 ANNUAL REPORT
> management’s discussion and analysis cont’d
For the year ended December 31, 2007
0706050403 0706050403 0706050403
Common Shares Outstandingmillions
Interest BearingDebt to EBITDATimes
EBITDA$ millions
71
270
222
324 3.8
0.60.9 0.8 0.9
43
5150
62 63
197

RUSSEL METALS 2007 ANNUAL REPORT 17
We have returned a portion of our earnings to our shareholders by paying common share dividends of $110.1 million in 2007,$89.4 million in 2006 and $45.4 million in 2005. The increase relates to additional shares outstanding and our increased dividendrate. We paid a cash dividend of $1.75 per share for 2007, $1.50 per share for 2006 and $0.90 per share for 2005.
Our U.S. Senior Notes indenture provides that any dividend payment in excess of $0.08 per common share per quarter isconsidered a restricted payment. We currently have a basket of approximately $405 million available for restricted payments. The basket is replenished by 50% of net earnings on a quarterly basis. Share buybacks deplete the basket and proceeds for sharesissued increase the basket.
EBITDAThe following table shows the reconciliation of GAAP earnings from continuing operations to EBITDA:
(millions) 2007 2006 2005
Earnings from continuing operations $ 109.6 $ 158.7 $ 124.6
Provision for income taxes 60.1 84.8 60.4
Interest expense, net 7.1 6.7 17.5
Earnings before interest and income taxes (EBIT) 176.8 250.2 202.5
Depreciation and amortization 20.4 20.0 19.2
Earnings before interest, income taxes, depreciation and amortization (EBITDA) $ 197.2 $ 270.2 $ 221.7
We believe that EBITDA may be useful in assessing our operating performance and as an indicator of our ability to service or incurindebtedness, make capital expenditures and finance working capital requirements. The items excluded in determining EBITDA aresignificant in assessing our operating results and liquidity. Therefore, EBITDA should not be considered in isolation or as analternative to cash from operating activities or other combined income or cash flow data prepared in accordance with GAAP.
Capital ExpendituresCapital expenditures were $16.6 million for 2007 compared to $27.6 million for 2006. During 2006 and the first half of 2007, wewere expanding some of our locations and adding laser burning equipment to certain of our metals service center operations. In thesecond half of 2007, we delayed planned additional expansions in Western Canada as volumes have declined and constructioncosts have increased above our original budget.
Capital expenditures mainly relate to the replacement of capital items, the purchase of additional processing equipment across a broad base of our operations and upgrades to our existing facilities and computer systems. Our expectation is for capitalexpenditures to be at levels higher than depreciation expense over a period of years for the expansion of product lines andprocessing capabilities.
Depreciation expense was $19.5 million in 2007 and $18.4 million in 2006. The increase mainly relates to additional assets acquiredwith JMS Metal Services.
LiquidityOn September 28, 2007, we utilized $114 million of cash and assumed debt of $7 million to acquire the JMS Metal Services group of companies. At December 31, 2007, we had cash and cash equivalents of $181.8 million.
We stress working capital management to ensure that working capital is minimized and leverage reduced over the economic cycle. Our metals distribution business experiences significant swings in cash flow in order to fund working capital. Inventory and accountsreceivable represent a large percentage of our total assets employed and vary throughout each cycle. At December 31, 2007, currentassets represented 79% of our total assets versus 85% at December 31, 2006. The decline in current assets mainly relates to thecash utilized to acquire fixed assets, intangibles and goodwill of JMS Metal Services. Total assets were $1.4 billion at December 31,2006 and at December 31, 2007.
The balances disclosed in our consolidated cash flow statements are adjusted to remove the non-cash component related to foreignexchange rate fluctuations impacting inventory, accounts receivable, accounts payable and income tax balances of our U.S. operations.

Inventory turns improved in 2007 compared to 2006 in all segments. Reductions in inventory balances generated cash of $89.1 millionin 2007, excluding the reduction related to foreign exchange on inventories held in the U.S. and inventories related to the JMS MetalServices acquisition. All segments are reducing inventories to levels required to service current volumes. We intend to continue toreduce inventory levels in our energy tubular products segment over the next several quarters. Our goal is to ensure that we keep our inventory levels as low as possible in order to minimize inventory valuation risk while still satisfying the needs of our customers.
Inventory turns are calculated using our cost of sales for the quarter annualized, divided by our inventory position at the end of the quarter.
Inventory TurnsQuarter Ended
Dec. 31 Sept. 30 June 30 Mar. 31 Dec. 312007 2007 2007 2007 2006
Metals service centers 4.4 4.2 4.0 3.9 3.8
Energy tubular products 2.6 3.0 2.4 2.7 2.3
Steel distributors 3.1 3.8 3.3 4.5 2.2
Total operations 3.5 3.7 3.3 3.6 2.9
Metals service centers reduced inventory during the third and fourth quarters of 2007 compared to the prior quarters in 2007;however, a similar decline in cost of sales resulted in only a slight improvement in turns. We expect our metals service centersoperations to turn over their inventory at higher rates than the industry average. Based on information published by the MetalsService Center Institute in its monthly Metals Activity Report, average inventory turns for U.S. based steel companies for the threemonths ended December 31, 2007 was 3.9 turns and the average for Canadian based companies was 3.0 turns.
Our energy tubular products segment has reduced inventory levels since December 31, 2006. Inventory needs to be further reduced to align with current volumes.
The improvement in turns in our steel distributors segment relates to lower inventories during 2007 compared to 2006; however,lower sales in the fourth quarter of 2007 impacted turns. In addition, the Canadian operations have increased inventory in thefourth quarter due to the close of navigation on the Great Lakes and we anticipate levels to decline in the first quarter of 2008based on historical patterns.
The other major components of working capital are accounts receivable and accounts payable. Excluding the acquisition of JMSMetal Services, accounts receivable and accounts payable at December 31, 2007 are approximately the same as December 31,2006. Also, revenues for the fourth quarter of 2007 are similar to revenues for the fourth quarter of 2006.
During 2007, we made income tax payments of $75.7 million compared to payments of $71.0 million in 2006 and $110.4 million in 2005.
During 2007, we utilized cash of $16.6 million on capital expenditures and $110.1 million on common share dividends. During2006, we utilized cash of $27.6 million on capital expenditures and $89.4 million on common share dividends.
18 RUSSEL METALS 2007 ANNUAL REPORT
> management’s discussion and analysis cont’d
For the year ended December 31, 2007
Inventories$ millions
Net Assets Employed$ millions
Free Cash Flow$ millions
0706050403 0706050403 0706050403
554
303
474
664
573
522
889
698700
878
8
189
131
159
125
RUSSEL METALS 2007 ANNUAL REPORT 19
Free Cash Flow(millions) 2007 2006 2005
Cash from operating activities before working capital $ 140.4 $ 178.5 $ 149.6Purchase of fixed assets (16.6) (27.6) (26.5)Proceeds on sale of fixed assets 1.5 1.7 1.6Proceeds from assets held for sale and sale of businesses – 6.2 5.9
$ 125.3 $ 158.8 $ 130.6
Free cash flow may be useful in assessing our ability to pay dividends, reduce outstanding debt and fund working capital growth.Free cash flow is a non-GAAP measure regularly used by investors and analysts to evaluate companies.
Cash, Debt and Credit FacilitiesAt December 31, 2007, we had cash and cash equivalents, net of outstanding cheques, of $181.8 million. In March 2006, weissued 11 million common shares for net proceeds of $271.4 million resulting in cash, which has been invested in short-terminvestments until a suitable acquisition or other use of cash occurs. On September 28, 2007, $114 million of cash was used toacquire the JMS Metal Services group of companies. In addition, we assumed development bonds of $7 million.
The application of the new accounting standards related to Financial Instruments and Hedges (see section on Changes in AccountingPolicies) requires all derivatives to be recorded at their fair values and the deferred costs to be netted against the applicable liability. Inaccordance with this standard, the Senior Notes are recorded net of deferred financing charges at December 31, 2007. At December 31,2006 deferred financing charges were recorded in assets. The following table details the changes related to long-term debt:
Amortized Cost or Fair Value as at Balance as at
(millions) December 31, 2007 December 31, 2006
Long-term debt6.375% US$175 million Senior Notes due March 1, 2014 $ 169.0 $ 203.9
Capital leasesArkansas development bonds, maturing 2014 to 2017 6.8 –
175.8 203.9Current portion 0.9 –
$ 174.9 $ 203.9
Obligations under cross currency swaps
Foreign exchange difference on US$100 million(recorded as Other accrued liabilities at December 31, 2006) $ 33.0 $ 15.4
Additional fair value of cash flows to terminate swap(not recorded on balance sheet in 2006) 6.5 –
$ 39.5 $ 15.4
Changes in the value of the debt and the swaps are recorded in other comprehensive income net of income taxes.
0706050403 0706050403 0706050403
Shareholders’ Equity$ millions
Interest Bearing Debt$ millions
Debt to Capitalization%
51
19
27
32
209 211 204 204254
539
457
895 884
17
176

Cash and Bank Credit FacilitiesRussel Metals U.S. Subsidiary
As at December 31, 2007 (millions) Facility Facility Total
Bank loans $ – $ – $ –
Cash net of outstanding cheques 168.2 13.6 181.8
Cash 168.2 13.6 181.8
Facilities availability 200.0 49.4 249.4
Letters of credit 13.6 14.5 28.1
Undrawn facilities 186.4 34.9 221.3
Total cash and undrawn facilities $ 354.6 $ 48.5 $ 403.1
We have a facility with a syndicate of Canadian and U.S. banks for a revolving loan of $200 million, including letters of credit. Thisfacility was extended to January 15, 2011 in December 2007. We may extend this facility annually with the consent of the syndicate.We are entitled to borrow, on a revolving basis, up to an amount equal to the sum of specified percentages of our eligible accountsreceivable and inventories, to a maximum of $200 million. We are currently entitled to borrow $200 million including letters of creditunder this facility. At December 31, 2007, we had no borrowings and had letters of credit of $13.6 million. At December 31, 2006,we had no borrowings and had letters of credit of $54.8 million under this facility.
In addition, a U.S. subsidiary has its own one-year bank credit facility. The maximum borrowing under this facility at December 31,2007 was US$50 million. At December 31, 2007, this subsidiary had no borrowings and had letters of credit of US$14.6 million. AtDecember 31, 2006, this subsidiary had no borrowings and had letters of credit of US$36.1 million.
Cash generated from operating activities before working capital changes was $140.4 million for 2007 and was $178.5 million for2006 due to lower earnings in 2007.
Based on cash, cash equivalents and our bank facilities, we have access to approximately $403 million of cash availability based onour December 31, 2007 balances. In the past, we have made several acquisitions and we believe we can continue to grow byacquisition. We believe we have the ability to fund future acquisitions using cash or through the utilization or expansion of ourexisting bank facilities. We believe we have the ability to significantly increase the bank facility, if required.
20 RUSSEL METALS 2007 ANNUAL REPORT
> management’s discussion and analysis cont’d
For the year ended December 31, 2007
Market Capitalization to Book ValueTimes
Book Value per Common Share$ per share
Market Capitalization$ millions
0706050403 0706050403 0706050403
1.71.5
2.11.9
1.8
9.15
5.90
10.63
14.34 14.01
773
378
1,107
1,665 1,605

RUSSEL METALS 2007 ANNUAL REPORT 21
Contractual ObligationsAs at December 31, 2007, we were contractually obligated to make payments under our long-term debt agreement, cross currencyswap agreements and operating lease obligations that come due during the following periods.
Long-Term Cross Currency Long-Term Lease(millions) Debt Maturities Swaps Debt Interest Obligations Total
2008 $ 0.9 $ – $ 14.6 $ 11.2 $ 26.7
2009 1.0 – 14.5 10.4 25.9
2010 1.0 – 14.5 9.5 25.0
2011 1.1 – 14.4 7.5 23.0
2012 1.1 – 14.4 6.1 21.6
2013 and beyond 175.2 33.0 16.8 9.8 234.8
Total $ 180.3 $ 33.0 $ 89.2 $ 54.5 $ 357.0
The long-term debt interest in the table includes the impact of our swaps. Long-term debt interest has been estimated based oncurrent exchange rates for the portion not hedged.
DerivativesOur fixed interest cross currency swaps obligate us to purchase US$100 million at $1.3180 for each US$1.00. Based on theDecember 31, 2007 exchange rate, we would incur an obligation of $33.0 million in addition to our long-term debt obligation of$172.9 million. The fair value of our swaps includes an additional obligation of $6.5 million, which represents the fair value ofpayments for the remaining life of the debt if we were to extinguish the swaps at December 31, 2007.
Off-Balance Sheet ArrangementsOur off-balance sheet arrangements consist of the letters of credit disclosed in the bank credit facilities table and operating leaseobligations disclosed in the contractual obligations table.
We have multiple defined benefit pension plans in Canada, as disclosed in Note 17 to our 2007 annual consolidated financialstatements. During 2007, we contributed $4.3 million to these plans. We expect to contribute approximately $2.7 million to theseplans during 2008.
Accounting Policies and Estimatesa) Change in Accounting Policies in 2007
Effective January 1, 2007, as required by Canadian accounting standards, we adopted new accounting standards – FinancialInstruments – Recognition and Measurement, Hedges and Comprehensive Income. The principal impacts of the standards are:
(i) Other comprehensive income is a new component of shareholders’ equity and a new statement entitled Statement ofComprehensive Income has been added to our consolidated financial statements.
(ii) Financial assets and liabilities are classified as available-for-sale, held-to-maturity, held-for-trading, other liabilities or loansand receivables.
(iii) Items classified as held-for-trading are measured at fair value with gains and losses recognized in net income. Assetsclassified as available-for-sale are measured at fair value with gains and losses recognized in other comprehensive incomeuntil the item is sold. Other loans and receivables and other liabilities are measured at amortized cost using the effectiveinterest method.
(iv) Derivative instruments including hedges are recorded on the balance sheet at fair value.
(v) This new hedging standard replaces our previous policy and the swaps which hedge our Senior Notes are recorded at fairvalue on the balance sheet with any gains or losses recorded in other comprehensive income until the hedged items arerecognized in the consolidated statement of income.
Our held-for-trading assets include short-term investments, bank accounts, forward exchange contracts and embedded derivatives in inventory purchases. We currently do not have any assets classified as available-for-sale or held-to-maturity. Our accounts receivableare classified under loans and receivables, and accounts payable and long-term debt are classified as other financial liabilities.
The impact on our financial statements is that changes in foreign exchange related to certain open purchase orders and forwardexchange contracts have been reported in operating expenses for 2007. As metal is transacted mainly in U.S dollars worldwide, themajority of the entries relate to U.S. versus Canadian dollar movements on U.S. dollar purchase orders with non North Americansuppliers. These derivatives have been fair valued at December 31, 2007 and January 1, 2007 and changes are reported in incomefor 2007. The net impact of these items in 2007 totalled $1.3 million of income and has been reported in the operating profits ofthe operating segments where the contracts exist. Any transitional adjustment related to the January 1, 2007 fair value of like itemshas been included in retained earnings.
In addition, our long-term debt and the related swaps are recorded at amortized costs or fair values on the balance sheet. Seedetails under Cash, Debt and Credit Facilities.
b) Future Accounting and Reporting Changes
Effective January 1, 2008, we are adopting the Canadian accounting standards new section on Inventories. This section givesspecific guidance on costing of inventories and presentation of expense allocation between cost of goods sold and operatingexpenses.
We, along with other distributors in our industry, have not used absorption accounting for allocation of certain plant costs betweencost of sales and operating expenses for processing activities. Effective January 1, 2008, we will use absorption accounting for ourprocessing activities. This will result in an increase in cost of sales and a decrease in gross margin dollars and operating expensesof a similar number.
In addition, the new standard requires a net realizable value test for inventory on hand at the item level. Consistent with previouspractice we will write down inventories when the net realizable value is less than cost. The new standard requires us to write upvalues to original cost if the net realizable value has increased in the period. We anticipate more volatility in our numbers due to thischange in a declining market, as metals pricing tends to fluctuate with demand and with mill costs that we do not control.
c) Accounting EstimatesThe preparation of our financial statements requires management to make estimates and judgements that affect the reportedamounts. On an ongoing basis, we evaluate our estimates, including those related to bad debts, inventory obsolescence, usefullives of fixed assets, asset retirement obligations, income taxes, restructuring costs, pensions and other post-retirement benefits,fair values, guarantees, environmental obligations, contingencies, litigation and assigned values on net assets acquired. We baseour estimates on historical experience and on various other assumptions that are believed to be reasonable under thecircumstances, the results of which form the basis for making judgements about the carrying values of assets and liabilities that arenot readily apparent from other sources. Actual results may differ from these estimates.
Our most significant assets are accounts receivable and inventory.
Accounts ReceivableWe maintain an allowance for doubtful accounts for estimated losses resulting from the inability of our customers to make requiredpayments. Assessments are based on aging of receivables, legal issues (bankruptcy status), past collection experience, currentfinancials or credit agency reports and the experience of our credit personnel. Accounts receivable that we determine to beuncollectible are reserved in the period in which the determination is made. If the financial condition of our customers were todeteriorate, resulting in an impairment of their ability to make payments, additional allowances may be required. Our reserve forbad debts at December 31, 2007 is consistent with the level at December 31, 2006.
InventoriesWe review our inventory to ensure that the cost of inventory is not in excess of its estimated market value and for obsolete andslow moving product. Inventory reserves or write-downs are recorded when cost exceeds the market value and when product isdetermined to be slow moving or obsolete. Significant reductions in market value could result in additional write-downs. Theinventory reserve level at December 31, 2007 is reduced from the level at December 31, 2006 based on net realizable values at December 31, 2007.
22 RUSSEL METALS 2007 ANNUAL REPORT
> management’s discussion and analysis cont’d
For the year ended December 31, 2007
RUSSEL METALS 2007 ANNUAL REPORT 23
Other areas involving significant estimates and judgements include:
Income TaxesWe believe that we have adequately provided for income taxes based on all of the information that is currently available. Thecalculation of income taxes in many cases requires significant judgement in interpreting tax rules and regulations, which areconstantly changing. Our tax filings are also subject to audits, which could materially change the amount of current and futureincome tax assets and liabilities. Any change would be recorded as a charge to or reduction in income tax expense.
Employee Benefit PlansWe perform a valuation, at least every three years, for each plan to determine the actuarial present value of the accrued pensionand other retirement benefits. The valuation uses management’s assumptions for the discount rate, expected long-term rate ofreturn on plan assets, rate of compensation increase, health-care cost trend rates and expected average remaining years of service of employees.
While we believe that these assumptions are reasonable, differences in actual results or changes in assumptions could materiallyaffect employee benefit obligations and future net benefit plans costs. We account for differences between actual and assumedresults by recognizing differences in benefit obligations and plan performance over the working lives of the employees who benefitfrom the plans.
Investment in Asset-Backed Commercial PaperWe have excess cash which is currently being invested on a short-term basis. Prior to August 2007, our investment policy allowed forinvestments in non-bank and bank asset-backed commercial paper. The policy limits the amounts invested by asset type and issuer.
We performed a probability-weighted valuation technique to obtain a fair value for this asset. While we believe our assumptions arereasonable based on available information, the actual recovery on this investment could be materially different and our valuationmay change in future periods as more information becomes available.
Controls and Procedures
Disclosure controls and procedures are designed to provide reasonable assurance that all relevant information is gathered andreported to senior management on a timely basis so that appropriate decisions can be made regarding public disclosure.
The purpose of internal controls over financial reporting as defined by the Canadian Securities Administrators is to providereasonable assurance that:
(i) financial statements prepared for external purposes are in accordance with the Company’s Generally Accepted AccountingPrinciples,
(ii) transactions are recorded as necessary to permit the preparation of financial statements, and records are maintained inreasonable detail,
(iii) receipts and expenditures of the Company are made only in accordance with authorizations of the Company’s managementand directors, and
(iv) unauthorized acquisitions, uses or dispositions of the Company’s assets that could have a material effect on the financialstatements will be prevented or detected in order to prevent material error in financial statements.
The President and Chief Executive Officer, and the Vice President and Chief Financial Officer have caused management and otheremployees to design and document our internal controls over financial reporting. No material weaknesses in the designeffectiveness were identified during the documentation of these internal controls.
No changes were made in our disclosure controls or our internal control over financial reporting during 2007 that have materiallyaffected, or are reasonably likely to materially affect, our internal control over financial reporting.
Vision and StrategyThe metals distribution business is a segment of a mature, cyclical industry. The use of service centers and steel distributors byboth manufacturers and end users of steel continues to grow. This is evidenced by the growth in the percentage of total steelshipments from steel producers to service centers. As the distribution segment’s share of steel industry shipments continues togrow, service centers such as ours can grow their business over the course of a cycle.
We strive to deal with the cyclical nature of the business by operating with the lowest possible net assets throughout the course ofa cycle. In order to achieve this, management emphasizes profitability rather than revenue growth. This intensive asset managementreduces borrowings and therefore interest expense in declining periods in the economic cycle. This in turn creates higher, morestable returns on net assets over the course of the cycle. Our conservative management approach creates relatively stronger troughearnings but could cause potential peak earnings to be somewhat muted. Management strongly believes that it is more prudent tobe profitable throughout a cycle, without the spikes in earnings caused by less emphasis on asset management, and have averageearnings over the full range of the cycle in the top deciles of the industry.
Growth from selective acquisitions is also a core strategy. We focus on investment opportunities in businesses that have strongmarket niches or provide mass to our existing operations. We believe that our acquisition of JMS Metal Services in September2007 provides a platform for growth in the Southeastern and Midwestern regions of the United States.
In both the energy tubular products and steel distributors segments, all of the business units have significant operations in themarket niche that they service. Consistent with our acquisition philosophy, any new acquisitions in these areas would likely beeither major stand-alone operations or those that complement our existing operations.
In the future, we believe that the length of the steel-based economic cycle will continue to shorten and a management structureand philosophy that allows the fastest reaction to changes that affect the industry will be the most successful. We will continue toinvest in business systems to enable faster reaction times to changing business conditions. In addition, management believes thehigh level of service and flexibility provided by service centers will enable this distribution channel to capture an increasingpercentage of total steel revenues to end users, allowing for increased growth within the sector.
RiskThe timing and extent of future price changes from the steel producers and their impact on us can not be predicted with anycertainty due to the inherent cyclical nature of the steel industry.
Fourth Quarter ResultsRevenues for the fourth quarter of 2007 compared to the fourth quarter of 2006 were down 4% when the revenues of JMS RusselMetals are excluded. The energy tubular products segment had higher volumes whereas the steel distributors volumes havedeclined. The earnings are lower mainly due to lower selling prices resulting in lower margins. Our earnings per share were $0.40for the fourth quarter of 2007 compared to that reported for the fourth quarter of 2006 of $0.49.
OutlookWe are starting to see revenue improvement and margin enhancement due to price increases. With the unsettled outlook for theNorth American economy, we cannot forecast past the first quarter of 2008 at this time; however, we anticipate continuingenhancement of our margins in the first quarter in line with price increases announced by the North American steel mills which willprovide higher margins on our existing inventories. Furthermore, JMS Russel Metals operations, acquired at the end of the thirdquarter in 2007, are expected to provide additional accretion on a comparative basis versus the first three quarters in 2007.
Subsequent EventOn February 18, 2008, the Board approved the filing of a normal course issuer bid, which will allow us to purchase up to six millionof our common shares. Our share price has recently traded at prices which we believe do not truly reflect the value of the Company.The purchase of six million shares will not jeopardize our ability to pay our dividend.
February 18, 2008
24 RUSSEL METALS 2007 ANNUAL REPORT
> management’s discussion and analysis cont’d
For the year ended December 31, 2007
> management’s report to the shareholders
RUSSEL METALS 2007 ANNUAL REPORT 25
The accompanying consolidated financial statements, management’s discussion and analysis and all information in the Annual Report have been prepared by management and approved by the Audit Committee and the Board of Directors of the Company.
These consolidated financial statements were prepared in accordance with Canadian generally accepted accounting principles and,where appropriate, reflect management’s best estimates and judgements. Management is responsible for the accuracy, integrity andobjectivity of the consolidated financial statements and management’s discussion and analysis within reasonable limits of materialityand for the consistency of financial data included in the text of the Annual Report with that contained in the consolidated financialstatements.
To assist management in the discharge of these responsibilities, the Company has developed, documented and maintained a system of internal controls in order to provide reasonable assurance that its assets are safeguarded; that only valid and authorizedtransactions are executed; and that accurate, timely and comprehensive financial information is prepared in accordance with Canadiangenerally accepted accounting principles. In addition, the Company has developed and maintained a system of disclosure controls inorder to provide reasonable assurance that the financial information is relevant, reliable and accurate. The Company has evaluated its disclosure controls for the year ended December 31, 2007, and has concluded that they are effective.
The Company’s Audit Committee is appointed annually by the Board of Directors. The Audit Committee, which is composed entirely ofoutside directors, meets with management to satisfy itself that management is properly discharging its financial reportingresponsibilities and to review the consolidated financial statements, the management’s discussion and analysis and the report toshareholders. The Audit Committee reports its findings to the Board of Directors for consideration in approving the consolidatedfinancial statements, the management’s discussion and analysis and the report to shareholders for presentation to the shareholders.
The consolidated financial statements have been audited on behalf of the shareholders by the external auditors Deloitte & Touche LLPin accordance with Canadian generally accepted auditing standards. Deloitte & Touche LLP has full and free access to the Audit Committee.
February 18, 2008
E.M. Siegel, Jr. M.E. Britton
President and Vice President andChief Executive Officer Chief Financial Officer
To the Shareholders of Russel Metals Inc.We have audited the consolidated balance sheets of Russel Metals Inc. as at December 31, 2007 and 2006 and the consolidatedstatements of earnings, retained earnings, comprehensive income, accumulated other comprehensive loss and cash flows for eachof the years in the three-year period ended December 31, 2007. These financial statements are the responsibility of the Company’smanagement. Our responsibility is to express an opinion on these financial statements based on our audits.
We conducted our audits in accordance with Canadian generally accepted auditing standards. Those standards require that we planand perform an audit to obtain reasonable assurance whether the financial statements are free of material misstatement. An auditincludes examining, on a test basis, evidence supporting the amounts and disclosures in the financial statements. An audit alsoincludes assessing the accounting principles used and significant estimates made by management, as well as evaluating theoverall financial statement presentation.
In our opinion, these consolidated financial statements present fairly, in all material respects, the financial position of the Companyas at December 31, 2007 and 2006 and the results of its operations and its cash flows for each of the years in the three-yearperiod ended December 31, 2007 in accordance with Canadian generally accepted accounting principles.
Deloitte & Touche LLPChartered AccountantsLicensed Public Accountants
Toronto, OntarioFebruary 18, 2008
26 RUSSEL METALS 2007 ANNUAL REPORT
> auditors’ report
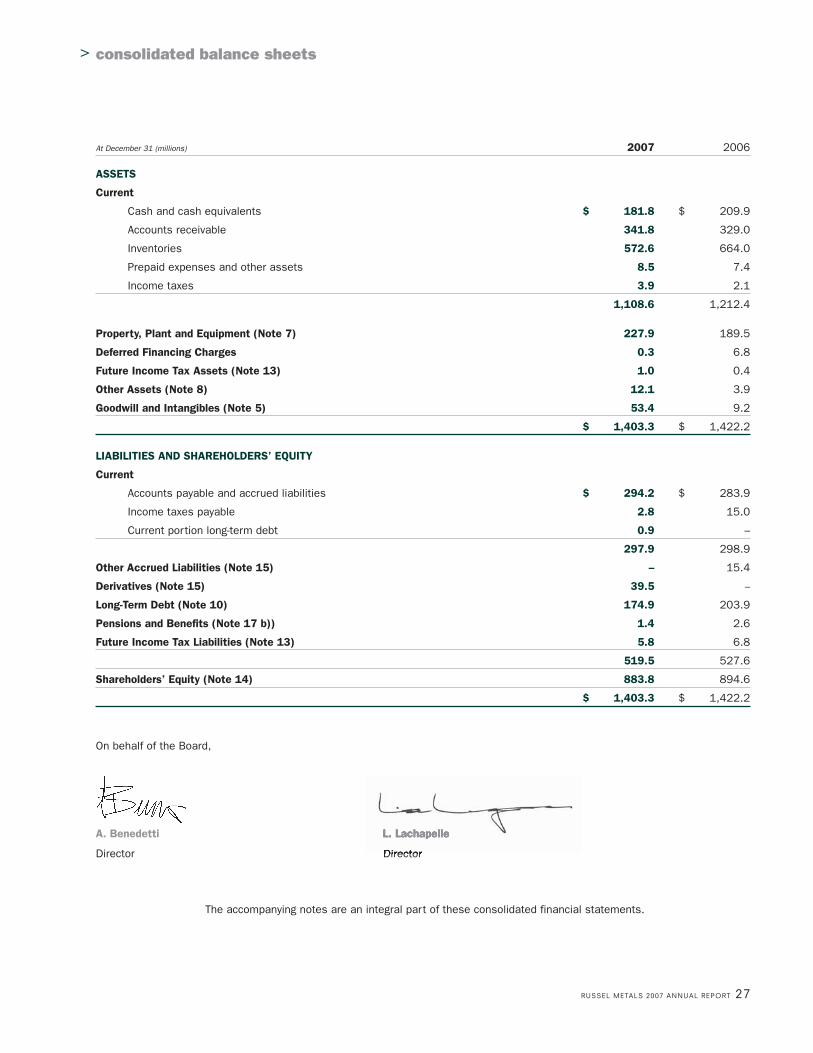
RUSSEL METALS 2007 ANNUAL REPORT 27
> consolidated balance sheets
At December 31 (millions) 2007 2006
ASSETS
Current
Cash and cash equivalents $ 181.8 $ 209.9
Accounts receivable 341.8 329.0
Inventories 572.6 664.0
Prepaid expenses and other assets 8.5 7.4
Income taxes 3.9 2.1
1,108.6 1,212.4
Property, Plant and Equipment (Note 7) 227.9 189.5
Deferred Financing Charges 0.3 6.8
Future Income Tax Assets (Note 13) 1.0 0.4
Other Assets (Note 8) 12.1 3.9
Goodwill and Intangibles (Note 5) 53.4 9.2
$ 1,403.3 $ 1,422.2
LIABILITIES AND SHAREHOLDERS’ EQUITY
Current
Accounts payable and accrued liabilities $ 294.2 $ 283.9
Income taxes payable 2.8 15.0
Current portion long-term debt 0.9 –
297.9 298.9
Other Accrued Liabilities (Note 15) – 15.4
Derivatives (Note 15) 39.5 –
Long-Term Debt (Note 10) 174.9 203.9
Pensions and Benefits (Note 17 b)) 1.4 2.6
Future Income Tax Liabilities (Note 13) 5.8 6.8
519.5 527.6
Shareholders’ Equity (Note 14) 883.8 894.6
$ 1,403.3 $ 1,422.2
On behalf of the Board,
A. Benedetti L. Lachapelle
Director Director
The accompanying notes are an integral part of these consolidated financial statements.
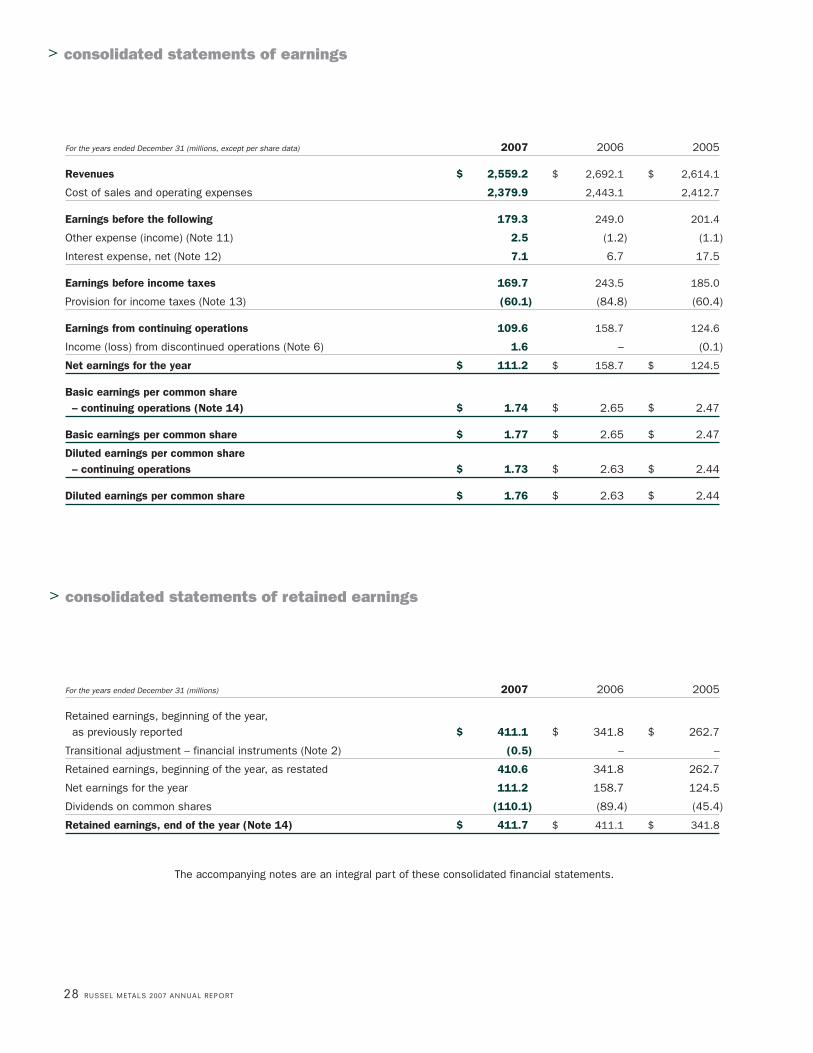
For the years ended December 31 (millions, except per share data) 2007 2006 2005
Revenues $ 2,559.2 $ 2,692.1 $ 2,614.1
Cost of sales and operating expenses 2,379.9 2,443.1 2,412.7
Earnings before the following 179.3 249.0 201.4
Other expense (income) (Note 11) 2.5 (1.2) (1.1)
Interest expense, net (Note 12) 7.1 6.7 17.5
Earnings before income taxes 169.7 243.5 185.0
Provision for income taxes (Note 13) (60.1) (84.8) (60.4)
Earnings from continuing operations 109.6 158.7 124.6
Income (loss) from discontinued operations (Note 6) 1.6 – (0.1)
Net earnings for the year $ 111.2 $ 158.7 $ 124.5
Basic earnings per common share– continuing operations (Note 14) $ 1.74 $ 2.65 $ 2.47
Basic earnings per common share $ 1.77 $ 2.65 $ 2.47
Diluted earnings per common share– continuing operations $ 1.73 $ 2.63 $ 2.44
Diluted earnings per common share $ 1.76 $ 2.63 $ 2.44
> consolidated statements of retained earnings
28 RUSSEL METALS 2007 ANNUAL REPORT
> consolidated statements of earnings
For the years ended December 31 (millions) 2007 2006 2005
Retained earnings, beginning of the year,as previously reported $ 411.1 $ 341.8 $ 262.7
Transitional adjustment – financial instruments (Note 2) (0.5) – –
Retained earnings, beginning of the year, as restated 410.6 341.8 262.7
Net earnings for the year 111.2 158.7 124.5
Dividends on common shares (110.1) (89.4) (45.4)
Retained earnings, end of the year (Note 14) $ 411.7 $ 411.1 $ 341.8
The accompanying notes are an integral part of these consolidated financial statements.
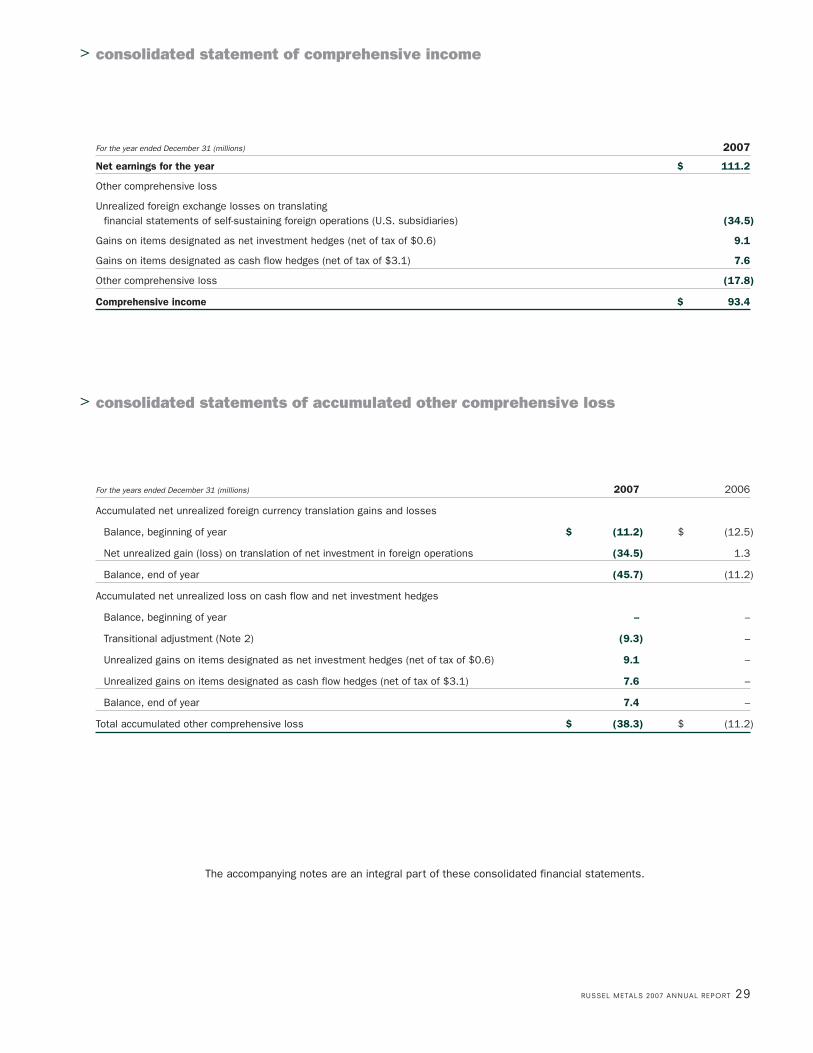
RUSSEL METALS 2007 ANNUAL REPORT 29
> consolidated statement of comprehensive income
For the year ended December 31 (millions) 2007
Net earnings for the year $ 111.2
Other comprehensive loss
Unrealized foreign exchange losses on translatingfinancial statements of self-sustaining foreign operations (U.S. subsidiaries) (34.5)
Gains on items designated as net investment hedges (net of tax of $0.6) 9.1
Gains on items designated as cash flow hedges (net of tax of $3.1) 7.6
Other comprehensive loss (17.8)
Comprehensive income $ 93.4
For the years ended December 31 (millions) 2007 2006
Accumulated net unrealized foreign currency translation gains and losses
Balance, beginning of year $ (11.2) $ (12.5)
Net unrealized gain (loss) on translation of net investment in foreign operations (34.5) 1.3
Balance, end of year (45.7) (11.2)
Accumulated net unrealized loss on cash flow and net investment hedges
Balance, beginning of year – –
Transitional adjustment (Note 2) (9.3) –
Unrealized gains on items designated as net investment hedges (net of tax of $0.6) 9.1 –
Unrealized gains on items designated as cash flow hedges (net of tax of $3.1) 7.6 –
Balance, end of year 7.4 –
Total accumulated other comprehensive loss $ (38.3) $ (11.2)
> consolidated statements of accumulated other comprehensive loss
The accompanying notes are an integral part of these consolidated financial statements.

30 RUSSEL METALS 2007 ANNUAL REPORT
> consolidated cash flow statements
For the years ended December 31 (millions) 2007 2006 2005
Operating activities
Earnings from continuing operations $ 109.6 $ 158.7 $ 124.6
Depreciation and amortization 20.4 20.0 19.2
Future income taxes 4.2 3.9 6.3
Gain on sale of fixed assets and assets held for sale (0.5) (1.3) (2.0)
Stock-based compensation 4.8 3.4 1.5
Pension expense (funding) (Note 17) (1.3) (6.2) –
Other 3.2 – –
Cash from operating activities before working capital 140.4 178.5 149.6
Changes in non-cash working capital items
Accounts receivable (5.0) 30.3 (2.4)
Inventories 89.1 (188.2) 76.5
Accounts payable and accrued liabilities 4.7 (30.9) (32.2)
Current income taxes (17.6) 9.2 (55.6)
Other (0.9) (0.4) –
Change in non-cash working capital 70.3 (180.0) (13.7)
Cash from (used in) operating activities 210.7 (1.5) 135.9
Financing activities
Decrease in bank borrowing – (2.1) (31.2)
Issue of common shares (Note 14) 10.9 277.9 4.4
Dividends on common shares (110.1) (89.4) (45.4)
Deferred financing (0.2) (1.1) (0.3)
Repayment of long-term debt (0.3) – –
Cash from (used in) financing activities (99.7) 185.3 (72.5)
Investing activities
Purchase of fixed assets (16.6) (27.6) (26.5)
Proceeds on sale of fixed assets 1.5 1.7 1.6
Purchase of business (Note 4) (109.0) – –
Proceeds from assets held for sale – 6.2 5.9
Reclassification of cash equivalents to other assets (11.0) – –
Other 1.6 (0.9) (4.4)
Cash used in investing activities (133.5) (20.6) (23.4)
Cash from discontinued operations – – 6.5
Effect of exchange rates on cash (5.6) (0.4) –
(Decrease) increase in cash and cash equivalents (28.1) 162.8 46.5
Cash and cash equivalents, beginning of the year 209.9 47.1 0.6
Cash and cash equivalents, end of the year $ 181.8 $ 209.9 $ 47.1
The accompanying notes are an integral part of these consolidated financial statements.

1. Summary of Significant Accounting Policiesa) Basis of presentationThe consolidated financial statements include the accounts of Russel Metals Inc. and its subsidiary companies herein referred toas the Company. The reporting currency is Canadian dollars unless otherwise noted. All inter-company balances, transactions andprofits have been eliminated.
These consolidated financial statements have been prepared in accordance with Canadian generally accepted accounting principles.
b) Cash and cash equivalentsCash and cash equivalents includes demand deposits, bank term deposits, and investment grade short-term investments with amaturity of less than three months at time of purchase. At December 31, 2007, short-term investments were $26.4 million (2006: $132.7 million) and demand deposits were $139.9 million (2006: $67.4 million). Cash and cash equivalents are recordedat cost, which approximates market value.
c) InventoriesInventories are recorded at the lower of cost and net realizable value. Cost is determined on either an average cost basis or anactual cost basis depending on the business unit (Note 3).
d) Property, plant, equipment and depreciationProperty, plant, equipment and leasehold improvements are recorded at cost. Depreciation is provided on a straight-line basis atrates that charge the original cost of such assets to operations over their estimated useful lives. These are 20 to 40 years forbuildings, 5 to 10 years for machinery and equipment, 2 to 5 years for computer equipment, and over the lease term for leaseholdimprovements. Depreciation expense was $19.5 million in 2007 (2006: $18.4 million; 2005: $17.7 million).
e) Deferred financing charges and amortizationEligible costs incurred relating to bank financing are deferred and amortized on a straight-line basis over the period of the relatedfinancing. Deferred financing charges are recorded at cost less accumulated amortization. Amortization of deferred financingcharges was $0.8 million in 2007 (2006: $1.6 million; 2005: $1.5 million). Effective January 1, 2007, eligible costs related tolong-term debt financing are capitalized to the carrying amount of the associated debt and amortized using the effective interestmethod (Note 2). Prior to January 1, 2007, deferred charges related to long-term debt financing were recorded as deferred financing charges.
f) Goodwill and intangiblesGoodwill represents the excess purchase price paid on acquisitions over the value assigned to identifiable net assets acquired. The Company reviews goodwill for impairment annually and whenever facts and circumstances indicate that carrying amounts maynot be recoverable. As part of the evaluation, the estimated future undiscounted cash flows associated with the underlyingbusiness operation are compared to the carrying amount of goodwill to determine if a write-down is required. If such anassessment indicates that the undiscounted future cash flows will not be recovered, the carrying amount is reduced to theestimated fair value (Note 5).
Intangible assets are recorded at cost, which for business acquisitions represents the fair value at the date of acquisition, and arecomprised of customer lists. Customer lists are amortized on a straight-line basis over their estimated useful life, 15 years.Amortization of customer lists was $0.1 million for the year ended December 31, 2007.
g) Pensions and other benefit plansThe cost of pension benefits earned by employees covered under defined benefit plans is determined using the projected benefitmethod prorated on service and is charged to expense as services are rendered. Actuarial gains and losses and past service costsare amortized on a straight-line basis over the estimated average remaining service lives of the employee groups utilizing thecorridor approach. The corridor approach amortizes the excess of the net accumulated actuarial gain (loss) over 10% of the greaterof the benefit obligation and the fair value of plan assets. The cost of post-retirement benefits other than pensions is recognized onan accrual basis.
RUSSEL METALS 2007 ANNUAL REPORT 31
> notes to the consolidated financial statements
32 RUSSEL METALS 2007 ANNUAL REPORT
> notes to the consolidated financial statements cont’d
h) Income taxesThe Company uses the liability method of income tax allocation. Under this method, future tax assets and liabilities are determinedbased on differences between the financial accounting and tax bases of assets and liabilities and are measured using thesubstantively enacted tax rates and laws that will be in effect when the differences are expected to reverse. Future income taxassets are recognized to the extent that their realization is more likely than not.
i) Foreign currency translationThe accounts of self-sustaining foreign subsidiaries are translated from U.S. dollars to Canadian dollars at the noon spot rate ineffect at the balance sheet date, which was 0.9881 at December 31, 2007 (2006: 1.1653). Revenues and expenses aretranslated at the average rate of exchange during the year. For 2007, the U.S. dollar published average exchange rate was 1.0740(2006: 1.1343; 2005: 1.2114). The resulting gains or losses are included in other comprehensive loss (Note 2).
Exchange gains or losses on long-term debt denominated in foreign currencies not designated as a hedge are expensed asincurred. Exchange gains or losses on the translation of long-term debt denominated in a foreign currency designated as a hedge ofthe Company’s net investment in foreign subsidiaries are included in other comprehensive loss.
j) Revenue recognitionRevenue is recognized when persuasive evidence of an arrangement exists, delivery has occurred, selling price is fixed andcollection is reasonably assured. Revenue on certain sales within the energy tubular products segment, where the Company acts asan agent, is presented on a net basis. Freight and shipping billed to customers are included in revenue.
k) Stock-based compensationThe Company uses the fair value-based approach to account for stock-based compensation granted to employees subsequent toJanuary 1, 2003. Compensation expense is recognized for stock options over their vesting period based on their estimated fairvalues on the date of grant with the related credit charged to contributed surplus except for employees who are eligible to retireduring the vesting period. Fair value is determined by the Black-Scholes option-pricing model. Compensation expense is alsorecognized for deferred share units when issued and changes in the quoted market price from the issue date to the reportingperiod date are charged to compensation expense.
l) Earnings per shareBasic earnings per common share is calculated using the weighted daily average number of common shares outstanding. Theweighted average number of common shares for 2007 was 62,835,303 (2006: 59,887,382; 2005: 50,461,330). Diluted earningsper share is calculated using the treasury stock method.
m) Derivative financial instrumentsThe Company uses foreign exchange contracts to manage foreign exchange risk on certain committed cash outflows, primarilyinventory purchases. When the derivative instruments have been designated and are highly effective at offsetting risks, hedgeaccounting is applied. Hedge accounting requires that gains and losses on the hedge instrument are recognized through income inthe same period or manner as the item being hedged. Realized and unrealized foreign exchange gains and losses not designatedas a hedge are included in income. Derivatives are not entered into for speculative purposes and the use of derivative contracts isgoverned by documented risk management policies.
The Company formally documents all relationships between hedging instruments and hedged items, as well as its risk managementobjective and strategy for undertaking various hedge transactions. This process includes linking all derivatives to specific firmcommitments or forecasted transactions. The Company assesses, both at the inception of the hedge and on an ongoing basis, whetherthe derivatives that are used in hedging transactions are highly effective in offsetting changes in the cash flows of hedged items.
n) Use of estimatesThe preparation of consolidated financial statements in conformity with Canadian generally accepted accounting principles requiresmanagement to make estimates and assumptions that affect the reported assets and liabilities and disclosure of contingentassets and liabilities at the date of the financial statements and the reported amounts of revenue and expenses during thereporting periods. In particular, inventories, accounts receivable, estimated useful lives, asset retirement obligations, fair values,pension and benefit obligations, other contingencies, and assigned values on net assets acquired represent management’s bestestimates. Actual results could differ from these estimates.
2. Changes in Accounting Policiesa) On January 1, 2007, the Company adopted six new accounting standards: CICA Handbook section 1506, AccountingChanges; CICA Handbook section 1530, Comprehensive Income; CICA Handbook section 3855, Financial Instruments –Recognition and Measurement; CICA Handbook section 3861, Financial Instruments – Disclosure and Presentation; CICA Handbooksection 3865, Hedges; and CICA Handbook section 3251, Equity.
Certain of these new standards require the Company to classify all financial instruments resulting in certain financial instrumentsbeing valued at fair value on the balance sheet. As permitted, the Company chose January 1, 2003 as the transition date for thesearch for embedded derivatives. The impact of this change in accounting policy is presented as a transitional adjustment inopening retained earnings and opening accumulated other comprehensive income as appropriate. In compliance with thestandards, prior periods are not restated, except for the cumulative translation adjustment which has been reclassified toaccumulated other comprehensive income.
i) Comprehensive IncomeThis standard provides guidance on the presentation of comprehensive income, which is defined as the change in equityduring a period from transactions and other events from non-owner sources. Comprehensive income is comprised of netearnings and other comprehensive income (OCI). OCI includes certain gains and losses that are recognized outside of netearnings. The major components of the Company’s OCI are the cumulative translation adjustment and the effective portion of cash flow hedges including the fixed for fixed cross currency swaps which are designated as a cash flow hedge of aportion of our U.S. Senior Notes. Our consolidated financial statements include a new Statement of Comprehensive Income.The accumulated OCI, which includes the Company’s cumulative translation adjustment, is presented as a new category ofShareholders’ Equity in our Consolidated Balance Sheets and the Company has disclosed its components in theConsolidated Statements of Accumulated Other Comprehensive Loss.
ii) Financial InstrumentsThe recognition and measurement standard provides guidance for recognizing and measuring financial assets, financialliabilities and non-financial derivatives, which are classified as held-for-trading, available-for-sale, held-to-maturity, loans andreceivables or other liabilities. The Company’s held-for-trading assets include investments, bank accounts, forward exchangecontracts and embedded derivatives in inventory purchases. The Company currently does not have any assets classified asavailable-for-sale or held-to-maturity. Accounts receivable are classified under loans and receivables, and accounts payableand long-term debt are classified as other financial liabilities. Financial assets and financial liabilities classified as held-for-trading are measured at fair value with gains and losses recognized in net income. Financial assets classified as held-to-maturity, loans and receivables and financial liabilities not classified as held-for-sale are measured at amortized cost usingthe effective interest method.
Derivative instruments, including embedded derivatives, are recorded on the balance sheet at fair value as Other Assets,Other Accrued Liabilities or Derivatives. Changes in fair value are recognized in net income except for derivatives designatedas cash flow hedges, whose change in fair value is recognized in OCI. Fair values were determined using quoted marketvalues for similar instruments or other third party information.
Available-for-sale financial assets are measured at fair value. Unrealized gains and losses on available-for-sale financialassets and derivatives designated as cash flow hedges are recorded through OCI.
The standard provides an accounting policy choice on the treatment of transactions costs. The Company’s accounting policyis to capitalize transaction costs to the carrying amount of the associated debt and to amortize them to net interest expenseusing the effective interest method.
The disclosure and presentation standard provides guidance on the disclosure and presentation under the new financialinstruments standards.
RUSSEL METALS 2007 ANNUAL REPORT 33
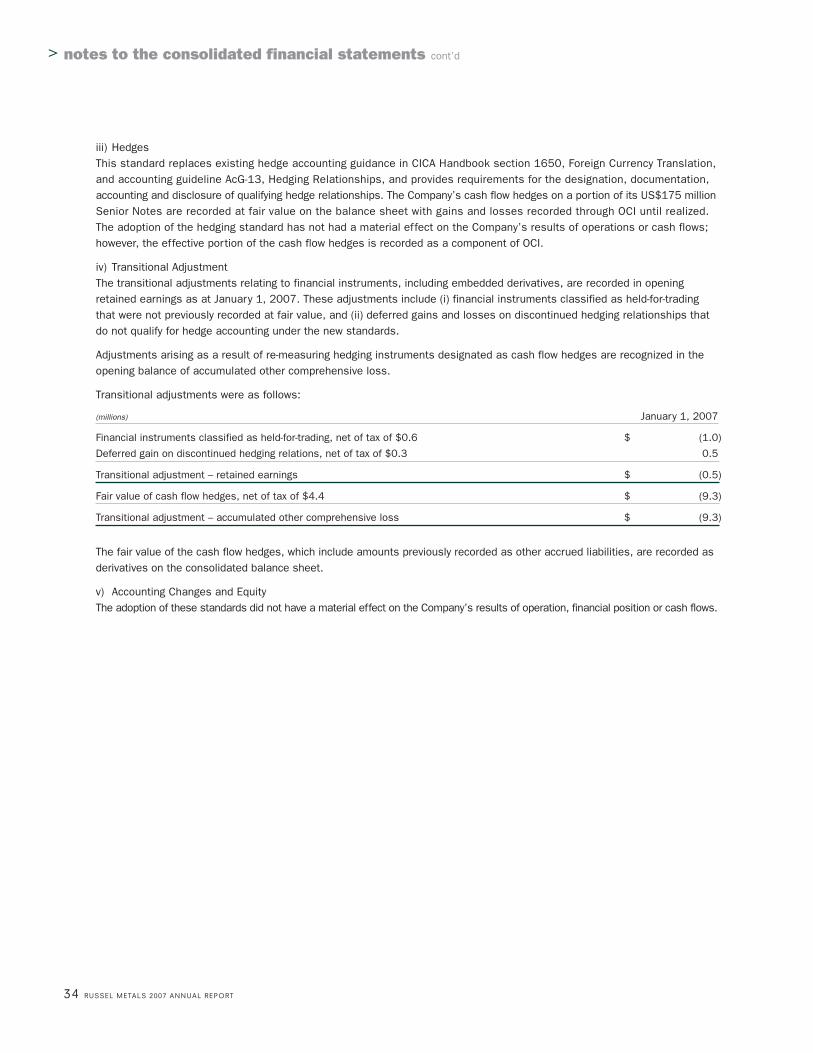
34 RUSSEL METALS 2007 ANNUAL REPORT
> notes to the consolidated financial statements cont’d
iii) HedgesThis standard replaces existing hedge accounting guidance in CICA Handbook section 1650, Foreign Currency Translation,and accounting guideline AcG-13, Hedging Relationships, and provides requirements for the designation, documentation,accounting and disclosure of qualifying hedge relationships. The Company’s cash flow hedges on a portion of its US$175 millionSenior Notes are recorded at fair value on the balance sheet with gains and losses recorded through OCI until realized. The adoption of the hedging standard has not had a material effect on the Company’s results of operations or cash flows;however, the effective portion of the cash flow hedges is recorded as a component of OCI.
iv) Transitional AdjustmentThe transitional adjustments relating to financial instruments, including embedded derivatives, are recorded in openingretained earnings as at January 1, 2007. These adjustments include (i) financial instruments classified as held-for-tradingthat were not previously recorded at fair value, and (ii) deferred gains and losses on discontinued hedging relationships thatdo not qualify for hedge accounting under the new standards.
Adjustments arising as a result of re-measuring hedging instruments designated as cash flow hedges are recognized in theopening balance of accumulated other comprehensive loss.
Transitional adjustments were as follows:
(millions) January 1, 2007
Financial instruments classified as held-for-trading, net of tax of $0.6 $ (1.0)
Deferred gain on discontinued hedging relations, net of tax of $0.3 0.5
Transitional adjustment – retained earnings $ (0.5)
Fair value of cash flow hedges, net of tax of $4.4 $ (9.3)
Transitional adjustment – accumulated other comprehensive loss $ (9.3)
The fair value of the cash flow hedges, which include amounts previously recorded as other accrued liabilities, are recorded asderivatives on the consolidated balance sheet.
v) Accounting Changes and EquityThe adoption of these standards did not have a material effect on the Company’s results of operation, financial position or cash flows.

b) On September 30, 2006, the Company adopted EIC-162, Stock-Based Compensation for Employees Eligible to Retire Beforethe Vesting Date. This standard requires that the compensation cost attributable to stock options be recognized over the period fromgrant date to the date the employee becomes eligible to retire. The impact of adopting this standard was an increase to the 2006compensation expense of $0.9 million. The standard requires retroactive restatement of prior periods and accordingly income wasreduced and contributed surplus was increased by $0.2 million for the year ended December 31, 2005.
c) On January 1, 2006, the Company adopted EIC-156, Accounting by a Vendor for Consideration Given to a Customer (including aReseller of the Vendor’s Products). This standard requires that the consideration given to a customer, such as rebates, be recordedas a reduction of revenues, not as cost of sales or as an operating expense. The standard requires retroactive restatement of priorperiods and, accordingly, revenues and cost of sales for the year ended December 31, 2005 were reduced by $1.2 million but had noimpact on net earnings.
3. Future Accounting ChangesIn June 2007, the CICA issued a new accounting standard: CICA Handbook section 3031, Inventories. This standard is effective forfiscal years beginning on or after January 1, 2008. The standard requires certain costs, previously recorded as period costs, beallocated to inventory and included in cost of sales when inventory is sold. Prior to the adoption of this standard, these costs weretreated as operating expenses. The Company is adopting this standard effective January 1, 2008. Prior periods will not be restated.The adoption of this standard is not expected to have a material effect on the Company’s results of operations or cash flows.
In addition, during 2007 the CICA issued section 3862, Financial Instruments – Disclosures and section 3863, Financial Instruments– Presentation, which provide enhanced disclosure and presentation requirements and replace section 3861, Financial Instruments –Disclosure and Presentation. The CICA also issued section 1535, Capital Disclosures, which provides guidance on disclosure of theentity’s objectives, policies and processes for managing capital. The Company does not expect that the adoption of these standardswill have a material impact on its consolidated financial statements.
RUSSEL METALS 2007 ANNUAL REPORT 35
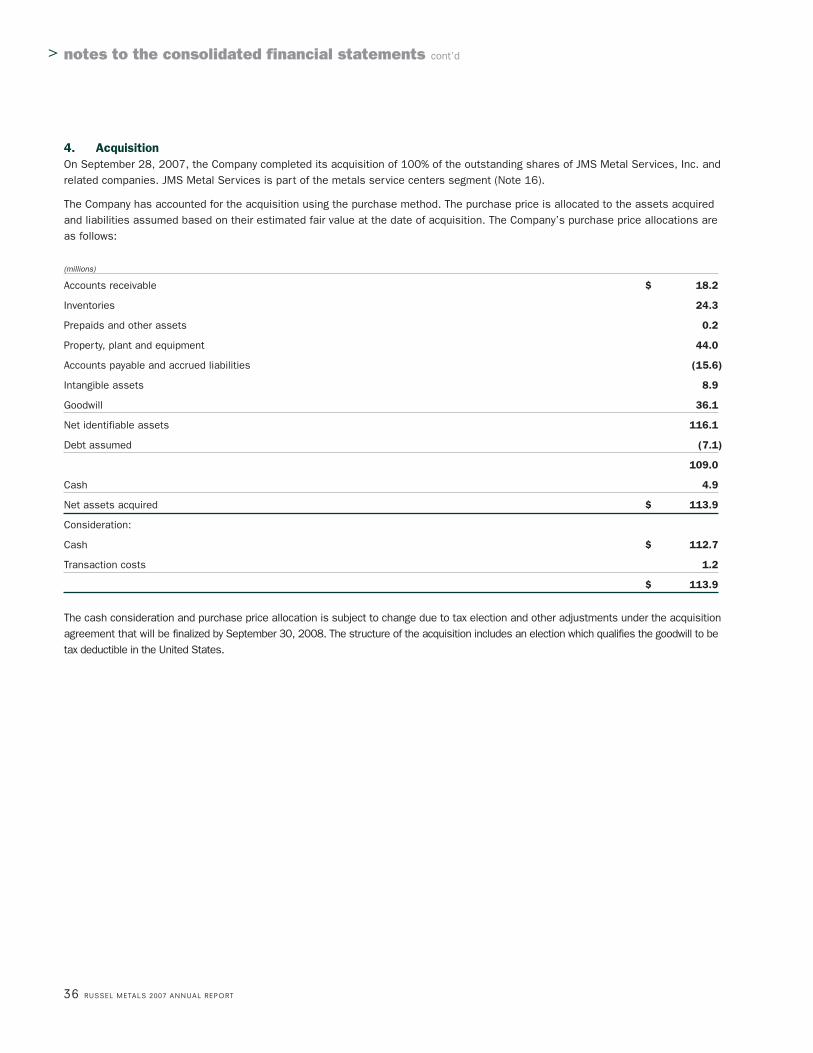
36 RUSSEL METALS 2007 ANNUAL REPORT
> notes to the consolidated financial statements cont’d
4. AcquisitionOn September 28, 2007, the Company completed its acquisition of 100% of the outstanding shares of JMS Metal Services, Inc. andrelated companies. JMS Metal Services is part of the metals service centers segment (Note 16).
The Company has accounted for the acquisition using the purchase method. The purchase price is allocated to the assets acquiredand liabilities assumed based on their estimated fair value at the date of acquisition. The Company’s purchase price allocations areas follows:
(millions)
Accounts receivable $ 18.2
Inventories 24.3
Prepaids and other assets 0.2
Property, plant and equipment 44.0
Accounts payable and accrued liabilities (15.6)
Intangible assets 8.9
Goodwill 36.1
Net identifiable assets 116.1
Debt assumed (7.1)
109.0
Cash 4.9
Net assets acquired $ 113.9
Consideration:
Cash $ 112.7
Transaction costs 1.2
$ 113.9
The cash consideration and purchase price allocation is subject to change due to tax election and other adjustments under the acquisitionagreement that will be finalized by September 30, 2008. The structure of the acquisition includes an election which qualifies the goodwill to betax deductible in the United States.
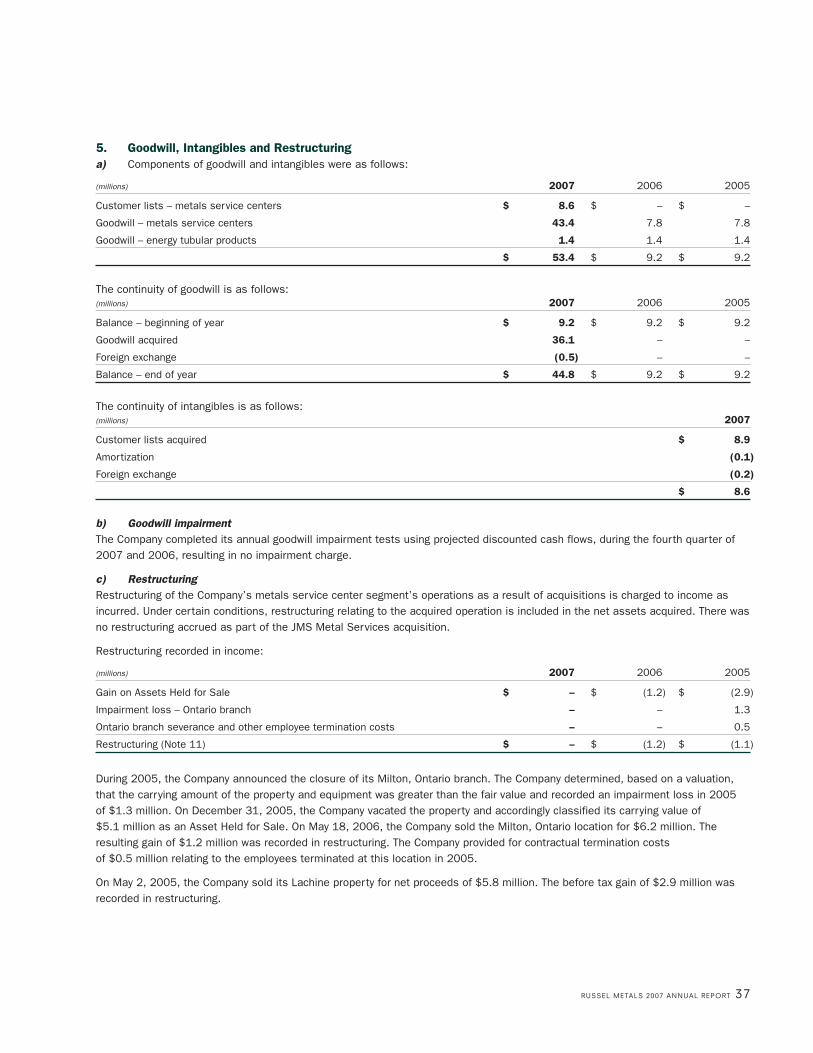
5. Goodwill, Intangibles and Restructuringa) Components of goodwill and intangibles were as follows:
(millions) 2007 2006 2005
Customer lists – metals service centers $ 8.6 $ – $ –
Goodwill – metals service centers 43.4 7.8 7.8
Goodwill – energy tubular products 1.4 1.4 1.4
$ 53.4 $ 9.2 $ 9.2
The continuity of goodwill is as follows:(millions) 2007 2006 2005
Balance – beginning of year $ 9.2 $ 9.2 $ 9.2
Goodwill acquired 36.1 – –
Foreign exchange (0.5) – –
Balance – end of year $ 44.8 $ 9.2 $ 9.2
The continuity of intangibles is as follows:(millions) 2007
Customer lists acquired $ 8.9
Amortization (0.1)
Foreign exchange (0.2)
$ 8.6
b) Goodwill impairmentThe Company completed its annual goodwill impairment tests using projected discounted cash flows, during the fourth quarter of2007 and 2006, resulting in no impairment charge.
c) RestructuringRestructuring of the Company’s metals service center segment’s operations as a result of acquisitions is charged to income asincurred. Under certain conditions, restructuring relating to the acquired operation is included in the net assets acquired. There wasno restructuring accrued as part of the JMS Metal Services acquisition.
Restructuring recorded in income:
(millions) 2007 2006 2005
Gain on Assets Held for Sale $ – $ (1.2) $ (2.9)
Impairment loss – Ontario branch – – 1.3
Ontario branch severance and other employee termination costs – – 0.5
Restructuring (Note 11) $ – $ (1.2) $ (1.1)
During 2005, the Company announced the closure of its Milton, Ontario branch. The Company determined, based on a valuation,that the carrying amount of the property and equipment was greater than the fair value and recorded an impairment loss in 2005 of $1.3 million. On December 31, 2005, the Company vacated the property and accordingly classified its carrying value of $5.1 million as an Asset Held for Sale. On May 18, 2006, the Company sold the Milton, Ontario location for $6.2 million. Theresulting gain of $1.2 million was recorded in restructuring. The Company provided for contractual termination costs of $0.5 million relating to the employees terminated at this location in 2005.
On May 2, 2005, the Company sold its Lachine property for net proceeds of $5.8 million. The before tax gain of $2.9 million wasrecorded in restructuring.
RUSSEL METALS 2007 ANNUAL REPORT 37
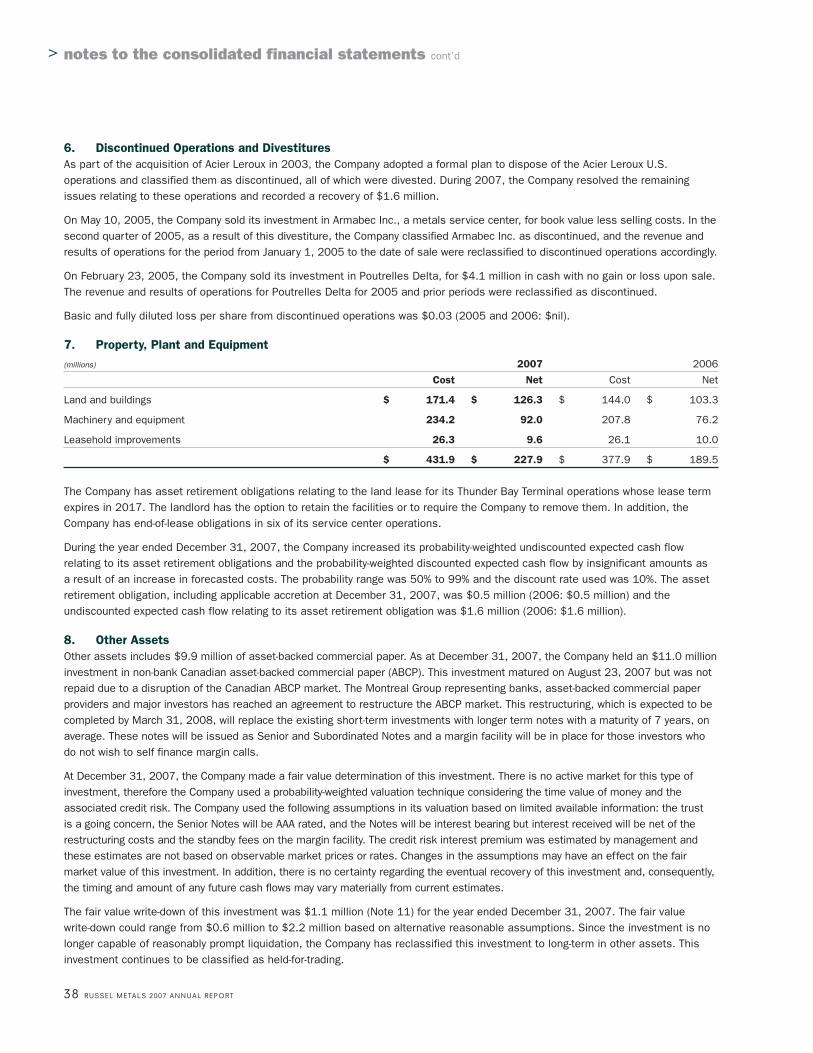
38 RUSSEL METALS 2007 ANNUAL REPORT
> notes to the consolidated financial statements cont’d
6. Discontinued Operations and DivestituresAs part of the acquisition of Acier Leroux in 2003, the Company adopted a formal plan to dispose of the Acier Leroux U.S.operations and classified them as discontinued, all of which were divested. During 2007, the Company resolved the remainingissues relating to these operations and recorded a recovery of $1.6 million.
On May 10, 2005, the Company sold its investment in Armabec Inc., a metals service center, for book value less selling costs. In thesecond quarter of 2005, as a result of this divestiture, the Company classified Armabec Inc. as discontinued, and the revenue andresults of operations for the period from January 1, 2005 to the date of sale were reclassified to discontinued operations accordingly.
On February 23, 2005, the Company sold its investment in Poutrelles Delta, for $4.1 million in cash with no gain or loss upon sale.The revenue and results of operations for Poutrelles Delta for 2005 and prior periods were reclassified as discontinued.
Basic and fully diluted loss per share from discontinued operations was $0.03 (2005 and 2006: $nil).
7. Property, Plant and Equipment(millions) 2007 2006
Cost Net Cost Net
Land and buildings $ 171.4 $ 126.3 $ 144.0 $ 103.3
Machinery and equipment 234.2 92.0 207.8 76.2
Leasehold improvements 26.3 9.6 26.1 10.0
$ 431.9 $ 227.9 $ 377.9 $ 189.5
The Company has asset retirement obligations relating to the land lease for its Thunder Bay Terminal operations whose lease termexpires in 2017. The landlord has the option to retain the facilities or to require the Company to remove them. In addition, theCompany has end-of-lease obligations in six of its service center operations.
During the year ended December 31, 2007, the Company increased its probability-weighted undiscounted expected cash flowrelating to its asset retirement obligations and the probability-weighted discounted expected cash flow by insignificant amounts as a result of an increase in forecasted costs. The probability range was 50% to 99% and the discount rate used was 10%. The assetretirement obligation, including applicable accretion at December 31, 2007, was $0.5 million (2006: $0.5 million) and theundiscounted expected cash flow relating to its asset retirement obligation was $1.6 million (2006: $1.6 million).
8. Other AssetsOther assets includes $9.9 million of asset-backed commercial paper. As at December 31, 2007, the Company held an $11.0 millioninvestment in non-bank Canadian asset-backed commercial paper (ABCP). This investment matured on August 23, 2007 but was notrepaid due to a disruption of the Canadian ABCP market. The Montreal Group representing banks, asset-backed commercial paperproviders and major investors has reached an agreement to restructure the ABCP market. This restructuring, which is expected to becompleted by March 31, 2008, will replace the existing short-term investments with longer term notes with a maturity of 7 years, onaverage. These notes will be issued as Senior and Subordinated Notes and a margin facility will be in place for those investors whodo not wish to self finance margin calls.
At December 31, 2007, the Company made a fair value determination of this investment. There is no active market for this type ofinvestment, therefore the Company used a probability-weighted valuation technique considering the time value of money and theassociated credit risk. The Company used the following assumptions in its valuation based on limited available information: the trust is a going concern, the Senior Notes will be AAA rated, and the Notes will be interest bearing but interest received will be net of therestructuring costs and the standby fees on the margin facility. The credit risk interest premium was estimated by management andthese estimates are not based on observable market prices or rates. Changes in the assumptions may have an effect on the fairmarket value of this investment. In addition, there is no certainty regarding the eventual recovery of this investment and, consequently,the timing and amount of any future cash flows may vary materially from current estimates.
The fair value write-down of this investment was $1.1 million (Note 11) for the year ended December 31, 2007. The fair value write-down could range from $0.6 million to $2.2 million based on alternative reasonable assumptions. Since the investment is nolonger capable of reasonably prompt liquidation, the Company has reclassified this investment to long-term in other assets. Thisinvestment continues to be classified as held-for-trading.
9. Revolving Credit FacilitiesOn December 27, 2007, the Company extended its credit facility for an additional period to January 15, 2011. This facility was originallyentered into with a syndicate of banks on October 29, 2004. This facility provides a line of credit to a maximum of $200 million, includingletters of credit. This three-year facility provides for annual extensions. Borrowings under this facility are restricted by certain financialcovenants which the Company was in compliance with at December 31, 2007. The obligations of the Company under this agreement aresecured by a pledge of trade accounts receivable and inventories of a significant portion of the Company’s operations. At December 31,2007 and 2006, the Company had no borrowings and letters of credit of $13.6 million and $54.8 million, respectively.
In addition, a U.S. subsidiary has its own credit facility. The maximum borrowing under this facility is US$50.0 million. At December 31,2007 and 2006, this subsidiary had no borrowings and letters of credit of US$14.6 million and US$36.1 million, respectively.
10. Long-Term DebtThe long-term debt was comprised of the following:
(millions) 2007 2006
6.375% US$175 million Senior Notes due March 1, 2014 $ 169.0 $ 203.9
Capital lease obligations – Arkansas development bonds 6.8 –
Less: current portion (0.9) –
$ 174.9 $ 203.9
On February 20, 2004, the Company issued US$175 million Senior Notes due March 1, 2014, bearing interest at 6.375%.
The Company entered into fixed for fixed cross currency swaps with major banks to manage the foreign currency exposure on US$100 million of the 6.375% Senior Notes. On the swaps, the Company receives U.S. denominated interest at 6.375% on a notional US$100 million and pays Canadian dollar interest at 7.12% on a notional $131.8 million. As part of the swaps, the Companyexchanged US$100 million for $131.8 million on February 20, 2004 and will receive US$100 million for $131.8 million on March 1, 2014.Both the swap counterparties and the Company have the right to early terminate the swaps in the first quarter of 2009. Effective January 1, 2007, the swaps are recorded at fair value on the balance sheet. The Company has designated the swaps as a cash flowhedge of its long-term debt. The effective portion of the change in fair value is recorded through other comprehensive income and theineffective portion is recorded through net income. The ineffective portion charged to income in 2007 was $0.9 million (Note 11).
The US$175 million Senior Notes are redeemable, in whole or in part, at the option of the Company on or after March 1, 2009 at103.188% of the principal amount declining rateably to 100% of the principal amount on or after March 1, 2012. In addition, theSenior Notes are also redeemable, in whole, at the option of the Company at any time at 100% of the principal amount in the eventof certain changes affecting Canadian withholding taxes. The Senior Notes contain certain restrictions on the payment of commonshare dividends in excess of $0.08 per share per quarter. Fees associated with the issue of the debt have been recorded asdeferred charges and, effective January 1, 2007, these costs are included in the carrying amount of the debt and amortized usingthe effective interest method. The Company was in compliance with all debt covenants at December 31, 2007.
On September 28, 2007, the Company assumed certain capital lease obligations as part of the JMS Metal Services acquisition.Obligations on these capital leases have maturities as follows: March 1, 2014: $2.2 million; May 1, 2014: $3.0 million andSeptember 1, 2017: $2.2 million.
Interest rates on these capital leases range from 2.4% to 5.4%. These leases require annual payments as follows: 2008: $1.3 million;2009: $1.3 million; 2010: $1.3 million; 2011: $1.3 million; 2012: $1.3 million; 2013 and beyond: $2.7 million.
11. Other Expense (Income)(millions) 2007 2006 2005
Unrealized loss on investment (Note 8) $ 1.1 $ – $ –
Ineffectiveness on cash flow hedges (Note 10) 0.9 – –
Change in fair value of financial instruments 0.5 – –
Restructuring (Note 5) – (1.2) (1.1)
$ 2.5 $ (1.2) $ (1.1)
RUSSEL METALS 2007 ANNUAL REPORT 39

40 RUSSEL METALS 2007 ANNUAL REPORT
> notes to the consolidated financial statements cont’d
12. Interest Expense(millions) 2007 2006 2005
Interest on long-term debt $ 15.3 $ 14.8 $ 15.2
Other interest expense 0.2 0.4 2.3
Interest income (8.4) (8.5) –
$ 7.1 $ 6.7 $ 17.5
Total interest paid by the Company in 2007 was $15.2 million (2006: $14.8 million; 2005: $17.7 million).
13. Income Taxes
a) The non-current future income tax balances consisted of:
(millions) 2007 2006
Future income tax assets
Pensions and benefits $ 0.8 $ 0.9
Other timing 0.2 0.2
Tax benefits of loss carryforwards – 0.2
Plant and equipment – 0.4
Gross future income tax assets 1.0 1.7
Valuation allowance – (1.3)
Total future income tax assets 1.0 0.4
Future income tax liabilities
Plant and equipment (8.2) (7.7)
Pensions and benefits (0.1) (0.1)
Other timing 1.7 (0.8)
Items charged to equity 0.8 1.8
Total future income tax liabilities (5.8) (6.8)
Net future income taxes $ (4.8) $ (6.4)
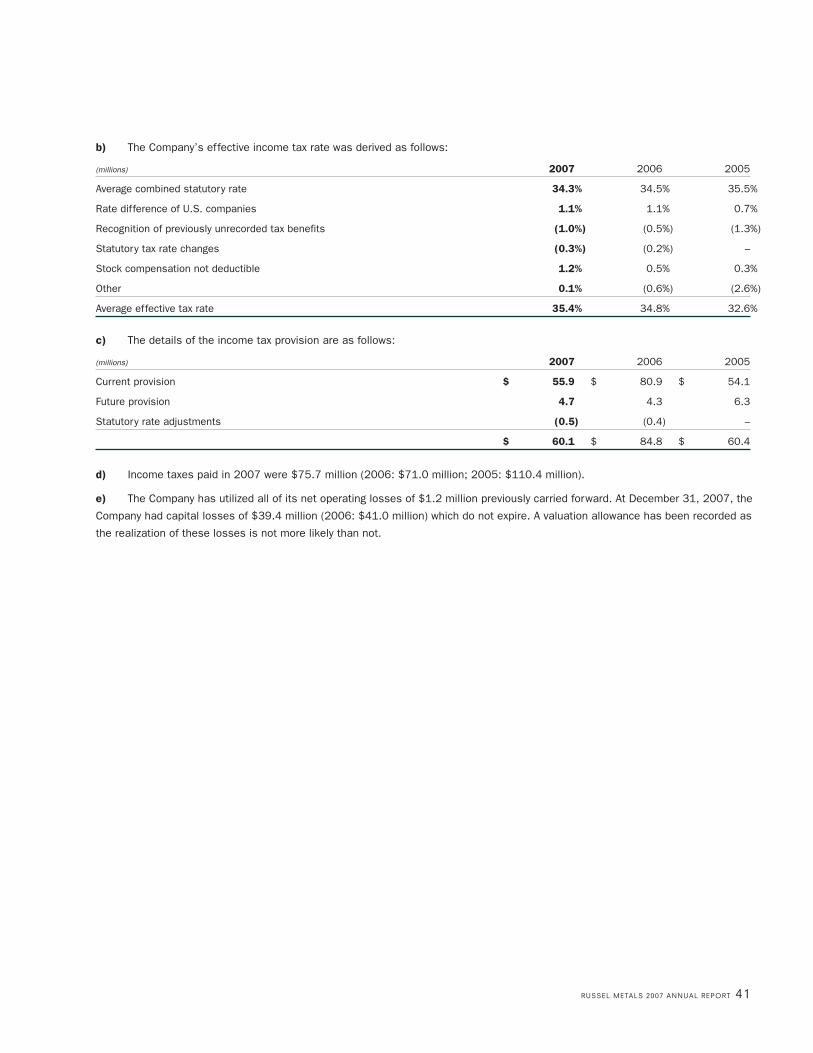
b) The Company’s effective income tax rate was derived as follows:
(millions) 2007 2006 2005
Average combined statutory rate 34.3% 34.5% 35.5%
Rate difference of U.S. companies 1.1% 1.1% 0.7%
Recognition of previously unrecorded tax benefits (1.0%) (0.5%) (1.3%)
Statutory tax rate changes (0.3%) (0.2%) –
Stock compensation not deductible 1.2% 0.5% 0.3%
Other 0.1% (0.6%) (2.6%)
Average effective tax rate 35.4% 34.8% 32.6%
c) The details of the income tax provision are as follows:
(millions) 2007 2006 2005
Current provision $ 55.9 $ 80.9 $ 54.1
Future provision 4.7 4.3 6.3
Statutory rate adjustments (0.5) (0.4) –
$ 60.1 $ 84.8 $ 60.4
d) Income taxes paid in 2007 were $75.7 million (2006: $71.0 million; 2005: $110.4 million).
e) The Company has utilized all of its net operating losses of $1.2 million previously carried forward. At December 31, 2007, the
Company had capital losses of $39.4 million (2006: $41.0 million) which do not expire. A valuation allowance has been recorded as
the realization of these losses is not more likely than not.
RUSSEL METALS 2007 ANNUAL REPORT 41
42 RUSSEL METALS 2007 ANNUAL REPORT
> notes to the consolidated financial statements cont’d
14. Shareholders’ Equitya) The components of shareholders’ equity are as follows:
(millions) 2007 2006
Common shares $ 504.2 $ 491.2
Retained earnings 411.7 411.1
Contributed surplus (related to stock-based compensation) 6.2 3.5
Accumulated other comprehensive loss (38.3) (11.2)
$ 883.8 $ 894.6
b) At December 31, 2007 and 2006, the authorized share capital of the Company consisted of:
(i) an unlimited number of common shares without nominal or par value;
(ii) an unlimited number of Class I preferred shares without nominal or par value, issuable in series; and
(iii) an unlimited number of Class II preferred shares without nominal or par value, issuable in series.
The directors have the authority to issue the Class I and Class II preferred shares in series and fix the designation, rights,privileges and conditions to be attached to each series, except that the Class I shares shall be entitled to preference over theClass II shares with respect to the payment of dividends and the distribution of assets in the event of liquidation, dissolution orwinding-up of the Company.
c) The number of common shares issued and outstanding at December 31 was as follows:
Number of AmountShares (millions)
Balance, December 31, 2005 50,656,009 $ 208.1
Common shares issued – public offering 11,000,000 275.3
Stock options exercised 710,833 7.8
Balance, December 31, 2006 62,366,842 491.2
Stock options exercised 699,250 13.0
Balance, December 31, 2007 63,066,092 $ 504.2
On March 16, 2006, the Company closed its public offering of 10,000,000 common shares at a price of $25.75 per share andreceived net proceeds of $246.7 million. The Company granted the underwriters an option to purchase up to an additional1,000,000 common shares on the same terms as the issue. These additional shares were issued on March 30, 2006 for netproceeds of $24.7 million. In addition to the underwriters fees, expenses of $0.5 million have also been netted from the proceeds ofthis offering and the tax benefits of $3.9 million associated with the share issue costs have been recorded in share capital.
d) The Company has a shareholder-approved share option plan, the purpose of which is to provide the employees of theCompany and its subsidiaries with the opportunity to participate in the growth and development of the Company. The number ofcommon shares that may be issued under the share option plan is 5% of the current issued and outstanding common shares. The options are exercisable on a cumulative basis to the extent of 20% per year of total options granted, except that under certainspecified conditions the options become exercisable immediately. The consideration paid by employees for purchase of commonshares is added to share capital.
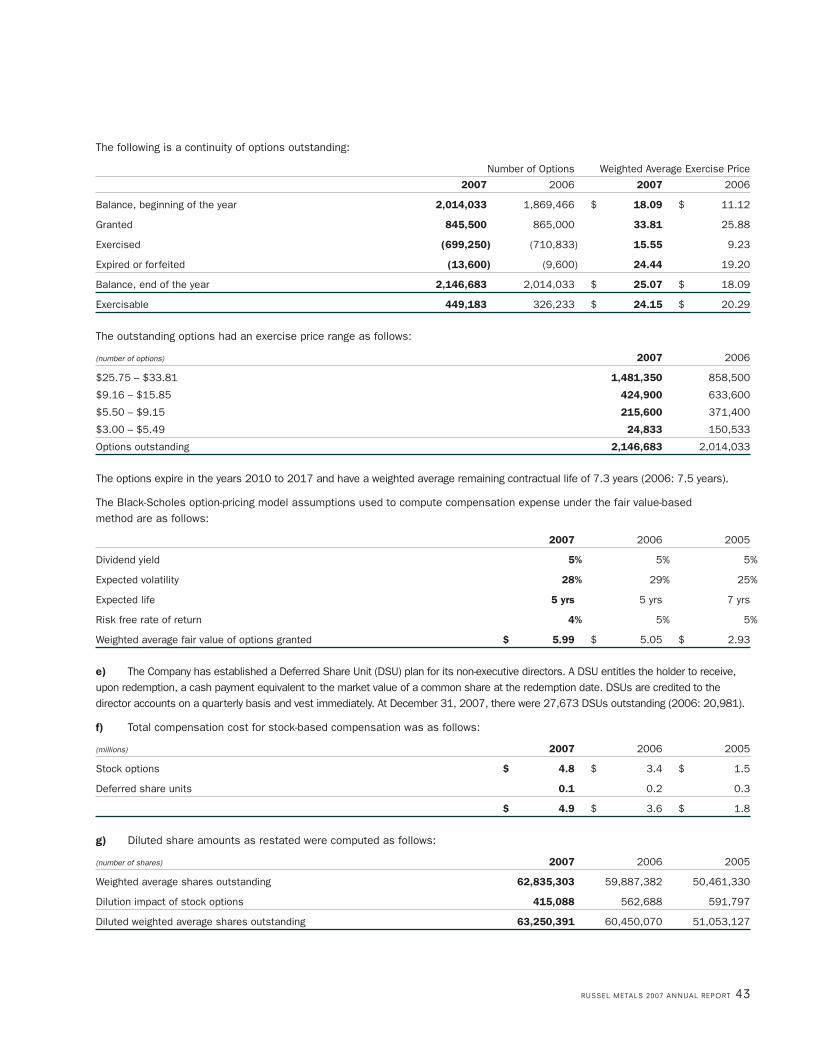
The following is a continuity of options outstanding:
Number of Options Weighted Average Exercise Price
2007 2006 2007 2006
Balance, beginning of the year 2,014,033 1,869,466 $ 18.09 $ 11.12
Granted 845,500 865,000 33.81 25.88
Exercised (699,250) (710,833) 15.55 9.23
Expired or forfeited (13,600) (9,600) 24.44 19.20
Balance, end of the year 2,146,683 2,014,033 $ 25.07 $ 18.09
Exercisable 449,183 326,233 $ 24.15 $ 20.29
The outstanding options had an exercise price range as follows:
(number of options) 2007 2006
$25.75 – $33.81 1,481,350 858,500
$9.16 – $15.85 424,900 633,600
$5.50 – $9.15 215,600 371,400
$3.00 – $5.49 24,833 150,533
Options outstanding 2,146,683 2,014,033
The options expire in the years 2010 to 2017 and have a weighted average remaining contractual life of 7.3 years (2006: 7.5 years).
The Black-Scholes option-pricing model assumptions used to compute compensation expense under the fair value-based method are as follows:
2007 2006 2005
Dividend yield 5% 5% 5%
Expected volatility 28% 29% 25%
Expected life 5 yrs 5 yrs 7 yrs
Risk free rate of return 4% 5% 5%
Weighted average fair value of options granted $ 5.99 $ 5.05 $ 2.93
e) The Company has established a Deferred Share Unit (DSU) plan for its non-executive directors. A DSU entitles the holder to receive,upon redemption, a cash payment equivalent to the market value of a common share at the redemption date. DSUs are credited to thedirector accounts on a quarterly basis and vest immediately. At December 31, 2007, there were 27,673 DSUs outstanding (2006: 20,981).
f) Total compensation cost for stock-based compensation was as follows:
(millions) 2007 2006 2005
Stock options $ 4.8 $ 3.4 $ 1.5
Deferred share units 0.1 0.2 0.3
$ 4.9 $ 3.6 $ 1.8
g) Diluted share amounts as restated were computed as follows:
(number of shares) 2007 2006 2005
Weighted average shares outstanding 62,835,303 59,887,382 50,461,330
Dilution impact of stock options 415,088 562,688 591,797
Diluted weighted average shares outstanding 63,250,391 60,450,070 51,053,127
RUSSEL METALS 2007 ANNUAL REPORT 43
44 RUSSEL METALS 2007 ANNUAL REPORT
> notes to the consolidated financial statements cont’d
15. Financial Instrumentsa) Fair valueThe Company records its debt at amortized cost using the effective interest method. The fair value of long-term debt as atDecember 31, 2007 and 2006 is estimated based on the last quoted trade price, where it exists, or on the current rates availableto the Company for similar debt of the same remaining maturities. The fair value of the Company’s Senior Notes at December 31,2007 was US$162.0 million (2006: US$166.9 million).
The fixed cross currency swaps (derivatives) qualify for hedge accounting because of high correlation and effectiveness between thehedging instrument and hedged item. The swaps are measured at market value at the balance sheet date, recorded on the balancesheet under the caption Derivatives, and the effective portion of the gains or losses on the derivatives are recorded in othercomprehensive income until maturity. The ineffectiveness is measured and recognized in the statement of earnings with an offsetto other comprehensive income. Prior to January 1, 2007 the difference between the foreign exchange rate on the swaps and theperiod end exchange rate was recorded under the caption Other Accrued Liabilities (2006: $15.4 million).
As at December 31, 2007 and 2006, the estimated fair value of other financial assets and liabilities approximates their carrying values.
b) Credit risk
The Company, in the normal course of business, is exposed to credit risk relating to accounts receivable from its customers. This
risk is mitigated by the fact that its customer base is geographically diverse and in different industries. The Company is also
exposed to credit risk from the potential default by any of its counterparties on its foreign exchange forward contracts and the fixed
for fixed cross currency swaps. The Company mitigates this risk by entering into forward contracts and swaps with members of its
credit facility syndicate.
c) Interest rate risk
The Company is not exposed to significant interest rate risk. The Company’s long-term debt is at fixed rates. The Company’s cash
and cash equivalents used to finance working capital, which is short-term in nature, are at floating interest rates.
d) Foreign exchange risk
The Company uses foreign exchange contracts with maturities of less than a year to manage foreign exchange risk on certain future
committed cash outflows. As at December 31, 2007, the Company had outstanding forward foreign exchange contracts in the
amounts of US$11.5 million and €3.5 million, maturing in the first half of 2008 (2006: US$16.5 million and € nil). The foreign
exchange gain on U.S. denominated financial assets and liabilities included in 2007 operating earnings from continuing operations
was $3.8 million (2006: $1.7 million; 2005: $1.6 million).
In order to mitigate its foreign exchange exposure, the Company has designated its swaps as a hedge of US$115 million of its long-
term debt. In addition, the Company has designated a portion of the Senior Notes not hedged by the swaps as a hedge of its net
investment in foreign subsidiaries.
16. Segmented InformationThe Company conducts business primarily in three metals business segments:
i) Metals service centersThe Company’s network of metals service centers provides processing and distribution services on a broad line ofmetal products in a wide range of sizes, shapes and specifications, including carbon hot rolled and cold finished steel,pipe and tubular products, stainless steel and aluminum. The Company services all major geographic regions ofCanada and certain regions in the Southeastern and Midwestern United States.
ii) Energy tubular productsThe Company’s energy tubular products operations distribute oil country tubular products, line pipe, tubes, valves andfittings, primarily to the energy sector in Western Canada and western United States.
iii) Steel distributorsThe Company’s steel distributors act as master distributors selling steel to customers in large volumes, mainly on an “as is” basis. The steel distributors source their steel domestically and off shore.
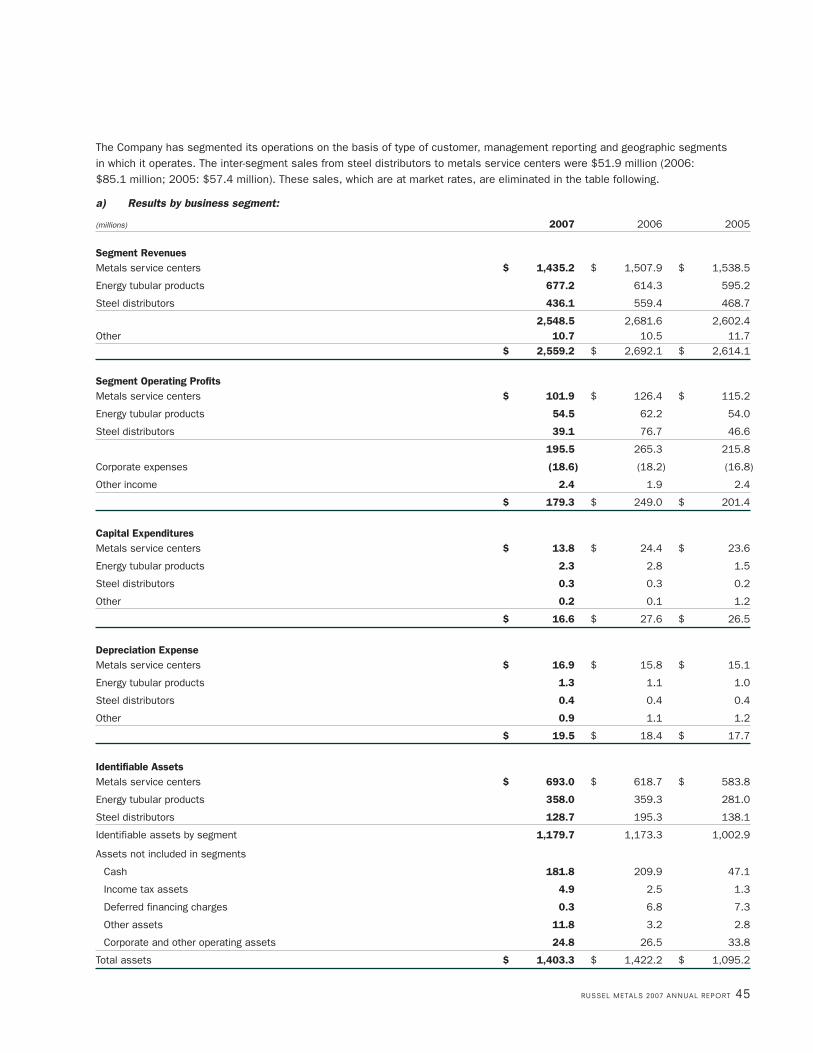
The Company has segmented its operations on the basis of type of customer, management reporting and geographic segments in which it operates. The inter-segment sales from steel distributors to metals service centers were $51.9 million (2006: $85.1 million; 2005: $57.4 million). These sales, which are at market rates, are eliminated in the table following.
a) Results by business segment:
(millions) 2007 2006 2005
Segment RevenuesMetals service centers $ 1,435.2 $ 1,507.9 $ 1,538.5
Energy tubular products 677.2 614.3 595.2
Steel distributors 436.1 559.4 468.7
2,548.5 2,681.6 2,602.4Other 10.7 10.5 11.7
$ 2,559.2 $ 2,692.1 $ 2,614.1
Segment Operating ProfitsMetals service centers $ 101.9 $ 126.4 $ 115.2
Energy tubular products 54.5 62.2 54.0
Steel distributors 39.1 76.7 46.6
195.5 265.3 215.8
Corporate expenses (18.6) (18.2) (16.8)
Other income 2.4 1.9 2.4
$ 179.3 $ 249.0 $ 201.4
Capital ExpendituresMetals service centers $ 13.8 $ 24.4 $ 23.6
Energy tubular products 2.3 2.8 1.5
Steel distributors 0.3 0.3 0.2
Other 0.2 0.1 1.2
$ 16.6 $ 27.6 $ 26.5
Depreciation ExpenseMetals service centers $ 16.9 $ 15.8 $ 15.1
Energy tubular products 1.3 1.1 1.0
Steel distributors 0.4 0.4 0.4
Other 0.9 1.1 1.2
$ 19.5 $ 18.4 $ 17.7
Identifiable AssetsMetals service centers $ 693.0 $ 618.7 $ 583.8
Energy tubular products 358.0 359.3 281.0
Steel distributors 128.7 195.3 138.1
Identifiable assets by segment 1,179.7 1,173.3 1,002.9
Assets not included in segments
Cash 181.8 209.9 47.1
Income tax assets 4.9 2.5 1.3
Deferred financing charges 0.3 6.8 7.3
Other assets 11.8 3.2 2.8
Corporate and other operating assets 24.8 26.5 33.8
Total assets $ 1,403.3 $ 1,422.2 $ 1,095.2
RUSSEL METALS 2007 ANNUAL REPORT 45

b) Results by geographic segment:
(millions) 2007 2006 2005
Segment Revenues
Canada $ 1,916.1 $ 1,999.8 $ 1,983.8
United States 632.4 681.8 618.6
$ 2,548.5 $ 2,681.6 $ 2,602.4
Segment Operating Profits
Canada $ 144.0 $ 190.8 $ 161.3
United States 51.5 74.5 54.5
$ 195.5 $ 265.3 $ 215.8
Identifiable Assets
Canada $ 856.2 $ 946.4 $ 839.4
United States 323.5 226.9 163.5
$ 1,179.7 $ 1,173.3 $ 1,002.9
17. Pensions and Benefitsa) The Company maintains defined benefit pension plans, post-retirement benefit plans and defined contribution pension plans inCanada and 401(k) defined contribution pension plans in the United States. Actuarial valuations are performed on defined benefitplans every three years or earlier if required. The most recent valuations for the Company’s defined benefit pension plans are as follows:
Number of Plans Valuation Date
1 January 1, 2005
1 January 1, 2006
1 December 31, 2006
5 January 1, 2007
All of the Company’s pension plans had a measurement date of December 31, 2007.
The components of the Company’s pension and benefit expense included the following:
(millions) 2007 2006 2005
Defined benefit pension plans
Benefits earned during the year $ 2.5 $ 2.3 $ 1.8
Interest cost on benefit obligation 4.6 4.4 4.5
Expected return on plan assets (5.5) (4.8) (4.2)
Valuation allowance adjustment 0.9 – –
Other 0.5 0.7 0.3
3.0 2.6 2.4
Post-retirement benefits 0.4 0.4 0.4
Defined contribution plans – contributions 0.8 0.6 0.8
4.2 3.6 3.6
Related to discontinued operations (0.2) (0.2) (0.3)
Pension and benefit expense $ 4.0 $ 3.4 $ 3.3
46 RUSSEL METALS 2007 ANNUAL REPORT
> notes to the consolidated financial statements cont’d
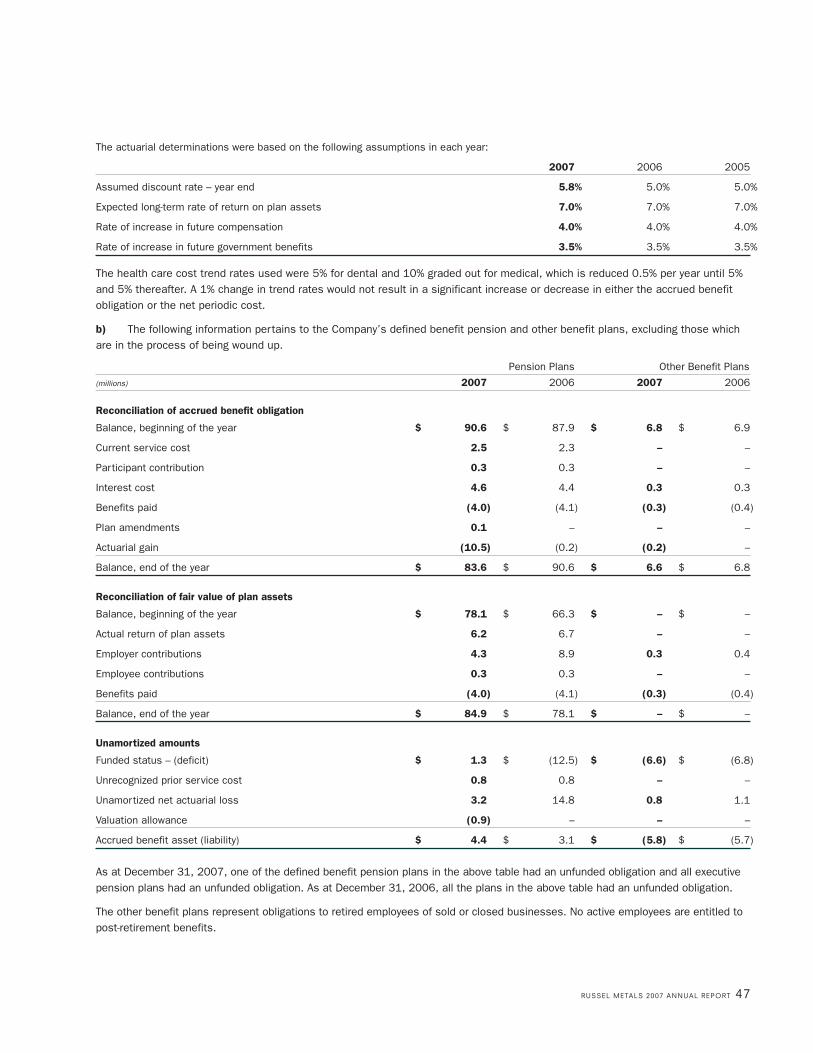
The actuarial determinations were based on the following assumptions in each year:
2007 2006 2005
Assumed discount rate – year end 5.8% 5.0% 5.0%
Expected long-term rate of return on plan assets 7.0% 7.0% 7.0%
Rate of increase in future compensation 4.0% 4.0% 4.0%
Rate of increase in future government benefits 3.5% 3.5% 3.5%
The health care cost trend rates used were 5% for dental and 10% graded out for medical, which is reduced 0.5% per year until 5%and 5% thereafter. A 1% change in trend rates would not result in a significant increase or decrease in either the accrued benefitobligation or the net periodic cost.
b) The following information pertains to the Company’s defined benefit pension and other benefit plans, excluding those whichare in the process of being wound up.
Pension Plans Other Benefit Plans
(millions) 2007 2006 2007 2006
Reconciliation of accrued benefit obligation
Balance, beginning of the year $ 90.6 $ 87.9 $ 6.8 $ 6.9
Current service cost 2.5 2.3 – –
Participant contribution 0.3 0.3 – –
Interest cost 4.6 4.4 0.3 0.3
Benefits paid (4.0) (4.1) (0.3) (0.4)
Plan amendments 0.1 – – –
Actuarial gain (10.5) (0.2) (0.2) –
Balance, end of the year $ 83.6 $ 90.6 $ 6.6 $ 6.8
Reconciliation of fair value of plan assets
Balance, beginning of the year $ 78.1 $ 66.3 $ – $ –
Actual return of plan assets 6.2 6.7 – –
Employer contributions 4.3 8.9 0.3 0.4
Employee contributions 0.3 0.3 – –
Benefits paid (4.0) (4.1) (0.3) (0.4)
Balance, end of the year $ 84.9 $ 78.1 $ – $ –
Unamortized amounts
Funded status – (deficit) $ 1.3 $ (12.5) $ (6.6) $ (6.8)
Unrecognized prior service cost 0.8 0.8 – –
Unamortized net actuarial loss 3.2 14.8 0.8 1.1
Valuation allowance (0.9) – – –
Accrued benefit asset (liability) $ 4.4 $ 3.1 $ (5.8) $ (5.7)
As at December 31, 2007, one of the defined benefit pension plans in the above table had an unfunded obligation and all executivepension plans had an unfunded obligation. As at December 31, 2006, all the plans in the above table had an unfunded obligation.
The other benefit plans represent obligations to retired employees of sold or closed businesses. No active employees are entitled topost-retirement benefits.
RUSSEL METALS 2007 ANNUAL REPORT 47
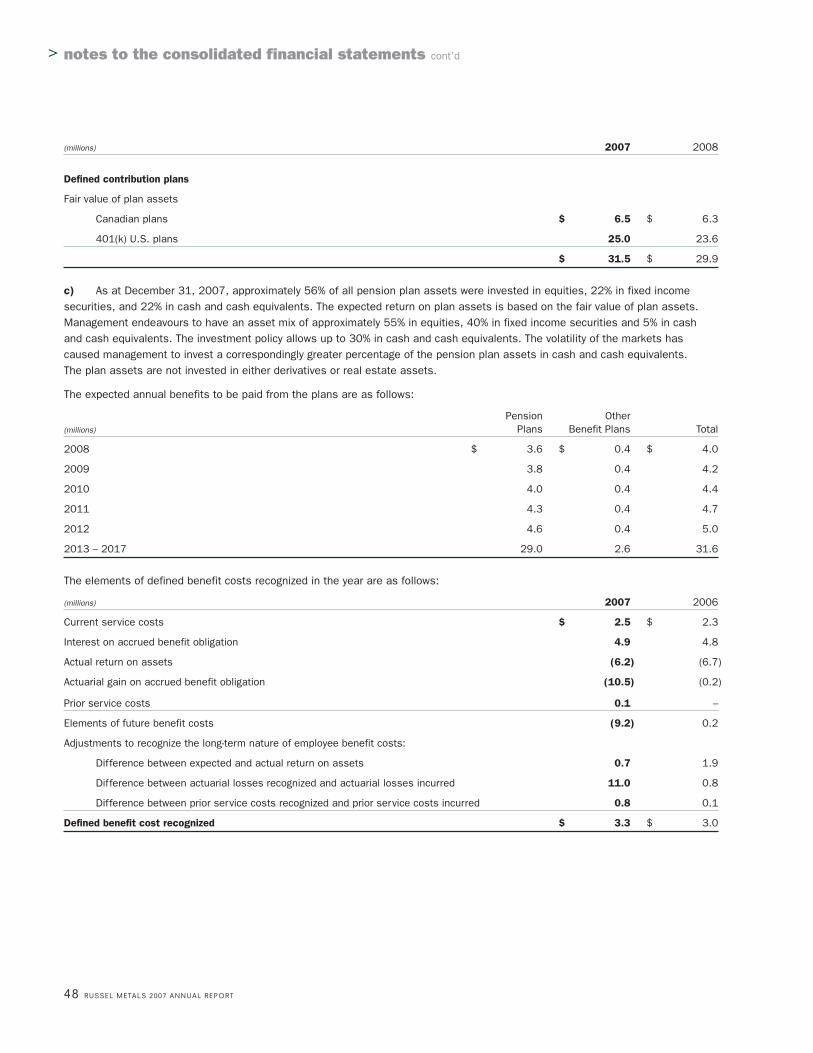
48 RUSSEL METALS 2007 ANNUAL REPORT
(millions) 2007 2008
Defined contribution plans
Fair value of plan assets
Canadian plans $ 6.5 $ 6.3
401(k) U.S. plans 25.0 23.6
$ 31.5 $ 29.9
c) As at December 31, 2007, approximately 56% of all pension plan assets were invested in equities, 22% in fixed incomesecurities, and 22% in cash and cash equivalents. The expected return on plan assets is based on the fair value of plan assets.Management endeavours to have an asset mix of approximately 55% in equities, 40% in fixed income securities and 5% in cashand cash equivalents. The investment policy allows up to 30% in cash and cash equivalents. The volatility of the markets hascaused management to invest a correspondingly greater percentage of the pension plan assets in cash and cash equivalents. The plan assets are not invested in either derivatives or real estate assets.
The expected annual benefits to be paid from the plans are as follows:
Pension Other (millions) Plans Benefit Plans Total
2008 $ 3.6 $ 0.4 $ 4.0
2009 3.8 0.4 4.2
2010 4.0 0.4 4.4
2011 4.3 0.4 4.7
2012 4.6 0.4 5.0
2013 – 2017 29.0 2.6 31.6
The elements of defined benefit costs recognized in the year are as follows:
(millions) 2007 2006
Current service costs $ 2.5 $ 2.3
Interest on accrued benefit obligation 4.9 4.8
Actual return on assets (6.2) (6.7)
Actuarial gain on accrued benefit obligation (10.5) (0.2)
Prior service costs 0.1 –
Elements of future benefit costs (9.2) 0.2
Adjustments to recognize the long-term nature of employee benefit costs:
Difference between expected and actual return on assets 0.7 1.9
Difference between actuarial losses recognized and actuarial losses incurred 11.0 0.8
Difference between prior service costs recognized and prior service costs incurred 0.8 0.1
Defined benefit cost recognized $ 3.3 $ 3.0
> notes to the consolidated financial statements cont’d
RUSSEL METALS 2007 ANNUAL REPORT 49
18. Contingencies, Guarantees and Commitmentsa) The Company and certain of its subsidiaries have been named defendants in a number of legal actions. Although theoutcome of these claims cannot be determined, management intends to defend all claims and has recorded provisions based onits best estimate of the potential losses. In the opinion of management the resolution of these matters is not expected to have amaterially adverse effect on the Company’s financial position, cash flows or operations.
b) The Company and its subsidiary companies have operating lease commitments, with varying terms, requiring approximateannual payments as follows: 2008: $11.2 million; 2009: $10.4 million; 2010: $9.5 million; 2011: $7.5 million; 2012: $6.1 million, 2013 and beyond: $9.8 million. Rental expense on operating leases was as follows: 2007: $12.4 million; 2006:$11.8 million and 2005: $11.1 million.
c) The Company is incurring site cleanup and restoration costs related to properties not utilized in current operations. Remedial actions are currently underway at three sites. The estimated costs of these cleanups have been provided for based onmanagement’s best estimates. Additional costs may be incurred at these or other sites as site cleanup and restoration progress,but the amounts cannot be quantified at this time.
d) The Company has also entered into other agreements that provide indemnifications to counterparties in certain transactionsincluding underwriting agreements. These indemnifications generally require the Company to indemnify the counterparties for costsincurred as a result of losses from litigation that may be suffered by counterparties arising from those transactions. The Companydoes not expect to make any payments on these indemnifications and, accordingly, no liability has been accrued.
19. Subsequent EventOn February 18, 2008, the Company approved a normal course issuer bid. The bid allows the purchase on the open market of upto 6,000,000 common shares over the next twelve months. All purchases will be made in compliance with the by-laws, rules andpolicies of the Toronto Stock Exchange.
50 RUSSEL METALS 2007 ANNUAL REPORT
> canadian metals service centers directory
Operating under the name Russel Metals, unless otherwise noted.
CANADABRITISH COLUMBIAOperating under the nameA.J. Forsyth throughout BC
Delta (Vancouver) – Regional Office830 Carlisle Road, V3M 5P4Tel: (604) 525-0544
Campbell River2710 Vigar Road, V9W 6A3Tel: (250) 287-8841
Fort Nelson4850 44th Avenue, V0C 1R0Tel: (250) 774-7553
Fort St. John10019 Finning Frt.,Mile 49 1/2 Alaska Highway,V1J 4M6Tel: (250) 785-5641
Kelowna8955 Grigg Road, V4V 2N5Tel: (250) 766-6050
Kitimat815 Enterprise Avenue, V8C 2P1Tel: (250) 632-4702
Nanaimo1950 East Wellington Road, V9S 5V2Tel: (250) 753-1555
Prince George1154 Pacific Street, V2N 5S3 Tel: (250) 563-1274
990 Industrial Way, V2N 5S1Tel: (250) 563-1274
ALBERTACalgary5724 40th Street SE, T2C 2A1Tel: (403) 279-6600
Edmonton7016 99th Street NW, T6E 3R3Tel: (780) 439-2051
5730 72A Avenue NW, T6B 3L1(Specializing in plate processing)Tel: (780) 439-2051
2471 76th Avenue NW, T6P 1P6(Specializing in non-ferrous sales)Tel: (780) 440-0779
Grande Prairie11035 89th Avenue, T8V 5B9Tel: (780) 539-3193
Red Deer6724 Golden West Avenue, T4P 1A8Tel: (403) 346-2096
SASKATCHEWANRegina445 1st Avenue E, S4N 4Z3Tel: (306) 721-6411
Russel Metals Specialty Products475 1st Avenue E, S4N 4Z3Tel: (306) 721-9355
Saskatoon922 51st Street E, S7K 5C7Tel: (306) 931-3338
Russel Metals Specialty Products3319 Wells Avenue, S7K 5W6Tel: (306) 931-2257
MANITOBAWinnipeg1359 St. James Street, R3H 0K9Tel: (204) 772-0321
1510 Clarence Avenue, R3T 1T6Tel: (204) 475-8584
Russel Metals Specialty Products75 Terracon Place, R2J 4B3Tel: (204) 772-0321
ONTARIOMississauga (Toronto) – Regional Office1900 Minnesota Court,Suite 210, L5N 3C9(Ontario General Line Sales)Tel: (905) 819-7777
Aberfoyle (Guelph)24 Nicholas Beaver Road, RR#3, N1H 6H9(Specializing in plate processing)Tel: (519) 767-3800
BurlingtonMilspec Industries5036 South Service Road, L7L 5Y7(Specializing in strapping)Tel: (905) 333-0646
Cambridge15 Cherry Blossom Road, N3H 4R7Tel: (519) 650-1666
Hamilton175 Shaw Street, L8N 3S2(Specializing in non-ferrous sales)Tel: (905) 522-5930(Specializing in chain)Tel: (905) 522-1130
Kingston191 Dalton Avenue, K7K 6C2Tel: (613) 546-1281
London685 Hale Street, N5W 1J1Tel: (519) 451-1140
Oldcastle (Windsor)4051 Del Duca Drive, N0R 1L0Tel: (519) 737-1549
Ottawa2420 Stevenage Drive, K1G 3W3Tel: (613) 738-2961
Port RobinsonYork – Ennis200 South Street North, L0S 1K0Tel: (905) 384-9700
Stoney Creek (Hamilton)B&T Steel1052 South Service Road, L8E 6G3(Specializing in flat rolled)Tel: (905) 643-3008
McCabe Steel687 Arvin Avenue, L8E 5R2Tel: (905) 643-4271
Thunder Bay620 Norah Crescent, P7C 5V8Tel: (807) 622-8898
QUEBECBoucherville – Regional OfficeAcier Leroux1331, rue Graham-Bell, J4B 6A1Tel: (450) 641-2280
Métaux Russel Produits Spécialisés1330, rue Graham-Bell, J4B 6H5Tel: (450) 641-1130
Acier Richler1330, rue Graham-Bell, J4B 6H5Tel: (450) 449-5112
AmosAcier Leroux1675, route de l’Aéroport, J9T 3A8Tel: (819) 732-8381
Baie-ComeauAcier Leroux55, avenue William-Dobell, G4Z 1T8Tel: (418) 296-8626
ChicoutimiAcier Leroux2149, rue de la Fonderie, G7H 8C1Tel: (418) 545-8881
JonquièreMétaux Russel2420, rue Bauman, G7S 4S4Tel: (418) 548-3103
QuebecAcier Loubier5225, rue John Molson, G1X 3X4Tel: (418) 656-9911
RimouskiAcier Leroux221, rue des Négociants, G5M 1B7Tel: (418) 724-4937
Saint-Augustin-de-DesmauresAcier Leroux167, rue de Rotterdam, G3A 2K2Tel: (418) 878-5737
Sept-ÎlesAcier Leroux533, boulevard Laure Est, G4R 4K2Tel: (418) 962-6374
TerrebonneAcier Leroux1025, boulevard des Entreprises,J6Y 1V2(Specializing in structurals)Tel: (514) 333-5380
Thetford MinesMégantic Métal1400, boulevard Frontenac Est, G6G 5R9Tel: (418) 338-3188
NEW BRUNSWICKEdmundston25, rue Richards, Parc Industriel Nord,E3V 4H4Tel: (506) 739-9561
Sackville141 Crescent Street, E4L 3V2Tel: (506) 364-1234
Saint John37 McIlveen Drive,McAllister Industrial Park, E2L 4B3Tel: (506) 635-0005
NOVA SCOTIAHalifax – Regional Office28 Lakeside Park Drive, B3T 1A3Tel: (902) 876-7861
NEWFOUNDLANDSt. John’s (Mount Pearl)11 Panther Place,Donovans Industrial Estates,A1N 5B7Tel: (709) 364-3300

RUSSEL METALS 2007 ANNUAL REPORT 51
UNITED STATESOperating under the nameRussel Metals Williams Bahcallthroughout Wisconsin
WISCONSINAppleton975 North Meade Street, 54912 – 1054Tel: (920) 734-9271
Green Bay895 Hinkle Street, 54303Tel: (920) 497-1020
Milwaukee999 West Armour Avenue, 53221Tel: (414) 481-7100
OHIOSolon (Cleveland),Baldwin International30403 Bruce Industrial Parkway,44139Tel: (440) 248-9500
Operating under the nameJMS Russel Metals
ARKANSASBlytheville5027 N. County Road 1015, 72315(Specializing in processing)Tel: (870) 762-9956
Hope3716 Highway 32 North, 71801Tel: (870) 972-5802
Jonesboro2801 Commerce Drive, 72402Tel: (870) 972-5802
KENTUCKYPaducah1455 Bloom Avenue, 42001Tel: (270) 575-0308
TENNESSEEJackson – Regional Office620 Old Hickory Blvd., Suite 400, 38305Tel: (731) 984-8122
1320 E. Chester, 38301Tel: (731) 423-3297
1061 James Buchanan Drive, 38301(Specializing in plate processing)Tel: (731) 424-6359
ALABAMADecatur1312 Commerce Drive N.W., 35601Tel: (256) 308-0580
GEORGIATrenton199 South Industrial Blvd., 30752Tel: (706) 657-5484
CANADAWirth SteelBurnaby, British Columbia4603 Kingsway, Suite 308, V5H 4M4Tel: (604) 436-1741
Toronto, Ontario2 Bloor Street W.,Suite 700, M4W 3R1Tel: (416) 961-7311
Montreal, Quebec1 Westmount Square Suite 200, H3Z 2P9Tel: (514) 939-5555
UNITED STATESSunbelt Group L.P.Houston, Texas1990 Post Oak Boulevard, Suite 950, 77056-3817Tel: (713) 840-0550
Overland Park, Kansas7300 W. 110th Street Suite 660, 66210Tel: (913) 491-6660
Arrow Steel ProcessorsHouston, Texas8710 Clinton Drive, 77029Tel: (713) 673-0666
CANADAThunder Bay TerminalsThunder Bay, Ontario P.O. Box 1800, Station F, McKellar Island, P7C 5J7Tel: (807) 625-7800
> united states metals service centers directory
CANADAComco Pipe and Supply CompanyEdmonton, Alberta5910 17th Street NW, T6P 1S5Tel: (780) 440-2000
Calgary, Alberta9307 48th Street SE, T2C 2R1Tel: (403) 203-0766
Fort McMurray, Alberta300 MacDonald Crescent, T9H 4B6Tel: (780) 743-3404
Stonewall, Manitoba116 4th Street E, R0C 2Z0Tel: (204) 467-8797
Guelph, OntarioKerr Industrial Park (Aberfoyle), N1H 6H9Tel: (519) 763-1114
Sarnia, Ontario1018 Prescot Drive, N7T 7H3Tel: (519) 332-6666
Dollard des Ormeaux, Quebec65 boulevard Brunswick,Suite 106, H9B 2N4Tel: (514) 421-2455
Fedmet TubularsCalgary, Alberta700 9th Avenue SW,Suite 2200, T2P 3V4Tel: (403) 237-0955
Triumph Tubular & SupplyCalgary, Alberta441 5th Avenue SW,Suite 875, T2P 2V1Tel: (403) 262-3777
UNITED STATESPioneer PipeWoodland, Washington1780 Down River Drive, 98674Tel: (360) 225-3101
Orange, California2430-A N. Glassell Street, 92865Tel: (714) 998-9938
Lindon, Utah (Provo)1610 West 200 South, 84042Tel: (801) 224-8739
Aurora, Colorado2401 Picadilly Road, 80019Tel: (303) 307-9021
Denver, Colorado1660 Lincoln Street, Suite 2300, 80264Tel: (303) 289-3201
Houston, Texas2203 Timberloch Place, The Woodlands, Suite 125-1,77380Tel: (281) 292-2875
Spartan Steel ProductsEvergreen, Colorado2942 Evergreen Parkway, Suite 300, 80439Tel: (303) 670-9048
Idyllwild, CaliforniaP.O. Box 3496, 92549Tel: (951) 659-5868
Pittsburg, TexasP.O. Box 10, 75686Tel: (903) 856-1800
> energy tubular products directory
> steel distributors directory > other

52 RUSSEL METALS 2007 ANNUAL REPORT
> definitions
Book value per share
Equity value divided by ending shares outstanding.
Debt as % of capitalization
Total net interest bearing debt excluding cash on
hand divided by common shareholders’ equity plus
interest bearing debt excluding cash on hand.
Dividend per share
The December 15th quarterly dividend annualized.
Dividend yield
The dividend per share divided by the year end
common share price.
EBIT
Earnings from continuing operations before
deduction of interest and income taxes.
EBITDA
Earnings from continuing operations before
deduction of interest, income taxes, depreciation
and amortization.
Earnings multiple
Period ending common share price divided by basic
earnings per common share.
Free cash flow
Cash from operating activities before change in
working capital less capital expenditures plus
proceeds on sale of assets.
Interest bearing debt to EBITDA
Total interest bearing debt excluding cash on hand
divided by EBITDA.
Market capitalization
Outstanding common shares times market price
of a common share at December 31.
Return on capital employed
EBIT over net assets employed.

RUSSEL METALS is one of
the largest metals distribution
companies in North America.
We conduct business primarily
in three metals distribution
segments: metals service
centers; energy tubular products;
and steel distributors.
METAL SERVICES CENTERSWe provide processing and distribution services to a broad base ofmore than 27,000 end users through a network of 53 Canadian and12 U.S. locations. Our metals service centers carry a broad line ofproducts in a wide range of sizes, shapes and specifications,including carbon hot rolled and cold finished steel, pipe and tubularproducts, stainless steel and aluminum. We purchase theseproducts primarily from steel producers in North America andprocess and package them in accordance with end userspecifications. We service all major geographic regions of Canadaand the Southeastern and Midwestern regions in the United States.
ENERGY TUBULAR PRODUCTSThese operations distribute oil country tubular goods (OCTG), linepipe, tubes, valves and fittings, primarily to the energy industry inWestern Canada and the western United States, from 5 Canadianand 2 U.S. locations. We purchase these products either from thepipe processing arms of North American steel mills, independentmanufacturers of pipe and pipe accessories or international steel mills.
STEEL DISTRIBUTORSOur steel distributors act as master distributors selling steel in large volumes to other steel ser vice centers and equipmentmanufacturers mainly on an “as is” basis. Our U.S. operationprocesses some coil for its customer base at its cut-to-length facilityin Houston, Texas. Our steel distributors source their steel bothdomestically and off shore. The main steel products sourced by thissegment are structural beam, plate, coils, pipe and tubing.
Board of Directors
Alain BenedettiCorporate Director
Alice D. LabergeCorporate Director
James F. DinningChairman of the BoardWestern Financial Group Inc.
Lise LachapelleCorporate Director
Carl R. FioraCorporate Director,steel industry executive
John W. RobinsonCorporate Director,steel industry executive
Anthony F. GriffithsCorporate Director,Chairman of the BoardRussel Metals Inc.
Edward M. Siegel, Jr.President and Chief ExecutiveOfficer, Russel Metals Inc.
Officers
Anthony F. GriffithsChairman of the BoardToronto
Lesley M.S. ColemanVice President, Controller andAssistant SecretaryMississauga
Edward M. Siegel, Jr.President and Chief Executive OfficerMississauga
William M. O’ReillySecretaryDavies Ward Phillips & Vineberg LLPToronto
Brian R. HedgesExecutive Vice President andChief Operating OfficerMississauga
Elaine G. ToomeyAssistant SecretaryMississauga
Marion E. BrittonVice President and Chief Financial OfficerMississauga
Shareholder InformationStock Symbol: The Toronto Stock Exchange – RUS
Transfer Agent and RegistrarCIBC Mellon Trust Company P.O. Box 7010, Adelaide Street Postal Stn., Toronto, Ontario, Canada M5C 2W9Answer line: Toronto (416) 643-5500Toll Free: 1-800-387-0825E-mail: [email protected] Internet: www.cibcmellon.ca
Head Office1900 Minnesota Court, Suite 210, Mississauga, Ontario, Canada, L5N 3C9Tel: (905) 819-7777 Fax: (905) 819-7409 E-mail: [email protected] Internet: www.russelmetals.com
Corporate GovernanceDetailed disclosure concerning the Company’s governance practices may be found in the Management Proxy Circular.
> russel metals inc. directory
Energy image on ifc courtesy of Suncor Energy Inc. ©
1900 Minnesota Court, Suite 210
Mississauga, Ontario L5N 3C9 Canada
Tel: (905) 819 7777 Fax: (905) 819 7409
[email protected] www.russelmetals.com
Annual Report 2007
POSITIONED FOR GROWTH
RU
SS
EL
M
ET
AL
S
IN
C.
2
00
7
AN
NU
AL
R
EP
OR
T