Embed Size (px)
Citation preview
ANNUAL REPORT 2016For the year ended April 30, 2016
Positioned to Succeed
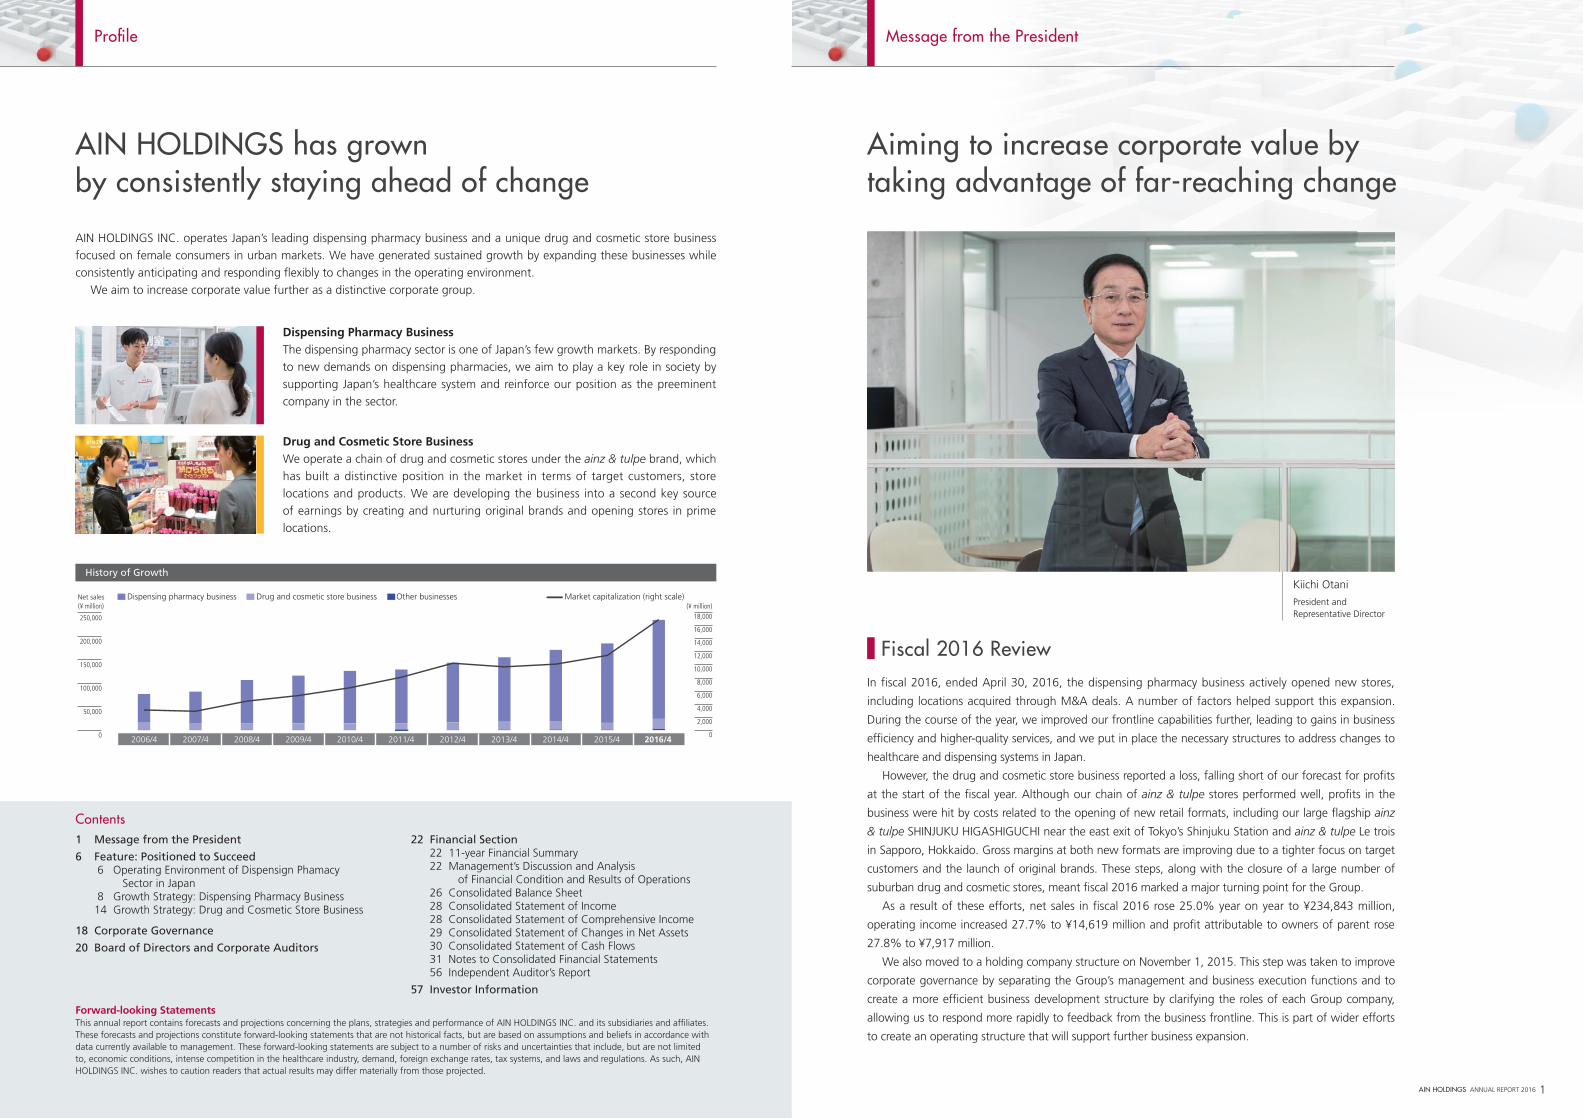
Fiscal 2016 ReviewIn fiscal 2016, ended April 30, 2016, the dispensing pharmacy business actively opened new stores,
including locations acquired through M&A deals. A number of factors helped support this expansion.
During the course of the year, we improved our frontline capabilities further, leading to gains in business
efficiency and higher-quality services, and we put in place the necessary structures to address changes to
healthcare and dispensing systems in Japan.
However, the drug and cosmetic store business reported a loss, falling short of our forecast for profits
at the start of the fiscal year. Although our chain of ainz & tulpe stores performed well, profits in the
business were hit by costs related to the opening of new retail formats, including our large flagship ainz
& tulpe SHINJUKU HIGASHIGUCHI near the east exit of Tokyo’s Shinjuku Station and ainz & tulpe Le trois
in Sapporo, Hokkaido. Gross margins at both new formats are improving due to a tighter focus on target
customers and the launch of original brands. These steps, along with the closure of a large number of
suburban drug and cosmetic stores, meant fiscal 2016 marked a major turning point for the Group.
As a result of these efforts, net sales in fiscal 2016 rose 25.0% year on year to ¥234,843 million,
operating income increased 27.7% to ¥14,619 million and profit attributable to owners of parent rose
27.8% to ¥7,917 million.
We also moved to a holding company structure on November 1, 2015. This step was taken to improve
corporate governance by separating the Group’s management and business execution functions and to
create a more efficient business development structure by clarifying the roles of each Group company,
allowing us to respond more rapidly to feedback from the business frontline. This is part of wider efforts
to create an operating structure that will support further business expansion.
Profile
AIN HOLDINGS ANNUAL REPORT 2016 1
AIN HOLDINGS INC. operates Japan’s leading dispensing pharmacy business and a unique drug and cosmetic store business focused on female consumers in urban markets. We have generated sustained growth by expanding these businesses while consistently anticipating and responding flexibly to changes in the operating environment. We aim to increase corporate value further as a distinctive corporate group.
Dispensing Pharmacy BusinessThe dispensing pharmacy sector is one of Japan’s few growth markets. By responding to new demands on dispensing pharmacies, we aim to play a key role in society by supporting Japan’s healthcare system and reinforce our position as the preeminent company in the sector.
Drug and Cosmetic Store BusinessWe operate a chain of drug and cosmetic stores under the ainz & tulpe brand, which has built a distinctive position in the market in terms of target customers, store locations and products. We are developing the business into a second key source of earnings by creating and nurturing original brands and opening stores in prime locations.
250,000
200,000
150,000
100,000
50,000
0
(¥ million)
18,000
16,000
14,000
12,000
10,000
8,000
6,000
4,000
2,000
0
(¥ million)
2006/4 2007/4 2008/4 2009/4 2010/4 2011/4 2013/42012/4 2014/4 2015/4 2016/4
Net sales Dispensing pharmacy business Drug and cosmetic store business Other businesses Market capitalization (right scale)
History of Growth
AIN HOLDINGS has grown by consistently staying ahead of change
Contents1 Message from the President
6 Feature: Positioned to Succeed 6 Operating Environment of Dispensign Phamacy Sector in Japan 8 Growth Strategy: Dispensing Pharmacy Business 14 Growth Strategy: Drug and Cosmetic Store Business
18 Corporate Governance
20 Board of Directors and Corporate Auditors
22 Financial Section 22 11-year Financial Summary 22 Management’s Discussion and Analysis of Financial Condition and Results of Operations 26 Consolidated Balance Sheet 28 Consolidated Statement of Income 28 Consolidated Statement of Comprehensive Income 29 Consolidated Statement of Changes in Net Assets 30 Consolidated Statement of Cash Flows 31 Notes to Consolidated Financial Statements 56 Independent Auditor’s Report
57 Investor Information
Forward-looking StatementsThis annual report contains forecasts and projections concerning the plans, strategies and performance of AIN HOLDINGS INC. and its subsidiaries and affiliates. These forecasts and projections constitute forward-looking statements that are not historical facts, but are based on assumptions and beliefs in accordance with data currently available to management. These forward-looking statements are subject to a number of risks and uncertainties that include, but are not limited to, economic conditions, intense competition in the healthcare industry, demand, foreign exchange rates, tax systems, and laws and regulations. As such, AIN HOLDINGS INC. wishes to caution readers that actual results may differ materially from those projected.
Message from the President
Aiming to increase corporate value by taking advantage of far-reaching change
Kiichi Otani
President and Representative Director

Business Strategy: Dispensing Pharmacy Business Our strategy has been to grow the dispensing
pharmacy business by expanding our nationwide
network of pharmacies located near hospitals.
Top-line growth has increased our buying power,
which in turn has lifted margins at each pharmacy,
creating a positive business cycle. We have also
focused on h i r ing and t ra in ing pharmac is ts ,
a key driver of growth, improved the efficiency
of existing dispensing pharmacies and systemized
pharmacy operations. These efforts have helped us counter the impact of drug price and dispensing
fee revisions, supporting sector-leading profit margins and a healthy financial position.
The government is currently promoting the concept of primary care dispensing pharmacies. We
plan to step up our efforts in this area, as it gives us the potential to fully leverage our competitive
advantages and continue playing a key role in society.
Over the last few years, companies in the sector have been targeting other dispensing pharmacy
chains for acquisition or merger, particularly small and medium-sized companies that are struggling to
hire pharmacists. We have also been expanding our network at an annual pace of around 120 dispensing
pharmacies, including locations acquired through M&A deals. An opportunity in the future to forge a
major M&A deal would significantly boost that pace of expansion (see pages 8-13 for more details about
our growth strategy for the dispensing pharmacy business).
AIN HOLDINGS Growth StrategyOur medium-term growth strategy is anchored by four key objectives:
1. Top-line growth
2. Improve the primary care capabilities of pharmacists and dispensing pharmacies*
3. Attract and train personnel
4. Grow the ainz & tulpe business * In the April 2016 dispensing fee revisions, the government used the terms Kakaritsuke pharmacists and Kakaritsuke dispensing
pharmacies, which roughly translates as primary care pharmacists and primary care dispensing pharmacies. For the first time, the government defined the criteria for Kakaritsuke pharmacists, stepping up its efforts to promote the primary care role of pharmacists in the community (see pages 10-11 for more details).
In order to generate further growth, we also need to anticipate and respond to changes in the
market. Moving to the holding company structure means we can easily integrate new companies
acquired through M&A deals without changing our operating structure. Going forward, we plan to
consolidate some Group companies to leverage business synergies.
2 AIN HOLDINGS ANNUAL REPORT 2016 AIN HOLDINGS ANNUAL REPORT 2016 3
Growth Strategy 1: Dispensing Pharmacy Business
Growth Strategy 2: Drug and Cosmetic
Store Business
Recruitment & training
Top-line growthForge M&A deals・Open dispensing pharmacies・Develop medical malls
Address changes in healthcare policy, operating environmentPrimary care dispensing pharmacies and pharmacists
Expandainz & tulpebusiness
Strengthenprocurementcapabilities
Improvepharmacyef�ciency
Contributeto localhealthcare
Establish new businessmodel
Quality
Scale
Flexibility
Potential
Contribute
• Number of pharmacist graduates hired
• Interest-bearing debt ratio • EV/EBITDA multiples of M&A deals
Dividends, salaries
• Operating income
• KPI
Contribute
Contribute
Returns
Invest
Invest
Stable pro�t
growth
Greatertrust,
strongerbrand
Strong�nances
Usedispensingexpertise
Assignpersonnel
Assignpersonnel
Usedispensingexpertise
Securetechnical fees
•Average prescription price• Average number of additional reimbursement points • Generic drug dispensing ratio•Number of pharmacies providing home-based dispensing services •Number of pharmacies providing 24-hour support
• Net sales
The Changing Role of Dispensing Pharmacies
Guidance for drug usage
(criteria for primary care dispensing pharmacies)
Integrated management of drug usage and other treatments
Pre-avoid activities
Management of leftover medicines
24-hour support
Support for home-based healthcareand nursing care
Promote generic drugs
Dispensing drugs
In the futureIn the past
Focused on dispensingdrug
Trends in Dispensing Fees
Conventionaldispensing services
receive lessreimbursement points
Primary care services receive
more reimbursement points
Guidance for drug usage
Dispensing drugs
See pages 7, 10-11, for more details.
Message from the President
Scale of Business
—Our dispensing pharmacy store network
Hokkaido 114
Kanto, Koshinetsu 389
Tohoku 106
HokurikuTokai, Kinki
220Chugoku, ShikokuKyushu, Okinawa
104
BranchesMajor group companies
933 pharmacies nationwide(As of end-fiscal 2016)
Fiscal 2015 (¥ million)
AIN HOLDINGS
Average of 3 competitors
Market capitalization 171,240 53,826Cash on hand in banks 19,553 9,058Interest-bearing debt 13,970 30,879Net cash 5,583 (21,820)Shareholders’ equity ratio 42.0% 27.8%
Fiscal 2016 (¥ million)
AIN HOLDINGS
Average of 3 competitors
Market capitalization 226,087 61,578Cash on hand in banks 22,647 18,428Interest-bearing debt 22,410 34,452Net cash 236 (16,024)Shareholders’ equity ratio 38.1% 30.0%
Notes:1. Market capitalization data are as of July 29, 2016. 2. Interest-bearing debt = Short- and long-term debts + Corporate bond (excluding
Lease obligations)3. Net cash = Cash on hand and in banks – Interest-bearing debt4. 3 competitors: NIHON CHOUZAI Co., Ltd., SOGO MEDICAL CO., LTD., Qol Co., Ltd.Source: Compiled by AIN HOLDINGS from the above companies’ financial results for
fiscal 2016.
Sound Financial Structure
—Comparison of financial indexes among major companies operating dispensing pharmacies in Japan
Message from the President
Capital StrategyIn fiscal 2016, we raised the full-year dividend to ¥40 per share, an increase of ¥10 from the
previous fiscal year. In future, we plan to increase the dividend payout ratio from the current 16% to
20%.
At the moment, we are putting priority on investment to drive growth, such as store openings,
rather than on shareholder returns.
M&A deals are likely to be the main use of capital. We are receiving a growing number of
inquiries about potential deals. We plan to actively acquire or merge with other dispensing
pharmacy companies while maintaining a stable EV/EBITDA ratio, in order to expand our business
and increase our market capitalization.
We aim to maintain ROE at around 15% and continue growing profits.
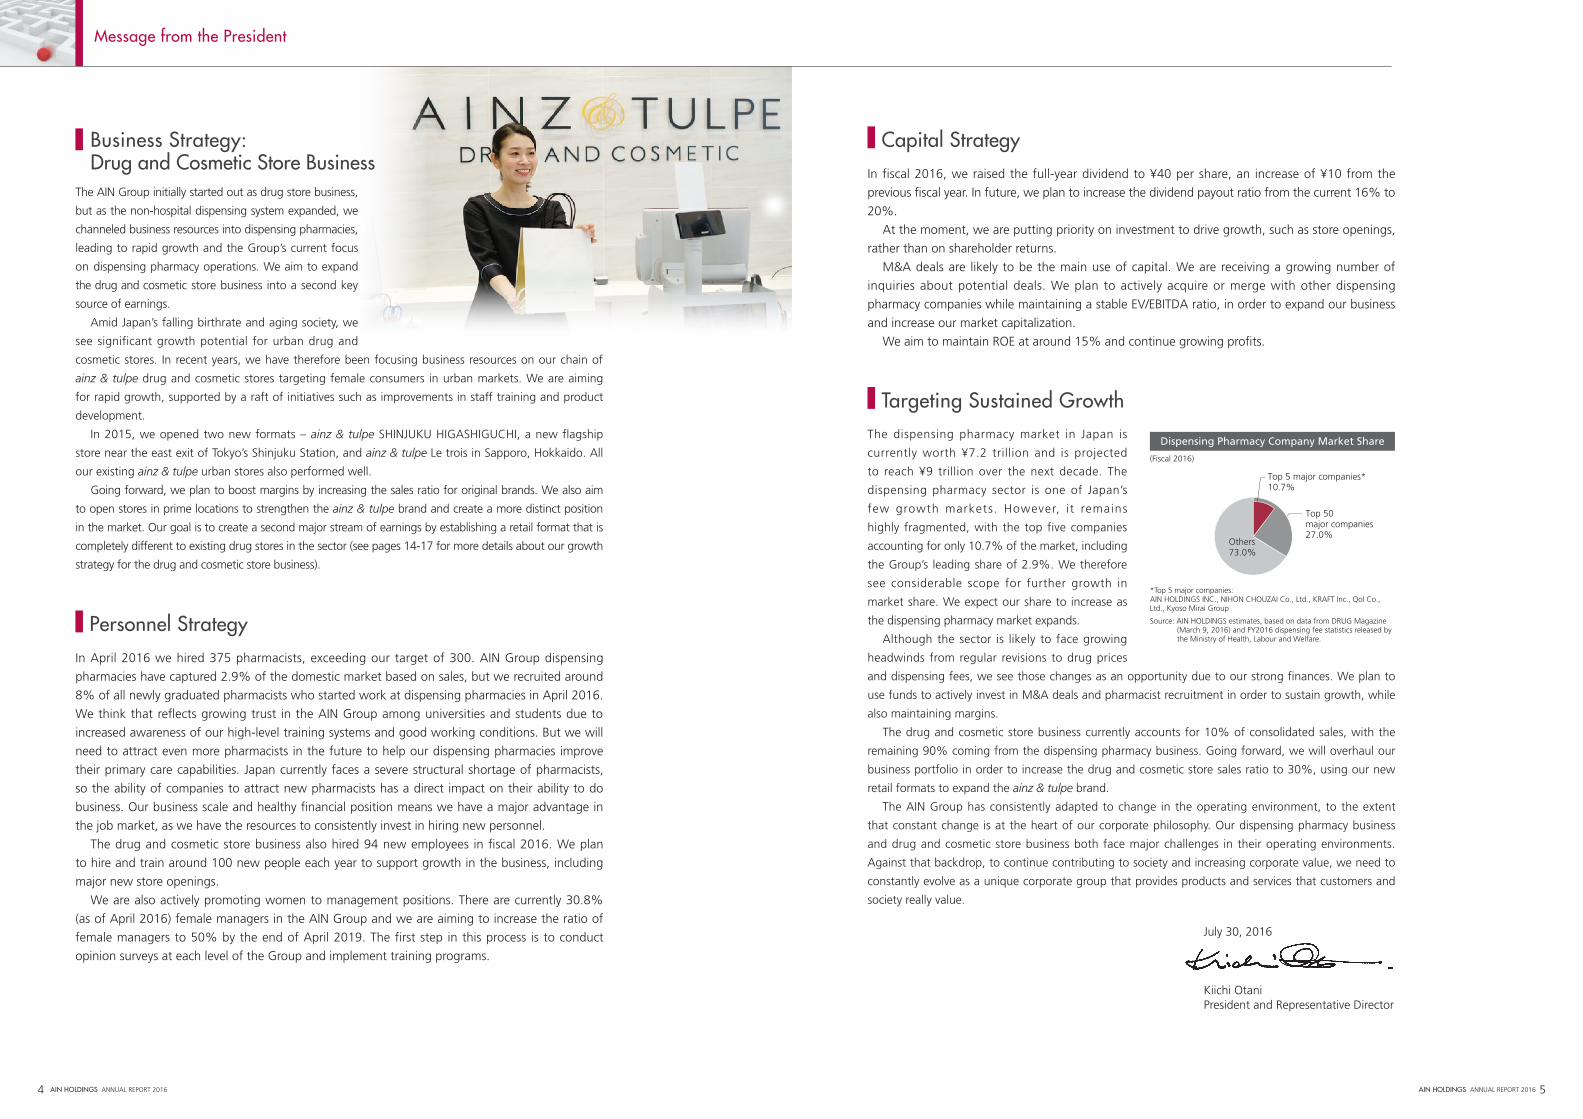
Targeting Sustained GrowthThe dispensing pharmacy market in Japan is
currently worth ¥7.2 trillion and is projected
to reach ¥9 trillion over the next decade. The
dispensing pharmacy sector is one of Japan’s
few growth markets. However, i t remains
highly fragmented, with the top five companies
accounting for only 10.7% of the market, including
the Group’s leading share of 2.9%. We therefore
see considerable scope for further growth in
market share. We expect our share to increase as
the dispensing pharmacy market expands.
Although the sector is likely to face growing
headwinds from regular revisions to drug prices
and dispensing fees, we see those changes as an opportunity due to our strong finances. We plan to
use funds to actively invest in M&A deals and pharmacist recruitment in order to sustain growth, while
also maintaining margins.
The drug and cosmetic store business currently accounts for 10% of consolidated sales, with the
remaining 90% coming from the dispensing pharmacy business. Going forward, we will overhaul our
business portfolio in order to increase the drug and cosmetic store sales ratio to 30%, using our new
retail formats to expand the ainz & tulpe brand.
The AIN Group has consistently adapted to change in the operating environment, to the extent
that constant change is at the heart of our corporate philosophy. Our dispensing pharmacy business
and drug and cosmetic store business both face major challenges in their operating environments.
Against that backdrop, to continue contributing to society and increasing corporate value, we need to
constantly evolve as a unique corporate group that provides products and services that customers and
society really value.
Business Strategy: Drug and Cosmetic Store BusinessThe AIN Group initially started out as drug store business,
but as the non-hospital dispensing system expanded, we
channeled business resources into dispensing pharmacies,
leading to rapid growth and the Group’s current focus
on dispensing pharmacy operations. We aim to expand
the drug and cosmetic store business into a second key
source of earnings.
Amid Japan’s falling birthrate and aging society, we
see significant growth potential for urban drug and
cosmetic stores. In recent years, we have therefore been focusing business resources on our chain of
ainz & tulpe drug and cosmetic stores targeting female consumers in urban markets. We are aiming
for rapid growth, supported by a raft of initiatives such as improvements in staff training and product
development.
In 2015, we opened two new formats – ainz & tulpe SHINJUKU HIGASHIGUCHI, a new flagship
store near the east exit of Tokyo’s Shinjuku Station, and ainz & tulpe Le trois in Sapporo, Hokkaido. All
our existing ainz & tulpe urban stores also performed well.
Going forward, we plan to boost margins by increasing the sales ratio for original brands. We also aim
to open stores in prime locations to strengthen the ainz & tulpe brand and create a more distinct position
in the market. Our goal is to create a second major stream of earnings by establishing a retail format that is
completely different to existing drug stores in the sector (see pages 14-17 for more details about our growth
strategy for the drug and cosmetic store business).
Personnel StrategyIn April 2016 we hired 375 pharmacists, exceeding our target of 300. AIN Group dispensing
pharmacies have captured 2.9% of the domestic market based on sales, but we recruited around
8% of all newly graduated pharmacists who started work at dispensing pharmacies in April 2016.
We think that reflects growing trust in the AIN Group among universities and students due to
increased awareness of our high-level training systems and good working conditions. But we will
need to attract even more pharmacists in the future to help our dispensing pharmacies improve
their primary care capabilities. Japan currently faces a severe structural shortage of pharmacists,
so the ability of companies to attract new pharmacists has a direct impact on their ability to do
business. Our business scale and healthy financial position means we have a major advantage in
the job market, as we have the resources to consistently invest in hiring new personnel.
The drug and cosmetic store business also hired 94 new employees in fiscal 2016. We plan
to hire and train around 100 new people each year to support growth in the business, including
major new store openings.
We are also actively promoting women to management positions. There are currently 30.8%
(as of April 2016) female managers in the AIN Group and we are aiming to increase the ratio of
female managers to 50% by the end of April 2019. The first step in this process is to conduct
opinion surveys at each level of the Group and implement training programs.
4 AIN HOLDINGS ANNUAL REPORT 2016 AIN HOLDINGS ANNUAL REPORT 2016 5
July 30, 2016
Kiichi OtaniPresident and Representative Director
Top 50 major companies27.0%
Top 5 major companies*10.7%
Others73.0%
*Top 5 major companies: AIN HOLDINGS INC., NIHON CHOUZAI Co., Ltd., KRAFT Inc., Qol Co., Ltd., Kyoso Mirai Group
Source: AIN HOLDINGS estimates, based on data from DRUG Magazine (March 9, 2016) and FY2016 dispensing fee statistics released by the Ministry of Health, Labour and Welfare.
Dispensing Pharmacy Company Market Share
(Fiscal 2016)
Why dispensing pharmacies located near hospitals are popular in JapanDispensing pharmacies located near hospitals are the most popular format in Japan because of clear benefits for users. We expect this format to remain popular over the medium and long term, as many pharmacies located near hospitals satisfy the government’s conditions for primary care dispensing pharmacies at the heart of local communities, rather than drugstores with dispensing pharmacy functions.
• Familiarity Non-hospital dispensing services really began gaining ground from around 1994. Many patients in Japan currently pick up their prescription drugs from pharmacies located near hospitals due to convenience and familiarity, because their local hospital dispensed drugs to them in the past.
• Well stockedMany prescriptions written in Japan specify certain drug brands, which means pharmacies need to stock a wide range of drugs. Dispensing pharmacies located near hospitals work closely with their local hospital to ensure they stock the right brands, so patients usually get the drugs they have been prescribed. This cooperation also supports efficient inventory management, as dispensing pharmacies know which drugs they do not need to stock.
• Convenient In Japan, patients have to see their doctor again to receive repeat prescriptions. The elderly and patients with chronic disorders who have to visit hospitals regularly tend to use dispensing pharmacies near hospitals because of the convenience.
• Safe and reassuring Dispensing pharmacies located near hospitals handle complex prescriptions and a much greater volume than drugstores with dispensing pharmacy functions, which means pharmacists who work at dispensing pharmacies near hospitals gain more experience, supporting a higher
level of specialization at those locations. Dispensing pharmacies near hospitals also regularly share information with their local hospital, helping to mitigate risk related to inappropriate combinations of prescribed drugs and dispensing errors, which supports a high level of safety and peace of mind for patients.
As Japan’s society ages and national medica l expenses r i se , d i spens ing pharmacies are being asked to play a radically different role in local healthcare services. The April 2016 dispensing fee revisions include new criteria for primary care pharmacists that support local communities (see pages 10–11
for more details). Pharmacists are now required to provide an even higher level of services, such as management of leftover prescription medication and support for patient health management and loca l hea l thcare prov i s ion, in addit ion to dispensing prescription drugs. Dispensing fees are gradually
being revised so that only dispensing pharmacies that provide these services w i l l be ab l e to gene ra te p ro f i t s . Dispensing pharmacies that can adapt to these changes wi l l be rewarded accordingly, while those that cannot could fall by the wayside.
The government is actively promoting wider use of generic drugs to help reduce national medical expenses. As of February 31, 2016, generic drugs accounted for 62.4% of all prescriptions. The government aims to increase the ratio to 80.0% by March 2020 by awarding d i spens ing pharmac ies add i t iona l reimbursement points (premiums) for
generic drug dispensing. The future of dispensing pharmacies will largely depend on their ability to contribute to this policy by increasing the generic drug dispensing ratio, and on whether they can build operating structures that are resilient to declines in earnings caused by factors such as lower generic drug price margins.
6 AIN HOLDINGS ANNUAL REPORT 2016 AIN HOLDINGS ANNUAL REPORT 2016 7
The dispensing pharmacy business is our core business and has the leading position in the sector. The dispensing pharmacy sector is one of only a few markets in Japan with prospects for growth over the medium to long term. However, with successive governments revising social insurance policy as part of wider efforts to curb national medical expenses, dispensing pharmacies face an increasingly challenging operating environment, raising the possibility of restructuring in the sector. However, after pushing ahead with strategies that anticipated those changes, we view them as a business opportunity. In this section, we look at the nature of the operating environment in Japan and our strategy for generating sustained value in our dispensing pharmacy business under those conditions.
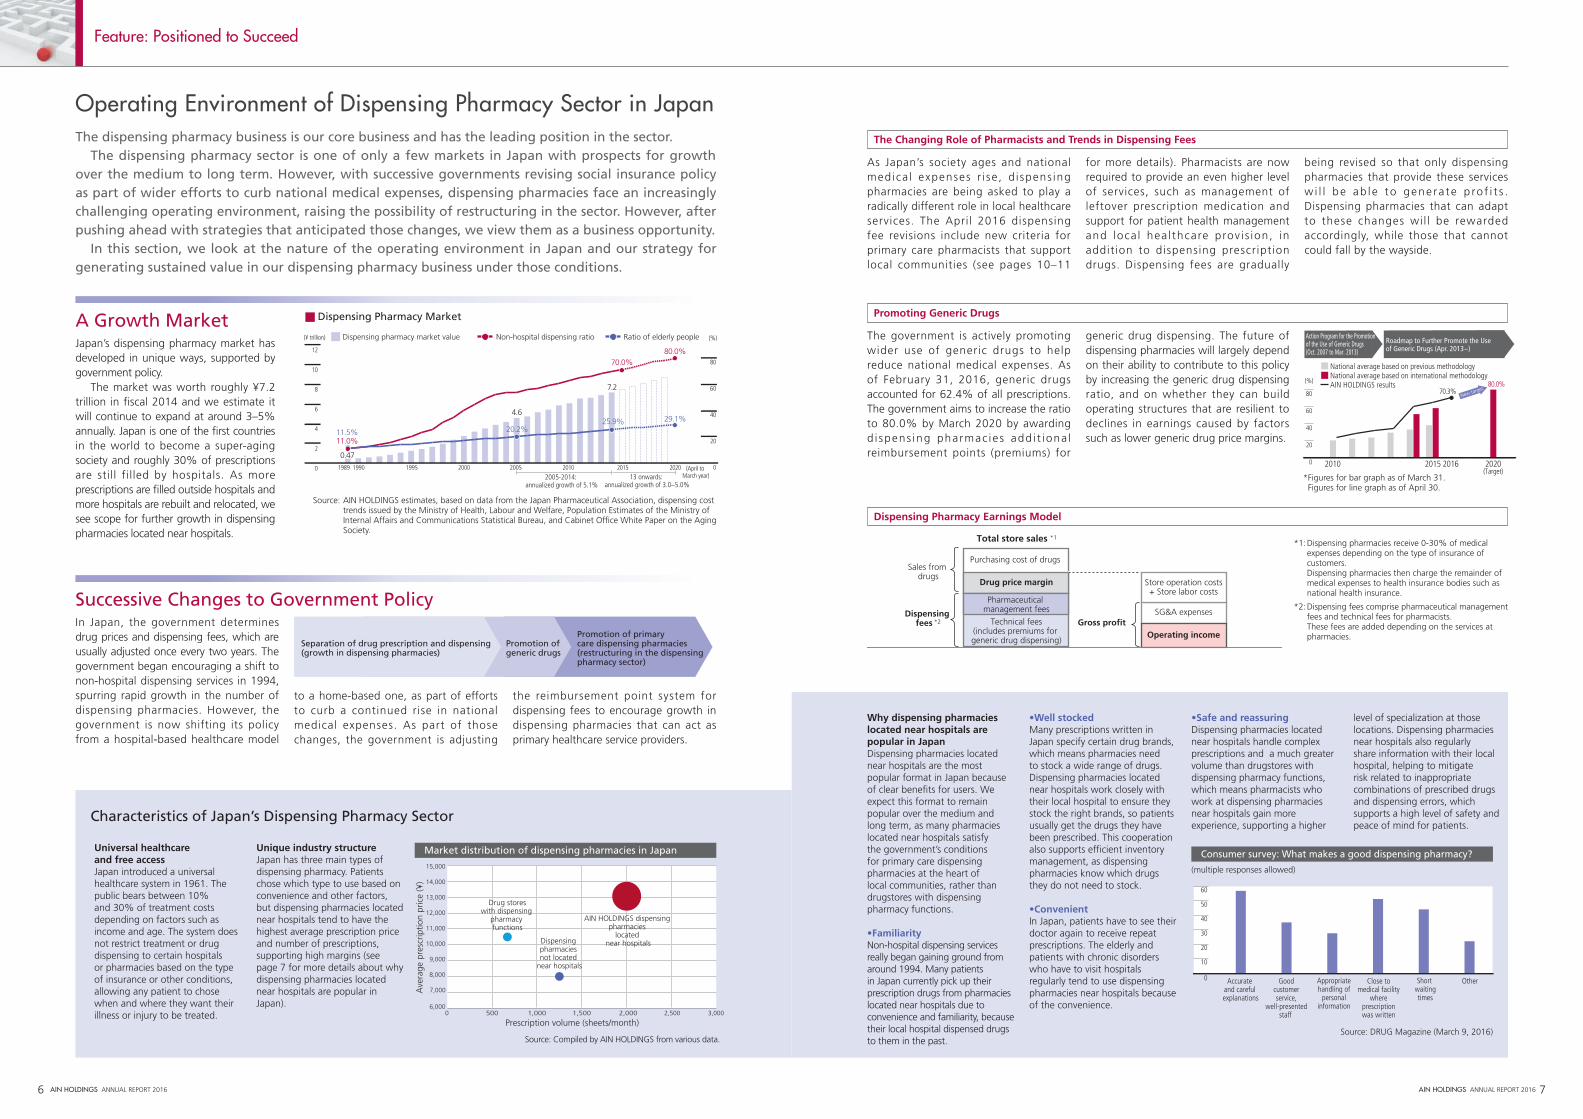
Japan’s dispensing pharmacy market has developed in unique ways, supported by government policy. The market was worth roughly ¥7.2 trillion in fiscal 2014 and we estimate it will continue to expand at around 3–5% annually. Japan is one of the first countries in the world to become a super-aging society and roughly 30% of prescriptions are still filled by hospitals. As more prescriptions are filled outside hospitals and more hospitals are rebuilt and relocated, we see scope for further growth in dispensing pharmacies located near hospitals.
A Growth Market
In Japan, the government determines drug prices and dispensing fees, which are usually adjusted once every two years. The government began encouraging a shift to non-hospital dispensing services in 1994, spurring rapid growth in the number of dispensing pharmacies. However, the government is now shifting its policy from a hospital-based healthcare model
to a home-based one, as part of efforts to curb a continued rise in national medical expenses. As part of those changes, the government is adjusting
the reimbursement point system for dispensing fees to encourage growth in dispensing pharmacies that can act as primary healthcare service providers.
Successive Changes to Government Policy
Feature: Positioned to Succeed
Operating Environment of Dispensing Pharmacy Sector in Japan
Source: AIN HOLDINGS estimates, based on data from the Japan Pharmaceutical Association, dispensing cost trends issued by the Ministry of Health, Labour and Welfare, Population Estimates of the Ministry of Internal Affairs and Communications Statistical Bureau, and Cabinet Office White Paper on the Aging Society.
Dispensing Pharmacy Market
1989 1990 1995 20052000 20152010 2020 (April to March year)
0
20
40
60
80
(%)
0
2
4
6
8
10
12
(¥ trillion)
2005-2014: annualized growth of 5.1%
13 onwards: annualized growth of 3.0–5.0%
25.9%
70.0%
7.2
20.2%
4.629.1%
80.0%
11.0%11.5%
0.47
Dispensing pharmacy market value Non-hospital dispensing ratio Ratio of elderly people
New target80
20
40
60
0 2010 2015 2016 2020(Target)
(%)
80
20
40
60
0
(%)
Roadmap to Further Promote the Use of Generic Drugs (Apr. 2013~)
National average based on previous methodologyNational average based on international methodologyAIN HOLDINGS results 80.0%
Action Program for the Promotion of the Use of Generic Drugs (Oct. 2007 to Mar. 2013)
70.3%
Separation of drug prescription and dispensing(growth in dispensing pharmacies)
Promotion of generic drugs
Promotion of primary care dispensing pharmacies(restructuring in the dispensing pharmacy sector)
The Changing Role of Pharmacists and Trends in Dispensing Fees
Promoting Generic Drugs
Purchasing cost of drugs
Drug price margin Store operation costs + Store labor costs
Operating income
SG&A expenses
Total store sales *1
Sales from drugs
Dispensing fees *2 Gross pro�t
Pharmaceutical management fees
Technical fees(includes premiums for generic drug dispensing)
*1: Dispensing pharmacies receive 0-30% of medical expenses depending on the type of insurance of customers.
Dispensing pharmacies then charge the remainder of medical expenses to health insurance bodies such as national health insurance.
*2: Dispensing fees comprise pharmaceutical management fees and technical fees for pharmacists. These fees are added depending on the services at pharmacies.
Dispensing Pharmacy Earnings Model
Characteristics of Japan’s Dispensing Pharmacy Sector
Universal healthcare and free accessJapan introduced a universal healthcare system in 1961. The public bears between 10% and 30% of treatment costs depending on factors such as income and age. The system does not restrict treatment or drug dispensing to certain hospitals or pharmacies based on the type of insurance or other conditions, allowing any patient to chose when and where they want their illness or injury to be treated.
*Figures for bar graph as of March 31. Figures for line graph as of April 30.
Prescription volume (sheets/month)
15,000
14,000
13,000
12,000
11,000
10,000
9,000
7,000
6,000
8,000
500 1,000 2,0001,5000 2,500 3,000
AIN HOLDINGS dispensing pharmacies
located near hospitals
Ave
rage
pre
scrip
tion
pric
e (¥
)
Dispensing pharmacies not located
near hospitals
Drug storeswith dispensing
pharmacy functions
Market distribution of dispensing pharmacies in JapanUnique industry structureJapan has three main types of dispensing pharmacy. Patients chose which type to use based on convenience and other factors, but dispensing pharmacies located near hospitals tend to have the highest average prescription price and number of prescriptions, supporting high margins (see page 7 for more details about why dispensing pharmacies located near hospitals are popular in Japan).
Source: Compiled by AIN HOLDINGS from various data.
60
40
30
50
20
10
0 Accurate and careful explanations
Goodcustomerservice,
well-presentedstaff
Appropriatehandling of
personalinformation
Close tomedical facility
whereprescriptionwas written
Short waitingtimes
Other
60
40
30
50
20
10
0
(XX)
Accurate and careful explanations
Goodcustomerservice,
well-presentedstaff
Appropriatehandling of
personalinformation
Close tomedical facility
whereprescriptionwas written
Short waitingtimes
Other
Consumer survey: What makes a good dispensing pharmacy?
(multiple responses allowed)
Source: DRUG Magazine (March 9, 2016)
as our strong financial position and high-quality training programs for pharmacists, means we are often given first refusal on a large number of potential M&A deals. Using those opportunities, we plan to further step up M&A activity to accelerate business expansion, while also taking into account investment efficiency. We have narrowed our investment focus to potential deals with prospective EV/EBITDA multiples no higher than five to seven times and companies that can contribute to profits in their first fiscal year in the AIN Group. After deals are completed, we work to integrate the business systems and corporate culture of the acquired companies into the AIN Group in order to improve dispensing pharmacy efficiency and enhance the skills of pharmacists. On average, this process more than doubles profit margins at acquired companies, so the deals have a significant impact on the Group’s bottom line, as well as on sales and the number of pharmacists.
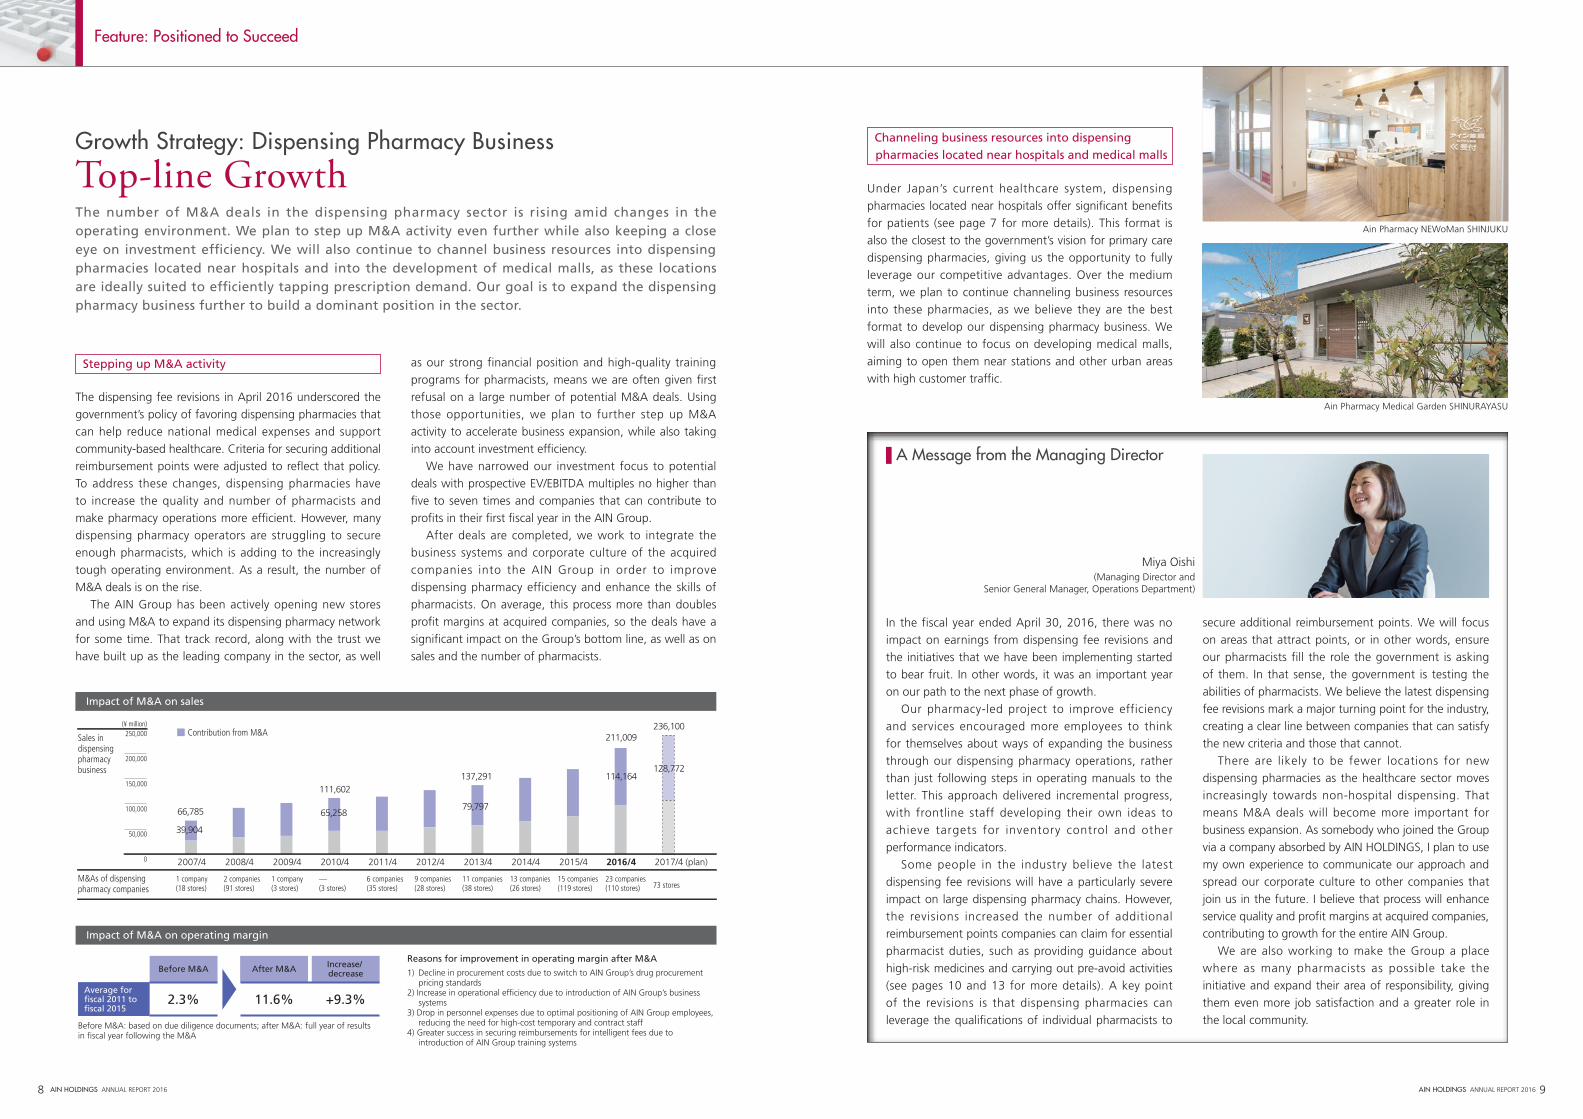
Channeling business resources into dispensing pharmacies located near hospitals and medical malls
Under Japan’s current healthcare system, dispensing pharmacies located near hospitals offer significant benefits for patients (see page 7 for more details). This format is also the closest to the government’s vision for primary care dispensing pharmacies, giving us the opportunity to fully leverage our competitive advantages. Over the medium term, we plan to continue channeling business resources into these pharmacies, as we believe they are the best format to develop our dispensing pharmacy business. We will also continue to focus on developing medical malls, aiming to open them near stations and other urban areas with high customer traffic.
The number of M&A deals in the dispensing pharmacy sector is rising amid changes in the operating environment. We plan to step up M&A activity even further while also keeping a close eye on investment efficiency. We will also continue to channel business resources into dispensing pharmacies located near hospitals and into the development of medical malls, as these locations are ideally suited to efficiently tapping prescription demand. Our goal is to expand the dispensing pharmacy business further to build a dominant position in the sector.
Stepping up M&A activity
The dispensing fee revisions in April 2016 underscored the government’s policy of favoring dispensing pharmacies that can help reduce national medical expenses and support community-based healthcare. Criteria for securing additional reimbursement points were adjusted to reflect that policy. To address these changes, dispensing pharmacies have to increase the quality and number of pharmacists and make pharmacy operations more efficient. However, many dispensing pharmacy operators are struggling to secure enough pharmacists, which is adding to the increasingly tough operating environment. As a result, the number of M&A deals is on the rise. The AIN Group has been actively opening new stores and using M&A to expand its dispensing pharmacy network for some time. That track record, along with the trust we have built up as the leading company in the sector, as well
8 AIN HOLDINGS ANNUAL REPORT 2016 AIN HOLDINGS ANNUAL REPORT 2016 9
Growth Strategy: Dispensing Pharmacy Business
Top-line Growth
A Message from the Managing Director
In the fiscal year ended April 30, 2016, there was no impact on earnings from dispensing fee revisions and the initiatives that we have been implementing started to bear fruit. In other words, it was an important year on our path to the next phase of growth. Our pharmacy-led project to improve efficiency and services encouraged more employees to think for themselves about ways of expanding the business through our dispensing pharmacy operations, rather than just following steps in operating manuals to the letter. This approach delivered incremental progress, with frontline staff developing their own ideas to achieve targets for inventory control and other performance indicators. Some people in the industry believe the latest dispensing fee revisions will have a particularly severe impact on large dispensing pharmacy chains. However, the revisions increased the number of additional reimbursement points companies can claim for essential pharmacist duties, such as providing guidance about high-risk medicines and carrying out pre-avoid activities (see pages 10 and 13 for more details). A key point of the revisions is that dispensing pharmacies can leverage the qualifications of individual pharmacists to
secure additional reimbursement points. We will focus on areas that attract points, or in other words, ensure our pharmacists fill the role the government is asking of them. In that sense, the government is testing the abilities of pharmacists. We believe the latest dispensing fee revisions mark a major turning point for the industry, creating a clear line between companies that can satisfy the new criteria and those that cannot. There are likely to be fewer locations for new dispensing pharmacies as the healthcare sector moves increasingly towards non-hospital dispensing. That means M&A deals will become more important for business expansion. As somebody who joined the Group via a company absorbed by AIN HOLDINGS, I plan to use my own experience to communicate our approach and spread our corporate culture to other companies that join us in the future. I believe that process will enhance service quality and profit margins at acquired companies, contributing to growth for the entire AIN Group. We are also working to make the Group a place where as many pharmacists as possible take the initiative and expand their area of responsibility, giving them even more job satisfaction and a greater role in the local community.
Miya Oishi (Managing Director and
Senior General Manager, Operations Department)
250,000
200,000
100,000
50,000
150,000
0 2007/4 2008/4 2009/4 2010/4 2011/4 2012/4 2013/4 2014/4 2015/4 2016/4 2017/4
Sales in dispensing pharmacy business
M&As of dispensing pharmacy companies
1 company(18 stores)
2 companies(91 stores)
1 company(3 stores)
—(3 stores)
6 companies(35 stores)
9 companies(28 stores)
11 companies(38 stores)
13 companies(26 stores)
15 companies(119 stores)
23 companies(110 stores) 73 stores
Contribution from M&A
66,785
111,602137,291
211,009
39,904
65,258 79,797
114,164
236,100
128,772
(plan)
(¥ million)
Average for �scal 2011 to �scal 2015
After M&ABefore M&A Increase/ decrease
2.3% 11.6% +9.3%
Before M&A: based on due diligence documents; after M&A: full year of results in �scal year following the M&A
Impact of M&A on sales
Impact of M&A on operating margin
Ain Pharmacy NEWoMan SHINJUKU
Ain Pharmacy Medical Garden SHINURAYASU
Feature: Positioned to Succeed
Reasons for improvement in operating margin after M&A
1) Decline in procurement costs due to switch to AIN Group’s drug procurement pricing standards
2) Increase in operational efficiency due to introduction of AIN Group’s business systems
3) Drop in personnel expenses due to optimal positioning of AIN Group employees, reducing the need for high-cost temporary and contract staff
4) Greater success in securing reimbursements for intelligent fees due to introduction of AIN Group training systems
Working with local medical facilitiesDispensing pharmacies a r e b e i n g a s k e d t o reinforce their links with local medical facilities. Through our growing network of dispensing pharmacies located near hospitals, we have been exchanging information and enhancing cooperation with local hospitals for some time. We are now working to build even closer links through home-based healthcare, prescription checks and the provision of feedback to doctors about medication and other areas.
Home-based dispensingAs healthcare becomes m o re a d v a n c e d a n d Japan’s population ages, dispensing pharmacies are being asked to play a greater role as local health centers supporting home-based healthcare and other services. The AIN Group started implementing initiatives in home-based dispensing in 2012 after realizing it was likely to become an important function of dispensing pharmacies. As of April 30, 2016, over 80% of our dispensing pharmacies provide home-based dispensing services. We plan to expand these services to all our pharmacies as part of active efforts to support home-based healthcare.
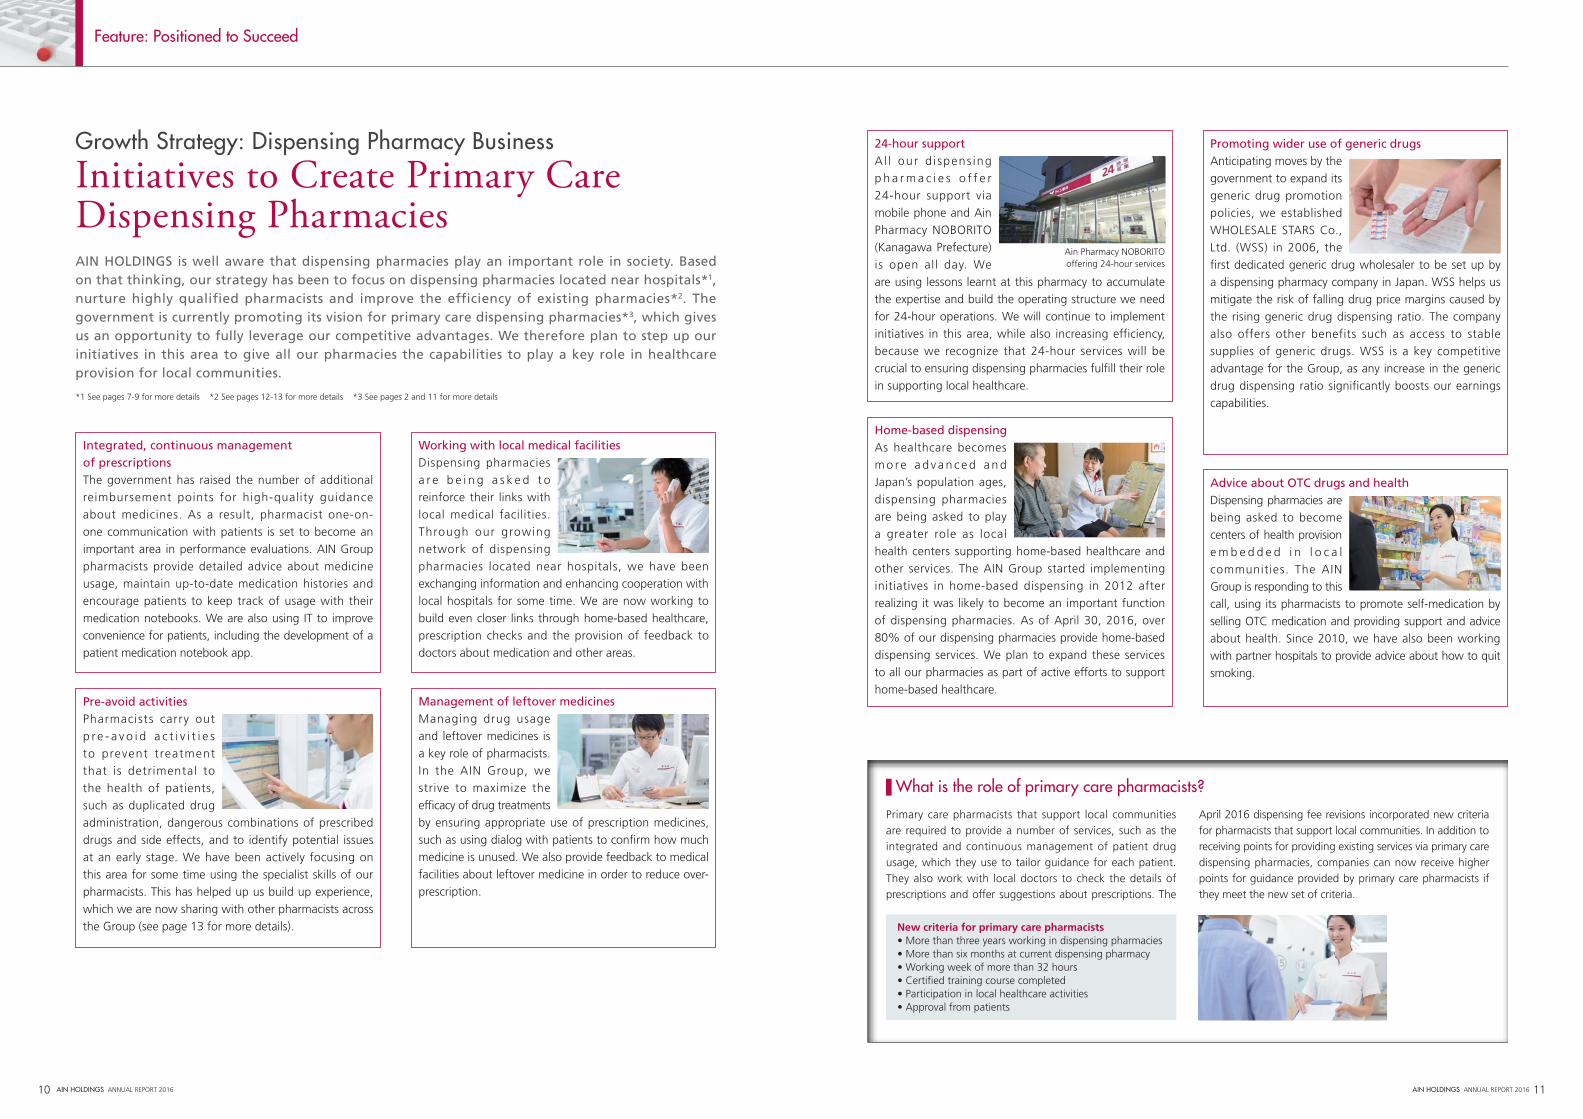
24-hour supportAl l our d i spens ing p h a r m a c i e s o f f e r 24-hour support via mobile phone and Ain Pharmacy NOBORITO (Kanagawa Prefecture) is open all day. We are using lessons learnt at this pharmacy to accumulate the expertise and build the operating structure we need for 24-hour operations. We will continue to implement initiatives in this area, while also increasing efficiency, because we recognize that 24-hour services will be crucial to ensuring dispensing pharmacies fulfill their role in supporting local healthcare.
Management of leftover medicinesManaging drug usage and leftover medicines is a key role of pharmacists. In the AIN Group, we strive to maximize the efficacy of drug treatments by ensuring appropriate use of prescription medicines, such as using dialog with patients to confirm how much medicine is unused. We also provide feedback to medical facilities about leftover medicine in order to reduce over-prescription.
10 AIN HOLDINGS ANNUAL REPORT 2016
Integrated, continuous management of prescriptions The government has raised the number of additional reimbursement points for high-quality guidance about medicines. As a result, pharmacist one-on-one communication with patients is set to become an important area in performance evaluations. AIN Group pharmacists provide detailed advice about medicine usage, maintain up-to-date medication histories and encourage patients to keep track of usage with their medication notebooks. We are also using IT to improve convenience for patients, including the development of a patient medication notebook app.
Pre-avoid activitiesPharmacists carry out p r e - a v o i d a c t i v i t i e s to prevent t reatment that is detrimental to the health of patients, such as duplicated drug administration, dangerous combinations of prescribed drugs and side effects, and to identify potential issues at an early stage. We have been actively focusing on this area for some time using the specialist skills of our pharmacists. This has helped up us build up experience, which we are now sharing with other pharmacists across the Group (see page 13 for more details).
Advice about OTC drugs and healthDispensing pharmacies are being asked to become centers of health provision e m b e d d e d i n l o c a l communities. The AIN Group is responding to this call, using its pharmacists to promote self-medication by selling OTC medication and providing support and advice about health. Since 2010, we have also been working with partner hospitals to provide advice about how to quit smoking.
AIN HOLDINGS ANNUAL REPORT 2016 11
AIN HOLDINGS is well aware that dispensing pharmacies play an important role in society. Based on that thinking, our strategy has been to focus on dispensing pharmacies located near hospitals*1, nurture highly qualified pharmacists and improve the efficiency of existing pharmacies*2. The government is currently promoting its vision for primary care dispensing pharmacies*3, which gives us an opportunity to fully leverage our competitive advantages. We therefore plan to step up our initiatives in this area to give all our pharmacies the capabilities to play a key role in healthcare provision for local communities.
*1 See pages 7-9 for more details *2 See pages 12-13 for more details *3 See pages 2 and 11 for more details
Feature: Positioned to Succeed
Growth Strategy: Dispensing Pharmacy Business
Initiatives to Create Primary Care Dispensing Pharmacies
Primary care pharmacists that support local communities are required to provide a number of services, such as the integrated and continuous management of patient drug usage, which they use to tailor guidance for each patient. They also work with local doctors to check the details of prescriptions and offer suggestions about prescriptions. The
April 2016 dispensing fee revisions incorporated new criteria for pharmacists that support local communities. In addition to receiving points for providing existing services via primary care dispensing pharmacies, companies can now receive higher points for guidance provided by primary care pharmacists if they meet the new set of criteria.
What is the role of primary care pharmacists?
New criteria for primary care pharmacists• More than three years working in dispensing pharmacies• More than six months at current dispensing pharmacy• Working week of more than 32 hours• Certified training course completed• Participation in local healthcare activities• Approval from patients
Promoting wider use of generic drugsAnticipating moves by the government to expand its generic drug promotion policies, we established WHOLESALE STARS Co., Ltd. (WSS) in 2006, the first dedicated generic drug wholesaler to be set up by a dispensing pharmacy company in Japan. WSS helps us mitigate the risk of falling drug price margins caused by the rising generic drug dispensing ratio. The company also offers other benefits such as access to stable supplies of generic drugs. WSS is a key competitive advantage for the Group, as any increase in the generic drug dispensing ratio significantly boosts our earnings capabilities.
Ain Pharmacy NOBORITOoffering 24-hour services
12 AIN HOLDINGS ANNUAL REPORT 2016 AIN HOLDINGS ANNUAL REPORT 2016 13
Feature: Positioned to Succeed
Today’s dispensing pharmacies now need to be able to provide a wider range of high-quality services. To address these demands, the biggest issue for dispensing pharmacy companies is how to increase the quality and number of pharmacists. Hiring and training pharmacists on a sustained basis is also vital to support an active dispensing pharmacy opening program. AIN HOLDINGS therefore puts the highest priority on attracting and retaining personnel. We are also pushing ahead with initiatives to increase the efficiency of existing pharmacies, which is delivering significant improvements.
Continuous recruitment and high-quality training
Since its founding, the AIN Group has focused on hiring and training pharmacists on an ongoing basis. To ensure our dispensing pharmacies fulfill their primary care role in communities by working closely with local medical facilities and providing 24-hour services and home-based dispensing, our pharmacists need to have more expertise and experience and better communication skills. We also need to hire more pharmacists to deliver the higher level of service provision. After joining the AIN Group, our pharmacists undergo an extensive and sustained training program tailored to the current stage in their careers. Our pharmacists also build up a high level of expertise because they work at AIN Group dispensing pharmacies that tend to handle a large number of complex prescriptions. Japan is currently facing a shortage of pharmacists, mak-ing it hard for dispensing pharmacies to secure the staff they need. This problem is particularly acute for small and medi-um-sized companies. However, thanks to our track record in the industry and growing awareness of our high-quality training system, we have been able to hire enough staff.
This success in attracting large numbers of high-quality pharmacists allows us to contribute to the government’s policy of community healthcare and helps us to boost profits by securing more reimbursement points. To support our aggressive business expansion plans over the medium and long term, we plan to improve on our sec-tor-leading employee training and education programs and continue actively hiring pharmacists.
Improving pharmacy efficiency from the bottom up
As part of efforts to curb national medical expenses, the government is changing the dispensing fee system with every revision. This is having a major impact on the earnings of dispensing pharmacies. In response, we launched a new pharmacy-led project in autumn 2012 as one of our strategies to reinforce the operations of existing dispensing pharmacies.
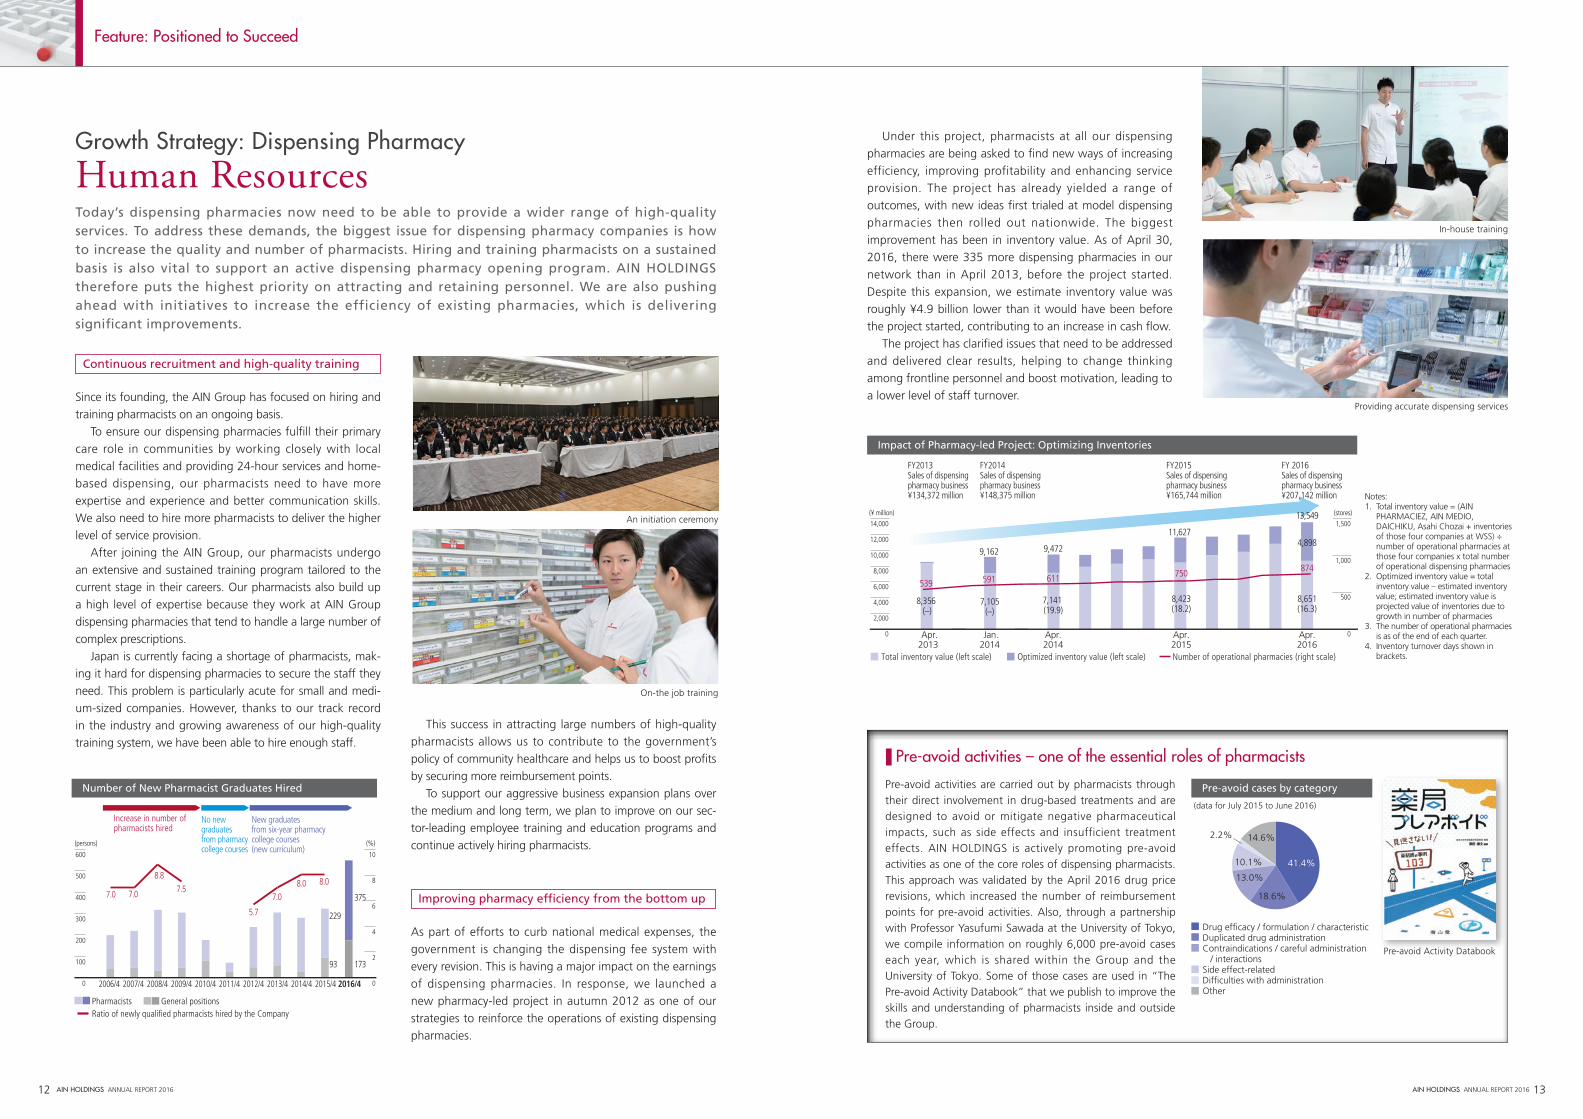
Under this project, pharmacists at all our dispensing pharmacies are being asked to find new ways of increasing efficiency, improving profitability and enhancing service provision. The project has already yielded a range of outcomes, with new ideas first trialed at model dispensing pharmacies then rolled out nationwide. The biggest improvement has been in inventory value. As of April 30, 2016, there were 335 more dispensing pharmacies in our network than in April 2013, before the project started. Despite this expansion, we estimate inventory value was roughly ¥4.9 billion lower than it would have been before the project started, contributing to an increase in cash flow. The project has clarified issues that need to be addressed and delivered clear results, helping to change thinking among frontline personnel and boost motivation, leading to a lower level of staff turnover.
Growth Strategy: Dispensing Pharmacy
Human Resources
600
500
300
400
200
100
0 2006/4 2007/4 2008/4 2009/4 2010/4 2011/4 2012/4 2013/4 2014/4 2015/4 2016/4
(persons)
Pharmacists
New graduates from six-year pharmacy college courses (new curriculum)
No new graduates from pharmacy college courses
Increase in number of pharmacists hired
229
93
375
173
General positionsRatio of newly quali�ed pharmacists hired by the Company
7.0 7.0
8.8
7.57.0
8.0 8.0
5.7
10
6
8
2
4
0
(%)
Number of New Pharmacist Graduates Hired
Number of operational pharmacies (right scale)Total inventory value (left scale) Optimized inventory value (left scale)
14,000
2,000
12,000
10,000
6,000
4,000
8,000
0
(¥ million)
1,500
1,000
500
0
(stores)
Apr.
8,356 (–)
539 591 611 750 874
7,105(–)
7,141 (19.9)
8,423(18.2)
8,651(16.3)
4,8989,162 9,472
11,627
13,549
2014Jan.
2014Apr.
2013Apr. Apr.2015 2016
FY2013Sales of dispensing pharmacy business ¥134,372 million
FY2014Sales of dispensing pharmacy business ¥148,375 million
FY2015 Sales of dispensing pharmacy business ¥165,744 million
FY 2016Sales of dispensing pharmacy business¥207,142 million
Impact of Pharmacy-led Project: Optimizing Inventories
Notes: 1. Total inventory value = (AIN
PHARMACIEZ, AIN MEDIO, DAICHIKU, Asahi Chozai + inventories of those four companies at WSS) ÷ number of operational pharmacies at those four companies x total number of operational dispensing pharmacies
2. Optimized inventory value = total inventory value – estimated inventory value; estimated inventory value is projected value of inventories due to growth in number of pharmacies
3. The number of operational pharmacies is as of the end of each quarter.
4. Inventory turnover days shown in brackets.
Pre-avoid activities – one of the essential roles of pharmacists
In-house training
Providing accurate dispensing services
An initiation ceremony
On-the job training
Pre-avoid activities are carried out by pharmacists through their direct involvement in drug-based treatments and are designed to avoid or mitigate negative pharmaceutical impacts, such as side effects and insufficient treatment effects. AIN HOLDINGS is actively promoting pre-avoid activities as one of the core roles of dispensing pharmacists. This approach was validated by the April 2016 drug price revisions, which increased the number of reimbursement points for pre-avoid activities. Also, through a partnership with Professor Yasufumi Sawada at the University of Tokyo, we compile information on roughly 6,000 pre-avoid cases each year, which is shared within the Group and the University of Tokyo. Some of those cases are used in “The Pre-avoid Activity Databook” that we publish to improve the skills and understanding of pharmacists inside and outside the Group.
Drug ef�cacy / formulation / characteristicDuplicated drug administrationContraindications / careful administration / interactionsSide effect-relatedDif�culties with administrationOther
41.4%
18.6%
13.0%
2.2% 14.6%
10.1%
Drug ef�cacy / formulation / characteristicDuplicated drug administrationContraindications / careful administration / interactionsSide effect-relatedDif�culties with administrationOther
41.4%
18.6%
13.0%
2.2%
14.6%
10.1%
Pre-avoid cases by category
(data for July 2015 to June 2016)
Pre-avoid Activity Databook
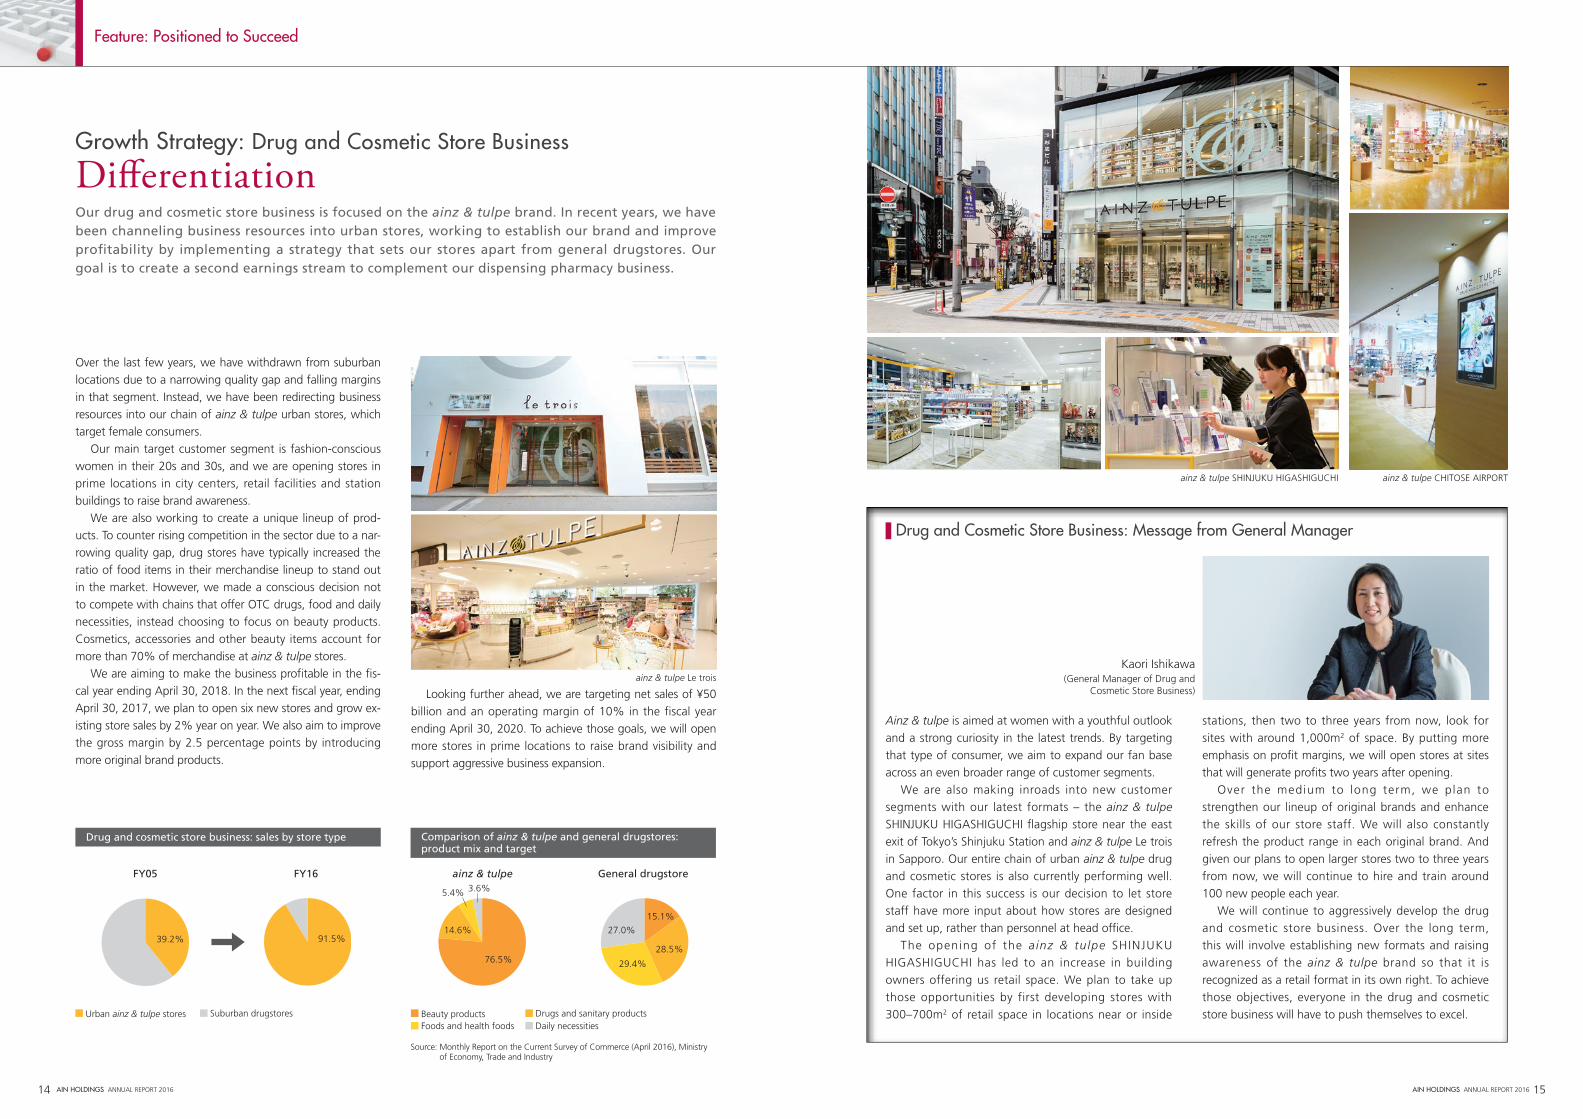
Over the last few years, we have withdrawn from suburban locations due to a narrowing quality gap and falling margins in that segment. Instead, we have been redirecting business resources into our chain of ainz & tulpe urban stores, which target female consumers. Our main target customer segment is fashion-conscious women in their 20s and 30s, and we are opening stores in prime locations in city centers, retail facilities and station buildings to raise brand awareness. We are also working to create a unique lineup of prod-ucts. To counter rising competition in the sector due to a nar-rowing quality gap, drug stores have typically increased the ratio of food items in their merchandise lineup to stand out in the market. However, we made a conscious decision not to compete with chains that offer OTC drugs, food and daily necessities, instead choosing to focus on beauty products. Cosmetics, accessories and other beauty items account for more than 70% of merchandise at ainz & tulpe stores. We are aiming to make the business profitable in the fis-cal year ending April 30, 2018. In the next fiscal year, ending April 30, 2017, we plan to open six new stores and grow ex-isting store sales by 2% year on year. We also aim to improve the gross margin by 2.5 percentage points by introducing more original brand products.
Looking further ahead, we are targeting net sales of ¥50 billion and an operating margin of 10% in the fiscal year ending April 30, 2020. To achieve those goals, we will open more stores in prime locations to raise brand visibility and support aggressive business expansion.
Kaori Ishikawa (General Manager of Drug and
Cosmetic Store Business)
Drug and Cosmetic Store Business: Message from General Manager
Ainz & tulpe is aimed at women with a youthful outlook and a strong curiosity in the latest trends. By targeting that type of consumer, we aim to expand our fan base across an even broader range of customer segments. We are also making inroads into new customer segments with our latest formats – the ainz & tulpe SHINJUKU HIGASHIGUCHI flagship store near the east exit of Tokyo’s Shinjuku Station and ainz & tulpe Le trois in Sapporo. Our entire chain of urban ainz & tulpe drug and cosmetic stores is also currently performing well. One factor in this success is our decision to let store staff have more input about how stores are designed and set up, rather than personnel at head office. The opening of the ainz & tulpe SHINJUKU HIGASHIGUCHI has led to an increase in building owners offering us retail space. We plan to take up those opportunities by first developing stores with 300–700m2 of retail space in locations near or inside
stations, then two to three years from now, look for sites with around 1,000m2 of space. By putting more emphasis on profit margins, we will open stores at sites that will generate profits two years after opening. Over the medium to long term, we plan to strengthen our lineup of original brands and enhance the skills of our store staff. We will also constantly refresh the product range in each original brand. And given our plans to open larger stores two to three years from now, we will continue to hire and train around 100 new people each year. We will continue to aggressively develop the drug and cosmetic store business. Over the long term, this will involve establishing new formats and raising awareness of the ainz & tulpe brand so that it is recognized as a retail format in its own right. To achieve those objectives, everyone in the drug and cosmetic store business will have to push themselves to excel.
Feature: Positioned to Succeed
14 AIN HOLDINGS ANNUAL REPORT 2016 AIN HOLDINGS ANNUAL REPORT 2016 15
Our drug and cosmetic store business is focused on the ainz & tulpe brand. In recent years, we have been channeling business resources into urban stores, working to establish our brand and improve profitability by implementing a strategy that sets our stores apart from general drugstores. Our goal is to create a second earnings stream to complement our dispensing pharmacy business.
Growth Strategy: Drug and Cosmetic Store Business
Differentiation
Drug and cosmetic store business: sales by store type Comparison of ainz & tulpe and general drugstores: product mix and target
39.2% 91.5%
Urban ainz & tulpe stores Suburban drugstores
FY05 FY16
Beauty products
ainz & tulpe General drugstore
76.5%
14.6%
3.6%5.4%
15.1%
29.4%
28.5%
27.0%
Drugs and sanitary productsFoods and health foods Daily necessities
ainz & tulpe SHINJUKU HIGASHIGUCHI ainz & tulpe CHITOSE AIRPORT
Source: Monthly Report on the Current Survey of Commerce (April 2016), Ministry of Economy, Trade and Industry
ainz & tulpe Le trois
Feature: Positioned to Succeed
16 AIN HOLDINGS ANNUAL REPORT 2016 AIN HOLDINGS ANNUAL REPORT 2016 17
The drug and cosmetic store business began the full-scale development of new retail formats and original brands in the fiscal year under review. We are now aggressively developing the business, aiming to establish new formats that are completely different to general drugstores and department stores.
Growth Strategy: Drug and Cosmetic Store Business
New Formats and Original Brands
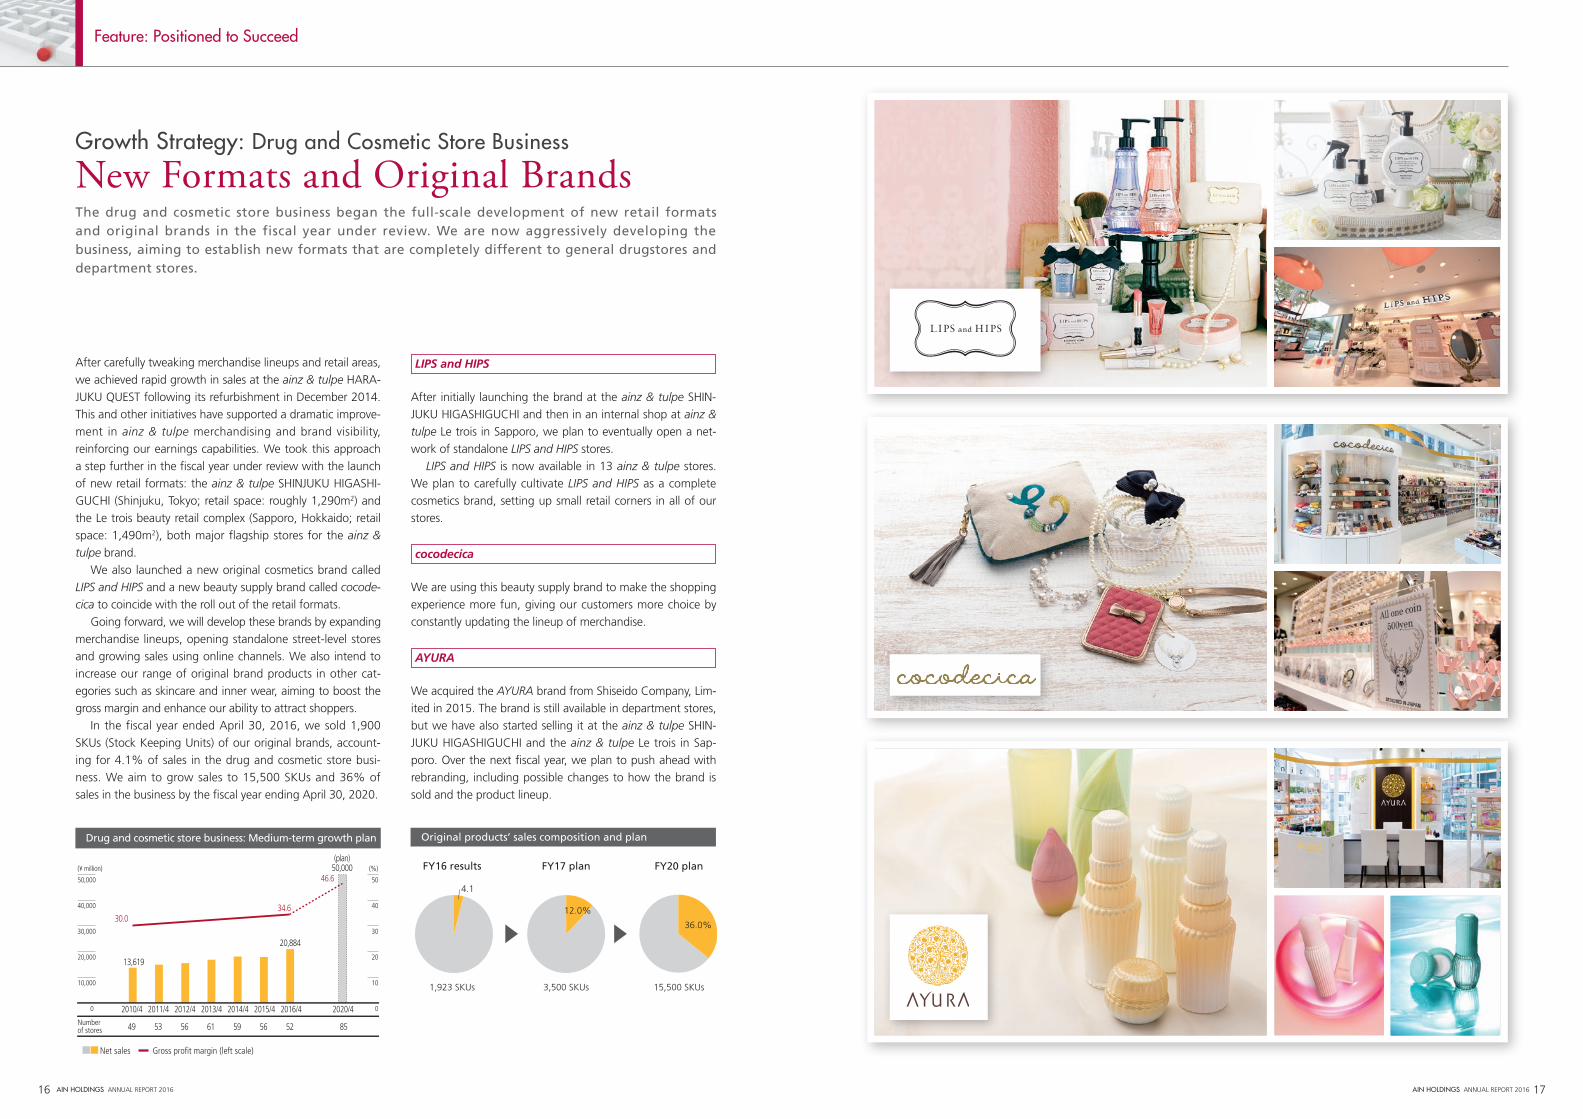
After carefully tweaking merchandise lineups and retail areas, we achieved rapid growth in sales at the ainz & tulpe HARA-JUKU QUEST following its refurbishment in December 2014. This and other initiatives have supported a dramatic improve-ment in ainz & tulpe merchandising and brand visibility, reinforcing our earnings capabilities. We took this approach a step further in the fiscal year under review with the launch of new retail formats: the ainz & tulpe SHINJUKU HIGASHI-GUCHI (Shinjuku, Tokyo; retail space: roughly 1,290m2) and the Le trois beauty retail complex (Sapporo, Hokkaido; retail space: 1,490m2), both major flagship stores for the ainz & tulpe brand. We also launched a new original cosmetics brand called LIPS and HIPS and a new beauty supply brand called cocode-cica to coincide with the roll out of the retail formats. Going forward, we will develop these brands by expanding merchandise lineups, opening standalone street-level stores and growing sales using online channels. We also intend to increase our range of original brand products in other cat-egories such as skincare and inner wear, aiming to boost the gross margin and enhance our ability to attract shoppers. In the fiscal year ended April 30, 2016, we sold 1,900 SKUs (Stock Keeping Units) of our original brands, account-ing for 4.1% of sales in the drug and cosmetic store busi-ness. We aim to grow sales to 15,500 SKUs and 36% of sales in the business by the fiscal year ending April 30, 2020.
LIPS and HIPS
After initially launching the brand at the ainz & tulpe SHIN-JUKU HIGASHIGUCHI and then in an internal shop at ainz & tulpe Le trois in Sapporo, we plan to eventually open a net-work of standalone LIPS and HIPS stores. LIPS and HIPS is now available in 13 ainz & tulpe stores. We plan to carefully cultivate LIPS and HIPS as a complete cosmetics brand, setting up small retail corners in all of our stores.
cocodecica We are using this beauty supply brand to make the shopping experience more fun, giving our customers more choice by constantly updating the lineup of merchandise.
AYURA
We acquired the AYURA brand from Shiseido Company, Lim-ited in 2015. The brand is still available in department stores, but we have also started selling it at the ainz & tulpe SHIN-JUKU HIGASHIGUCHI and the ainz & tulpe Le trois in Sap-poro. Over the next fiscal year, we plan to push ahead with rebranding, including possible changes to how the brand is sold and the product lineup.
50,000
40,000
20,000
30,000
10,000
0 2010/4 2011/4 2012/4 2013/4 2014/4 2015/4 2016/4 2020/4
(¥ million)
Net sales
13,619
49 53 56 61 59 56 52 85
20,884
50,000(plan)
Numberof stores
30.034.6
46.6
Gross pro�t margin (left scale)
50
30
40
10
20
0
(%)
Drug and cosmetic store business: Medium-term growth plan
4.1
12.0%
36.0%
Urban ainz & tulpe
FY16 results FY17 plan FY20 plan
Suburbandrugsotre
1,923 SKUs 3,500 SKUs 15,500 SKUs
Original products’ sales composition and plan

REMUNERATION FOR DIRECTORS AND AUDITORS
The maximum total amount of remuneration for directors was determined by a resolution at the 44th Ordinary General Meeting of Shareholders held on July 30, 2013 to be ¥300 million annually (does not include payments made to directors for their duties as employees; the maximum total amount for outside directors was determined to be ¥50 million annually). The maximum total amount of remuneration for corporate auditors was set at ¥30 million annually at the 22nd Ordinary General Meeting of Shareholders held on July 30, 1991.The actual amount each year is determined within this limit via discussions among the corporate auditors. The amount of remuneration for directors and corporate auditors for the year ended April 2016 is as follows:
STATUS OF ACCOUNTING AUDITS
Three certified public accountants from ERNST & YOUNG SHINNIHON LLC conducted the accounting audits of AIN HOLDINGS based on the Companies Act and Financial Instruments and Exchange Act. Audit fees for the year ended April 2016 are as follows:
OUTSIDE DIRECTORS AND OUTSIDE CORPORATE AUDITORS
The Board of Directors is comprised of 10 members, including three outside directors. Two of the Company’s three corporate auditors are outside corporate auditors. There are no conflicts of interest between the Company and its outside directors and outside corporate auditors. The outside directors and outside corporate auditors have a number of functions and roles to fulfill in the Group’s corporate governance system. Drawing on their specialist knowledge and experience, they contribute to the Group’s business strategy, discussions on board resolutions, and internal control mainly by monitoring business execution and providing input at meetings of the Board of Directors from a neutral, independent and objective standpoint. The Company has no specific standards in place at the moment, but the basic policy for appointing outside directors and outside corporate auditors is to ensure they can effectively fulfill the above roles. Four outside directors and one outside corporate auditor have been designated as independent officers in accordance with the provisions of the Tokyo Stock Exchange.
ItemTotal
remuneration(¥ million)
Remuneration by type (¥ million) Number
of eligible individualsBasic
remuneration Bonus
Directors (excluding outside directors)
202 175 27 10
Corporate auditors (excluding outside corporate auditors)
6 6 – 1
Outside directors and outside corporate auditors
17 17 – 5
AIN HOLDINGS assumes responsibility for people’s health and the well-being of the wider community through its business activities. We promote a highly efficient and transparent management system and implement ongoing initiatives toward enhancement of corporate governance.
Dispensing pharmacies and drug and cosmetic store chains are the key business areas being developed by AIN HOLDINGS. Both of these businesses are characterized by a responsibility towards people’s health, and as such, we recognize the indispensability of continuing with sound and transparent business activities that prioritize compliance. We have adopted a corporate auditor system to oversee not only key management decisions and the business execution of directors, but also general corporate management. In order to ensure the effective mutual management oversight of directors, the Board of Directors convenes more than once a
month, while a management meeting is held for directors and the standing corporate auditor on a weekly basis. To minimize potential risks, the Internal Audit Office ensures comprehensive compliance with basic pharmacy regulations, while the Safety Policy Office conducts analysis and implements measures to prevent drug dispensing errors. As part of efforts to enhance corporate governance, we have established a Compliance Committee to promote and embed systems that ensure compliance with business ethics, laws and regulations. The committee is made up of all the Company’s directors and auditors and legal advisors.
18 AIN HOLDINGS ANNUAL REPORT 2016 AIN HOLDINGS ANNUAL REPORT 2016 19
Board of DirectorsOutside Directors
Board ofManaging Directors
ManagementMeeting
General Meeting of Shareholders
Group Companies
Board ofCorporate Auditors Accounting Auditors
AppointmentAppointment
Audit Audit
AuditOperational Support
DivisionOperating Management
DivisionStore Development Division
Appointment
Reporting Cooperation
Reporting
Internal Audit Of�ce
Appointment Appointment Appointment
Reporting
ComplianceCommittee
RepresentativeDirectors
Business executionExecutive Of�cers
Guidance Reporting
(¥ thousand)
Compensation paid for audit certification activities
Compensation paid for * non-audit activities
The Company 41,700 3,710Consolidated subsidiaries – –
Total 41,700 3,710
* The Company pays fees to ERNST & YOUNG SHINNIHON LLC for advisory services related to compliance with the Act on the Use of Numbers to Identify a Specific Individual in the Administrative Procedure.
Corporate Governance
(As of July 28, 2016)
Corporate governance structure Corporate Auditor System
Chairman of the Board Kiichi Otani
Number of directors 10 (including 3 outside directors)
Number of corporate auditors 3 (including 2 outside corporate auditors)
Board of Directors meetings in fiscal 2015 Number of meetings: 16 (more than once every month)Examples of resolutions: Annual budget, issues related to new businesses, store openings
Outside Director attendance at Board of Directors meetings: 81%
Outside Corporate Auditor attendance at Board of Directors meetings: 100%
Board of Corporate Auditor meetings in fiscal 2016
Number of meetings: 16Examples of resolutions: Audit policy, audit plans and business division audits
Management meetings in fiscal 2016 52
Key meetings attended by corporate auditors Board of Directors meetings, Board of Corporate Auditor meetings, Management meetings
Independent director appointment Outside directors Ko Mori, Seiichiro Sato and Yasuyuki Hamada have all been designated as independent officers in accordance with the provisions of the Tokyo Stock Exchange.
Systems to strengthen and promote Group management Group management meetings (weekly)
Accounting auditor ERNST & YOUNG SHINNIHON LLC
Reasons for selection of outside directors
Ko Mori
Ko Mori was appointed as an outside director to broadly contribute to the Company’s activities by providing advice to the Board of Directors and other bodies and by monitoring business execution, drawing on his extensive knowledge and experience as the manager of a major trading company. Mr. Mori is judged to be a highly independent and objective appointment, as he has no affiliation with the parent company, its subsidiaries, major corporate shareholders or key customers of the Group.
Seiichiro Sato
Seiichiro Sato was appointed as an outside director to broadly contribute to the Company’s activities by providing advice to the Board of Directors and other bodies and by monitoring business execution, drawing on his specialist knowledge and experience from working in the legal and planning departments of a major retailer. Mr. Sato previously worked for Ito-Yokado Co., Ltd., which has a business relationship and lease contracts with the Company. However, he is judged to be a sufficiently independent appointment, as the interdependence of Ito-Yokado Co., Ltd. and the Company is low due to a minimal level of business between the two companies.
Yasuyuki Hamada
Yasuyuki Hamada was appointed as an outside director to broadly contribute to the Company’s activities by providing advice to the Board of Directors and other bodies and by monitoring business execution. Although Mr. Hamada has no experience of business management, he is able to draw on his specialist knowledge and experience as an academic, particularly in the field of economics and finance. Since April 2010, Mr. Hamada has been an emeritus professor at Hokkaido University, which has received donations from the Company in the past. However, he is judged to be a sufficiently independent appointment, as the purpose of the donations was limited and they were not directly related to Mr. Hamada’s research activities.
Reasons for selection of outside corporate auditors
Akira Ibayashi
A k i r a I b a y a s h i w a s a p p o i n t e d a s a n outside corporate auditor to contribute to improvements in sound and efficient business management, drawing on his special ist knowledge f rom work ing at f inanc ia l institutions and his experience in business management.
Osamu Muramatsu
Osamu Muramatsu was appointed as an outside corporate auditor to contribute to improvements in sound and efficient business management, drawing on his special ist knowledge from working at a major securities firm, experience in business management and track record as an outside auditor for the Group.
OUTLINE OF CORPORATE GOVERNANCE
BASIC POLICY FOR CORPORATE GOVERNANCE

Board of Directors and Corporate Auditors
(As of July 29, 2016)
20 AIN HOLDINGS ANNUAL REPORT 2016 AIN HOLDINGS ANNUAL REPORT 2016 21
Kiichi OtaniPresident and Representative Director (3,238,400 shares)
July 1980 President and Representative Director of Otani Corporation (now AIN HOLDINGS INC.)
November 1981 Director of newly established Daiichi Medical Testing Laboratories Co., Ltd. (Asahikawa, now AIN HOLDINGS INC.)
July 1983 President and Representative Director of Daiichi Medical Testing Laboratories Co., Ltd.
May 1985 Managing Director of the CompanyMay 1988 President and Representative Director
(current post)June 2009 Director of Seven Health Care Co., Ltd.
(now Seven Bi no Garden Co., Ltd.)
Hiromi KatoExecutive Vice President and Representative Director (28,600 shares)
April 1973 Joined Iwasaki Publishing Co., Ltd.May 1983 Joined Daiichi Medical Testing
Laboratories Co., Ltd. (Asahikawa, now AIN HOLDINGS INC.)
April 1989 General Manager of Administrative Department
July 1992 DirectorMay 1995 General Manager of Personnel
DepartmentJuly 1996 Managing DirectorSeptember 1996 General Manager of Management
DepartmentMay 2003 Senior Managing DirectorMay 2012 Executive Vice President and
Representative Director (current post)
Masahito SakuraiRepresentative Senior Managing Director (1,000 shares)
April 1972 Joined Ministry of Health and Welfare (now Ministry of Health, Labour and Welfare)
April 1987 Head of Administration Section, Fund for Drug ADR Relief
July 1996 Head of Air Protection Section, Japan Environment Agency
July 1998 Head of Regional Medical Affairs Office for Tokai Hokuriku
January 2001 Retired from Ministry of Health and Welfare
February 2001 Commissioner of All-Japan Federation of National Health Insurance Organizations
October 2008 Joined the CompanyJuly 2009 Senior Managing DirectorNovember 2015 Senior Managing Director and
Representative Director (current post)
Rieko KimeiDirector Head of Personnel Department (6,000 shares)
April 1986 Joined The Daiei, Inc. December 1995 Joined Daiichi Medical Testing
Laboratories Co., Ltd. (now AIN HOLDINGS INC.)
May 2003 General Manager of Drug and Cosmetic Store Business, Merchandising Business
May 2004 General Manager of Personnel Department
August 2009 Executive OfficerJuly 2014 Director (current post)July 2016 President and Representative Director of
AYURA LABORATORIES INC. (current post)
Ko MoriDirector Outside Independent (- shares)
April 1971 Joined Marubeni Corporation April 2002 Executive Officer and General Manger
of Chemicals DivisionApril 2004 Managing Executive OfficerJune 2006 Representative Director and Senior
Managing Executive Officer, Materials Division
June 2007 President and Representative Director of Marubeni Safenet Co., Ltd.
July 2012 Director of the Company (current post)
Seiichiro SatoDirector Outside Independent (- shares)
April 1982 Joined the Finance Ministry (now the Ministry of Finance)
October 1998 Joined Price Waterhouse & Co. (now PricewaterhouseCoopers LLC)
September 2001 Joined Yamato Mutual Life Insurance Co. (now The Prudential Gibraltar Financial Life Insurance Co., Ltd.)
September 2003 Joined Ito-Yokado Co., Ltd. December 2008 Joined Seven & i Holdings Co., Ltd. July 2015 Outside Director of the Company
(current post)
Yasuyuki HamadaDirector Outside Independent (2,000 shares)
April 1991 Professor of Faculty of Economics, Hokkaido University
April 1997 Special Assistant for the president of same university
April 2003 Professor of Advanced Scientific Research Center, Hokkaido University (concurrent post)
April 2010 President of Sapporo International University
Emeritus Professor of Hokkaido University
April 2014 President and Charman of Dohto University
December 2014 President of Hamanasu Foundation (current post)
July 2015 Outside Director of the Company (current post)
Shoichi ShudoRepresentative Senior Managing Director In charge of development (10,400 shares)
April 1978 Joined Sapporo Medical Testing Laboratories Co., Ltd.
March 1982 Joined Daiichi Medical Testing Laboratories Co., Ltd. (Asahikawa, now AIN HOLDINGS INC.)
May 1993 Head of Corporate Planning Division July 2000 DirectorMay 2003 Managing DirectorMay 2004 General Manager of Dispensing
Pharmacy BusinessMay 2012 Senior Managing DirectorNovember 2015 Senior Managing Director and
Representative Director (current post)
Toshihide MizushimaRepresentative Senior Managing Director In charge of business operations and business support (27,600 shares)
April 1982 Joined SSP Co., Ltd. April 1986 Joined Otani Corporation (now AIN
HOLDINGS INC.)July 2000 DirectorFebruary 2001 General Manager of Drug and
Cosmetic Store BusinessMay 2003 Managing DirectorJune 2009 President and Representative Director
of Seven Health Care Co., Ltd. (now Seven Bi no Garden Co., Ltd.)
May 2012 Senior Managing Director of the Company, Director of Seven Bi no Garden Co., Ltd. (current post)
November 2015 Senior Managing Director and Representative Director of the Company (current post)
Miya OishiManaging Director Senior General Manager, Operations Department (1,000 shares)
September 1990 Joined KYOEIDO Co., Ltd. July 1993 Director of DAICHIKU Co., Ltd. (current
post)July 2008 Representative Director of same
companyApril 2011 Vice President and Representative
Director of AIN MEDICAL SYSTEMS INC. (now AIN HOLDINGS INC.)
February 2012 President and Representative Director of same company
July 2012 Director of the CompanyJuly 2014 Managing Director (current post)November 2015 President and Representative Director
of AIN PHARMACIEZ INC. (current post)
Koichi KawamuraCorporate Auditor (full-time) (5,000 shares)
October 1985 Joined Daiichi Medical Testing Laboratories Co., Ltd. (now AIN HOLDINGS INC.)
July 1997 AuditorMay 2003 General Manager of Administrative
DepartmentJuly 2012 Corporate Auditor (current post)
Akira IbayashiCorporate Auditor Outside (- shares)
April 1963 Joined The Hokkaido Bank, Ltd. June 2001 Director, Executive Officer and Deputy
President June 2003 Retired from The Hokkaido Bank, Ltd.July 2012 Outside Corporate Auditor of the
Company (current post)
Osamu MuramatsuCorporate Auditor Outside Independent (- shares)
April 1972 Joined Nomura Securities Co., Ltd. June 1994 Head of Sapporo BranchJune 1996 DirectorOctober 2007 Retired from Nomura Securities Co., Ltd. August 2011 President and Representative Director
of Executive Partners, Inc.June 2012 Outside Corporate Auditor of Asahi
Pharmacy Co., Ltd. (current post)
*Figures in brackets show the number of AIN HOLDINGS shares held as of April 30, 2016.
BOARD OF DIRECTORS CORPORATE AUDITORS
22 AIN HOLDINGS ANNUAL REPORT 2016 AIN HOLDINGS ANNUAL REPORT 2016 23
Financial Section
Management’s Discussion and Analysis of Financial Condition and Results of Operations
BUSINESS ENVIRONMENT SURROUNDING THE AIN HOLDINGS GROUP
The core business of the AIN HOLDINGS Group (the Group) is the dispensing pharmacy business that includes preparing and dispensing drugs based on prescriptions. Drug prices and dispensing fees* are stipulated by the Ministry of Health, Labour and Welfare. The Japanese government is progressively revising drug prices and dispensing fees as part of its policy to curb national medical expenses. Earnings at dispensing pharmacies are the total of dispensing fees and sales of drugs, so earnings are affected by these revisions. Under drug price revisions in April 2016, the average drug price was reduced by 5.57%. Including special reductions for high-cost drugs, the average drug price was cut by 7.77%. Also, under dispensing fee revisions, the role of pharmacies located near hospitals was reevaluated, but in order to realize patient-focused non-hospital dispensing services, pharmacists and dispensing pharmacies are now being required to play a primary care role in healthcare provision. The gap in performance is widening between companies in the industry, which are struggling with changes to their profit structures resulting from revisions to dispensing fees. However, the Group regards these changes in the operating environment as a perfect opportunity to push ahead with its strategy of further increasing profitability.
* Dispensing fees comprise pharmaceutical management fees and technical fees for pharmacists.
BUSINESS OVERVIEW FOR THE FISCAL YEAR UNDER REVIEW
During the fiscal year ended April 30, 2016, corporate earnings in Japan improved amid largely steady production activity and consumer spending. However, the impact of the Kumamoto Earthquake in 2016 is a potential risk for the economy going forward. In this economic environment, the Group worked to expand its business and increase earnings. Specifically, the Group opened new dispensing pharmacies and used M&A to expand the business. It also developed its urban drug and cosmetic store business. In addition, effective from November 1, 2015, the Group moved to a holding company structure. By separating the Group’s management and business execution functions, the Group aims to enhance corporate governance, clarify the authority and responsibility of each business segment and promote greater management autonomy, creating the foundations for further business expansion. For the fiscal year under review, net sales rose 25.0% year on year to ¥234,843 million and operating income increased 27.7% to ¥14,619 million. Profit attributable to owners of parent increased 27.8% to ¥7,917 million, a record high.
As of the end of the fiscal year, the number of stores in the Group totaled 933, a net increase of 123 stores from the end of the previous fiscal year.
BUSINESS RESULTS BY SEGMENT
Dispensing Pharmacy BusinessIn the dispensing pharmacy business, sales continued to rise at existing dispensing pharmacies, supported by an increase in average sales per prescription due to growth in prescriptions for new medicines. To ensure our pharmacists and dispensing pharmacies fulfill their role at the heart of local communities, the Group continues to build links with local healthcare service providers, mainly in the area of home-based dispensing, step up the integration and continuous management of drug information using patient medication notebooks and other means, and promote wider use of generic drugs. The shortage of pharmacists in the healthcare sector is becoming more serious. To address this issue, the Group is working to attract new graduates, with 375 new pharmacist graduates joining the Group in April 2016. The Group is also upgrading pharmacist training programs to enhance their capabilities so that they can fill their role as primary care pharmacists. In business development, the Group continued to push ahead with business expansion by opening new dispensing pharmacies and using M&A, including the acquisition of NP HOLDINGS Co., Ltd. (Takamatsu-shi, Kagawa Prefecture) in November 2015. NP HOLDINGS is the largest dispensing pharmacy chain in the Shikoku region and is now a subsidiary of the Group. During the fiscal year under review, the Group opened 142 dispensing pharmacies, including M&A deals, and closed 15 dispensing pharmacies, resulting in a total of 881.
The dispensing pharmacy business reported sales and profit growth with sales rising 24.8% year on year to ¥211,009 million, and segment income increasing 33.0% to ¥19,219 million.
Drug and Cosmetic Store BusinessIn the drug and cosmetic store business, the market environment remained challenging due to a narrowing competitive gap between companies in the sector and the emergence of new competitors from sector consolidation and realignment that also extends to other business sectors. Against this backdrop, the Group continued to open ainz & tulpe urban drug and cosmetic stores, strengthened merchandise lineups, particularly drug and cosmetics products, and worked to capture inbound demand. As a result, sales at existing drug and cosmetic stores increased year on year. In addition, the Group is working to strengthen the ainz & tulpe format with the launch of two proprietary merchandise brands, LIPS and HIPS and cocodecica. The Le trios retail facility (Chuo Ward, Sapporo), which was opened in September 2015, is steadily gaining ground as a landmark beauty destination, supported by efforts to promote it as a mixed-use integrated beauty complex in Sapporo’s Odori area. In addition, in February 2016, the Group opened ainz & tulpe NEW CHITOSE AIRPORT (Chitose-shi, Hokkaido) in the airport’s international passenger terminal, in order to further strengthen efforts to capture inbound demand. During the fiscal year under review, the Group opened a number of ainz & tulpe stores, including ainz & tulpe MARUI CITY YOKOHAMA (Nishi Ward, Yokohama), ainz & tulpe SHINJUKU HIGASHIGUCHI (Shinjuku Ward, Tokyo), ainz & tulpe Le trois (Chuo Ward, Sapporo), ainz & tulpe NEW CHITOSE AIRPORT (Chitose-shi, Hokkaido), and ainz & tulpe OMIYA MARUI (Omiya Ward, Saitama). At the same time, the Group closed nine stores, mainly in suburban
2005/4 2006/4 2007/4 2008/4 2009/4 2010/4 2011/4 2012/4 2013/4 2014/4 2015/4 2016/4For the year:
Net sales 57,091 76,303 81,307 106,231 115,387 125,495 129,387 142,790 154,560 170,225 187,904 234,843Selling, general and administrative expenses 5,230 7,145 7,970 9,203 9,948 10,744 11,981 12,839 14,740 15,635 17,509 23,915Operating income 2,875 3,083 2,888 4,444 5,296 6,492 8,107 10,253 9,701 10,113 11,452 14,619Profit attributable to owners of parent 930 1,215 1,010 1,615 2,127 3,131 3,916 4,899 5,075 5,259 6,197 7,917Capital expenditures*1 1,536 2,087 1,620 1,914 2,891 2,573 2,750 5,870 7,235 6,328 6,413 11,209Depreciation and amortization*1 458 648 773 968 1,119 1,286 1,560 1,749 2,212 2,258 2,553 3,259
At the end of the year:Equity capital*2 9,095 10,352 10,710 12,040 16,071 21,445 29,450 33,695 38,312 42,122 47,928 53,258Total net assets 9,095 10,352 11,326 12,707 16,109 21,492 29,498 33,745 38,356 42,240 48,046 53,324Total assets 38,887 41,669 49,849 57,546 62,032 65,898 76,940 85,908 95,839 101,382 114,149 139,888Number of shares outstanding (shares) 11,210,350 11,304,000 11,320,000 11,361,000 12,831,376 14,101,164 15,941,004 15,940,790 15,940,740 15,854,190 31,707,617 31,707,617Number of employees (persons) 1,446 1,684 1,947 2,582 2,741 2,918 3,104 3,326 3,551 3,806 4,429 5,511Number of stores: Dispensing pharmacy business 193 218 247 356 375 397 448 494 560 616 754 881Number of stores: Drug and cosmetic store business 44 43 43 45 46 49 53 56 61 59 56 52
Per share information (¥):Net income*3 39.96 52.26 44.67 71.18 85.37 114.04 127.83 153.67 159.18 165.04 195.45 249.69Net assets*3 403.84 456.21 473.08 529.89 626.27 760.40 923.73 1,056.89 1,201.71 1,328.43 1,511.57 1,679.69Cash dividends*3 7.5 9.0 9.0 10.0 15.0 20.0 22.5 25.0 30.0 30.0 30.0 40.0
Stock information (based on the closing price as of April 30) (¥):Stock price 2,050 2,370 1,500 1,490 1,481 2,920 3,115 4,290 4,765 4,495 4,245 5,340
Ratios (%):Operating margin 5.0 4.0 3.6 4.2 4.6 5.2 6.3 7.2 6.3 5.9 6.1 6.2Return on sales*4 1.6 1.6 1.2 1.5 1.8 2.5 3.0 3.4 3.3 3.1 3.3 3.4Return on assets (ROA)*5 2.9 3.0 2.2 3.0 3.6 4.9 5.5 6.0 5.6 5.3 5.8 6.2Return on equity (ROE)*6 10.9 12.5 9.6 14.2 15.1 16.7 15.4 15.5 14.1 13.1 13.8 15.6Shareholders’ equity ratio 23.4 24.8 21.5 20.9 25.9 32.5 38.3 39.2 40.0 41.5 42.0 38.1
11-YEAR FINANCIAL SUMMARY
Note: Amounts of less than one million yen were rounded down.
*1: The amounts of capital expenditures and depreciation and amortization prior to the fiscal year ended April 30, 2007 are on a non-consolidated basis.
*2: Equity capital = Total net assets – Non-controlling interests
*3: The Company conducted a 2-for-1 stock split of common shares with an effective date of October 1, 2014. Net income per share, net assets per share and cash dividends per share have been adjusted retroactively to reflect the impact of the stock split.
*4: Return on sales = Profit attributable to owners of parent / Net sales × 100
*5: Return on assets = Profit attributable to owners of parent / Total assets (yearly average) × 100
*6: Return on equity = Profit attributable to owners of parent / Equity capital (yearly average) × 100
(¥ million)
24 AIN HOLDINGS ANNUAL REPORT 2016 AIN HOLDINGS ANNUAL REPORT 2016 25
Financial Section
locations, resulting in a total of 52 stores. The drug and cosmetic store business reported an increase in sales of 17.3% year on year to ¥20,884 million. However, segment loss was ¥459 million, compared with segment income of ¥117 million a year earlier.
Other BusinessesNet sales from other businesses rose 184.2% year on year to ¥2,949 million but segment loss was ¥1,142 million compared with the loss of ¥614 million a year earlier.
FINANCIAL POSITION
The balance of total assets at the end of the fiscal year under review increased by ¥25,738 million to ¥139,888 million. This mainly reflected increases in cash on hand and in banks and increases in property, notes and accounts receivable – trade, inventories, plant and equipment such as land, buildings and structures, and goodwill due to the Group’s business expansion through new store openings and M&A. Consolidated current assets at the end of the fiscal year under review increased by ¥10,227 million to ¥56,593 million compared to ¥46,365 million at the end of the previous fiscal year. This mainly reflected cash on hand and in banks of ¥22,647 million, an increase of ¥3,093 million compared with the previous fiscal year, notes and accounts receivable of ¥12,385 million, an increase of ¥4,016 million due to business expansion. Fixed assets at the end of the fiscal year under review increased by ¥15,510 million to ¥83,294 million compared to ¥67,783 million at the end of the previous fiscal year. This was mainly due to an increase in fixed assets related to investment in new stores and expansion in the asset base at consolidated subsidiaries that became part of the Group through M&A deals. Property, plant and equipment, mainly buildings and structures, increased by ¥5,680 million to ¥28,153 million, while goodwill rose ¥6,997 million to ¥33,337 million. Liabilities increased by ¥20,460 million to ¥86,563 million, compared with ¥66,103 million at the end of the previous fiscal year. This primarily reflected accounts payable of ¥39,987 million, up ¥8,161 million year on year, and long-term debt of ¥14,854 million, up ¥7,214 million year on year due to debt procurement to fund M&A deals. The balance of current liabilities increased by ¥12,311 million from the previous year-end balance of ¥54,433 million to ¥66,744 million, and the balance of long-term liabilities increased by ¥8,148 million from the previous year-end balance of ¥11,669 million to ¥19,818 million. Net assets increased by ¥5,278 million to ¥53,324 million compared to ¥48,046 million at the end of the previous fiscal year. As a result of the above factors, the shareholders’ equity ratio decreased 3.9 percentage points to 38.1%, compared with 42.0% at the end of the previous fiscal year. ROA improved 0.4 percentage points to 6.2%, while ROE rose 1.8 percentage points to 15.6%.
BASIC POLICIES FOR PROFIT DISTRIBUTION
The Company considers the return of profits to shareholders as an important management issue. Our basic policy is to repay our investors proportionate to the profit we make, and to maintain these payments at stable levels.
Internal reserves are held to strengthen the corporate structure and in preparation for new store openings and future development of the business. We will make effective use of these funds to generate profits to be returned to shareholders in the future. The Company’s basic policy is to pay dividends from retained earnings once per year at the end of the fiscal year. For the fiscal year under review, the Company paid a dividend from retained earnings of ¥40 per share, compared with the previous fiscal year’s ordinary dividend of ¥30. In view of our profit forecasts, plans for investment and other factors, we intend to pay an ordinary dividend from retained earnings of ¥50 per share in the fiscal year ending April 30, 2017, an increase of ¥10 from the fiscal year ended April 30, 2016.
CASH FLOWS
In the fiscal year under review, cash and cash equivalents (“cash”) increased ¥2,503 million (12.9%) year on year to ¥21,892 million. This reflected operating cash flow generated by dispensing pharmacy and drug and cosmetic store businesses, which was mainly used to actively invest in new store openings and M&A. Some cash was also retained to provide constant access to a certain level of funds. Cash flows from each category and their relevant factors are as follows:
Cash Flows from Operating ActivitiesNet cash provided by operating activities was ¥21,352 million, an increase of 43.9% year on year. The main items that were positive for cash flow were income before income taxes of ¥13,949 million, as well as depreciation and amortization of ¥3,259 million, amortization of goodwill of ¥2,938 million, and an increase in accounts payable of ¥3,031 million related to business expansion through new store openings and M&A. The main items that were negative for cash flow was income taxes paid of ¥4,579 million.
Cash Flows from Investing ActivitiesNet cash used in investing activities totaled ¥20,877 million, an increase of 43.4% year on year. This mainly reflected payments of ¥7,407 million for purchases of property, plant and equipment related to the opening of new urban drug stores, retail facilities and dispensing pharmacies, and ¥10,954 million for purchases of shares in subsidiaries due to changes in the scope of consolidation related to shares acquired in 28 companies through M&A deals.
Cash Flows from Financing ActivitiesNet cash provided by financing activities rose 441.2% year on year to ¥2,028 million. This was mainly attributable to net short-term debt repayment of ¥2,085 million and net long-term debt procurement of ¥7,367 million. Cash dividends paid of ¥951 million also had a negative impact on cash flows from financing activities.
BUSINESS AND OTHER RISKS
The following factors may affect the Group’s operating results, stock price and financial position. Statements in the text referring to the future reflect the judgment of the Group at the end of the fiscal year under review.
1. Laws and regulations a. Regulations under the Law for Ensuring the Quality, Efficacy, and Safety of Pharmaceuticals and Medical DevicesWe operate dispensing pharmacy business under various permits, licenses, registrations and notifications including those set forth by the Law for Ensuring the Quality, Efficacy, and Safety of Pharmaceuticals and Medical Devices (the Pharmaceutical and Medical Device Law), the Health Insurance Law, and the Pharmacists Law, under the supervision of the Ministry of Health, Labour and Welfare, and of prefectural health and welfare departments. The drugstore business in our drug and cosmetic store business also involves drug sales, which are similarly regulated under the Pharmaceutical and Medical Device Law.
b. Easing of drug sales regulationsIn sales of over-the-counter (OTC) drugs, the Pharmaceutical and Medical Device Law classifies drugs into different categories based on risk. Only qualified pharmacists are permitted to sell drugs requiring guidance and category 1 drugs, while registered sellers, as well as pharmacists, are permitted to sell category 2 and category 3 drugs. In addition, the “Law for Partial Revision of the Pharmaceutical Affairs Law” (enacted June 12, 2014) ended restrictions on the sale of OTC drugs online. Factors such as the entry into the market of firms from other industries as a result of a continuing trend in the future to deregulate drug sales may affect the Group’s performance.
2. Details of businessThe Group’s dispensing pharmacy business operates a chain of dispensing pharmacies. As the dispensing pharmacy business accounted for 89.9% of net sales in the fiscal year under review, we plan to continue the multi-store operation mainly based on dispensing pharmacies. Accordingly, the Group’s operating results may be affected by the success or failure of the store opening policies and by trends in store openings by competitors in the same industry. Furthermore, sales of dispensing pharmacies significantly depend on the medical institutions that write prescriptions. Therefore, uncertainties such as the issuance of non-hospital prescriptions by the medical institutions or suspension/discontinuation of operations thereof may affect the Group’s performance.
3. Industry trendsThe revenues in our dispensing pharmacy business come from pharmacy operations involving the dispensing and supplying of drugs based on prescriptions. The drug prices and dispensing fees are set by the Ministry of Health, Labour and Welfare. As a way to contract medical expenses, both medical treatment fees and drug prices are being revised incrementally. In the future as well, changes in profit structure resulting from factors such as revisions in the medical treatment fee system could continue to affect the Group’s performance and financial position.
4. Securing qualified staffDispensing pharmacies and drugstores (Stores for Category 1 Drugs) are required by the Pharmaceutical and Medical Device Law to have a pharmacist on site; the Pharmacists Law stipulates that the dispensing of drugs must be handled by a pharmacist. The Group continues to have a policy of expansion by aggressively opening new stores, but if it becomes difficult to secure qualified pharmacists, this could affect our store openings and the Group’s
performance.
5. Risks of loss of trust in the Companya. Dispensing operationIn our dispensing pharmacy business, pharmacists dispense and supply prescription drugs that affect the human body. This business carries the risk that medical accidents might be caused through dispensing errors. The Group recognizes that any medical accidents could have a severely damaging effect on society’s confidence in the Group, and we place the highest priority on measures to avoid the risk from all aspects.
b. Protection of personal dataWe possess patient data in the dispensing pharmacy business, including medical histories and prescription information, and we possess personal data in the drug and cosmetic store business obtained from the Ainz Point Club Card and Tulpe Mobile Club. The Group takes all possible steps to protect personal data through personal information protection systems and the rigorous enforcement of rules on the handling of such information. Also, key subsidiary AIN PHARMACIEZ INC. has acquired Privacy Mark accreditation in the healthcare, medical and social service fields. However, we believe it is possible that any accidental or illegal leakage of personal data may not only affect the Group’s performance but also lead to a loss of society’s confidence in the Group.
6. Risk in business strategyThe Group has promoted the expansion of the business scale of dispensing pharmacies through actively promoting new store openings and M&A. Our basic policies regarding M&A strategy require us to carefully examine target companies and determine the amount to be paid for acquisitions thereof in order to stably secure a profitability level that exceeds the amortization of goodwill to be incurred. If matters do not go as planned, however, we may incur losses on valuation of shares in subsidiaries and impairment losses on goodwill, which may have an adverse impact on the Group’s operating results and financial position. 7. Interest rate risksIn the Group’s promotion of business expansion based on actively promoting new store openings and M&A, costs for ordinary store openings are covered by internal funds within the range of operating cash flow, while in large-scale M&A, costs are sometimes financed by borrowings from financial institutions. In order to ensure flexible access to funds to support these activities, the Group maintains a certain level of liquidity on its balance sheet. As of the end of the fiscal year under review, cash on hand and in banks totaled ¥22,647 million, compared with a total balance of short- and long-term debt of ¥20,544 million. We focus on the possibility of return on investment and seek to reduce interest-bearing debt through efficient investment in implementing M&A deals. However, if the Group fails to secure an adequate return on its M&A investment, or due to interest rate fluctuations associated with conditions in financial markets, the Group’s financial position and operating results including interest payable may be affected.
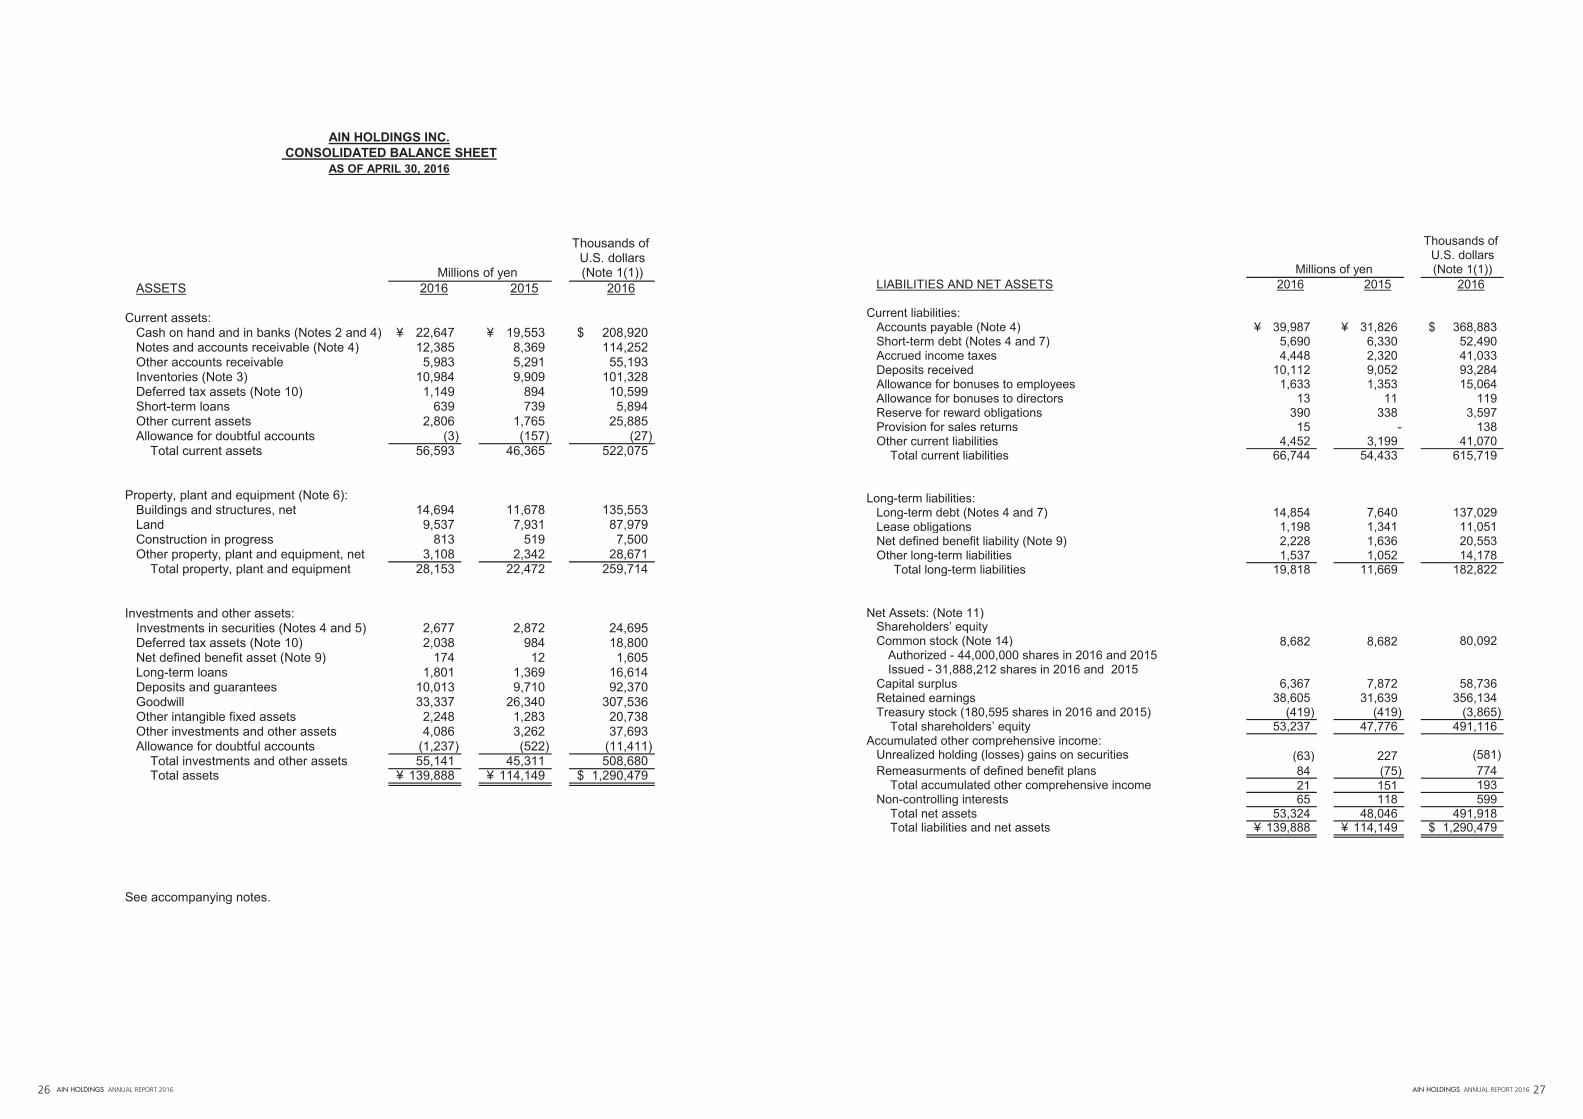
AIN HOLDINGS ANNUAL REPORT 2016 2726 AIN HOLDINGS ANNUAL REPORT 2016
ASSETS 2016 2015 2016
Current assets:¥ 22,647 ¥ 19,553 $ 208,920
Notes and accounts receivable (Note 4) 12,385 8,369 114,252Other accounts receivable 5,983 5,291 55,193Inventories (Note 3) 10,984 9,909 101,328Deferred tax assets (Note 10) 1,149 894 10,599Short-term loans 639 739 5,894Other current assets 2,806 1,765 25,885Allowance for doubtful accounts (3) (157) (27) Total current assets 56,593 46,365 522,075
Property, plant and equipment (Note 6): Buildings and structures, net 14,694 11,678 135,553Land 9,537 7,931 87,979Construction in progress 813 519 7,500
3,108 2,342 28,671 Total property, plant and equipment 28,153 22,472 259,714
Investments and other assets:Investments in securities (Notes 4 and 5) 2,677 2,872 24,695Deferred tax assets (Note 10) 2,038 984 18,800Net defined benefit asset (Note 9) 174 12 1,605Long-term loans 1,801 1,369 16,614Deposits and guarantees 10,013 9,710 92,370Goodwill 33,337 26,340 307,536Other intangible fixed assets 2,248 1,283 20,738Other investments and other assets 4,086 3,262 37,693Allowance for doubtful accounts (1,237) (522) (11,411) Total investments and other assets 55,141 45,311 508,680 Total assets ¥ 139,888 ¥ 114,149 $ 1,290,479
See accompanying notes.
Thousands of
AIN HOLDINGS INC. CONSOLIDATED BALANCE SHEET
AS OF APRIL 30, 2016
Cash on hand and in banks (Notes 2 and 4)
Other property, plant and equipment, net
U.S. dollars Millions of yen (Note 1(1))
LIABILITIES AND NET ASSETS 2016 2015 2016
Current liabilities:Accounts payable (Note 4) ¥ 39,987 ¥ 31,826 $ 368,883Short-term debt (Notes 4 and 7) 5,690 6,330 52,490Accrued income taxes 4,448 2,320 41,033Deposits received 10,112 9,052 93,284Allowance for bonuses to employees 1,633 1,353 15,064Allowance for bonuses to directors 13 11 119Reserve for reward obligations 390 338 3,597Provision for sales returns 15 - 138Other current liabilities 4,452 3,199 41,070 Total current liabilities 66,744 54,433 615,719
Long-term liabilities:Long-term debt (Notes 4 and 7) 14,854 7,640 137,029Lease obligations 1,198 1,341 11,051Net defined benefit liability (Note 9) 2,228 1,636 20,553Other long-term liabilities 1,537 1,052 14,178 Total long-term liabilities 19,818 11,669 182,822
Net Assets: (Note 11) Shareholders’ equity Common stock (Note 14) 8,682 8,682 80,092
Authorized - 44,000,000 shares in 2016 and 2015Issued - 31,888,212 shares in 2016 and 2015
Capital surplus 6,367 7,872 58,736Retained earnings 38,605 31,639 356,134Treasury stock (180,595 shares in 2016 and 2015) (419) (419) (3,865) Total shareholders’ equity 53,237 47,776 491,116
Accumulated other comprehensive income:Unrealized holding (losses) gains on securities (63) 227 (581)Remeasurments of defined benefit plans 84 (75) 774 Total accumulated other comprehensive income 21 151 193Non-controlling interests 65 118 599 Total net assets 53,324 48,046 491,918 Total liabilities and net assets ¥ 139,888 ¥ 114,149 $ 1,290,479
Thousands of U.S. dollars
Millions of yen (Note 1(1))
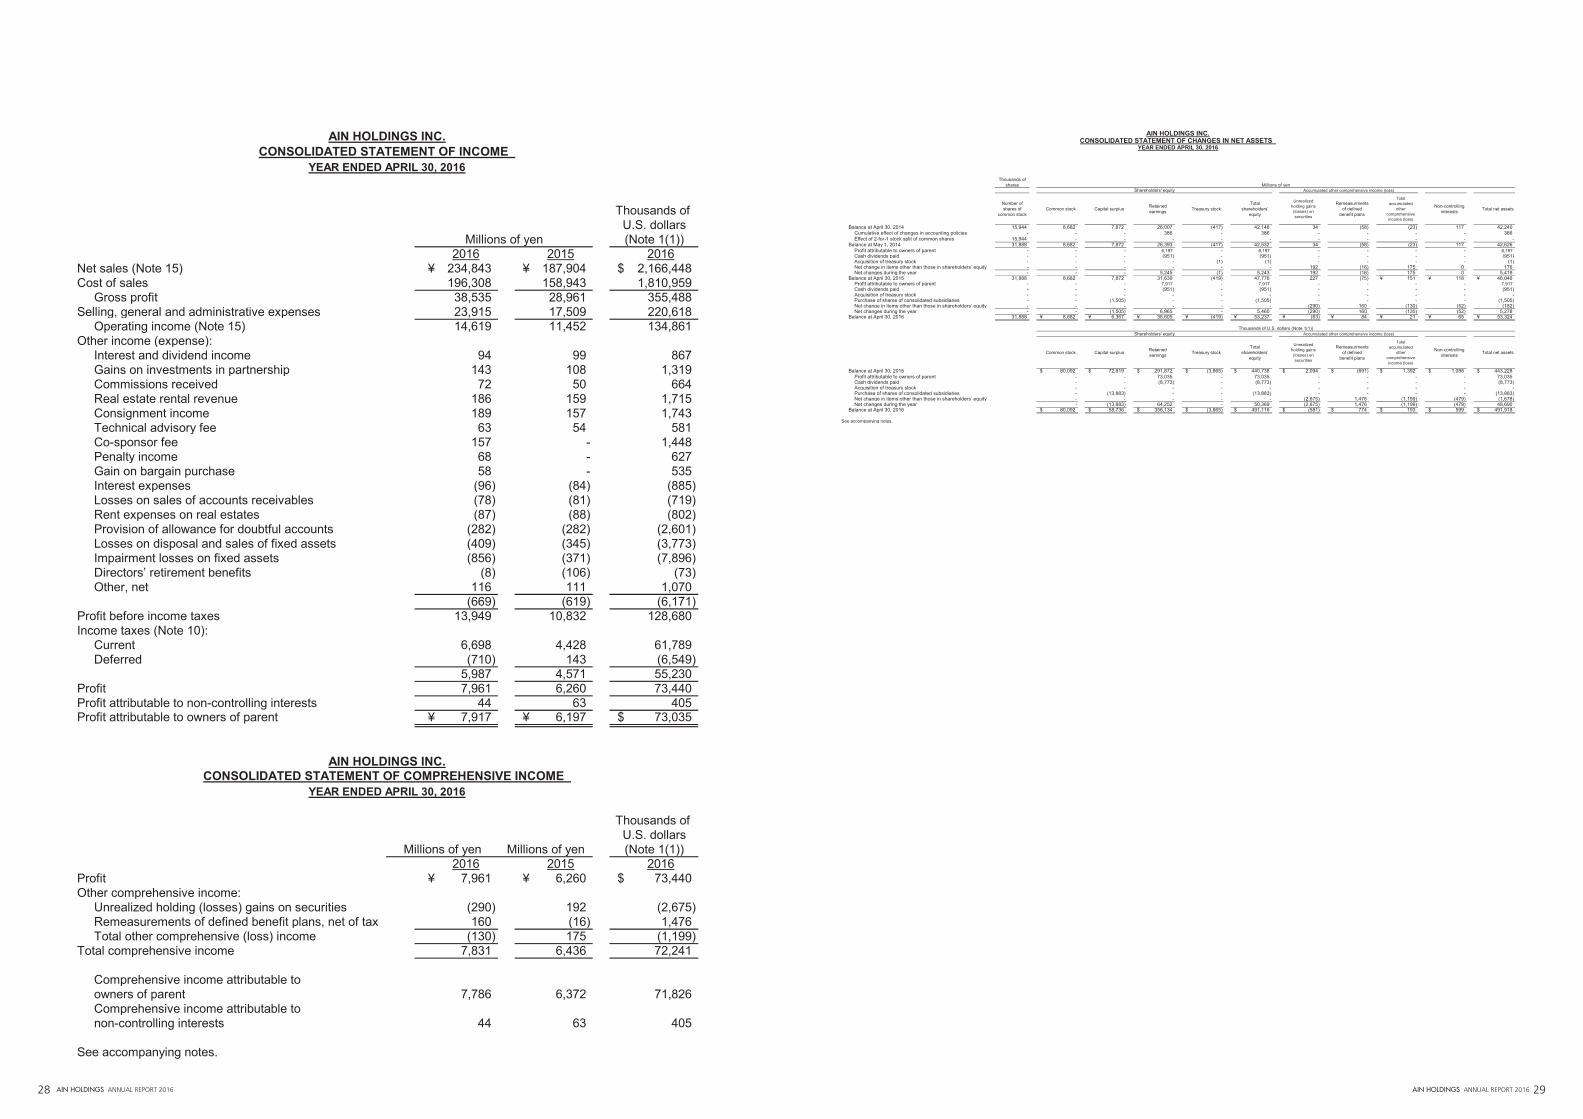
AIN HOLDINGS ANNUAL REPORT 2016 2928 AIN HOLDINGS ANNUAL REPORT 2016
2016 2015 2016Net sales (Note 15) ¥ 234,843 ¥ 187,904 $ 2,166,448Cost of sales 196,308 158,943 1,810,959
Gross profit 38,535 28,961 355,488Selling, general and administrative expenses 23,915 17,509 220,618
Operating income (Note 15) 14,619 11,452 134,861Other income (expense):
Interest and dividend income 94 99 867Gains on investments in partnership 143 108 1,319Commissions received 72 50 664Real estate rental revenue 186 159 1,715Consignment income 189 157 1,743Technical advisory fee 63 54 581Co-sponsor fee 157 - 1,448Penalty income 68 - 627Gain on bargain purchase 58 - 535Interest expenses (96) (84) (885)Losses on sales of accounts receivables (78) (81) (719)Rent expenses on real estates (87) (88) (802)Provision of allowance for doubtful accounts (282) (282) (2,601)Losses on disposal and sales of fixed assets (409) (345) (3,773)Impairment losses on fixed assets (856) (371) (7,896)Directors’ retirement benefits (8) (106) (73)Other, net 116 111 1,070
(669) (619) (6,171)Profit before income taxes 13,949 10,832 128,680Income taxes (Note 10):
Current 6,698 4,428 61,789Deferred (710) 143 (6,549)
5,987 4,571 55,230Profit 7,961 6,260 73,440Profit attributable to non-controlling interests 44 63 405Profit attributable to owners of parent ¥ 7,917 ¥ 6,197 $ 73,035
2016 2015 2016Profit ¥ 7,961 ¥ 6,260 $ 73,440Other comprehensive income:
Unrealized holding (losses) gains on securities (290) 192 (2,675)Remeasurements of defined benefit plans, net of tax 160 (16) 1,476Total other comprehensive (loss) income (130) 175 (1,199)
Total comprehensive income 7,831 6,436 72,241
Comprehensive income attributable to owners of parent 7,786 6,372 71,826Comprehensive income attributable to non-controlling interests 44 63 405
See accompanying notes.
AIN HOLDINGS INC.CONSOLIDATED STATEMENT OF INCOME
AIN HOLDINGS INC.CONSOLIDATED STATEMENT OF COMPREHENSIVE INCOME
YEAR ENDED APRIL 30, 2016
YEAR ENDED APRIL 30, 2016
Millions of yenU.S. dollars(Note 1(1))
Thousands of
Thousands of U.S. dollars
Millions of yen (Note 1(1))
Millions of yen
Thousands ofshares
Number ofshares of
common stockCommon stock Capital surplus Retained
earnings Treasury stockTotal
shareholders’equity
Unrealizedholding gains(losses) onsecurities
Remeasurmentsof defined
benefit plans
Totalaccumulated
othercomprehensiveincome (loss)
Non-controllinginterests Total net assets
Balance at April 30, 2014 15,944 8,682 7,872 26,007 (417) 42,146 34 (58) (23) 117 42,240Cumulative effect of changes in accounting policies - - - 386 - 386 - - - - 386Effect of 2-for-1 stock split of common shares 15,944 - - - - - - - - - -
Balance at May 1, 2014 31,888 8,682 7,872 26,393 (417) 42,532 34 (58) (23) 117 42,626Profit attributable to owners of parent - - - 6,197 - 6,197 - - - - 6,197Cash dividends paid - - - (951) - (951) - - - - (951)Acquisition of treasury stock - - - - (1) (1) - - - - (1)Net change in items other than those in shareholders’ equity - - - - - - 192 (16) 175 0 176Net changes during the year - - - 5,245 (1) 5,243 192 (16) 175 0 5,419
Balance at April 30, 2015 31,888 8,682 7,872 31,639 (419) 47,776 227 (75) ¥ 151 ¥ 118 ¥ 48,046Profit attributable to owners of parent - - - 7,917 - 7,917 - - - - 7,917Cash dividends paid - - - (951) - (951) - - - - (951)Acquisition of treasury stock - - - - - - - - - - -Purchase of shares of consolidated subsidiaries - - (1,505) - - (1,505) - - - - (1,505)Net change in items other than those in shareholders’ equity - - - - - - (290) 160 (130) (52) (182)Net changes during the year - - (1,505) 6,965 - 5,460 (290) 160 (130) (52) 5,278
Balance at April 30, 2016 31,888 ¥ 8,682 ¥ 6,367 ¥ 38,605 ¥ (419) ¥ 53,237 ¥ (63) ¥ 84 ¥ 21 ¥ 65 ¥ 53,324
Common stock Capital surplus Retainedearnings Treasury stock
Totalshareholders’
equity
Unrealizedholding gains(losses) onsecurities
Remeasurmentsof defined
benefit plans
Totalaccumulated
othercomprehensiveincome (loss)
Non-controllinginterests Total net assets
Balance at April 30, 2015 $ 80,092 $ 72,619 $ 291,872 $ (3,865) $ 440,738 $ 2,094 $ (691) $ 1,392 $ 1,088 $ 443,228Profit attributable to owners of parent - - 73,035 - 73,035 - - - - 73,035Cash dividends paid - - (8,773) - (8,773) - - - - (8,773)Acquisition of treasury stock - - - - - - - - - -Purchase of shares of consolidated subsidiaries - (13,883) - - (13,883) - - - - (13,883)Net change in items other than those in shareholders’ equity - - - - - (2,675) 1,476 (1,199) (479) (1,678)Net changes during the year - (13,883) 64,252 - 50,369 (2,675) 1,476 (1,199) (479) 48,690
Balance at April 30, 2016 $ 80,092 $ 58,736 $ 356,134 $ (3,865) $ 491,116 $ (581) $ 774 $ 193 $ 599 $ 491,918
See accompanying notes.
Thousands of U.S. dollars (Note 1(1))Shareholders' equity Accumulated other comprehensive income (loss)
AIN HOLDINGS INC.
YEAR ENDED APRIL 30, 2016
Millions of yenShareholders' equity Accumulated other comprehensive income (loss)
CONSOLIDATED STATEMENT OF CHANGES IN NET ASSETS
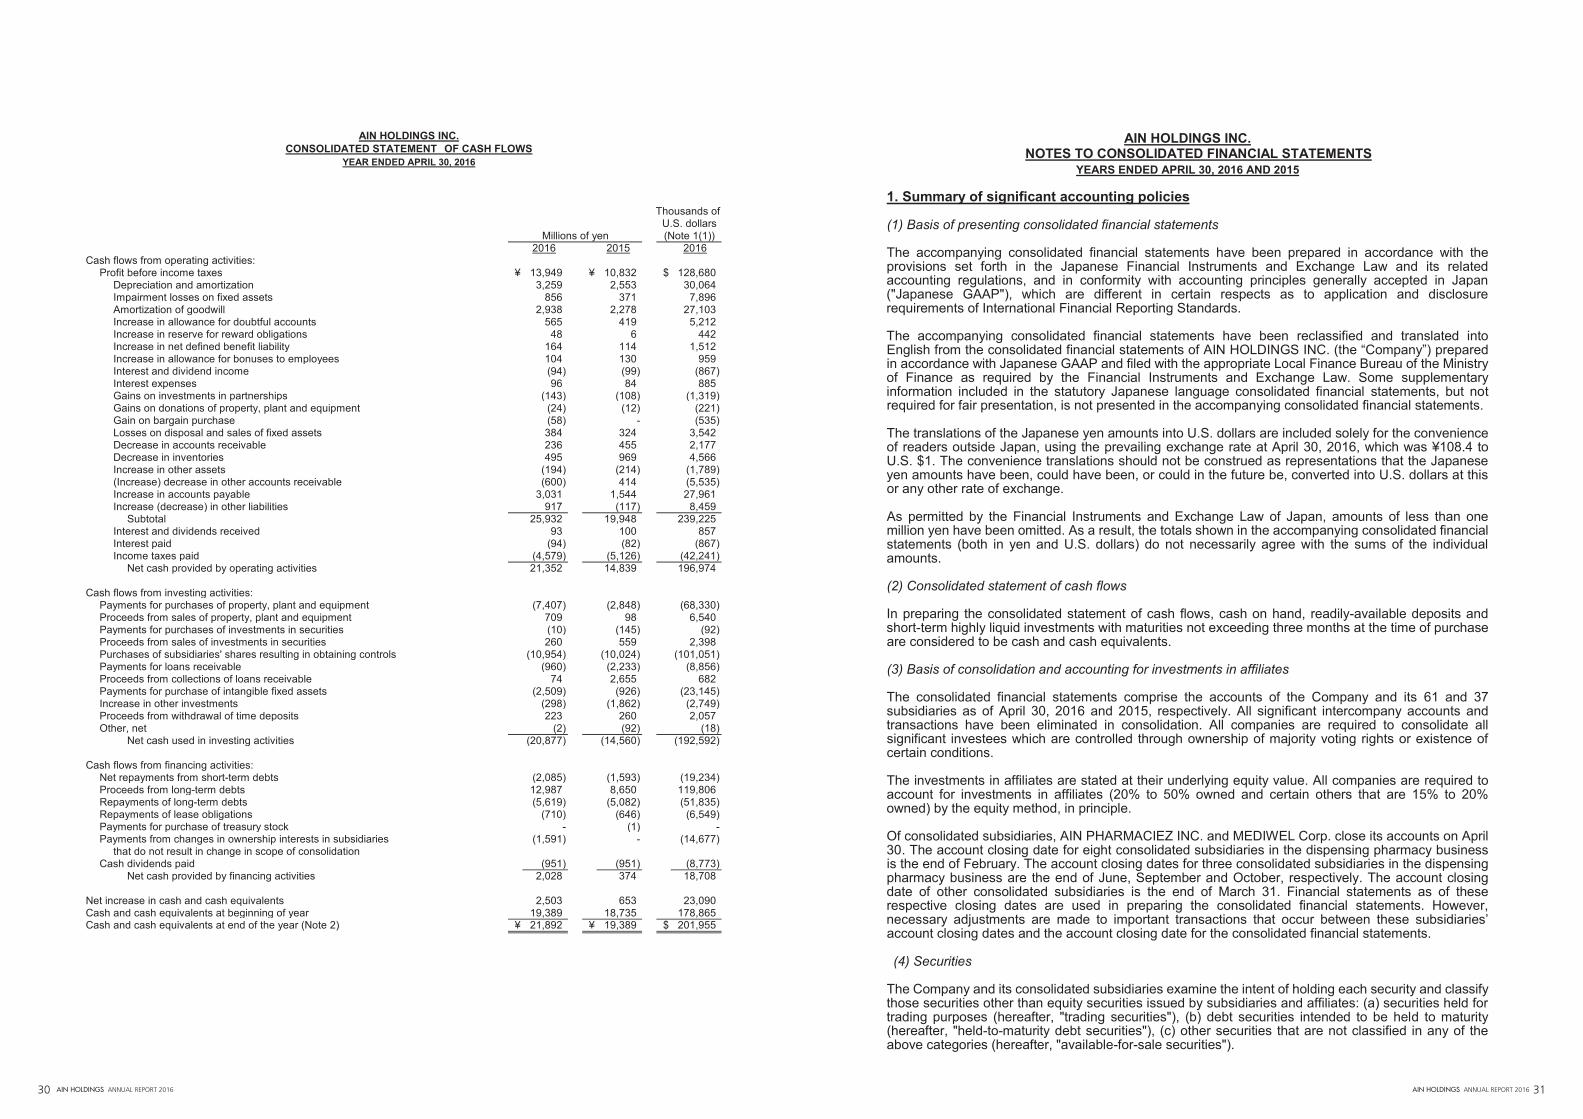
AIN HOLDINGS ANNUAL REPORT 2016 3130 AIN HOLDINGS ANNUAL REPORT 2016
AIN HOLDINGS INC.CONSOLIDATED STATEMENT OF CASH FLOWS
YEAR ENDED APRIL 30, 2016
2016 2015 2016Cash flows from operating activities:
Profit before income taxes ¥ 13,949 ¥ 10,832 $ 128,680Depreciation and amortization 3,259 2,553 30,064Impairment losses on fixed assets 856 371 7,896Amortization of goodwill 2,938 2,278 27,103Increase in allowance for doubtful accounts 565 419 5,212Increase in reserve for reward obligations 48 6 442Increase in net defined benefit liability 164 114 1,512Increase in allowance for bonuses to employees 104 130 959Interest and dividend income (94) (99) (867)Interest expenses 96 84 885Gains on investments in partnerships (143) (108) (1,319)Gains on donations of property, plant and equipment (24) (12) (221)Gain on bargain purchase (58) - (535)Losses on disposal and sales of fixed assets 384 324 3,542Decrease in accounts receivable 236 455 2,177Decrease in inventories 495 969 4,566Increase in other assets (194) (214) (1,789)(Increase) decrease in other accounts receivable (600) 414 (5,535)Increase in accounts payable 3,031 1,544 27,961Increase (decrease) in other liabilities 917 (117) 8,459
Subtotal 25,932 19,948 239,225Interest and dividends received 93 100 857Interest paid (94) (82) (867)Income taxes paid (4,579) (5,126) (42,241)
Net cash provided by operating activities 21,352 14,839 196,974
Cash flows from investing activities: Payments for purchases of property, plant and equipment (7,407) (2,848) (68,330)Proceeds from sales of property, plant and equipment 709 98 6,540Payments for purchases of investments in securities (10) (145) (92)Proceeds from sales of investments in securities 260 559 2,398Purchases of subsidiaries' shares resulting in obtaining controls (10,954) (10,024) (101,051)Payments for loans receivable (960) (2,233) (8,856)Proceeds from collections of loans receivable 74 2,655 682Payments for purchase of intangible fixed assets (2,509) (926) (23,145)Increase in other investments (298) (1,862) (2,749)Proceeds from withdrawal of time deposits 223 260 2,057Other, net (2) (92) (18)
Net cash used in investing activities (20,877) (14,560) (192,592)
Cash flows from financing activities: Net repayments from short-term debts (2,085) (1,593) (19,234)Proceeds from long-term debts 12,987 8,650 119,806Repayments of long-term debts (5,619) (5,082) (51,835)Repayments of lease obligations (710) (646) (6,549)Payments for purchase of treasury stock - (1) -Payments from changes in ownership interests in subsidiaries (1,591) - (14,677)
that do not result in change in scope of consolidationCash dividends paid (951) (951) (8,773)
Net cash provided by financing activities 2,028 374 18,708
Net increase in cash and cash equivalents 2,503 653 23,090Cash and cash equivalents at beginning of year 19,389 18,735 178,865Cash and cash equivalents at end of the year (Note 2) ¥ 21,892 ¥ 19,389 $ 201,955
See accompanying notes.
Thousands of U.S. dollars
Millions of yen (Note 1(1))
AIN HOLDINGS INC. NOTES TO CONSOLIDATED FINANCIAL STATEMENTS
YEARS ENDED APRIL 30, 2016 AND 2015 1. Summary of significant accounting policies (1) Basis of presenting consolidated financial statements The accompanying consolidated financial statements have been prepared in accordance with the provisions set forth in the Japanese Financial Instruments and Exchange Law and its related accounting regulations, and in conformity with accounting principles generally accepted in Japan ("Japanese GAAP"), which are different in certain respects as to application and disclosure requirements of International Financial Reporting Standards. The accompanying consolidated financial statements have been reclassified and translated into English from the consolidated financial statements of AIN HOLDINGS INC. (the “Company”) prepared in accordance with Japanese GAAP and filed with the appropriate Local Finance Bureau of the Ministry of Finance as required by the Financial Instruments and Exchange Law. Some supplementary information included in the statutory Japanese language consolidated financial statements, but not required for fair presentation, is not presented in the accompanying consolidated financial statements. The translations of the Japanese yen amounts into U.S. dollars are included solely for the convenience of readers outside Japan, using the prevailing exchange rate at April 30, 2016, which was ¥108.4 to U.S. $1. The convenience translations should not be construed as representations that the Japanese yen amounts have been, could have been, or could in the future be, converted into U.S. dollars at this or any other rate of exchange. As permitted by the Financial Instruments and Exchange Law of Japan, amounts of less than one million yen have been omitted. As a result, the totals shown in the accompanying consolidated financial statements (both in yen and U.S. dollars) do not necessarily agree with the sums of the individual amounts. (2) Consolidated statement of cash flows In preparing the consolidated statement of cash flows, cash on hand, readily-available deposits and short-term highly liquid investments with maturities not exceeding three months at the time of purchase are considered to be cash and cash equivalents. (3) Basis of consolidation and accounting for investments in affiliates The consolidated financial statements comprise the accounts of the Company and its 61 and 37 subsidiaries as of April 30, 2016 and 2015, respectively. All significant intercompany accounts and transactions have been eliminated in consolidation. All companies are required to consolidate all significant investees which are controlled through ownership of majority voting rights or existence of certain conditions. The investments in affiliates are stated at their underlying equity value. All companies are required to account for investments in affiliates (20% to 50% owned and certain others that are 15% to 20% owned) by the equity method, in principle. Of consolidated subsidiaries, AIN PHARMACIEZ INC. and MEDIWEL Corp. close its accounts on April 30. The account closing date for eight consolidated subsidiaries in the dispensing pharmacy business is the end of February. The account closing dates for three consolidated subsidiaries in the dispensing pharmacy business are the end of June, September and October, respectively. The account closing date of other consolidated subsidiaries is the end of March 31. Financial statements as of these respective closing dates are used in preparing the consolidated financial statements. However, necessary adjustments are made to important transactions that occur between these subsidiaries’ account closing dates and the account closing date for the consolidated financial statements. (4) Securities The Company and its consolidated subsidiaries examine the intent of holding each security and classify those securities other than equity securities issued by subsidiaries and affiliates: (a) securities held for trading purposes (hereafter, "trading securities"), (b) debt securities intended to be held to maturity (hereafter, "held-to-maturity debt securities"), (c) other securities that are not classified in any of the above categories (hereafter, "available-for-sale securities").

AIN HOLDINGS ANNUAL REPORT 2016 3332 AIN HOLDINGS ANNUAL REPORT 2016
Trading securities are carried at fair value and held-to-maturity debt securities are carried at amortized cost. Marketable securities classified as available-for-sale securities are carried at fair value with changes in unrealized holding gains or losses, net of the applicable income taxes, included directly in net assets. Non-marketable securities classified as available-for-sale securities are carried at cost. Cost of securities sold is determined by the moving average method. (5) Inventories Dispensed drugs were stated at lower of cost or market, cost being determined using the gross average method. Merchandise was stated at lower of cost or market, cost being determined using the retail method. Supplies were stated at cost determined using the last purchase method. (6) Depreciation and amortization Depreciation of property, plant and equipment other than leased assets is computed by the declining-balance method at rates based on the useful lives, except that the straight-line method is applied to buildings acquired on or after April 1, 1998 and to facilities and structures acquired on or after April 1, 2016. The useful lives of major property, plant and equipment are summarized as follows: Buildings and structures: 10 to 50 years The straight-line method is applied over a three-year period for assets with an acquisition price of ¥100,000 or more and less than ¥200,000. Amortization of software other than leased assets used by the Company and its consolidated subsidiaries is computed by the straight-line method over the useful lives, five years. Amortization of long-term prepaid expenses is computed by the straight-line method. Amortization of goodwill is computed by the straight-line method over a period (5 to 20 years). Leased assets capitalized under finance leases are depreciated over the lease terms of the respective assets with no residual value. Finance lease transactions that do not transfer ownership that commenced prior to April 1, 2008, are accounted for under methods pertaining to standard lease transactions. (7) Impairment of fixed assets Fixed assets are reviewed for impairment whenever events or changes in circumstances indicate that the carrying amount may not be recoverable. When amounts of undiscounted future cash flows of fixed assets are less than the carrying amounts, the fixed assets are determined to be impaired. Then, an amount by which the carrying amount exceeds the recoverable amount is recognized as an impairment loss. The Company and its consolidated subsidiaries identify group of assets by store as the smallest identifiable group of assets that generates cash inflows from continuing use that are largely independent of the cash inflows from other assets or groups of assets. With respect to non-performing assets, real estate is regarded as an independent asset group. The recoverable amount of the asset group is measured by the respective net selling prices. The land is assessed based on the appraisal value by an independent real estate appraiser. The fair value of construction in progress and store facilities is the disposal value from which costs of disposal are deducted. (8) Allowance for doubtful accounts The Company and its consolidated subsidiaries provide an allowance for doubtful accounts for probable collection losses by applying the actual rate of bad debt losses experienced in a past reference period for normal receivables and by individual assessment of collectability for doubtful receivables. (9) Bonuses to employees Allowance for bonus to employees is provided for payments to employees of the Company and its consolidated subsidiaries at the amount expected to be paid in respect of the calculation period ended on the balance sheet date.
(10) Bonuses to directors Allowance for bonus to directors is provided for payments to directors of the Company and its consolidated subsidiaries at the amount expected to be paid in respect of the calculation period ended on the balance sheet date. (11) Reserve for reward obligations In terms of the estimated redeemable amount of the purchase points given in the parent company’s Drug and Cosmetic Store Business, the Company sets a reserve based on actual redemptions in the past. (12) Provision for sales returns As a provision for losses associated with sales returns, the Company and its consolidated subsidiaries record an estimated loss amount considering past return rates and distribution in the market. (13) Retirement benefits Retirement benefits covering all employees are provided through two plans: a lump-sum benefit plan and a defined-benefit pension plan. Upon retirement or termination of employment, employees are generally entitled to lump-sum or annuity payments based on their current rate of pay, length of service and cause of termination. The Company and some of its consolidated subsidiaries employ the simplified method when computing retirement benefit obligations. In calculating the retirement benefit obligation, the benefit formula basis is used to attribute the expected benefit attributable to the respective fiscal year. Unrecognized prior service cost is amortized on a straight-line basis over a period (six years) within the employees’ average remaining service period at incurrence. Unrecognized actuarial gains and losses are recognized in expenses using the declining-balance method over a period (six years) within the average of the estimated remaining service period, commencing from the year after the year in which they are incurred. (14) Income taxes Deferred tax assets and liabilities are determined based on the differences between financial reporting and the tax bases of the assets and liabilities and are measured using the enacted tax rates and laws which will be in effect when the differences are expected to reverse. (15) Amounts per share of common stock Basic earnings per share is computed based on the weighted average number of shares of common stock outstanding during the year. Diluted earnings per share is computed based on the weighted average number of shares of common stock outstanding each year after giving effect to the dilutive potential of common shares to be issued upon conversion of the convertible bonds. Net assets per share are computed based on the net assets excluding non-controlling interests, and the number of common stock outstanding at the year end. Cash dividends per share represent the actual amount declared as applicable to the respective years. (16) Consumption taxes The Company and its consolidated subsidiaries are accounted for using the tax excluded method. With regard to consumption taxes and other taxes that are not subject to deduction, the related expenses are reported in the fiscal year in which they are incurred. However, consumption taxes and other taxes that are not subject to deduction but related to fixed assets are recorded in “Other investments and other assets” within “Investments and other assets” and amortized using the straight-line method. Accrued consumption taxes are indicated in the corresponding “other” sections within current assets and current liabilities.
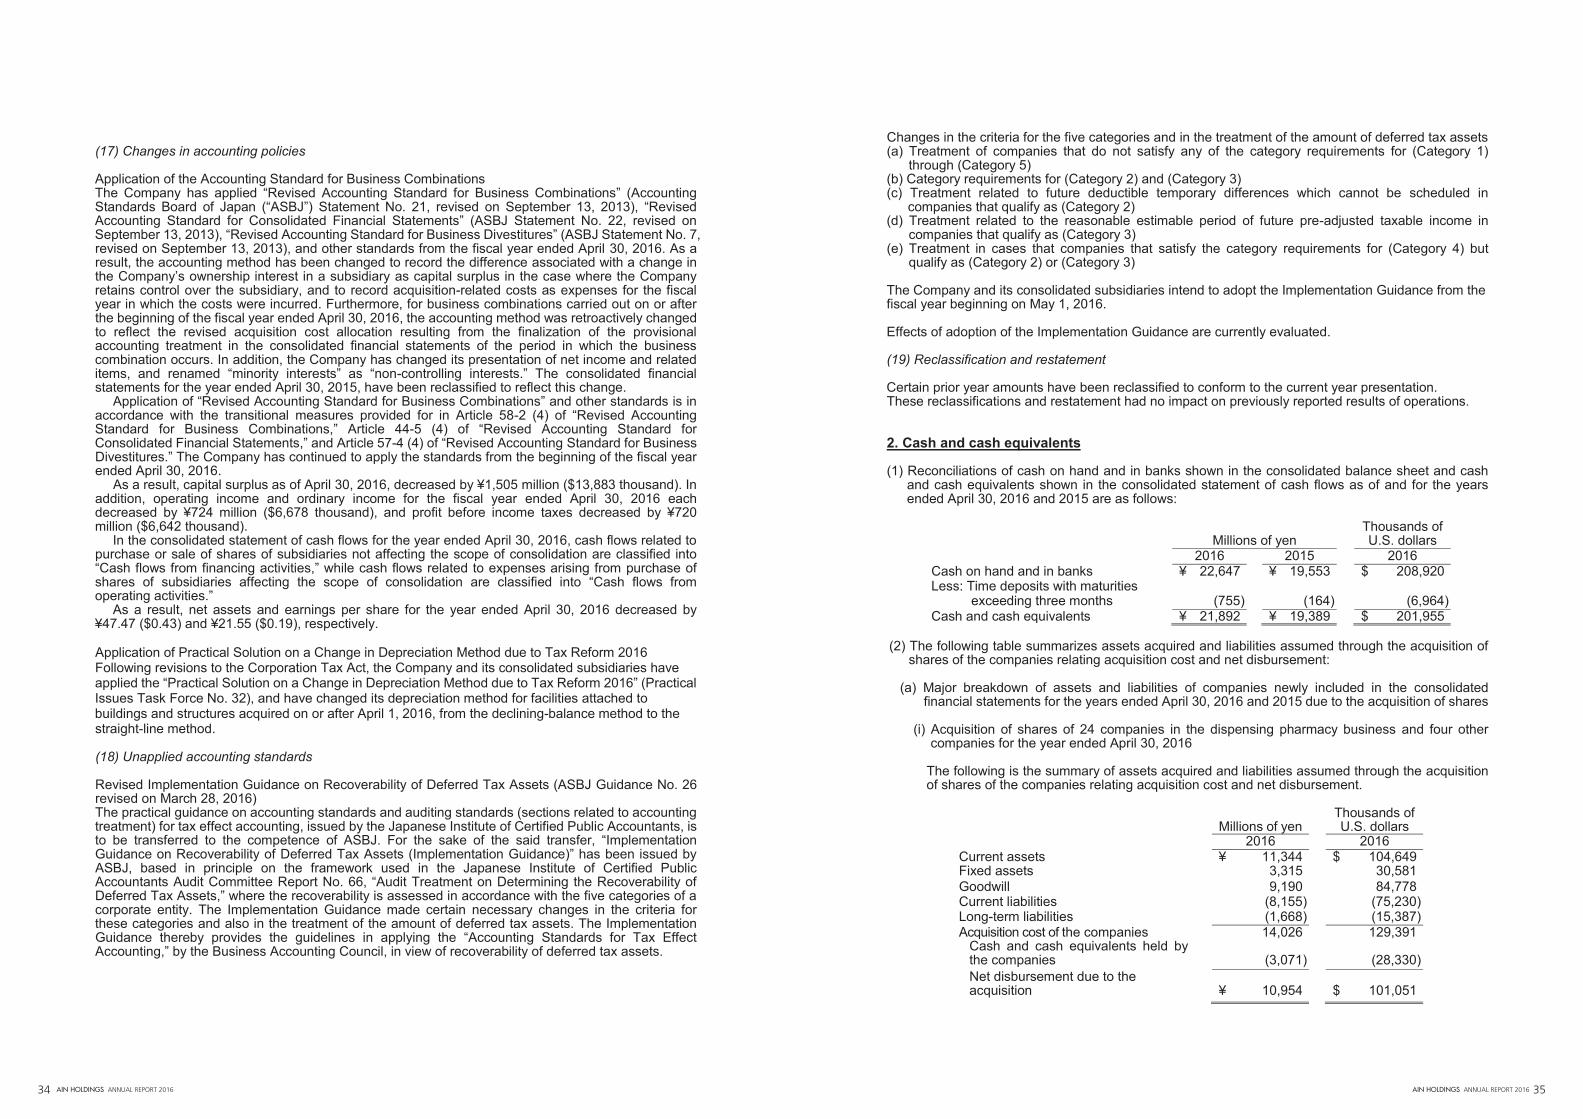
AIN HOLDINGS ANNUAL REPORT 2016 3534 AIN HOLDINGS ANNUAL REPORT 2016
(17) Changes in accounting policies Application of the Accounting Standard for Business Combinations The Company has applied “Revised Accounting Standard for Business Combinations” (Accounting Standards Board of Japan (“ASBJ”) Statement No. 21, revised on September 13, 2013), “Revised Accounting Standard for Consolidated Financial Statements” (ASBJ Statement No. 22, revised on September 13, 2013), “Revised Accounting Standard for Business Divestitures” (ASBJ Statement No. 7, revised on September 13, 2013), and other standards from the fiscal year ended April 30, 2016. As a result, the accounting method has been changed to record the difference associated with a change in the Company’s ownership interest in a subsidiary as capital surplus in the case where the Company retains control over the subsidiary, and to record acquisition-related costs as expenses for the fiscal year in which the costs were incurred. Furthermore, for business combinations carried out on or after the beginning of the fiscal year ended April 30, 2016, the accounting method was retroactively changed to reflect the revised acquisition cost allocation resulting from the finalization of the provisional accounting treatment in the consolidated financial statements of the period in which the business combination occurs. In addition, the Company has changed its presentation of net income and related items, and renamed “minority interests” as “non-controlling interests.” The consolidated financial statements for the year ended April 30, 2015, have been reclassified to reflect this change. Application of “Revised Accounting Standard for Business Combinations” and other standards is in accordance with the transitional measures provided for in Article 58-2 (4) of “Revised Accounting Standard for Business Combinations,” Article 44-5 (4) of “Revised Accounting Standard for Consolidated Financial Statements,” and Article 57-4 (4) of “Revised Accounting Standard for Business Divestitures.” The Company has continued to apply the standards from the beginning of the fiscal year ended April 30, 2016. As a result, capital surplus as of April 30, 2016, decreased by ¥1,505 million ($13,883 thousand). In addition, operating income and ordinary income for the fiscal year ended April 30, 2016 each decreased by ¥724 million ($6,678 thousand), and profit before income taxes decreased by ¥720 million ($6,642 thousand). In the consolidated statement of cash flows for the year ended April 30, 2016, cash flows related to purchase or sale of shares of subsidiaries not affecting the scope of consolidation are classified into “Cash flows from financing activities,” while cash flows related to expenses arising from purchase of shares of subsidiaries affecting the scope of consolidation are classified into “Cash flows from operating activities.” As a result, net assets and earnings per share for the year ended April 30, 2016 decreased by ¥47.47 ($0.43) and ¥21.55 ($0.19), respectively. Application of Practical Solution on a Change in Depreciation Method due to Tax Reform 2016 Following revisions to the Corporation Tax Act, the Company and its consolidated subsidiaries have applied the “Practical Solution on a Change in Depreciation Method due to Tax Reform 2016” (Practical Issues Task Force No. 32), and have changed its depreciation method for facilities attached to buildings and structures acquired on or after April 1, 2016, from the declining-balance method to the straight-line method. (18) Unapplied accounting standards Revised Implementation Guidance on Recoverability of Deferred Tax Assets (ASBJ Guidance No. 26 revised on March 28, 2016) The practical guidance on accounting standards and auditing standards (sections related to accounting treatment) for tax effect accounting, issued by the Japanese Institute of Certified Public Accountants, is to be transferred to the competence of ASBJ. For the sake of the said transfer, “Implementation Guidance on Recoverability of Deferred Tax Assets (Implementation Guidance)” has been issued by ASBJ, based in principle on the framework used in the Japanese Institute of Certified Public Accountants Audit Committee Report No. 66, “Audit Treatment on Determining the Recoverability of Deferred Tax Assets,” where the recoverability is assessed in accordance with the five categories of a corporate entity. The Implementation Guidance made certain necessary changes in the criteria for these categories and also in the treatment of the amount of deferred tax assets. The Implementation Guidance thereby provides the guidelines in applying the “Accounting Standards for Tax Effect Accounting,” by the Business Accounting Council, in view of recoverability of deferred tax assets.
Changes in the criteria for the five categories and in the treatment of the amount of deferred tax assets (a) Treatment of companies that do not satisfy any of the category requirements for (Category 1)
through (Category 5) (b) Category requirements for (Category 2) and (Category 3) (c) Treatment related to future deductible temporary differences which cannot be scheduled in
companies that qualify as (Category 2) (d) Treatment related to the reasonable estimable period of future pre-adjusted taxable income in
companies that qualify as (Category 3) (e) Treatment in cases that companies that satisfy the category requirements for (Category 4) but
qualify as (Category 2) or (Category 3) The Company and its consolidated subsidiaries intend to adopt the Implementation Guidance from the fiscal year beginning on May 1, 2016.
Effects of adoption of the Implementation Guidance are currently evaluated. (19) Reclassification and restatement Certain prior year amounts have been reclassified to conform to the current year presentation. These reclassifications and restatement had no impact on previously reported results of operations. 2. Cash and cash equivalents (1) Reconciliations of cash on hand and in banks shown in the consolidated balance sheet and cash
and cash equivalents shown in the consolidated statement of cash flows as of and for the years ended April 30, 2016 and 2015 are as follows:
Thousands of Millions of yen U.S. dollars 2016 2015 2016 Cash on hand and in banks ¥ 22,647 ¥ 19,553 $ 208,920 Less: Time deposits with maturities
exceeding three months (755) (164) (6,964) Cash and cash equivalents ¥ 21,892 ¥ 19,389 $ 201,955
(2) The following table summarizes assets acquired and liabilities assumed through the acquisition of
shares of the companies relating acquisition cost and net disbursement:
(a) Major breakdown of assets and liabilities of companies newly included in the consolidated financial statements for the years ended April 30, 2016 and 2015 due to the acquisition of shares
(i) Acquisition of shares of 24 companies in the dispensing pharmacy business and four other
companies for the year ended April 30, 2016
The following is the summary of assets acquired and liabilities assumed through the acquisition of shares of the companies relating acquisition cost and net disbursement.
Thousands of Millions of yen U.S. dollars 2016 2016 Current assets ¥ 11,344 $ 104,649 Fixed assets 3,315 30,581 Goodwill 9,190 84,778 Current liabilities (8,155) (75,230) Long-term liabilities (1,668) (15,387) Acquisition cost of the companies 14,026 129,391
Cash and cash equivalents held by the companies
(3,071)
(28,330)
Net disbursement due to the acquisition
¥ 10,954
$ 101,051
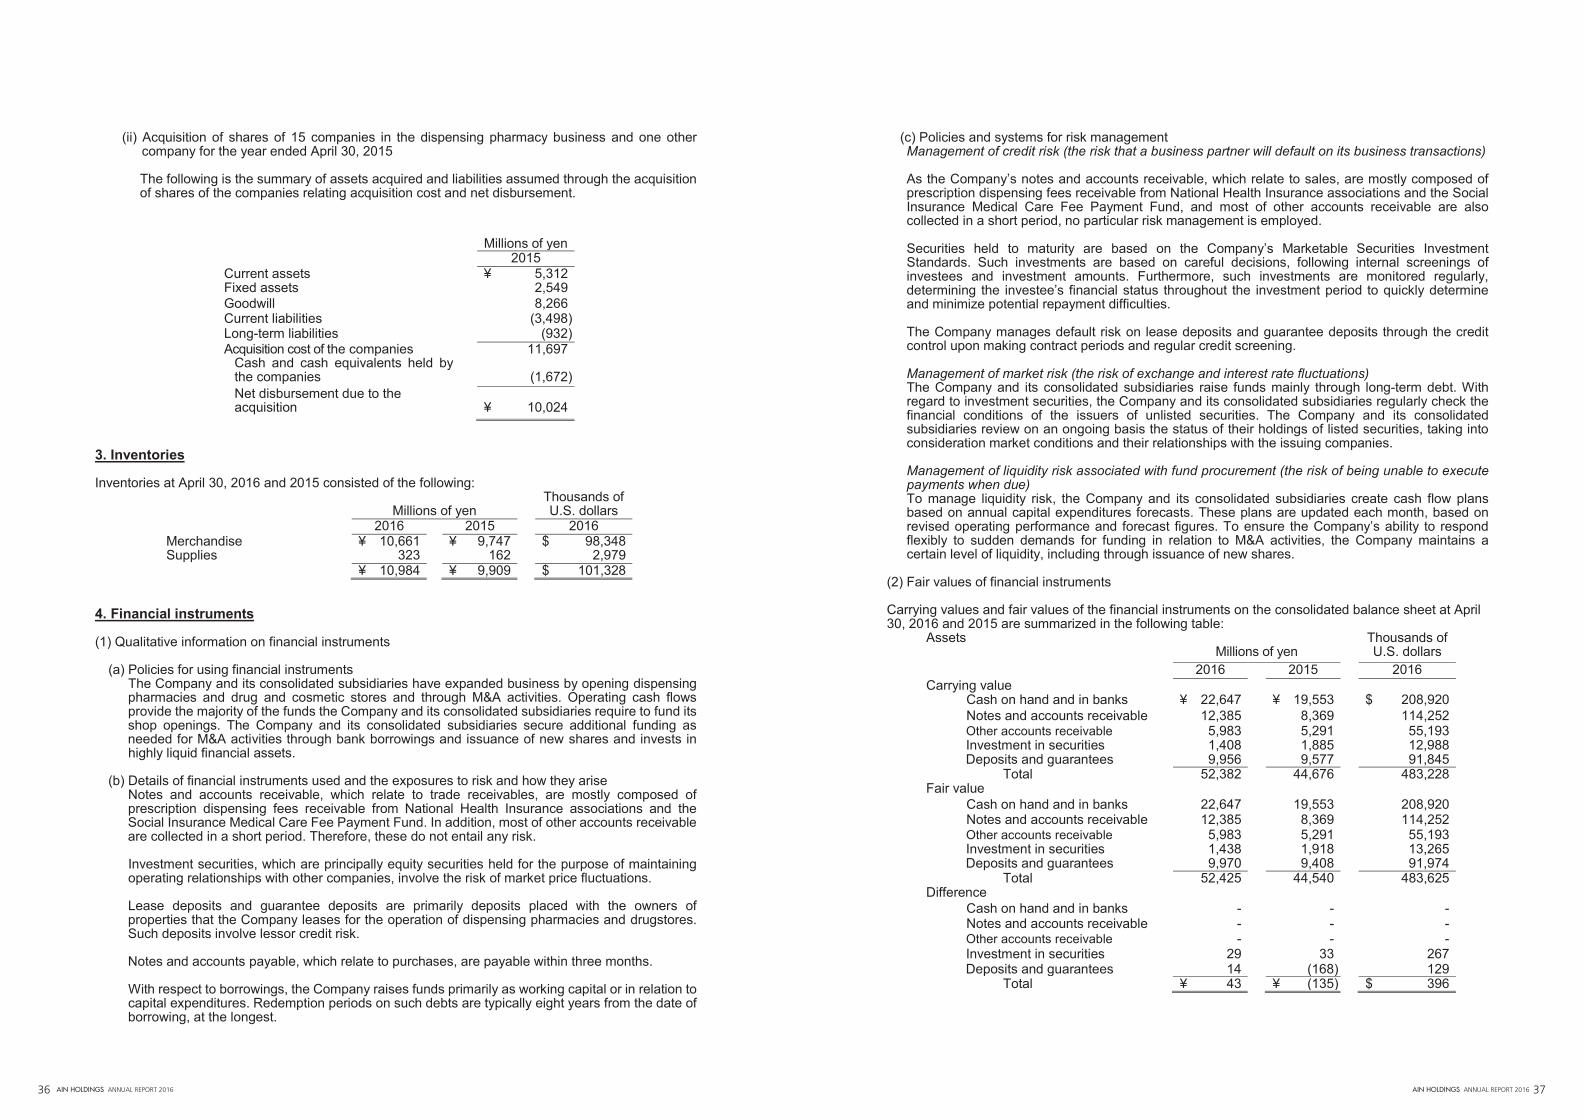
AIN HOLDINGS ANNUAL REPORT 2016 3736 AIN HOLDINGS ANNUAL REPORT 2016
(ii) Acquisition of shares of 15 companies in the dispensing pharmacy business and one other company for the year ended April 30, 2015
The following is the summary of assets acquired and liabilities assumed through the acquisition of shares of the companies relating acquisition cost and net disbursement.
Millions of yen 2015 Current assets ¥ 5,312 Fixed assets 2,549 Goodwill 8,266 Current liabilities (3,498) Long-term liabilities (932) Acquisition cost of the companies 11,697
Cash and cash equivalents held by the companies
(1,672)
Net disbursement due to the acquisition
¥ 10,024
3. Inventories Inventories at April 30, 2016 and 2015 consisted of the following:
Thousands of Millions of yen U.S. dollars 2016 2015 2016 Merchandise ¥ 10,661 ¥ 9,747 $ 98,348 Supplies 323 162 2,979 ¥ 10,984 ¥ 9,909 $ 101,328
4. Financial instruments (1) Qualitative information on financial instruments
(a) Policies for using financial instruments The Company and its consolidated subsidiaries have expanded business by opening dispensing pharmacies and drug and cosmetic stores and through M&A activities. Operating cash flows provide the majority of the funds the Company and its consolidated subsidiaries require to fund its shop openings. The Company and its consolidated subsidiaries secure additional funding as needed for M&A activities through bank borrowings and issuance of new shares and invests in highly liquid financial assets.
(b) Details of financial instruments used and the exposures to risk and how they arise
Notes and accounts receivable, which relate to trade receivables, are mostly composed of prescription dispensing fees receivable from National Health Insurance associations and the Social Insurance Medical Care Fee Payment Fund. In addition, most of other accounts receivable are collected in a short period. Therefore, these do not entail any risk.
Investment securities, which are principally equity securities held for the purpose of maintaining operating relationships with other companies, involve the risk of market price fluctuations.
Lease deposits and guarantee deposits are primarily deposits placed with the owners of properties that the Company leases for the operation of dispensing pharmacies and drugstores. Such deposits involve lessor credit risk.
Notes and accounts payable, which relate to purchases, are payable within three months.
With respect to borrowings, the Company raises funds primarily as working capital or in relation to capital expenditures. Redemption periods on such debts are typically eight years from the date of borrowing, at the longest.
(c) Policies and systems for risk management Management of credit risk (the risk that a business partner will default on its business transactions)
As the Company’s notes and accounts receivable, which relate to sales, are mostly composed of prescription dispensing fees receivable from National Health Insurance associations and the Social Insurance Medical Care Fee Payment Fund, and most of other accounts receivable are also collected in a short period, no particular risk management is employed.
Securities held to maturity are based on the Company’s Marketable Securities Investment Standards. Such investments are based on careful decisions, following internal screenings of investees and investment amounts. Furthermore, such investments are monitored regularly, determining the investee’s financial status throughout the investment period to quickly determine and minimize potential repayment difficulties.
The Company manages default risk on lease deposits and guarantee deposits through the credit control upon making contract periods and regular credit screening.
Management of market risk (the risk of exchange and interest rate fluctuations) The Company and its consolidated subsidiaries raise funds mainly through long-term debt. With regard to investment securities, the Company and its consolidated subsidiaries regularly check the financial conditions of the issuers of unlisted securities. The Company and its consolidated subsidiaries review on an ongoing basis the status of their holdings of listed securities, taking into consideration market conditions and their relationships with the issuing companies.
Management of liquidity risk associated with fund procurement (the risk of being unable to execute payments when due) To manage liquidity risk, the Company and its consolidated subsidiaries create cash flow plans based on annual capital expenditures forecasts. These plans are updated each month, based on revised operating performance and forecast figures. To ensure the Company’s ability to respond flexibly to sudden demands for funding in relation to M&A activities, the Company maintains a certain level of liquidity, including through issuance of new shares.
(2) Fair values of financial instruments Carrying values and fair values of the financial instruments on the consolidated balance sheet at April 30, 2016 and 2015 are summarized in the following table:
Assets Millions of yen
Thousands of U.S. dollars
2016 2015 2016 Carrying value
Cash on hand and in banks ¥ 22,647 ¥ 19,553 $ 208,920 Notes and accounts receivable 12,385 8,369 114,252 Other accounts receivable 5,983 5,291 55,193 Investment in securities 1,408 1,885 12,988
Deposits and guarantees 9,956 9,577 91,845 Total 52,382 44,676 483,228
Fair value Cash on hand and in banks 22,647 19,553 208,920 Notes and accounts receivable 12,385 8,369 114,252 Other accounts receivable 5,983 5,291 55,193 Investment in securities 1,438 1,918 13,265
Deposits and guarantees 9,970 9,408 91,974 Total 52,425 44,540 483,625
Difference Cash on hand and in banks - - - Notes and accounts receivable - - - Other accounts receivable - - - Investment in securities 29 33 267
Deposits and guarantees 14 (168) 129 Total ¥ 43 ¥ (135) $ 396
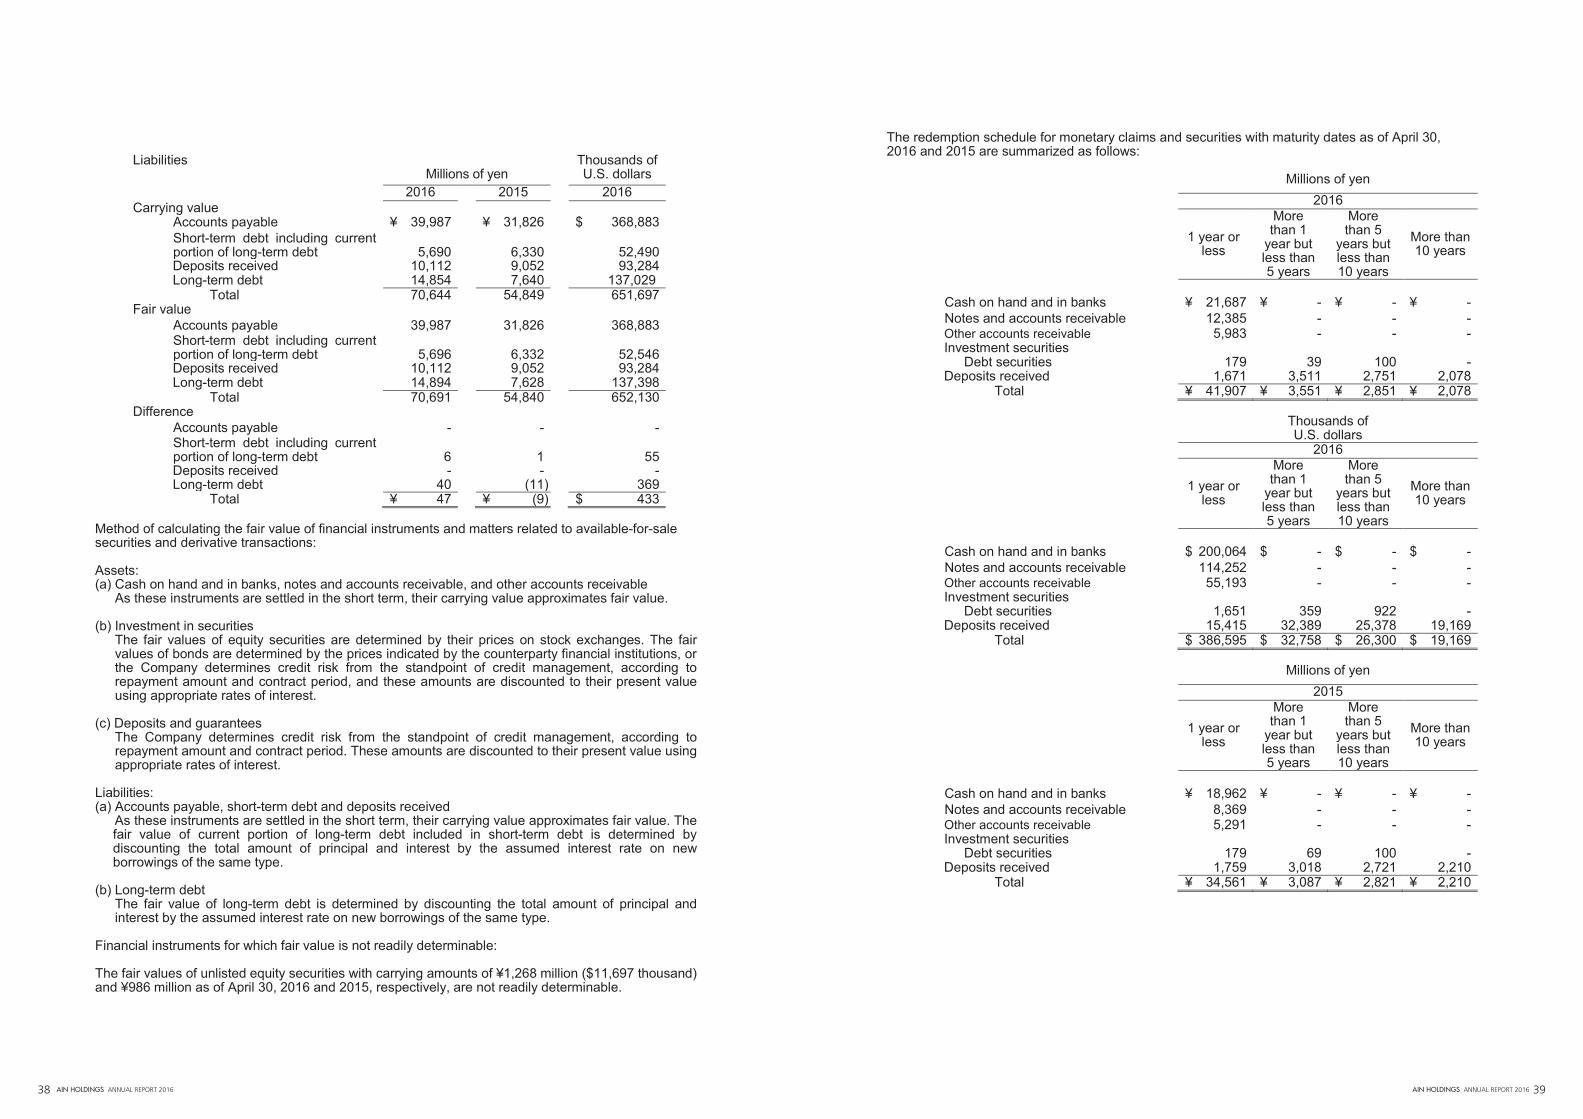
AIN HOLDINGS ANNUAL REPORT 2016 3938 AIN HOLDINGS ANNUAL REPORT 2016
Liabilities
Millions of yen Thousands of
U.S. dollars 2016 2015 2016 Carrying value
Accounts payable ¥ 39,987 ¥ 31,826 $ 368,883 Short-term debt including current portion of long-term debt
5,690
6,330
52,490
Deposits received 10,112 9,052 93,284 Long-term debt 14,854 7,640 137,029
Total 70,644 54,849 651,697 Fair value
Accounts payable 39,987 31,826 368,883 Short-term debt including current portion of long-term debt
5,696
6,332
52,546
Deposits received 10,112 9,052 93,284 Long-term debt 14,894 7,628 137,398
Total 70,691 54,840 652,130 Difference
Accounts payable - - - Short-term debt including current portion of long-term debt
6
1
55
Deposits received - - - Long-term debt 40 (11) 369
Total ¥ 47 ¥ (9) $ 433 Method of calculating the fair value of financial instruments and matters related to available-for-sale securities and derivative transactions: Assets: (a) Cash on hand and in banks, notes and accounts receivable, and other accounts receivable
As these instruments are settled in the short term, their carrying value approximates fair value. (b) Investment in securities
The fair values of equity securities are determined by their prices on stock exchanges. The fair values of bonds are determined by the prices indicated by the counterparty financial institutions, or the Company determines credit risk from the standpoint of credit management, according to repayment amount and contract period, and these amounts are discounted to their present value using appropriate rates of interest.
(c) Deposits and guarantees The Company determines credit risk from the standpoint of credit management, according to repayment amount and contract period. These amounts are discounted to their present value using appropriate rates of interest.
Liabilities: (a) Accounts payable, short-term debt and deposits received
As these instruments are settled in the short term, their carrying value approximates fair value. The fair value of current portion of long-term debt included in short-term debt is determined by discounting the total amount of principal and interest by the assumed interest rate on new borrowings of the same type.
(b) Long-term debt
The fair value of long-term debt is determined by discounting the total amount of principal and interest by the assumed interest rate on new borrowings of the same type.
Financial instruments for which fair value is not readily determinable: The fair values of unlisted equity securities with carrying amounts of ¥1,268 million ($11,697 thousand) and ¥986 million as of April 30, 2016 and 2015, respectively, are not readily determinable.
The redemption schedule for monetary claims and securities with maturity dates as of April 30, 2016 and 2015 are summarized as follows:
Millions of yen 2016
1 year or less
More than 1
year but less than 5 years
More than 5
years but less than 10 years
More than 10 years
Cash on hand and in banks ¥ 21,687 ¥ - ¥ - ¥ - Notes and accounts receivable 12,385 - - - Other accounts receivable 5,983 - - - Investment securities
Debt securities 179 39 100 - Deposits received 1,671 3,511 2,751 2,078
Total ¥ 41,907 ¥ 3,551 ¥ 2,851 ¥ 2,078
Thousands of U.S. dollars
2016
1 year or less
More than 1
year but less than 5 years
More than 5
years but less than 10 years
More than 10 years
Cash on hand and in banks $ 200,064 $ - $ - $ - Notes and accounts receivable 114,252 - - - Other accounts receivable 55,193 - - - Investment securities
Debt securities 1,651 359 922 - Deposits received 15,415 32,389 25,378 19,169
Total $ 386,595 $ 32,758 $ 26,300 $ 19,169
Millions of yen 2015
1 year or less
More than 1
year but less than 5 years
More than 5
years but less than 10 years
More than 10 years
Cash on hand and in banks ¥ 18,962 ¥ - ¥ - ¥ - Notes and accounts receivable 8,369 - - - Other accounts receivable 5,291 - - - Investment securities
Debt securities 179 69 100 - Deposits received 1,759 3,018 2,721 2,210
Total ¥ 34,561 ¥ 3,087 ¥ 2,821 ¥ 2,210
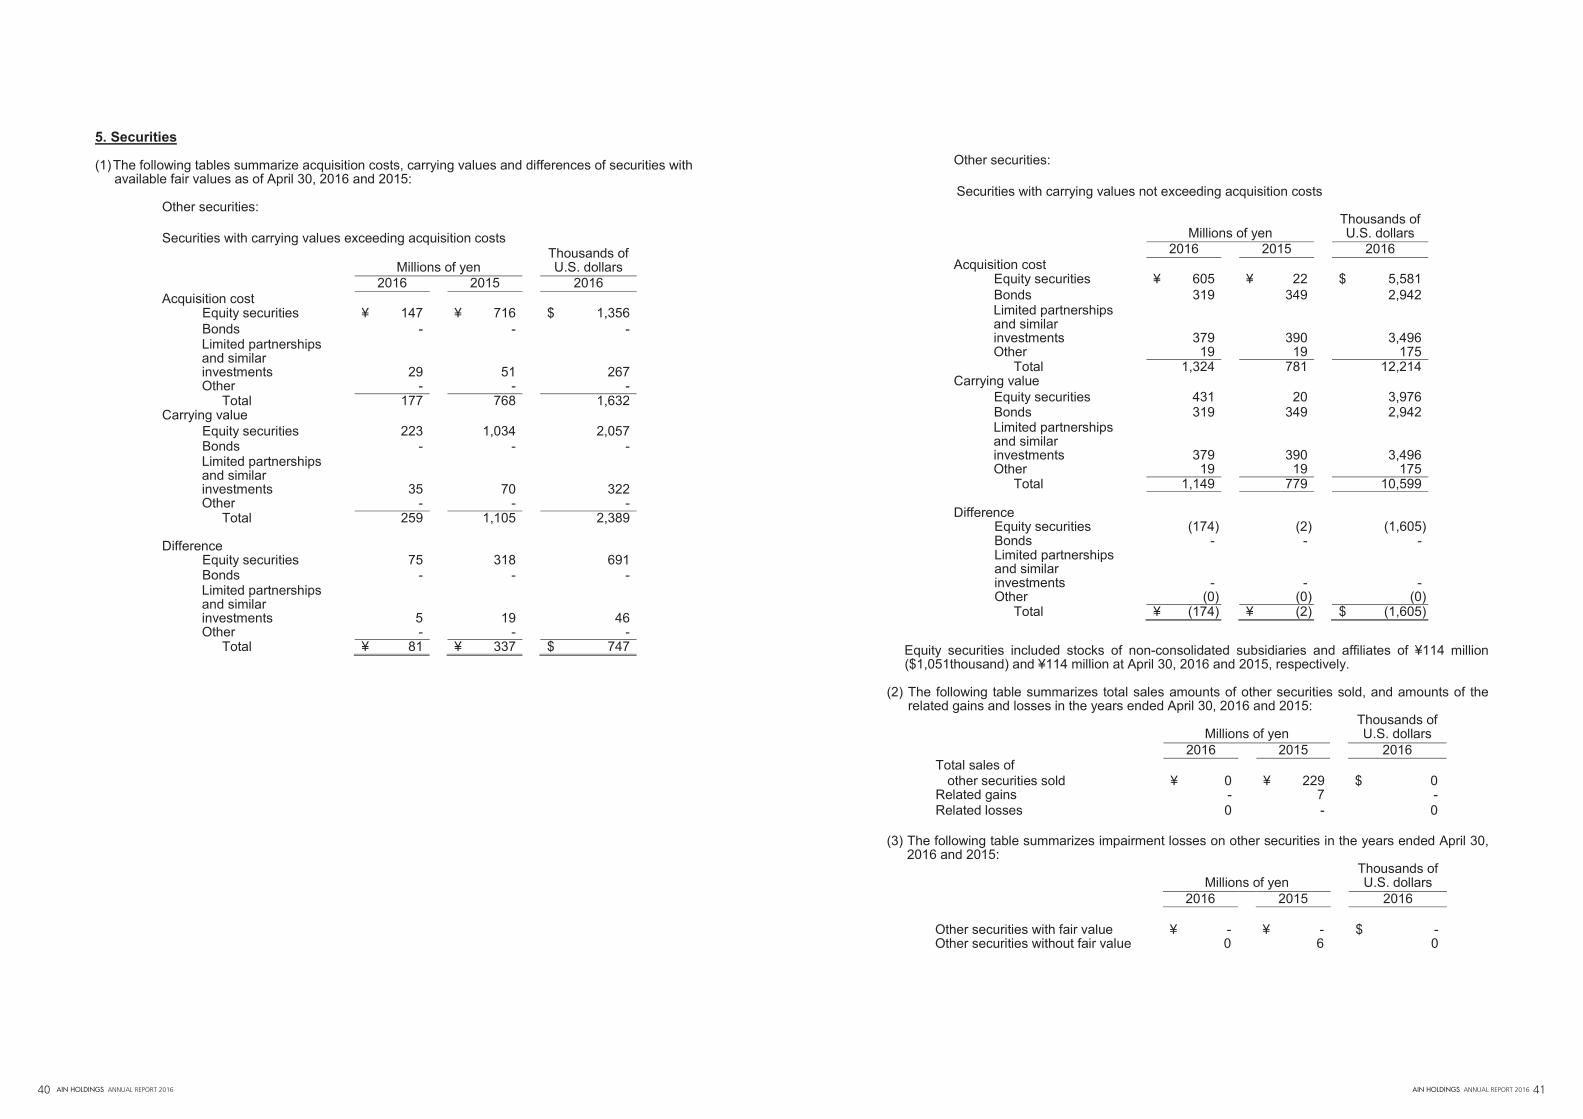
AIN HOLDINGS ANNUAL REPORT 2016 4140 AIN HOLDINGS ANNUAL REPORT 2016
5. Securities (1) The following tables summarize acquisition costs, carrying values and differences of securities with
available fair values as of April 30, 2016 and 2015:
Other securities:
Securities with carrying values exceeding acquisition costs Thousands of
Millions of yen U.S. dollars 2016 2015 2016 Acquisition cost
Equity securities ¥ 147 ¥ 716 $ 1,356 Bonds - - - Limited partnerships and similar investments
29
51
267
Other - - - Total 177 768 1,632
Carrying value Equity securities 223 1,034 2,057 Bonds - - - Limited partnerships and similar investments
35
70
322
Other - - - Total 259 1,105 2,389
Difference
Equity securities 75 318 691 Bonds - - - Limited partnerships and similar investments
5
19
46
Other - - - Total ¥ 81 ¥ 337 $ 747
Other securities:
Securities with carrying values not exceeding acquisition costs
Thousands of Millions of yen U.S. dollars
2016 2015 2016 Acquisition cost
Equity securities ¥ 605 ¥ 22 $ 5,581 Bonds 319 349 2,942 Limited partnerships and similar investments
379
390
3,496
Other 19 19 175 Total 1,324 781 12,214
Carrying value Equity securities 431 20 3,976 Bonds 319 349 2,942 Limited partnerships and similar investments
379
390
3,496
Other 19 19 175 Total 1,149 779 10,599
Difference
Equity securities (174) (2) (1,605) Bonds - - - Limited partnerships and similar investments
-
-
-
Other (0) (0) (0) Total ¥ (174) ¥ (2) $ (1,605)
Equity securities included stocks of non-consolidated subsidiaries and affiliates of ¥114 million ($1,051thousand) and ¥114 million at April 30, 2016 and 2015, respectively.
(2) The following table summarizes total sales amounts of other securities sold, and amounts of the
related gains and losses in the years ended April 30, 2016 and 2015: Thousands of
Millions of yen U.S. dollars 2016 2015 2016 Total sales of
other securities sold ¥ 0 ¥ 229 $ 0 Related gains - 7 - Related losses 0 - 0
(3) The following table summarizes impairment losses on other securities in the years ended April 30,
2016 and 2015: Thousands of
Millions of yen U.S. dollars 2016 2015 2016 Other securities with fair value ¥ - ¥ - $ - Other securities without fair value 0 6 0
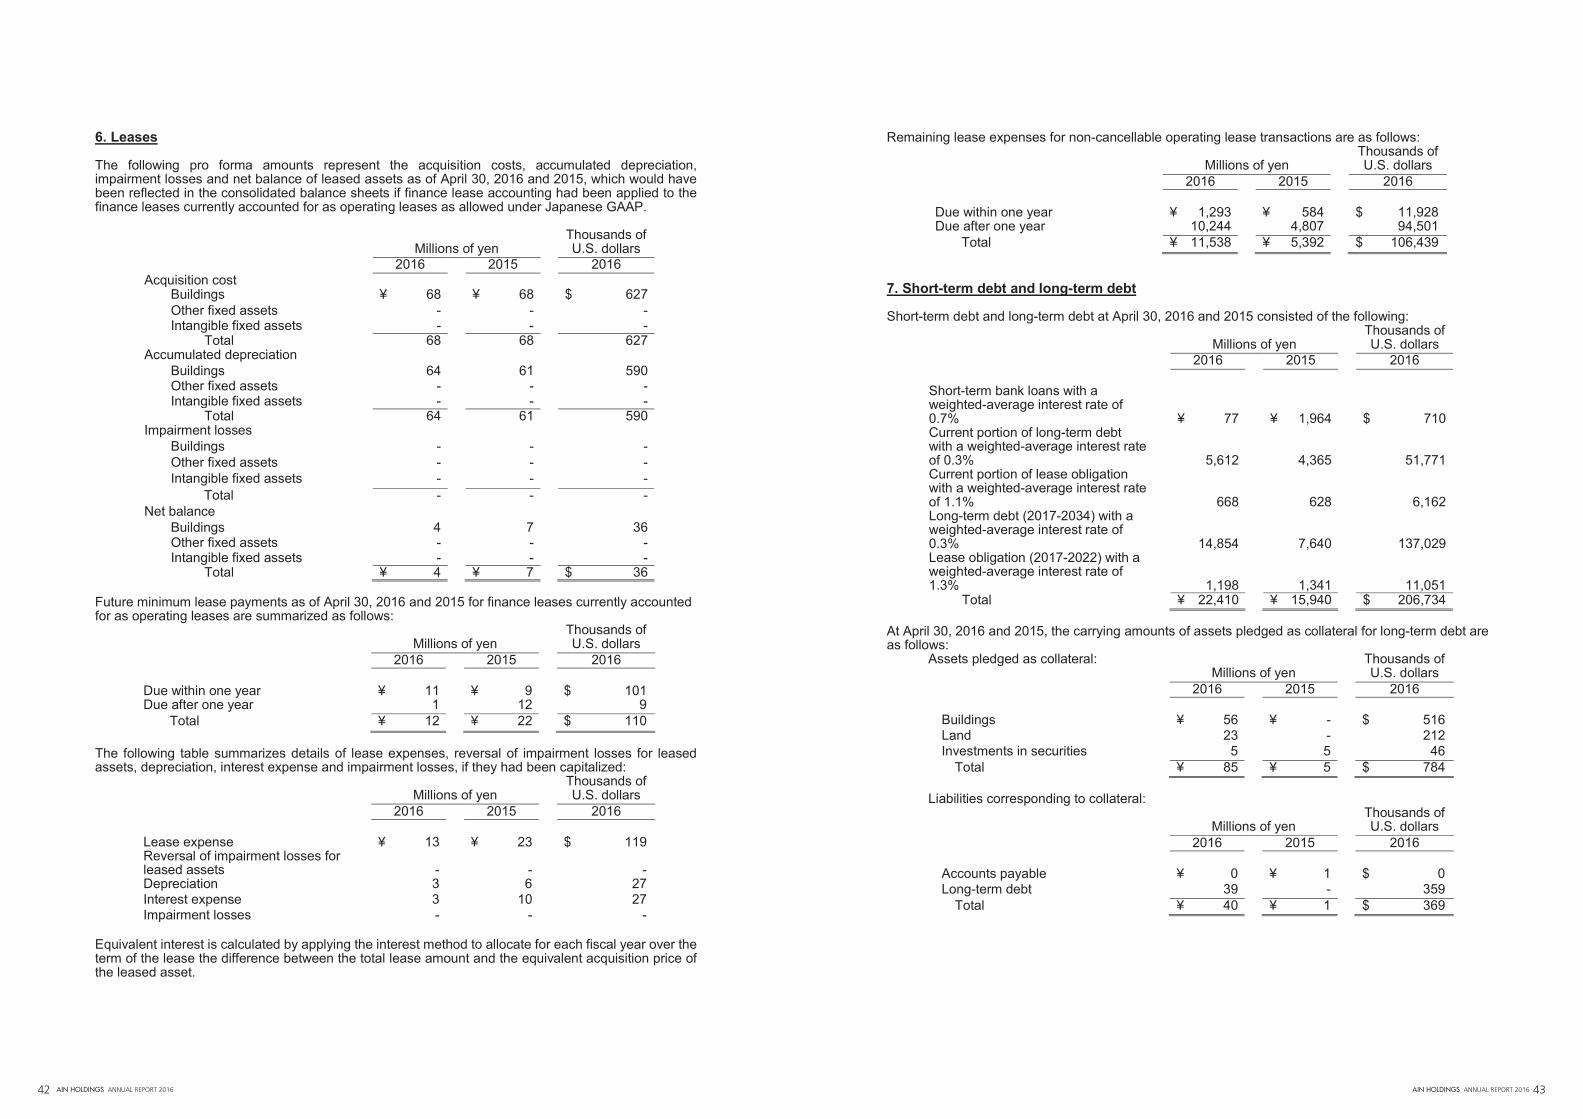
AIN HOLDINGS ANNUAL REPORT 2016 4342 AIN HOLDINGS ANNUAL REPORT 2016
6. Leases The following pro forma amounts represent the acquisition costs, accumulated depreciation, impairment losses and net balance of leased assets as of April 30, 2016 and 2015, which would have been reflected in the consolidated balance sheets if finance lease accounting had been applied to the finance leases currently accounted for as operating leases as allowed under Japanese GAAP.
Thousands of Millions of yen U.S. dollars
2016 2015 2016 Acquisition cost
Buildings ¥ 68 ¥ 68 $ 627 Other fixed assets - - - Intangible fixed assets - - -
Total 68 68 627 Accumulated depreciation
Buildings 64 61 590 Other fixed assets - - - Intangible fixed assets - - -
Total 64 61 590 Impairment losses
Buildings - - - Other fixed assets - - - Intangible fixed assets - - -
Total - - - Net balance
Buildings 4 7 36 Other fixed assets - - - Intangible fixed assets - - -
Total ¥ 4 ¥ 7 $ 36 Future minimum lease payments as of April 30, 2016 and 2015 for finance leases currently accounted for as operating leases are summarized as follows:
Thousands of Millions of yen U.S. dollars
2016 2015 2016 Due within one year ¥ 11 ¥ 9 $ 101 Due after one year 1 12 9 Total ¥ 12 ¥ 22 $ 110
The following table summarizes details of lease expenses, reversal of impairment losses for leased assets, depreciation, interest expense and impairment losses, if they had been capitalized:
Thousands of Millions of yen U.S. dollars
2016 2015 2016 Lease expense ¥ 13 ¥ 23 $ 119 Reversal of impairment losses for leased assets
-
-
-
Depreciation 3 6 27 Interest expense 3 10 27 Impairment losses - - -
Equivalent interest is calculated by applying the interest method to allocate for each fiscal year over the term of the lease the difference between the total lease amount and the equivalent acquisition price of the leased asset.
Remaining lease expenses for non-cancellable operating lease transactions are as follows: Thousands of
Millions of yen U.S. dollars 2016 2015 2016 Due within one year ¥ 1,293 ¥ 584 $ 11,928 Due after one year 10,244 4,807 94,501 Total ¥ 11,538 ¥ 5,392 $ 106,439
7. Short-term debt and long-term debt Short-term debt and long-term debt at April 30, 2016 and 2015 consisted of the following:
Thousands of Millions of yen U.S. dollars 2016 2015 2016 Short-term bank loans with a weighted-average interest rate of 0.7%
¥ 77
¥ 1,964
$ 710
Current portion of long-term debt with a weighted-average interest rate of 0.3%
5,612
4,365
51,771
Current portion of lease obligation with a weighted-average interest rate of 1.1%
668
628
6,162
Long-term debt (2017-2034) with a weighted-average interest rate of 0.3%
14,854
7,640
137,029
Lease obligation (2017-2022) with a weighted-average interest rate of 1.3%
1,198
1,341
11,051
Total ¥ 22,410 ¥ 15,940 $ 206,734 At April 30, 2016 and 2015, the carrying amounts of assets pledged as collateral for long-term debt are as follows:
Assets pledged as collateral: Thousands of Millions of yen U.S. dollars 2016 2015 2016
Buildings ¥ 56 ¥ - $ 516 Land 23 - 212 Investments in securities 5 5 46
Total ¥ 85 ¥ 5 $ 784
Liabilities corresponding to collateral: Thousands of
Millions of yen U.S. dollars 2016 2015 2016
Accounts payable ¥ 0 ¥ 1 $ 0 Long-term debt 39 - 359
Total ¥ 40 ¥ 1 $ 369
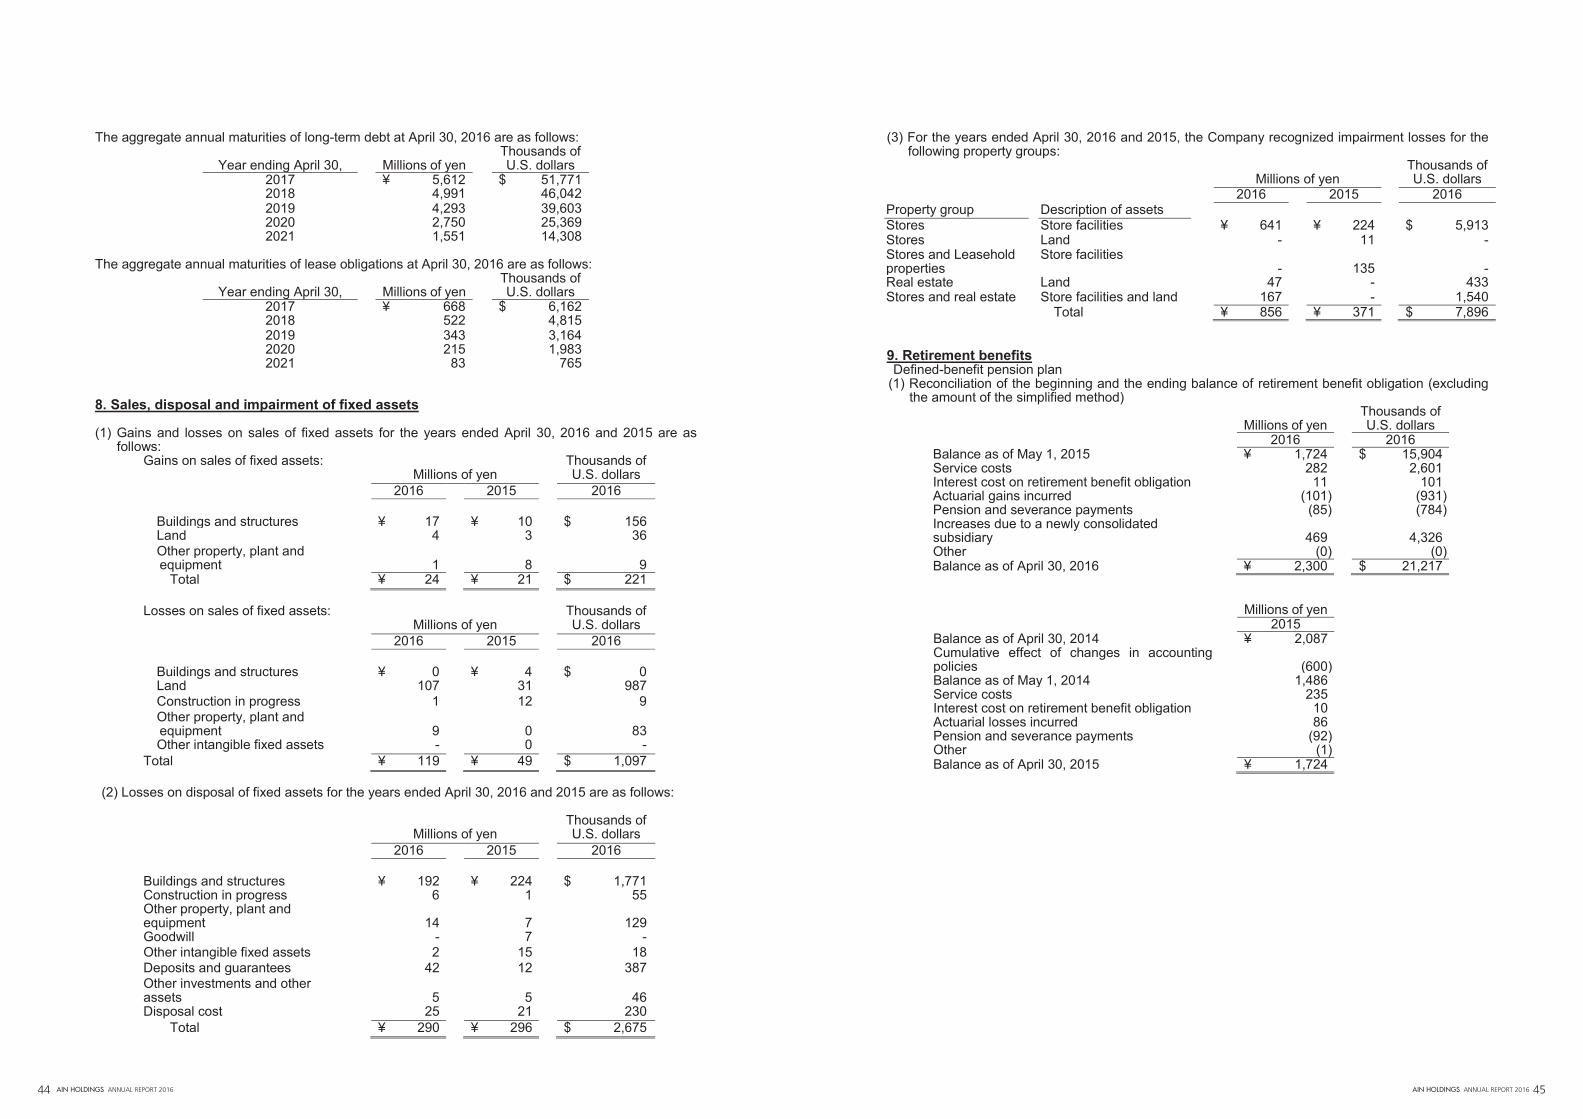
AIN HOLDINGS ANNUAL REPORT 2016 4544 AIN HOLDINGS ANNUAL REPORT 2016
The aggregate annual maturities of long-term debt at April 30, 2016 are as follows: Thousands of
Year ending April 30, Millions of yen U.S. dollars 2017 ¥ 5,612 $ 51,771 2018 4,991 46,042 2019 4,293 39,603 2020 2,750 25,369 2021 1,551 14,308
The aggregate annual maturities of lease obligations at April 30, 2016 are as follows:
Thousands of Year ending April 30, Millions of yen U.S. dollars
2017 ¥ 668 $ 6,162 2018 522 4,815 2019 343 3,164 2020 215 1,983 2021 83 765
8. Sales, disposal and impairment of fixed assets (1) Gains and losses on sales of fixed assets for the years ended April 30, 2016 and 2015 are as
follows: Gains on sales of fixed assets: Thousands of Millions of yen U.S. dollars 2016 2015 2016
Buildings and structures ¥ 17 ¥ 10 $ 156 Land 4 3 36 Other property, plant and equipment
1
8
9
Total ¥ 24 ¥ 21 $ 221
Losses on sales of fixed assets: Thousands of Millions of yen U.S. dollars 2016 2015 2016
Buildings and structures ¥ 0 ¥ 4 $ 0 Land 107 31 987 Construction in progress 1 12 9 Other property, plant and equipment
9
0
83
Other intangible fixed assets - 0 - Total ¥ 119 ¥ 49 $ 1,097
(2) Losses on disposal of fixed assets for the years ended April 30, 2016 and 2015 are as follows:
Thousands of
Millions of yen U.S. dollars 2016 2015 2016 Buildings and structures ¥ 192 ¥ 224 $ 1,771 Construction in progress 6 1 55 Other property, plant and equipment
14
7
129
Goodwill - 7 - Other intangible fixed assets 2 15 18 Deposits and guarantees 42 12 387 Other investments and other assets
5
5
46
Disposal cost 25 21 230 Total ¥ 290 ¥ 296 $ 2,675
(3) For the years ended April 30, 2016 and 2015, the Company recognized impairment losses for the following property groups:
Thousands of Millions of yen U.S. dollars 2016 2015 2016 Property group Description of assets Stores Store facilities ¥ 641 ¥ 224 $ 5,913 Stores Land - 11 - Stores and Leasehold properties
Store facilities -
135
-
Real estate Land 47 - 433 Stores and real estate Store facilities and land 167 - 1,540
Total ¥ 856 ¥ 371 $ 7,896 9. Retirement benefits Defined-benefit pension plan (1) Reconciliation of the beginning and the ending balance of retirement benefit obligation (excluding
the amount of the simplified method) Thousands of Millions of yen U.S. dollars 2016 2016 Balance as of May 1, 2015 ¥ 1,724 $ 15,904 Service costs 282 2,601 Interest cost on retirement benefit obligation 11 101 Actuarial gains incurred (101) (931) Pension and severance payments (85) (784) Increases due to a newly consolidated subsidiary
469
4,326
Other (0) (0) Balance as of April 30, 2016 ¥ 2,300 $ 21,217
Millions of yen 2015 Balance as of April 30, 2014 ¥ 2,087 Cumulative effect of changes in accounting policies
(600)
Balance as of May 1, 2014 1,486 Service costs 235 Interest cost on retirement benefit obligation 10 Actuarial losses incurred 86 Pension and severance payments (92) Other (1) Balance as of April 30, 2015 ¥ 1,724
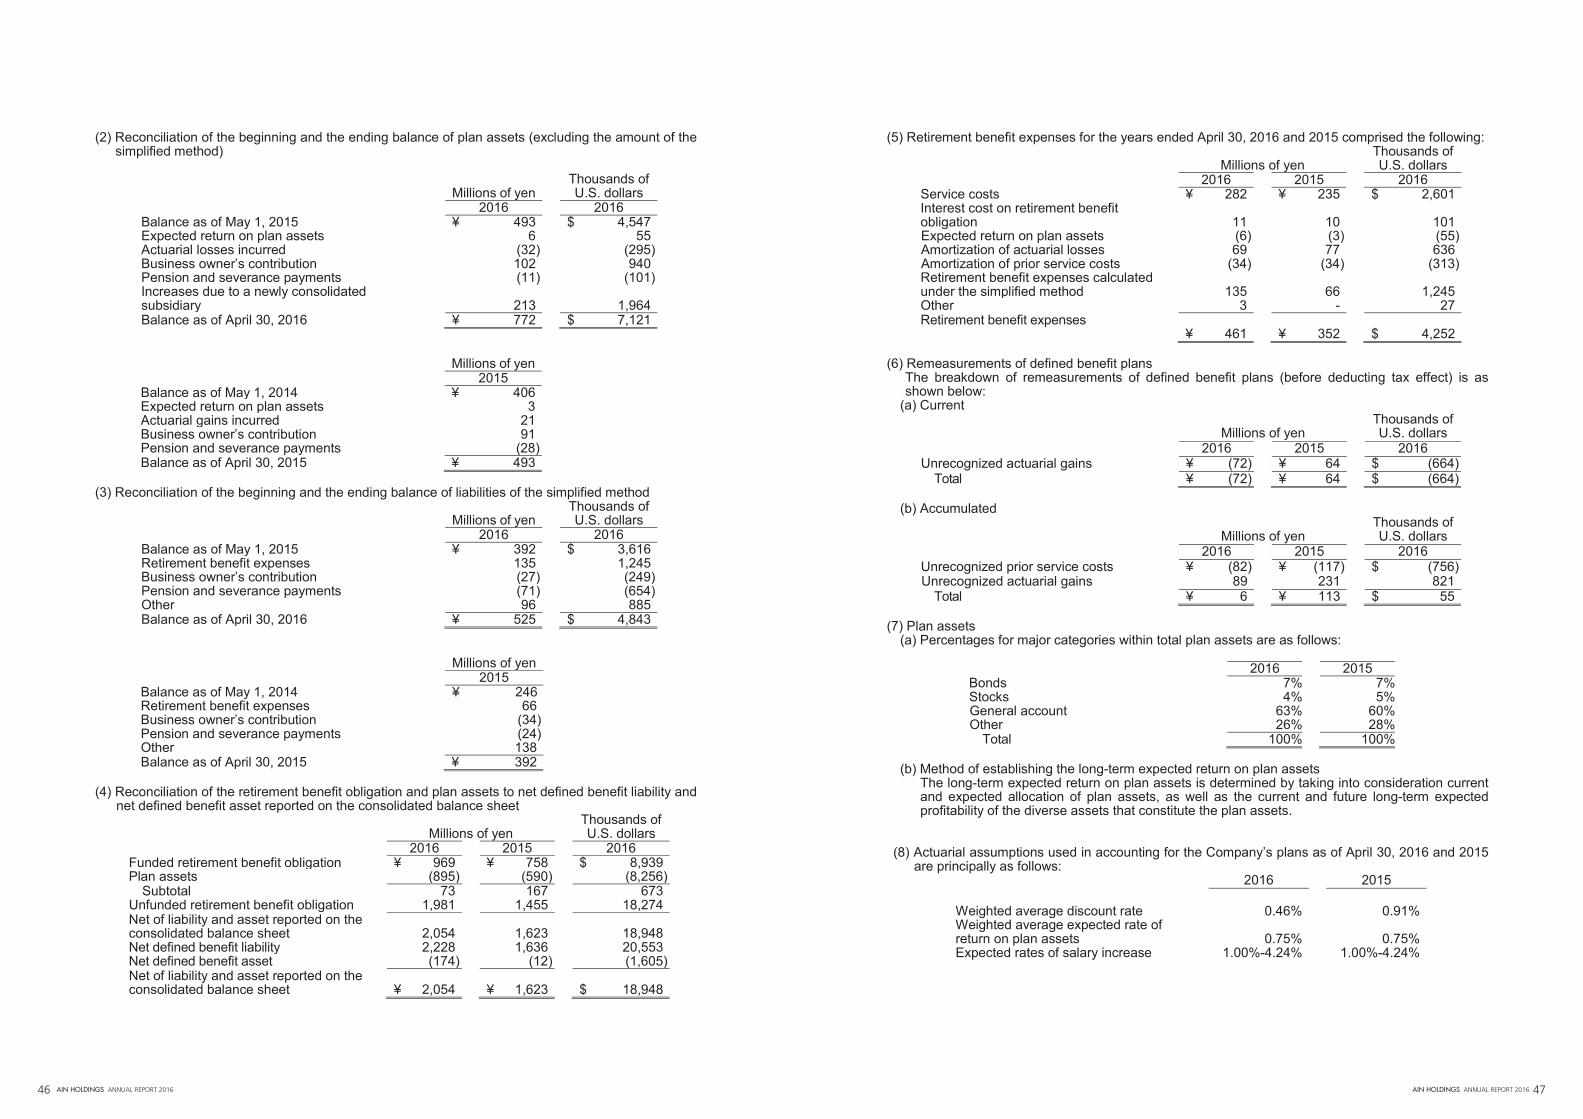
AIN HOLDINGS ANNUAL REPORT 2016 4746 AIN HOLDINGS ANNUAL REPORT 2016
(2) Reconciliation of the beginning and the ending balance of plan assets (excluding the amount of the simplified method)
Thousands of Millions of yen U.S. dollars 2016 2016 Balance as of May 1, 2015 ¥ 493 $ 4,547 Expected return on plan assets 6 55 Actuarial losses incurred (32) (295) Business owner’s contribution 102 940 Pension and severance payments (11) (101) Increases due to a newly consolidated subsidiary
213
1,964
Balance as of April 30, 2016 ¥ 772 $ 7,121
Millions of yen 2015 Balance as of May 1, 2014 ¥ 406 Expected return on plan assets 3 Actuarial gains incurred 21 Business owner’s contribution 91 Pension and severance payments (28) Balance as of April 30, 2015 ¥ 493
(3) Reconciliation of the beginning and the ending balance of liabilities of the simplified method
Thousands of Millions of yen U.S. dollars 2016 2016 Balance as of May 1, 2015 ¥ 392 $ 3,616 Retirement benefit expenses 135 1,245 Business owner’s contribution (27) (249) Pension and severance payments (71) (654) Other 96 885 Balance as of April 30, 2016 ¥ 525 $ 4,843
Millions of yen 2015 Balance as of May 1, 2014 ¥ 246 Retirement benefit expenses 66 Business owner’s contribution (34) Pension and severance payments (24) Other 138 Balance as of April 30, 2015 ¥ 392
(4) Reconciliation of the retirement benefit obligation and plan assets to net defined benefit liability and
net defined benefit asset reported on the consolidated balance sheet Thousands of Millions of yen U.S. dollars 2016 2015 2016 Funded retirement benefit obligation ¥ 969 ¥ 758 $ 8,939 Plan assets (895) (590) (8,256)
Subtotal 73 167 673 Unfunded retirement benefit obligation 1,981 1,455 18,274 Net of liability and asset reported on the consolidated balance sheet
2,054
1,623
18,948
Net defined benefit liability 2,228 1,636 20,553 Net defined benefit asset (174) (12) (1,605) Net of liability and asset reported on the consolidated balance sheet
¥ 2,054
¥ 1,623
$ 18,948
(5) Retirement benefit expenses for the years ended April 30, 2016 and 2015 comprised the following: Thousands of Millions of yen U.S. dollars 2016 2015 2016 Service costs ¥ 282 ¥ 235 $ 2,601 Interest cost on retirement benefit obligation
11
10
101
Expected return on plan assets (6) (3) (55) Amortization of actuarial losses 69 77 636 Amortization of prior service costs (34) (34) (313) Retirement benefit expenses calculated under the simplified method
135
66
1,245
Other 3 - 27 Retirement benefit expenses
¥ 461
¥ 352
$ 4,252 (6) Remeasurements of defined benefit plans
The breakdown of remeasurements of defined benefit plans (before deducting tax effect) is as shown below:
(a) Current Thousands of Millions of yen U.S. dollars 2016 2015 2016 Unrecognized actuarial gains ¥ (72) ¥ 64 $ (664)
Total ¥ (72) ¥ 64 $ (664) (b) Accumulated
Thousands of Millions of yen U.S. dollars 2016 2015 2016 Unrecognized prior service costs ¥ (82) ¥ (117) $ (756) Unrecognized actuarial gains 89 231 821
Total ¥ 6 ¥ 113 $ 55 (7) Plan assets
(a) Percentages for major categories within total plan assets are as follows:
2016 2015 Bonds 7% 7% Stocks 4% 5% General account 63% 60% Other 26% 28%
Total 100% 100% (b) Method of establishing the long-term expected return on plan assets
The long-term expected return on plan assets is determined by taking into consideration current and expected allocation of plan assets, as well as the current and future long-term expected profitability of the diverse assets that constitute the plan assets.
(8) Actuarial assumptions used in accounting for the Company’s plans as of April 30, 2016 and 2015 are principally as follows:
2016 2015 Weighted average discount rate 0.46% 0.91% Weighted average expected rate of return on plan assets
0.75%
0.75%
Expected rates of salary increase 1.00%-4.24% 1.00%-4.24%
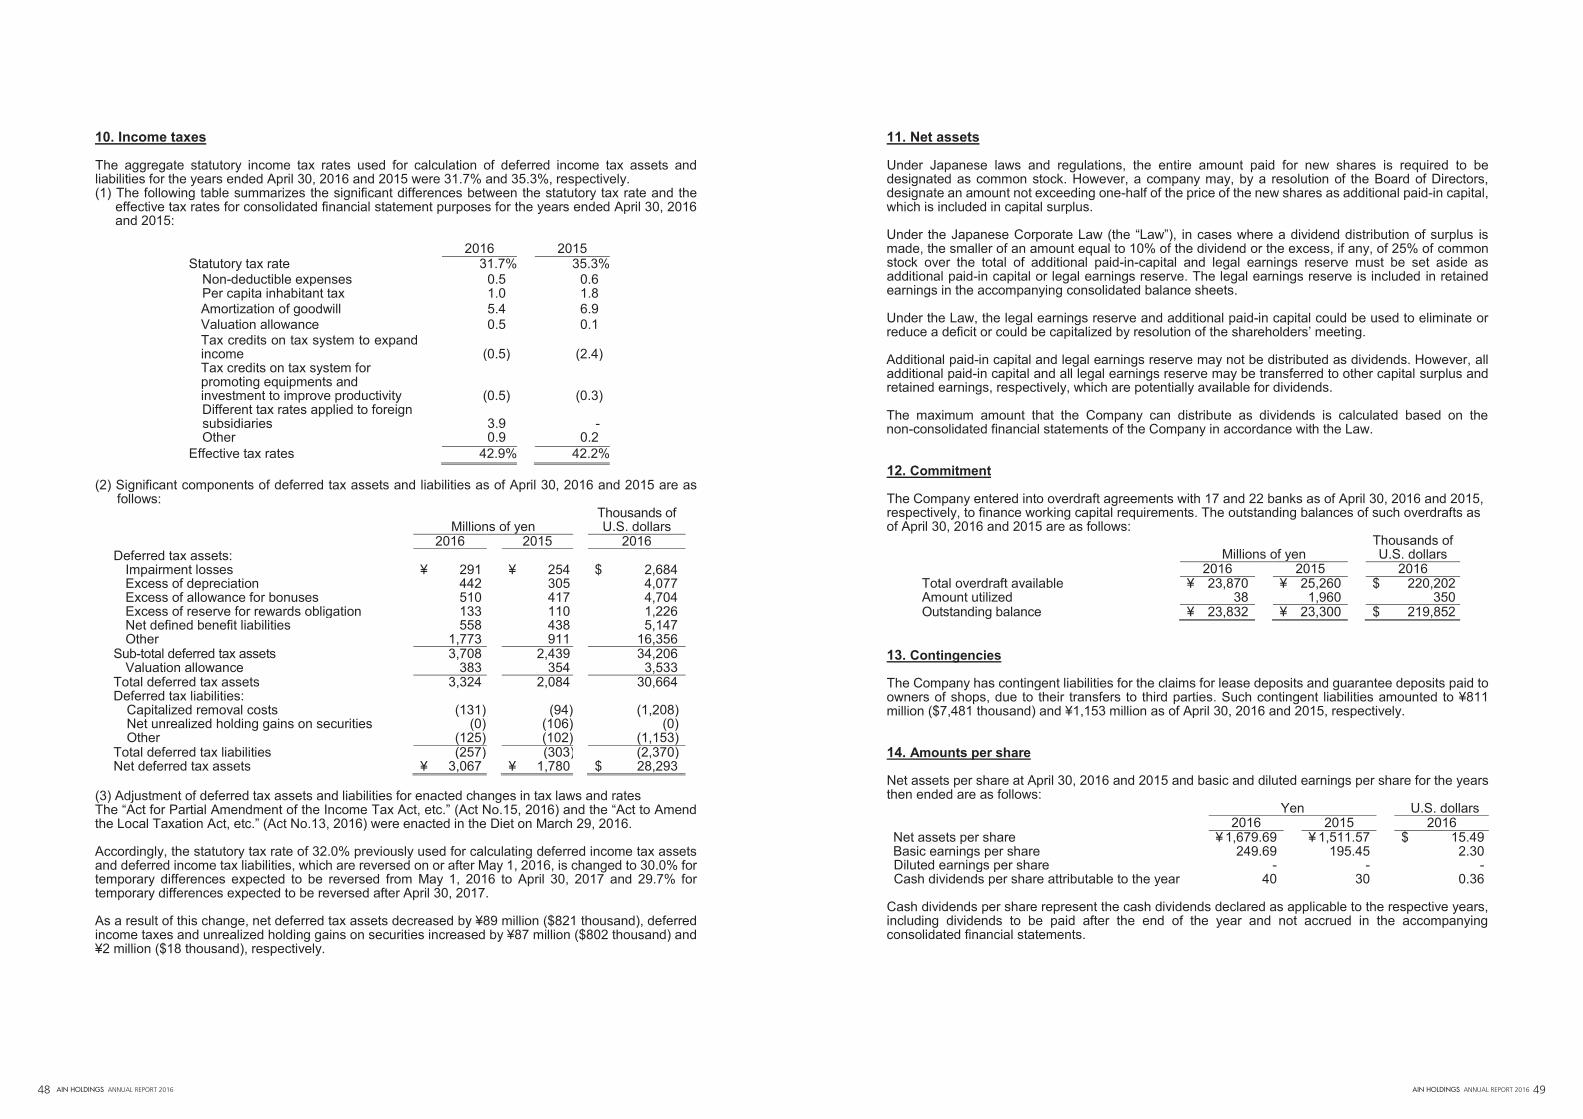
AIN HOLDINGS ANNUAL REPORT 2016 4948 AIN HOLDINGS ANNUAL REPORT 2016
10. Income taxes The aggregate statutory income tax rates used for calculation of deferred income tax assets and liabilities for the years ended April 30, 2016 and 2015 were 31.7% and 35.3%, respectively. (1) The following table summarizes the significant differences between the statutory tax rate and the
effective tax rates for consolidated financial statement purposes for the years ended April 30, 2016 and 2015:
2016 2015 Statutory tax rate 31.7% 35.3%
Non-deductible expenses 0.5 0.6 Per capita inhabitant tax 1.0 1.8 Amortization of goodwill 5.4 6.9 Valuation allowance 0.5 0.1 Tax credits on tax system to expand income
(0.5)
(2.4)
Tax credits on tax system for promoting equipments and investment to improve productivity
(0.5)
(0.3) Different tax rates applied to foreign subsidiaries
3.9
-
Other 0.9 0.2 Effective tax rates 42.9% 42.2%
(2) Significant components of deferred tax assets and liabilities as of April 30, 2016 and 2015 are as
follows: Thousands of Millions of yen U.S. dollars 2016 2015 2016 Deferred tax assets:
Impairment losses ¥ 291 ¥ 254 $ 2,684 Excess of depreciation 442 305 4,077 Excess of allowance for bonuses 510 417 4,704 Excess of reserve for rewards obligation 133 110 1,226 Net defined benefit liabilities 558 438 5,147 Other 1,773 911 16,356
Sub-total deferred tax assets 3,708 2,439 34,206 Valuation allowance 383 354 3,533
Total deferred tax assets 3,324 2,084 30,664 Deferred tax liabilities:
Capitalized removal costs (131) (94) (1,208) Net unrealized holding gains on securities (0) (106) (0) Other (125) (102) (1,153)
Total deferred tax liabilities (257) (303) (2,370) Net deferred tax assets ¥ 3,067 ¥ 1,780 $ 28,293
(3) Adjustment of deferred tax assets and liabilities for enacted changes in tax laws and rates The “Act for Partial Amendment of the Income Tax Act, etc.” (Act No.15, 2016) and the “Act to Amend the Local Taxation Act, etc.” (Act No.13, 2016) were enacted in the Diet on March 29, 2016. Accordingly, the statutory tax rate of 32.0% previously used for calculating deferred income tax assets and deferred income tax liabilities, which are reversed on or after May 1, 2016, is changed to 30.0% for temporary differences expected to be reversed from May 1, 2016 to April 30, 2017 and 29.7% for temporary differences expected to be reversed after April 30, 2017. As a result of this change, net deferred tax assets decreased by ¥89 million ($821 thousand), deferred income taxes and unrealized holding gains on securities increased by ¥87 million ($802 thousand) and ¥2 million ($18 thousand), respectively.
11. Net assets Under Japanese laws and regulations, the entire amount paid for new shares is required to be designated as common stock. However, a company may, by a resolution of the Board of Directors, designate an amount not exceeding one-half of the price of the new shares as additional paid-in capital, which is included in capital surplus. Under the Japanese Corporate Law (the “Law”), in cases where a dividend distribution of surplus is made, the smaller of an amount equal to 10% of the dividend or the excess, if any, of 25% of common stock over the total of additional paid-in-capital and legal earnings reserve must be set aside as additional paid-in capital or legal earnings reserve. The legal earnings reserve is included in retained earnings in the accompanying consolidated balance sheets. Under the Law, the legal earnings reserve and additional paid-in capital could be used to eliminate or reduce a deficit or could be capitalized by resolution of the shareholders’ meeting. Additional paid-in capital and legal earnings reserve may not be distributed as dividends. However, all additional paid-in capital and all legal earnings reserve may be transferred to other capital surplus and retained earnings, respectively, which are potentially available for dividends. The maximum amount that the Company can distribute as dividends is calculated based on the non-consolidated financial statements of the Company in accordance with the Law. 12. Commitment The Company entered into overdraft agreements with 17 and 22 banks as of April 30, 2016 and 2015, respectively, to finance working capital requirements. The outstanding balances of such overdrafts as of April 30, 2016 and 2015 are as follows:
Thousands of Millions of yen U.S. dollars 2016 2015 2016 Total overdraft available ¥ 23,870 ¥ 25,260 $ 220,202 Amount utilized 38 1,960 350 Outstanding balance ¥ 23,832 ¥ 23,300 $ 219,852
13. Contingencies The Company has contingent liabilities for the claims for lease deposits and guarantee deposits paid to owners of shops, due to their transfers to third parties. Such contingent liabilities amounted to ¥811 million ($7,481 thousand) and ¥1,153 million as of April 30, 2016 and 2015, respectively. 14. Amounts per share Net assets per share at April 30, 2016 and 2015 and basic and diluted earnings per share for the years then ended are as follows: Yen U.S. dollars 2016 2015 2016 Net assets per share ¥ 1,679.69 ¥ 1,511.57 $ 15.49 Basic earnings per share 249.69 195.45 2.30 Diluted earnings per share - - - Cash dividends per share attributable to the year 40 30 0.36
Cash dividends per share represent the cash dividends declared as applicable to the respective years, including dividends to be paid after the end of the year and not accrued in the accompanying consolidated financial statements.
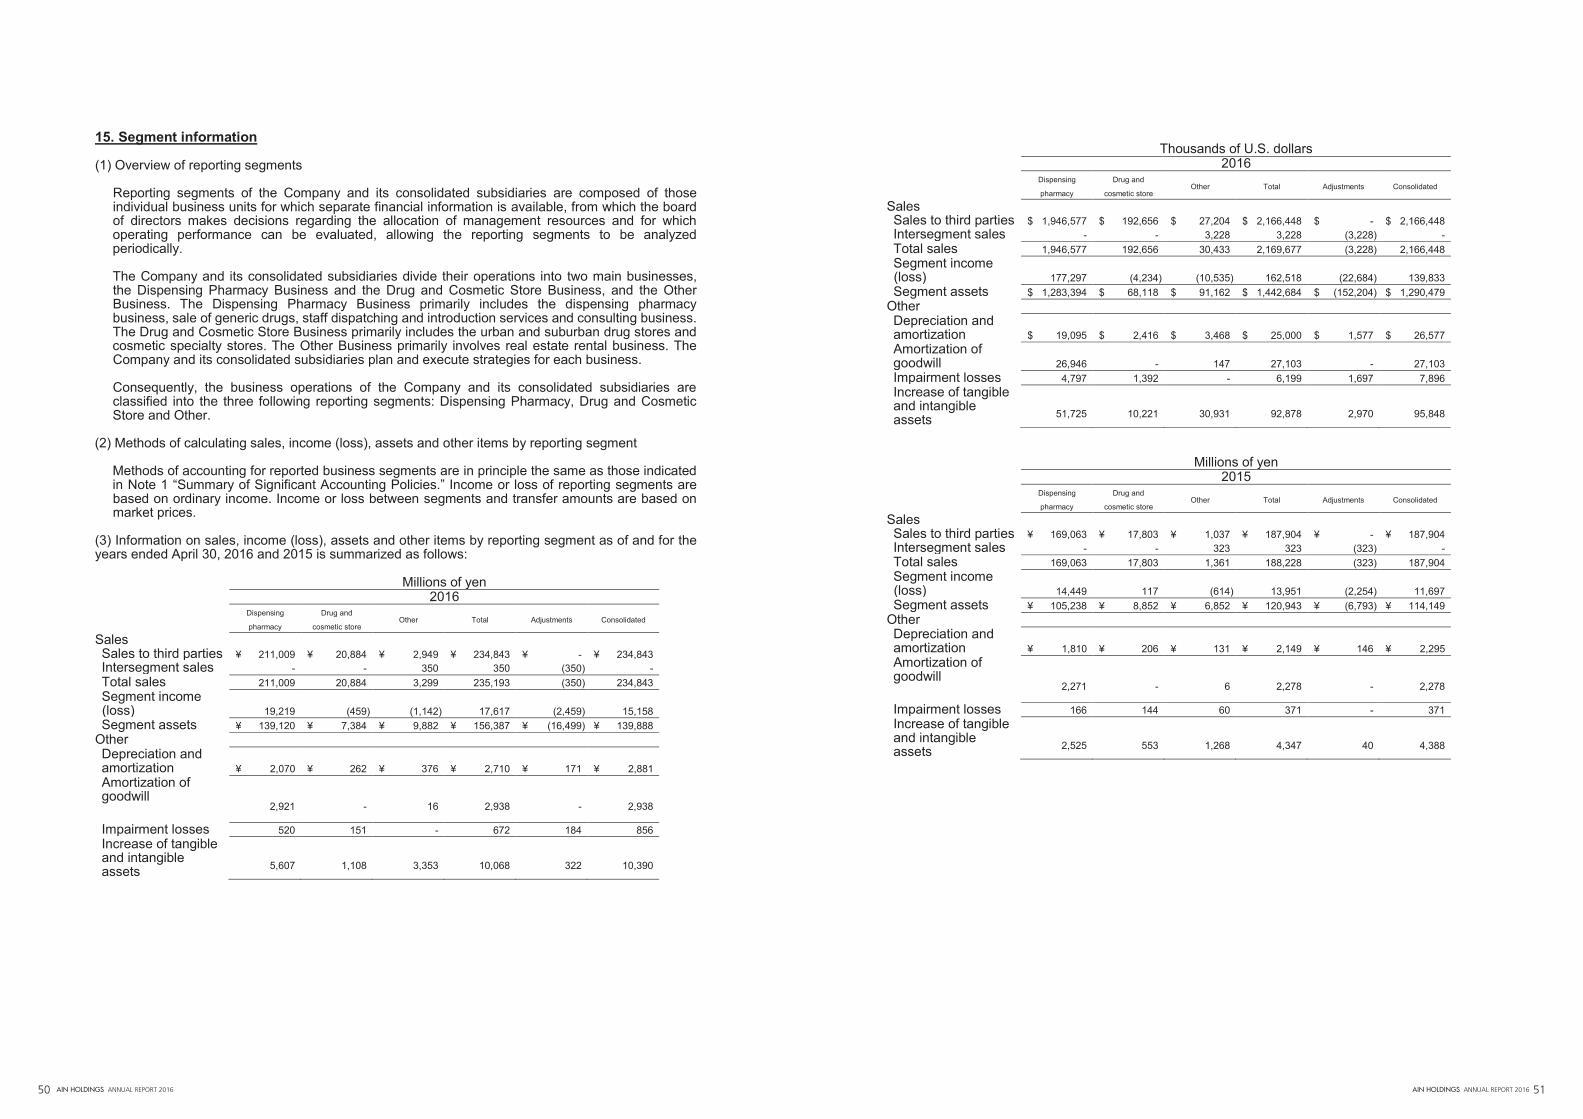
AIN HOLDINGS ANNUAL REPORT 2016 5150 AIN HOLDINGS ANNUAL REPORT 2016
15. Segment information (1) Overview of reporting segments
Reporting segments of the Company and its consolidated subsidiaries are composed of those individual business units for which separate financial information is available, from which the board of directors makes decisions regarding the allocation of management resources and for which operating performance can be evaluated, allowing the reporting segments to be analyzed periodically. The Company and its consolidated subsidiaries divide their operations into two main businesses, the Dispensing Pharmacy Business and the Drug and Cosmetic Store Business, and the Other Business. The Dispensing Pharmacy Business primarily includes the dispensing pharmacy business, sale of generic drugs, staff dispatching and introduction services and consulting business. The Drug and Cosmetic Store Business primarily includes the urban and suburban drug stores and cosmetic specialty stores. The Other Business primarily involves real estate rental business. The Company and its consolidated subsidiaries plan and execute strategies for each business. Consequently, the business operations of the Company and its consolidated subsidiaries are classified into the three following reporting segments: Dispensing Pharmacy, Drug and Cosmetic Store and Other.
(2) Methods of calculating sales, income (loss), assets and other items by reporting segment
Methods of accounting for reported business segments are in principle the same as those indicated in Note 1 “Summary of Significant Accounting Policies.” Income or loss of reporting segments are based on ordinary income. Income or loss between segments and transfer amounts are based on market prices.
(3) Information on sales, income (loss), assets and other items by reporting segment as of and for the years ended April 30, 2016 and 2015 is summarized as follows: Millions of yen 2016 Dispensing
pharmacy
Drug and
cosmetic store Other Total Adjustments Consolidated
Sales Sales to third parties ¥ 211,009 ¥ 20,884 ¥ 2,949 ¥ 234,843 ¥ - ¥ 234,843 Intersegment sales - - 350 350 (350) - Total sales 211,009 20,884 3,299 235,193 (350) 234,843 Segment income (loss)
19,219
(459)
(1,142)
17,617
(2,459)
15,158
Segment assets ¥ 139,120 ¥ 7,384 ¥ 9,882 ¥ 156,387 ¥ (16,499) ¥ 139,888 Other Depreciation and amortization
¥ 2,070
¥ 262
¥ 376
¥ 2,710
¥ 171
¥ 2,881
Amortization of goodwill
2,921 -
16
2,938
-
2,938
Impairment losses 520 151 - 672 184 856 Increase of tangible and intangible assets
5,607
1,108
3,353
10,068
322
10,390
Thousands of U.S. dollars 2016 Dispensing
pharmacy
Drug and
cosmetic store Other Total Adjustments Consolidated
Sales Sales to third parties $ 1,946,577 $ 192,656 $ 27,204 $ 2,166,448 $ - $ 2,166,448 Intersegment sales - - 3,228 3,228 (3,228) - Total sales 1,946,577 192,656 30,433 2,169,677 (3,228) 2,166,448 Segment income (loss)
177,297
(4,234)
(10,535)
162,518
(22,684)
139,833
Segment assets $ 1,283,394 $ 68,118 $ 91,162 $ 1,442,684 $ (152,204) $ 1,290,479 Other Depreciation and amortization
$ 19,095
$ 2,416
$ 3,468
$ 25,000
$ 1,577
$ 26,577
Amortization of goodwill
26,946
-
147
27,103
-
27,103
Impairment losses 4,797 1,392 - 6,199 1,697 7,896 Increase of tangible and intangible assets
51,725
10,221
30,931
92,878
2,970
95,848
Millions of yen 2015 Dispensing
pharmacy
Drug and
cosmetic store Other Total Adjustments Consolidated
Sales Sales to third parties ¥ 169,063 ¥ 17,803 ¥ 1,037 ¥ 187,904 ¥ - ¥ 187,904 Intersegment sales - - 323 323 (323) - Total sales 169,063 17,803 1,361 188,228 (323) 187,904 Segment income (loss)
14,449
117
(614)
13,951
(2,254)
11,697
Segment assets ¥ 105,238 ¥ 8,852 ¥ 6,852 ¥ 120,943 ¥ (6,793) ¥ 114,149 Other Depreciation and amortization
¥ 1,810
¥ 206
¥ 131
¥ 2,149
¥ 146
¥ 2,295
Amortization of goodwill
2,271 -
6
2,278
-
2,278
Impairment losses 166 144 60 371 - 371 Increase of tangible and intangible assets
2,525
553
1,268
4,347
40
4,388

Amortization of goodwill and unamortized balances by reporting segment as of and for the years ended April 30, 2016 and 2015 are summarized as follows: Millions of yen
2016 Dispensing
pharmacy
Drug and
cosmetic store Other Adjustments Consolidated
Amortization of goodwill ¥ 2,921 ¥ - ¥ 16 ¥ - ¥ 2,938 Unamortized balances of goodwill 33,111 - 226 - 33,337
Thousands of U.S. dollars
2016
Dispensing
pharmacy
Drug and
cosmetic store Other Adjustments Consolidated
Amortization of goodwill $ 26,946 $ - $ 147 $ - $ 27,103 Unamortized balances of goodwill 305,452 - 2,084 - 307,536
Millions of yen
2015 Dispensing
pharmacy
Drug and
cosmetic store Other Adjustments Consolidated
Amortization of goodwill ¥ 2,271 ¥ - ¥ 6 ¥ - ¥ 2,278 Unamortized balances of goodwill 26,286 - 53 - 26,340
16. Comprehensive income Each component of other comprehensive income (loss) for the years ended April 30, 2016 and 2015 was the following:
Thousands of Millions of yen U.S. dollars 2016 2015 2016 Unrealized holding (losses) gains on securities:
(Losses) gains arising during the year ¥ (428) ¥ 287 $ (3,948) Reclassification adjustments to losses 0 (6) 0 Amount before income tax effect (427) 280 (3,939) Income tax effect (137) 88 (1,263)
Total unrealized holding (losses) gains on securities
(290)
192
(2,675)
Remeasurments of defined benefit plans: Gains (losses) arising during the year 72 (64) 664 Reclassification adjustments to gains 34 43 313 Amount before income tax effect 107 (21) 987 Income tax effect 52 (4) 479
Total remeasurments of defined benefit plans 160 (16) 1,476 Total other comprehensive (loss) income ¥ (130) ¥ 175 $ (1,199)
17. Business combinations For the year ended April 30, 2016 (1) Transaction under common control (a) Overview of transaction (i) Names and details of businesses subject to the business combination
All business units with the exception of the Company’s Group management (ii) Date of the business combination November 1, 2015 (iii) Legal form of the business combination
An absorption-type split, with the Company as the Splitting Company and Ain Company Split Preparation Co., Ltd., a 100% subsidiary of the Company, as the Split Preparation Company
(iv) Name of the entity after the business combination
AIN PHARMACIEZ INC. (v) Background of and objective of the business combination
In the dispensing pharmacy business, the AIN HOLDINGS Group is accelerating its business development through new store launches and M&A activity. In addition, the Group is enhancing its drugstore function through “family pharmacies” and expanding the scale of its urban drugstores. To achieve further growth, the Group has decided to transition to a holding company system in order to clarify authority and responsibility of Group company in each segment, to promote management autonomy and to bolster corporate competitiveness as a group. In addition, separating group management and administration from business execution, we intend to enhance corporate governance, and we believe the holding company structure is best suited to realizing continual increases in corporate value in this manner.
(b) Outline of accounting method used
In accordance with "Accounting Standard for Business Combinations" and " Guidance on Accounting Standard for Business Combinations and Accounting Standard for Business Divestitures, we treated the merger as a transaction under common control.
(2) Business combination through acquisition (a) Business combinations (i) Name of the acquired company and its business
Name of acquired company - NP HOLDINGS Co., Ltd. Content of business - Group management and real estate leasing business
(ii) Main reasons for the business combination
Nishinihon Pharmacy Co., Ltd., and Setouchi Pharmacy Co., Ltd., subsidiaries of NP HOLDINGS Co., Ltd., operate 41 dispensing pharmacies centered on Kagawa Prefecture, solidly dominating that region.
In addition to internal workshops and study sessions, departmental meetings are held regularly for each specialized department. The company’s business policies have many points in common with those of AIN HOLDINGS INC., such as contributing to regional healthcare through “dispensing pharmacies at the heart of local communities” and expanding patient services.
We welcome the NP HOLDINGS Group, Shikoku’s leading dispensing pharmacy chain, into the AIN HOLDINGS Group. The addition enables us to strengthen our operations in the Shikoku region, where we have few pharmacies, as well as promoting the development of more pharmacies in the region than before. By also combining our mutual business expertise and enhancing patient services, we expect to augment the corporate value of the Group.
(iii) Date of the business combination
November 2, 2015 (iv) Legal form of the business combination
Acquisition of shares for cash consideration (v) Name of the entity after the business combination
No changes were made to the name of NP HOLDINGS Co., Ltd. (vi) Share of voting rights acquired
100% (vii) Main grounds for decision to acquire the company
The Company acquired shares in NP HOLDINGS Co., Ltd. for cash consideration. (b) Period of operations of the acquired company included in the consolidated financial statements
From October 1, 2015 to March 31, 2016 (c) Acquisition cost and consideration of the acquired business
Cash consideration for acquisition ¥5,400 million ($49,815 thousand) Cost of acquisition ¥5,400 million ($49,815 thousand)
(d) Major acquisition-related costs
Advisory fees ¥201 million ($1,854 thousand) (e) Amount of goodwill generated, its sources, and its amortization method and term
AIN HOLDINGS ANNUAL REPORT 2016 5352 AIN HOLDINGS ANNUAL REPORT 2016
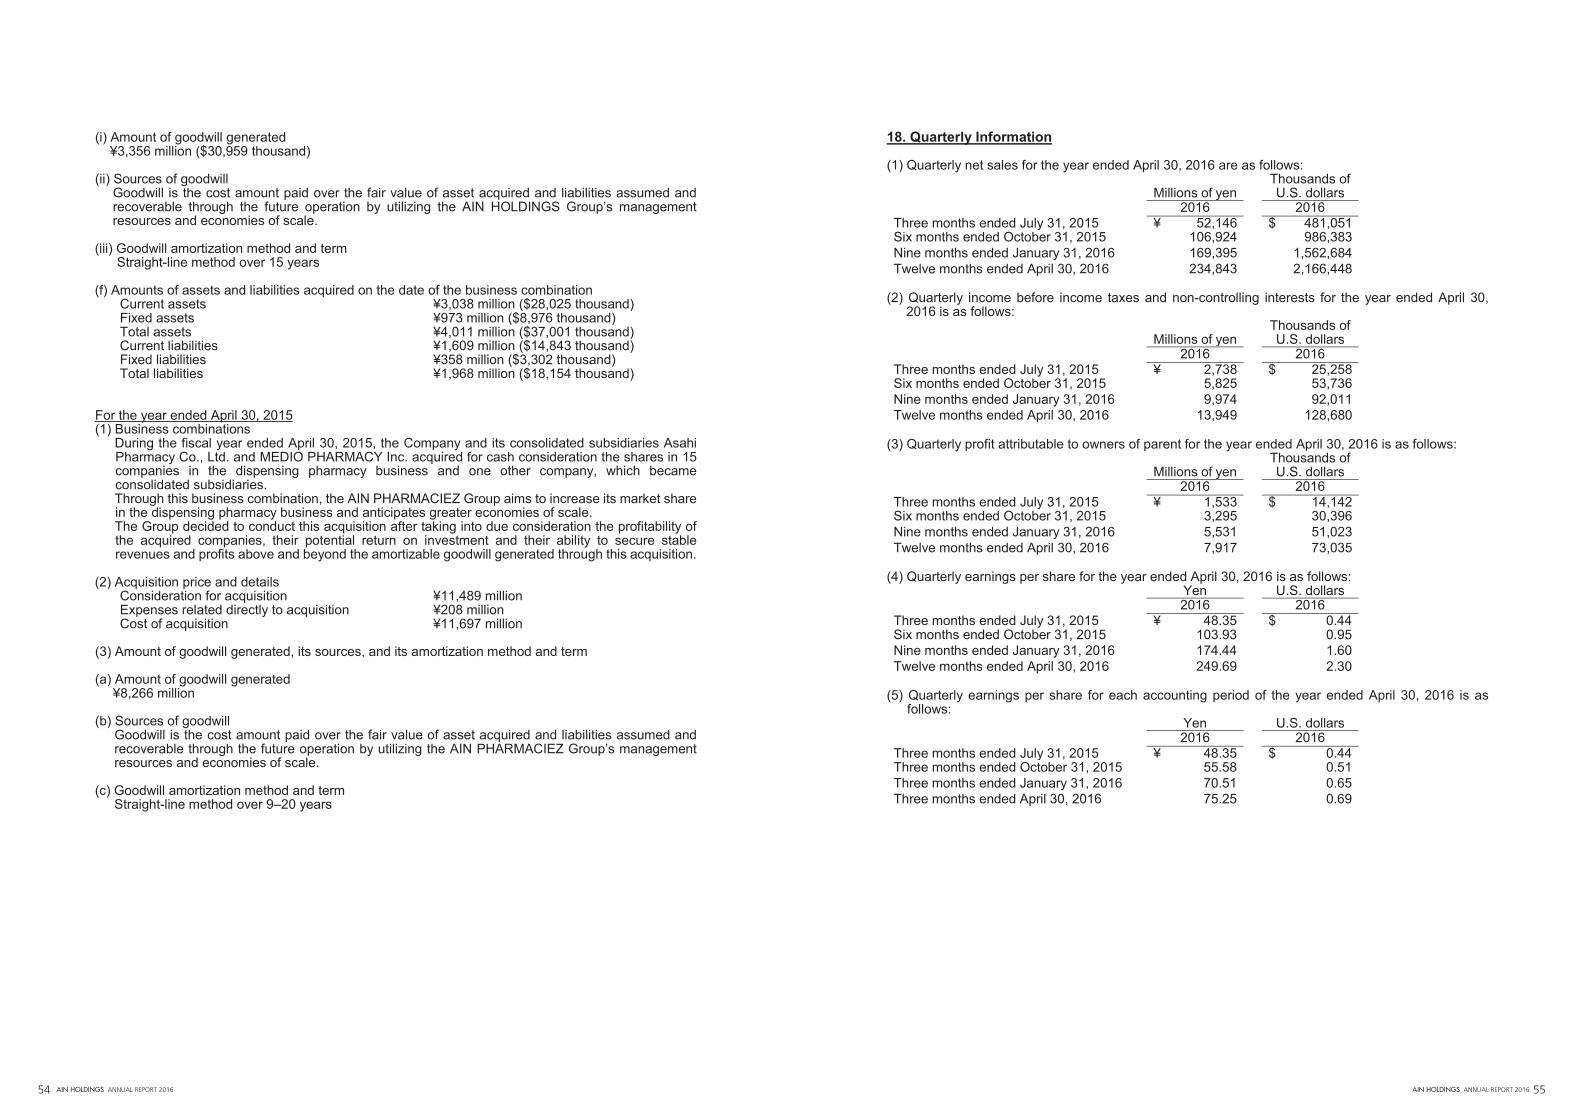
AIN HOLDINGS ANNUAL REPORT 2016 5554 AIN HOLDINGS ANNUAL REPORT 2016
(i) Amount of goodwill generated ¥3,356 million ($30,959 thousand)
(ii) Sources of goodwill Goodwill is the cost amount paid over the fair value of asset acquired and liabilities assumed and recoverable through the future operation by utilizing the AIN HOLDINGS Group’s management resources and economies of scale.
(iii) Goodwill amortization method and term Straight-line method over 15 years
(f) Amounts of assets and liabilities acquired on the date of the business combination
Current assets ¥3,038 million ($28,025 thousand) Fixed assets ¥973 million ($8,976 thousand) Total assets ¥4,011 million ($37,001 thousand) Current liabilities ¥1,609 million ($14,843 thousand) Fixed liabilities ¥358 million ($3,302 thousand) Total liabilities ¥1,968 million ($18,154 thousand)
For the year ended April 30, 2015 (1) Business combinations
During the fiscal year ended April 30, 2015, the Company and its consolidated subsidiaries Asahi Pharmacy Co., Ltd. and MEDIO PHARMACY Inc. acquired for cash consideration the shares in 15 companies in the dispensing pharmacy business and one other company, which became consolidated subsidiaries. Through this business combination, the AIN PHARMACIEZ Group aims to increase its market share in the dispensing pharmacy business and anticipates greater economies of scale. The Group decided to conduct this acquisition after taking into due consideration the profitability of the acquired companies, their potential return on investment and their ability to secure stable revenues and profits above and beyond the amortizable goodwill generated through this acquisition.
(2) Acquisition price and details
Consideration for acquisition ¥11,489 million Expenses related directly to acquisition ¥208 million Cost of acquisition ¥11,697 million
(3) Amount of goodwill generated, its sources, and its amortization method and term (a) Amount of goodwill generated ¥8,266 million
(b) Sources of goodwill
Goodwill is the cost amount paid over the fair value of asset acquired and liabilities assumed and recoverable through the future operation by utilizing the AIN PHARMACIEZ Group’s management resources and economies of scale.
(c) Goodwill amortization method and term Straight-line method over 9–20 years
18. Quarterly Information (1) Quarterly net sales for the year ended April 30, 2016 are as follows: Thousands of Millions of yen U.S. dollars 2016 2016 Three months ended July 31, 2015 ¥ 52,146 $ 481,051 Six months ended October 31, 2015 106,924 986,383 Nine months ended January 31, 2016 169,395 1,562,684 Twelve months ended April 30, 2016 234,843 2,166,448
(2) Quarterly income before income taxes and non-controlling interests for the year ended April 30,
2016 is as follows: Thousands of Millions of yen U.S. dollars 2016 2016 Three months ended July 31, 2015 ¥ 2,738 $ 25,258 Six months ended October 31, 2015 5,825 53,736 Nine months ended January 31, 2016 9,974 92,011 Twelve months ended April 30, 2016 13,949 128,680
(3) Quarterly profit attributable to owners of parent for the year ended April 30, 2016 is as follows: Thousands of Millions of yen U.S. dollars 2016 2016 Three months ended July 31, 2015 ¥ 1,533 $ 14,142 Six months ended October 31, 2015 3,295 30,396 Nine months ended January 31, 2016 5,531 51,023 Twelve months ended April 30, 2016 7,917 73,035
(4) Quarterly earnings per share for the year ended April 30, 2016 is as follows: Yen U.S. dollars 2016 2016 Three months ended July 31, 2015 ¥ 48.35 $ 0.44 Six months ended October 31, 2015 103.93 0.95 Nine months ended January 31, 2016 174.44 1.60 Twelve months ended April 30, 2016 249.69 2.30
(5) Quarterly earnings per share for each accounting period of the year ended April 30, 2016 is as
follows: Yen U.S. dollars 2016 2016 Three months ended July 31, 2015 ¥ 48.35 $ 0.44 Three months ended October 31, 2015 55.58 0.51 Three months ended January 31, 2016 70.51 0.65 Three months ended April 30, 2016 75.25 0.69
56 AIN HOLDINGS ANNUAL REPORT 2016
CORPORATE DATA(Fiscal 2016)
Corporate NameAIN HOLDINGS INC.
Head Office5-2-4-30, Higashisapporo, Shiroishi-ku, Sapporo, Hokkaido 003-0005, Japan
EstablishedAugust 1969
Paid-in Capital¥8,682 million
Number of EmployeesConsolidated: 5,511Non-consolidated: 137
Business LinesPlanning, management and operation of the corporate Group, focused on dispensing pharmacy and drugstore operation, generic drug wholesaling, sales of cosmetics, and the Group’s other businesses
STOCK INFORMATION(Fiscal 2016)
Transfer Agent Mizuho Trust & Banking Co., Ltd.
Stock ListingsFirst Section of the Tokyo Stock Exchange and Sapporo Securities Exchange
Securities Code Number9627
Fiscal Year May 1 to April 30 of the following year
Ordinary General Meeting of ShareholdersJuly
Date of RecordApril 30(The Company will announce other dates as and when required.)
Number of Shares Outstanding31,888,212 shares(including treasury stock)* The Company conducted a 2-for-1 stock split
of common shares with an effective date of October 1, 2014.
Number of Shareholders3,817
Major Shareholders (As of April 30, 2016)
Shareholders
Number of shares held (thousand
shares)
Share-holding ratio (%)
Kiichi Otani 3,238 10.21
Seven & i Holdings Co., Ltd. 2,480 7.82
Retirement Benefit Trust managed by Mizuho Trust & Banking Co., Ltd. (Marubeni Corporation account)*2; Trust & Custody Services Bank, Ltd. as a Trustee of Retrust
1,594 5.03
The Hokkaido Bank, Ltd. 1,472 4.64
JPMC OPPENHEIMER JASDEC LENDING ACCOUNT 1,163 3.67
North Pacific Bank, LTD. 1,085 3.42
ML PRO SEGREGATION ACCOUNT 1,012 3.19
STATE STREET BANK AND TRUST COMPANY 974 3.07
Japan Trustee Services Bank, Ltd. (Trust Account) 812 2.56
The Norinchukin Bank 600 1.89
Notes: 1. The figure excludes 180,595 shares of the treasury stock owned by the Company. 2. Shares held in the Retirement Benefit Trust managed by Mizuho Trust & Banking Co., Ltd. (Marubeni
Corporation account) are part of Marubeni Corporation’s retirement benefit trust. 3. All shares held in Japan Trustee Services Bank, Ltd. (Trust Account) are related to trust services.
Investor Information
AIN HOLDINGS ANNUAL REPORT 2016 57