Embed Size (px)
Citation preview

Positive and NondestructiveIdentification of Acrylic-BasedCoatingsUsing Partial Least Squares Discriminant Analysis withthe Agilent 4300 Handheld FTIR
Authors
Dipak Mainali and Leung Tang
Agilent Technologies, Inc.
Application Note
Materials Testing and Research
Introduction
Acrylic-based coatings are produced in formulations to suit all the major marketswithin the coatings industry. Industrial, decorative, printing inks, powder, and wallcoverings are some of the market areas where acrylic-based coatings are widelyused. Water emulsion and film-forming acrylic-based coatings are of particularimportance due to their relative high performance and extremely low volatile organiccompound (VOC) emissions.
To ensure performance and longevity, it is critical to properly apply the correctacrylic coating in the substrate. Equally important is the ability to assess changes inthe chemical composition of the coating under actual use. For this reason, aportable analyzer is of great interest to engineers who are responsible for ensuringthat coatings meet their performance claims.

2
In this application note, we used the Agilent 4300 HandheldFTIR (Figure 1) to analyze 14 industrial acrylic coatings thathave the same binder type and similar chemical composition.First, we used an extended library method to identify theacrylic coatings. However, the library search method was notsensitive enough to clearly distinguish between similar coat-ings. To clearly separate these we used a partial least squaresdiscriminant analysis (PLS-DA) multivariate classificationmethod for more sensitive discrimination of the coatings,since they have similar binder types. We combined thePLS-DA algorithm with unique Agilent MicroLab PCComponent Reporting to provide precise identification of eachacrylic coating.
Experimental
The acrylic coatings were individually spray-coated onto sepa-rate 4 × 9 inch Q panels (~10 × 23 cm), and 10 spectra werecollected randomly from each panel. Acquisition of multiplespectra across the coating was important to account for paintinhomogeneity and paint application variance. To develop thelibrary for each acrylic coating, eight of these randomly collected spectra were used to populate the library, and theremaining two spectra were used as the test unknowns.
The 4300 Handheld FTIR spectrometer, coupled with a diffusereflectance interface, was used to measure the 14 proprietaryacrylic coatings (labeled A to N) using spectral acquisitionconditions of 128 co-added interferograms at 8 cm–1 resolu-tion from 5,200 to 650 cm–1. The total spectral measurementtime was less than 40 seconds per spectrum. Similar mea-surements were collected using the 4300 FTIR equipped withthe attenuated total reflectance (ATR) sample interface forcomparison.
Library searches were carried out using the software similar-ity match algorithm of the 4300 FTIR MicroLab PC. PLS-DAcalibration models were developed using eight spectra foreach acrylic coating out of 10 collected spectra. The twospectra that were not included in building the PLS-DA modelwere used as test spectra to assess the final MicroLabmethod for coating identification. For each calibration modeldevelopment, spectra were preprocessed using mean centering, multiplicative scatter correction, and a nine-pointSavitzky-Golay first derivative.
Figure 1. Agilent 4300 Handheld FTIR spectrometer with externalreflectance (diffuse and specular) and internal reflectance (ATR)sampling interfaces. Interfaces can be changed in seconds, withno realignment required.
Diffuseinterface
ATR interface
External reflectanceinterface

3
Results and Discussion
The diffuse reflectance spectra of 14 acrylic coatings wereused to build the library of coatings, and also to performPLS-DA classification. Diffuse reflectance measurement ispreferred since more spectral information related to binder,pigment, and additives is obtained as a result of the higherpenetration of the IR beam into the coating, as compared tosurface-sensitive ATR measurement (Figure 2). In addition, diffuse reflectance measurement of coatings is nondestructiveand highly reproducible, compared to ATR measurement.
The library method for coating identification was developedusing a similarity search algorithm in the MicroLab PC soft-ware. The library search results for the test spectra for eachcoating are shown in Table 1. The library was constructed bymultiple entries of spectra per coating. The primary hit group(1st, best matching, A) and the secondary hit group (2nd, bestmatching, E) are listed in the library hit column. Figure 3 dis-plays the advantages of having multiple entries where the hitquality value for the primary group and the secondary groupranges from 0.99986 to 0.99952 and 0.99134 to 0.99045,respectively.
Figure 2. ATR and diffuse reflectance spectra of the same acrylic-based paint A. Thediffuse reflectance spectra provide more information from overall strongerabsorbance bands, as well as the ability to record bands that are too weak toobserve by ATR. The maximum absorbance for the diffuse reflectance andATR are indicated by the blue and red lines, respectively.
Table 1. Fourteen Acrylic-based Coatings, A to N, and Their Primary and SecondaryHit Sets
Note that a green tick was attributed only if both test spectra gave correct positiveidentification of coating type. For coatings B and C, a single spectrum (A, spectra 8)separated the groups.
5,000 4,500 4,000 3,500
Diffuse
ATR
3,000 2,500 2,000 1,500 1,000
0
0.5
1.0
1.5
Wavenumber (cm–1)
Abs
orba
nce
Coating ID Library hit Coating ID Library hit
A 1st = A, 2nd = E H 1st = H, 2nd = D
B 1st = B, 2nd = A spectra 8, C I 1st = I, 2nd = F
C 1st = C, 2nd = A spectra 8, E J 1st = J, 2nd = D
D 1st = D, 2nd = J K 1st = K, 2nd = I
E 1st = E, 2nd = A L 1st = L, 2nd = C
F 1st = F, 2nd = I M 1st = M, 2nd = A
G 1st = G, 2nd = A N 1st = N, 2nd = G

4
The individual spectral primary hit quality value in all caseswas better than >0.998 for both test spectra when checkedagainst all 14 acrylic-based coatings in the library. The topeight library search results for two test spectra for each coat-ing formulation A to N indicated the correct match. In allcases, the next best hit (that is, the 9th ranked hit) was notthe correct coating, and the hit quality value ranged from0.892 to 0.997. In some cases, the secondary hit quality valuewas as high as 0.997, indicating that the library search resultmay not be sufficient for the proper identification of the coat-ings with high confidence, especially when the hit qualityvalues differ very slightly between the correct and incorrectmatch-coating results. Therefore, for the coatings with similarchemical formulations, a more rigorous statistical analysismethod is needed to gain confidence on identification of thecorrect coating.
Multivariate discriminant analysis techniques, which capturemore spectral variance than library search algorithms, areneeded to provide confidence on coating identification of similar formulations. Multivariate analysis methods (MVA) areused both to discriminate (qualitative analysis), and to mea-sure the extent of processes (quantitative analysis) such asdegree of cure, days in a weatherometer, or even amount oftrapped solvent remaining in an analysis of coating-plus-mixture ratios.
We have examined both the PCA and PLS-DA approachesand, though both are effective, we implemented the lattermethod in the 4300 FTIR MicroLab PC software. PLS-DA isconsidered a more sensitive discriminant analysis techniquecompared to PCA when separating spectra that are nearlyidentical. PLS-DA is a supervised classification techniquewhere the analyst assigns an arbitrary membership value toeach group of spectra, which are used for classification. Oncevalues are assigned to define a class, the calibration model isdeveloped in a similar manner to building a PLS quantitativecalibration model. Finally, after a calibration plot is obtained, athreshold y-value is chosen from the PLS plot to classify thegroups based on their distribution profile. The calibrated clas-sification model can then predict the identity of the unknown samples relative to one of the defined classes.
Coating A
Coating E
Figure 3. Library search results with hit quality value of acrylic coating type A test spectra (left); spectrum of test sample (red) and best match from the spectral library (blue) (right). Note: A2 = coating A by diffuse and posn. 10 = 10th position on Q-panel.
5
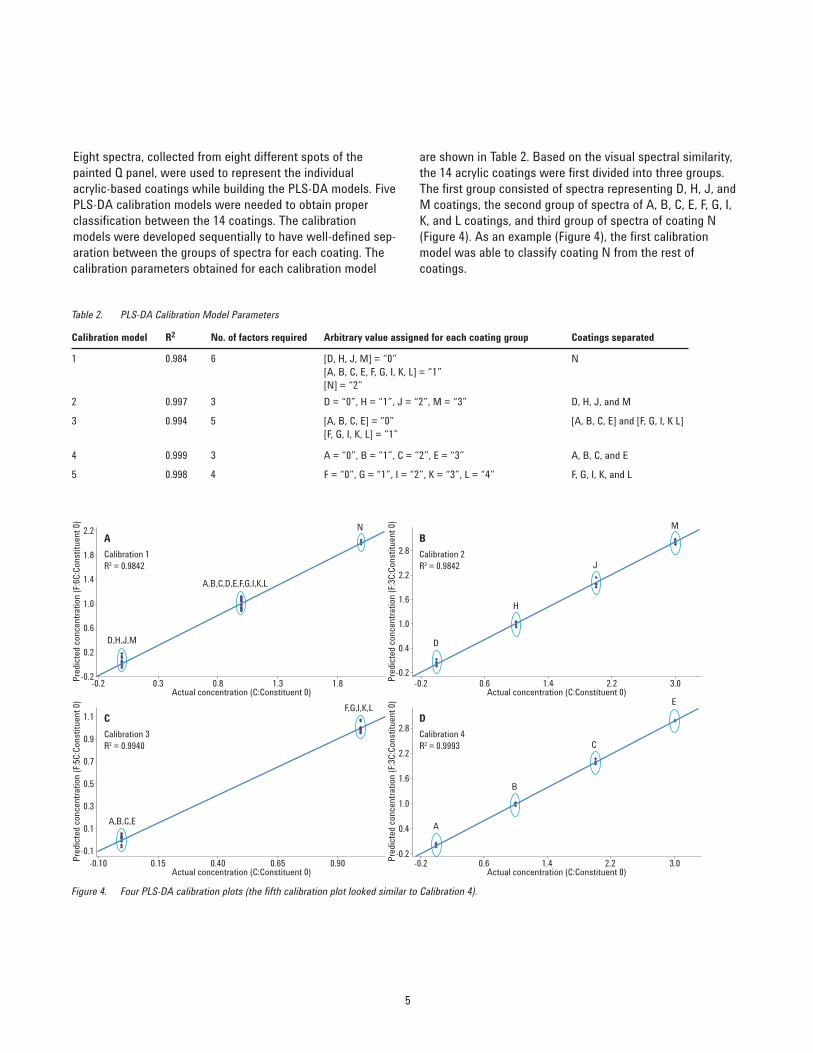
Eight spectra, collected from eight different spots of thepainted Q panel, were used to represent the individual acrylic-based coatings while building the PLS-DA models. FivePLS-DA calibration models were needed to obtain proper classification between the 14 coatings. The calibrationmodels were developed sequentially to have well-defined sep-aration between the groups of spectra for each coating. Thecalibration parameters obtained for each calibration model
are shown in Table 2. Based on the visual spectral similarity,the 14 acrylic coatings were first divided into three groups.The first group consisted of spectra representing D, H, J, andM coatings, the second group of spectra of A, B, C, E, F, G, I,K, and L coatings, and third group of spectra of coating N(Figure 4). As an example (Figure 4), the first calibrationmodel was able to classify coating N from the rest of coatings.
Figure 4. Four PLS-DA calibration plots (the fifth calibration plot looked similar to Calibration 4).
Table 2. PLS-DA Calibration Model Parameters
Calibration model R2 No. of factors required Arbitrary value assigned for each coating group Coatings separated
1 0.984 6 [D, H, J, M] = “0” [A, B, C, E, F, G, I, K, L] = “1” [N] = “2”
N
2 0.997 3 D = “0”, H = “1”, J = “2”, M = “3” D, H, J, and M
3 0.994 5 [A, B, C, E] = “0”[F, G, I, K, L] = “1”
[A, B, C, E] and [F, G, I, K L]
4 0.999 3 A = “0”, B = “1”, C = “2”, E = “3” A, B, C, and E
5 0.998 4 F = “0”, G = “1”, I = “2”, K = “3”, L = “4” F, G, I, K, and L
-0.2 0.3 0.8
Calibration 1
D,H,J,M
A,B,C,D,E,F,G,I,K,L
N
R2 = 0.9842
1.3 1.8-0.2
0.2
0.6
1.0
1.4
1.8
2.2A
Actual concentration (C:Constituent 0)
Pred
icte
d co
ncen
trat
ion
(F:6
C:Co
nstit
uent
0)
-0.10 0.15 0.40
Calibration 3
A,B,C,E
F,G,I,K,L
R2 = 0.9940
0.65 0.90-0.1
0.1
0.3
0.5
0.7
0.9
1.1 C
Actual concentration (C:Constituent 0)
Pred
icte
d co
ncen
trat
ion
(F:5
C:Co
nstit
uent
0)
-0.2 0.6 1.4 2.2 3.0
Calibration 2
D
H
J
M
R2 = 0.9842
-0.2
0.4
1.0
1.6
2.2
2.8B
Actual concentration (C:Constituent 0)
Pred
icte
d co
ncen
trat
ion
(F:3
C:Co
nstit
uent
0)
-0.2 0.6 1.4 2.2 3.0
Calibration 4
A
B
C
E
R2 = 0.9993
-0.2
0.4
1.0
1.6
2.2
2.8D
Actual concentration (C:Constituent 0)
Pred
icte
d co
ncen
trat
ion
(F:3
C:Co
nstit
uent
0)

6
The second calibration plot was able to classify between fourcoatings D, H, J, and M. The third calibration plot classifiedbetween two groups, [A, B, C, E] and [F, G, I, K, L]. The fourthcalibration plot classified between four coatings A, B, C, andE. Similarly, the fifth calibration plot classified between theremaining five coatings F, G, I, K, and L. Therefore, with fiveseparate PLS-DA calibration plots, the classification of all14 acrylic-based coatings was successfully obtained.However, and most importantly, the next step combined allcalibration models into one method for the identification of anunknown sample.
The innovative Agilent MicroLab PC Software, with a uniqueComponent Reporting feature, is able to incorporate five cali-bration models into one single method. The final method canpositively identify all 14 acrylic coating test spectra success-fully. In Component Reporting, the threshold y-value fromeach calibration plot was used to set the logic so that theappropriate calibration models were executed as necessary topredict the unknown spectra (Figure 5). Several conditionscan be placed on each component using logic statements. Forexample, coating N uses the Mahalanobis distance(MDistance) to determine if the sample is statistically withinthe calibration set. Component Reporting allows severalpieces of information taken from the five distinct calibrationsto be combined to yield a single informative result (Figure 6).In effect, the specialty knowledge usually required to differen-tiate closely related coatings can be built into the method,making an advanced analysis automatic and field deployable.
Figure 5. The Component Reporting feature of Agilent MicroLab PC Software allows conditions to beset to select the correct calibration model, and to choose the component to be reported in thefinal result.

7
Conclusions
The identification of specific acrylic coatings was performedusing two different methods of discrimination. A similaritymatch algorithm was used to correctly identify specific acryliccoatings. Although they were correctly identified, the limitedstatistical basis of the library search did not provide themeans to positively identify closely related coatings.Discriminant techniques, such as PLS-DA are statisticallybased, providing greater confidence in the match found. Aseries of PLS-DA calibration models were combined into onemethod using the Agilent 4300 MicroLab PC ComponentReporting capability. This method quickly and successfully differentiated and identified these very similar coatings. ThePLS-DA methods provide an extra layer of security and confidence in the identification of closely matched acryliccoatings.
We have shown that the Agilent 4300 Handheld FTIR,equipped with the diffuse sample interface, is well suited forpositive material identification of coatings. The spectrometeris particularly useful because of its portability and availablesample interfaces, which enable the analysis and identifica-tion of specific formulations on a coated article regardless oflocation, size, and shape. Since the spectrometer is taken tothe sample, we have a truly nondestructive method for ana-lyzing coatings. In addition, a sample does not need to beexcised for measurement in a lab. We have shown that thediffuse reflectance measurement is preferable since morespectral information is gained, and the measurement is trulynondestructive because the coating surface is not marred orstressed in any way during spectral analysis.
Figure 6. Final result display screen where the coating spectrum is identified as coating A.

www.agilent.com/chem
Agilent shall not be liable for errors contained herein or for incidental or consequentialdamages in connection with the furnishing, performance, or use of this material.
Information, descriptions, and specifications in this publication are subject to changewithout notice.
© Agilent Technologies, Inc., 2015Printed in the USAJune 5, 20155991-5965EN
For More Information
These data represent typical results. For more information onour products and services, visit our Web site atwww.agilent.com/chem.