Embed Size (px)
Citation preview

Positive Behavioral Interventions &
Support Module 6: Making Data-
Based Decisions

Ohio PBIS Training
Modules
Module 1 Introduction to PBIS
Module 2 Developing Clear School-wide
Expectations
Module 3 Teaching Behavior Expectations
Across All Settings
Module 4 Encouraging and Acknowledging
Desired Behavior
Module 5 Discouraging Problem Behavior
Module 6 Data-Based Decision-Making
2 2

Learning
Objectives Module 6: Making Data-Based
Decisions
3
• Understand the rationale for establishing a data-based decision-
making system
• Learn how to apply the steps in making data based decisions
• Learn how to collect and use data for decision-making for the
school, targeted groups, and individual students
• Define “problem statements” that can lead to functional
solutions
• Learn how to access and use PBIS assessments, surveys, and
tools to inform PBIS leadership teams
3

Data-based
Decision-making
• Prior to making changes within the school
environment, it is important to know what needs to
be changed
• Information about what is going on has to be
accurate and useful for identifying problems
• Analyze problems so that interventions can be
effective and efficient
4

• Essential for good decision-making
• Professional accountability
• Decisions made with accurate data
are more likely to be:
(a) implemented
(b) effective
Reasons to Collect
Data
5

Determine what questions you want to answer
Determine what data will help to answer questions
Determine the simplest way to get data
Put system in place to collect data
Analyze data to answer questions
Steps for Making Data-Based
Decisions
Focus on both Academic and Social Outcomes
6 6

Examples
• Can we predict problems/success?
• Possible “function” of problem behavior?
• Who needs targeted or intensive academic supports?
• What environmental changes/supports are needed?
Determine what questions you want to answer
8 8

9

Existing data set(s)
Current data collection
Additional / new data
Determine what data will help to answer questions
Confidence in accuracy?
Complete picture?
10 10

11

Determine the simplest way to get data
• Agreement on definitions
• Standard forms / process
• Frequency of collection
• Target “Multi-purpose” data/use
12

13
Put system in place to collect data
• Build on existing systems
• Add components over time
• Central entry point
14

15

Analyze data to
answer questions
• Trends
• Instruction & supports (in place/not in place)
• Pre/post “big outcomes”
• Comparisons (norm / local)
16

17

18

• Information collected should be meaningful
to the school.
• Proactive school year planning
• Data should be available for team decision-
making throughout the year.
Data Collected Are Meaningful (Functional)
19

Using Meaningful Data
to Improve Decision
Making
What type of data do we review?
•Referrals per month
•Referrals by location
•Referral by type of problem behavior
•Referrals by time of day
•Referrals by student
20 20

R Number of Office Discipline Referrals
By Month What could be the possible causes for the high reporting incidences in December and May?
21
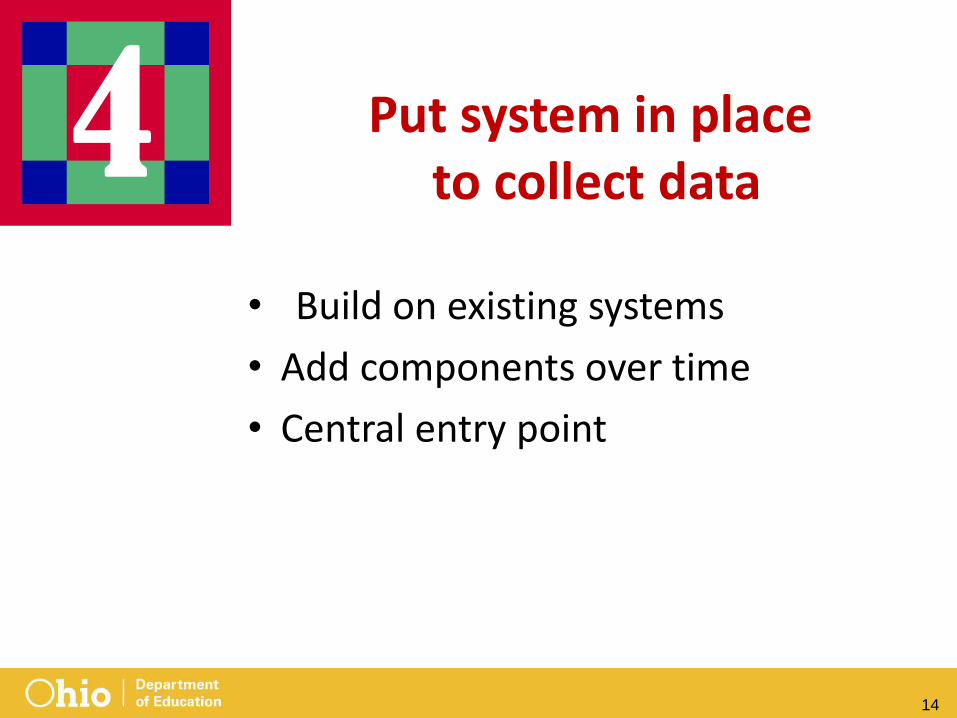
Number of Office Discipline Referrals
By Location
• Where are the problems occurring? • Are there problems in many locations, clusters of locations,
or one location?
22

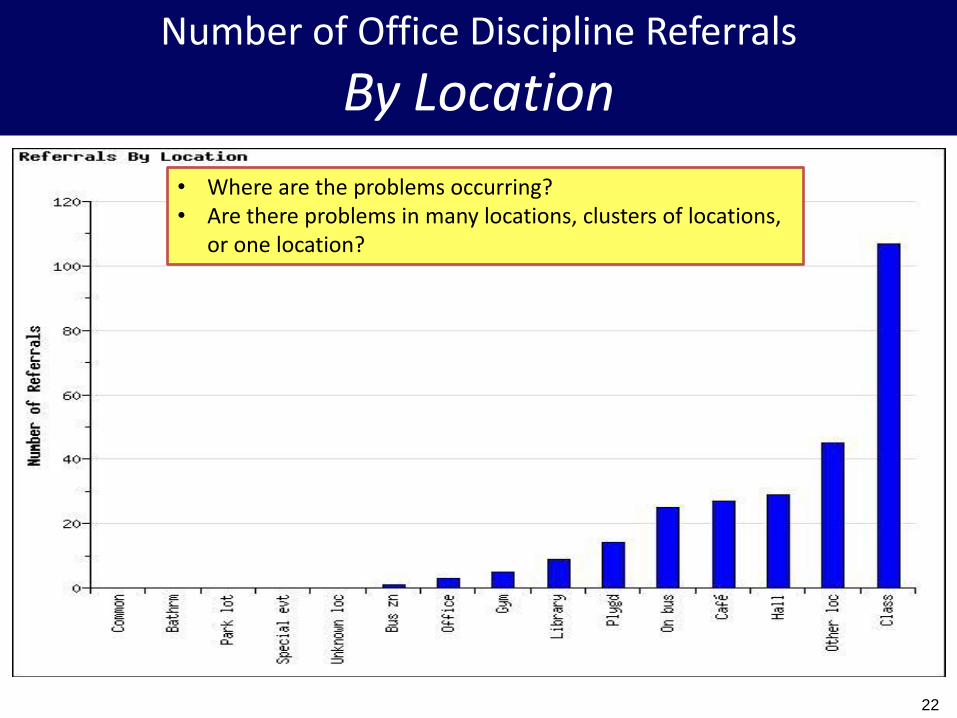
Number of Office Discipline Referrals
By Problem Behavior
What behaviors are occurring most often?
23
Number of Office Discipline Referrals
By Time
• What time are there problems occurring? • What could be possible reasons for the spikes in referrals
during those times?
24

0123456789
10111213141516171819202122232425
1 9 17 25 33 41 49 57 65 73 81 89 97 105 113 121 129 137 145 153 161 169 177
Student #
Number of Office Discipline Referrals
By Student
Who is contributing to the problem?
25
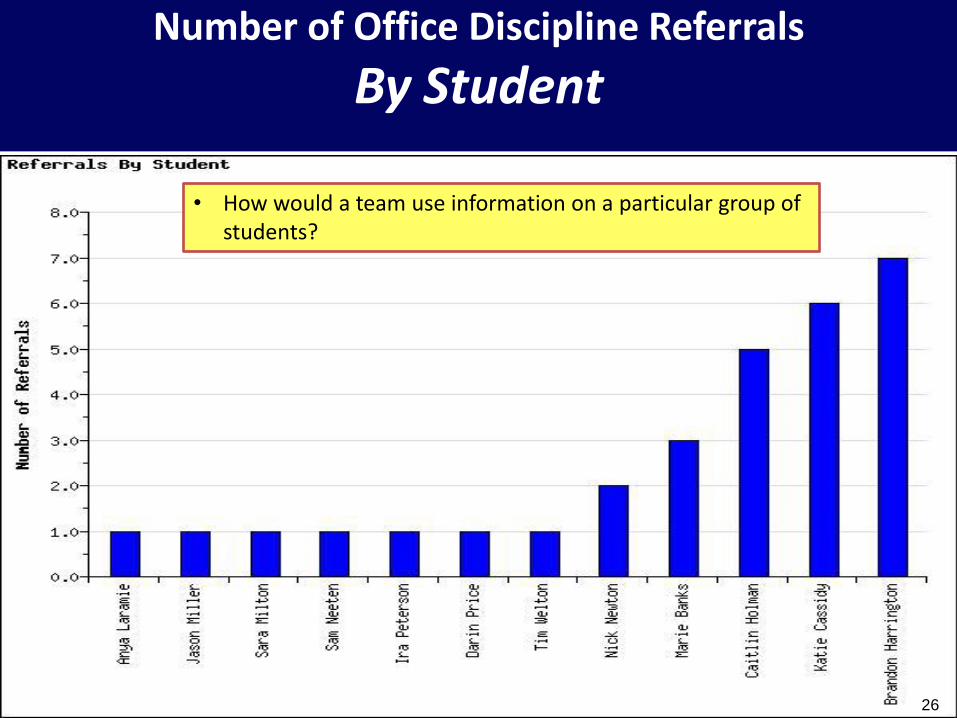
Number of Office Discipline Referrals
By Student
• How would a team use information on a particular group of students?
26
R A
vera
ge R
efe
rral
s P
er
Day
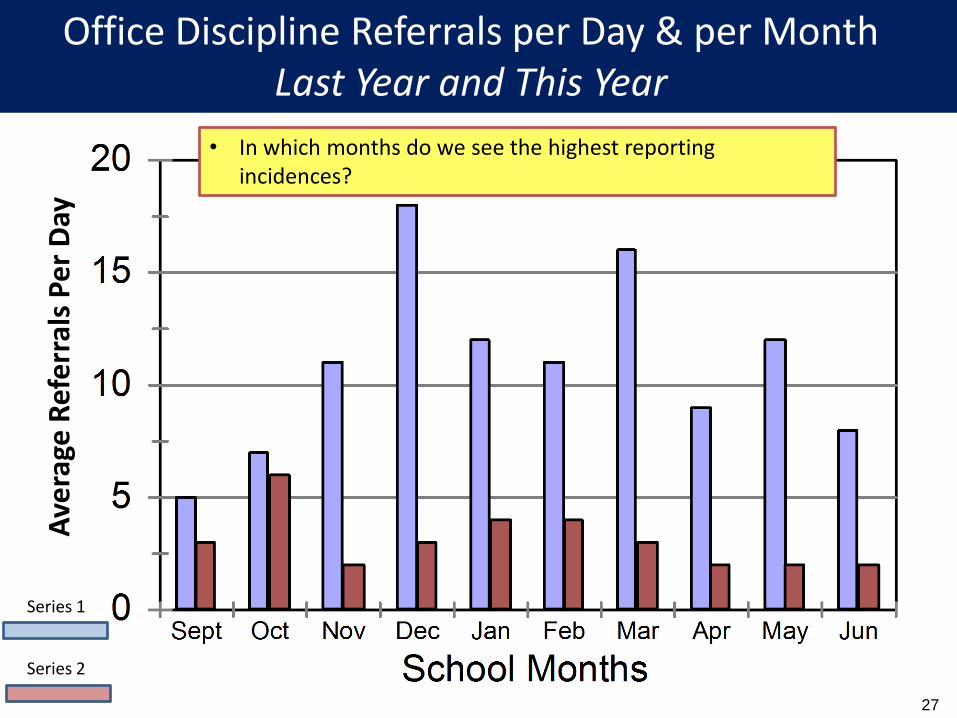
Office Discipline Referrals per Day & per Month
Last Year and This Year
Series 2
Series 1
• In which months do we see the highest reporting incidences?
27

IF...
FOCUS ON...
More than 40% of students receive one or more office referrals
More than 2.5 office referrals per student
School Wide System
More than 35% of office referrals come from non-classroom settings
More than 15% of students referred from non-classroom settings
Non-Classroom
System
More than 60% of office referrals come from the classroom
50% or more of office referrals come from less than 10% of classrooms
Classroom Systems
More than 10-15 students receive 5 or more office referrals Targeted Group Interventions /
Classroom Systems
Less than 10 students with 10 or more office referrals
Less than 10 students continue rate of referrals after receiving targeted group settings
Small number of students destabilizing overall functioning of school
Individual Student
Systems
28
• Don’t collect data for collection sake
• make sure informs the process
• Don’t “drown” in data
• keep focused on the question
• Data without context are simply numbers
Important Points
to Remember…
29

The Ohio 5-Step Process
Active Decision-Making: Transforming Data into Useful Information
30
• Use data to identify a possible problem
• Use data to build a precise “problem
statement”
• Use data to select a solution (intervention)
• Use data to assess if a solution is (a) being
implemented, and (b) being effective.
Active Decision-Making
31

Using School Level Data to
Make Decisions
Identify “problems” with “precision”
• Well defined problems prompt functional
solutions
• Poorly defined problems prompt
discussions in which the problem is
admired, but not addressed.
32

Identify Problems with Precision
• What is problem, and how often is it happening?
• Where is it happening?
• Who is engaged in the behavior?
• When the problem is most likely?
• Why the problem is sustaining?
Primary statements are vague and leave us
with more questions than answers.
Precise problem statements include information
about the five core “W” questions.
33

Primary vs. Precision Statements
Primary Statements
• Too many referrals
• September has more suspensions than last year
• Gang behavior is increasing
• The cafeteria is out of control
• Student disrespect is out of control
Precision Statements
There are more ODRs for aggression on the playground than
last year. These are most likely to occur during first recess, with
a large number of students, and the aggression is related to
getting access to the new playground equipment.
34

Precise or Primary Statement?
“There is too much fighting at our school”.
There were 30 more ODRs for aggression on the playground than last year, and these are most likely to occur from 12:00-12:30 during fifth grade’s recess because there is a large number of students, and the aggression is related to getting access to the new playground equipment”.
35

Precise or Primary Statement?
ODRs during December are higher than in any other month.
Minor disrespect and disruption are increasing over time, and are most likely during the last 15 minutes of our block periods when students are engaged in independent seat work. This pattern is most common in 7th grade, involves many students, and appears to be maintained by escape from work (but may also be maintained by peer attention… we are not sure).
36
Precise or Primary Statement?
Children are using inappropriate language with a high frequency in the presence of both adults and other children. This is creating a sense of disrespect and incivility in the school
James D. is hitting others in the cafeteria during lunch, and his hitting is maintained by peer attention.
37

PBIS Assessment Surveys & Tools
https://www.pbisapps.org/ 38

PBIS Assessment
PBIS Assessment is a web-based application designed to
assist in high-fidelity, sustained implementation of school-wide
positive behavioral interventions and supports (SWPBIS).
PBIS Assessment provides surveys for teams to take as they
examine their level of SWPBIS adoption and guides them
through the process for how to improve implementation to
benefit students, their families, and the overall school culture.
https://www.pbisapps.org/Applications/Pages/PBIS-Assessment.aspx#
39

PBIS Tools and Surveys
Research Tool
Annual
Assessment Tool
Progress
Monitoring Tool
Universal Intervention
(Tier I)
Schoolwide
Evaluation Tool (SET)
Pre-School-Wide Evaluation Tool (SET)
Benchmarks of Quality (BoQ)
Self Assessment Survey(SAS)
Early Childhood Benchmarks of
Quality (ECBoQ)
Team Implementation
Tool Checklist (TIC)
Targeted & Intensive
Interventions (Tiers II & III)
Individual Systems Student Evaluation
Tool (ISSET) Coming Soon
Self Assessment
Survey (SAS)
Benchmarks for Advanced Tiers (BAT)
Monitoring Advanced
Tiers Tool (MATT)
Outcome Tool/Instrument: School Safety Survey 40

PBIS Evaluation
https://www.pbisapps.org/Applications/Pages/PBIS-Evaluation.aspx
http://www.pbis.org/evaluation/evaluation_tools.aspx
42

Data Integration
Data integration solutions available through PBIS Apps
are flexible enough to integrate with a district’s database, no matter which student information system is used.
• SWIS Data Exchange (SDEX)
• Distributor
• PBISApps (API)
Current Integration Options
43

School-wide Information System (SWIS) Suite
https://www.pbisapps.org/Pages/Default.aspx
SWIS Universal Tier
(Tier I)
44

Evaluation Blueprint for School-Wide
Positive Behavior Support http://www.pbis.org/evaluation/evaluation_blueprint.aspx
Evaluation
Schools, districts, regions, and states implementing SWPBIS develop an evaluation plan to: 1. Address evaluation questions 2. Select evaluation measures and a schedule for
completing them, which meet the needs of local decision makers
3. Use evaluation data for decision making at the school, district, region, and state levels.
Typically, schools and districts start with implementation and assessment of Universal (Tier I) systems. When Targeted (Tier II) and Intensive (Tier III) systems are added, assessments of these tiers are integrated into the evaluation.
45

Check In Check Out (CICO)
Check-In Check-Out (CICO-SWIS) CICO-SWIS provides school staff with an online space to enter CICO point card data easily and efficiently online. Data are summarized across five reports allow teams to: a. Monitor individual student progress: Three reports give teams a way to see
a. If each student is meet his/her goals each day. b. How each student is doing at each check-in period. c. The overall impact of plan changes made throughout the course of the
intervention. d. The impact of the intervention on each student’s office discipline referral count.
b. Review the overall integrity and fidelity of the program: Targeted (Tier II) and Universal (Tier I) teams can review tow graphs in CICO-SWIS to see:
a. Overall student programs in the targeted intervention. b. Overall effectiveness of the CICO intervention in the school.
https://www.pbisapps.org/Applications/Pages/SWIS-Suite.aspx#cico
46

Why does CICO work?
Improved structure • Prompts are provided throughout the day for correct behavior.
• System for linking student with at least one positive adult.
• Student chooses to participate.
Student is “set up for success” • First contact each morning is positive.
• “Blow-out” days are pre-empted.
• First contact each class period (or activity period) is positive, and sets up successful behavioral momentum.
Increase in contingent feedback • Feedback occurs more often.
• Feedback is tied to student behavior.
• Inappropriate behavior is less likely to be ignored or rewarded.
47

ISIS-SWIS https://www.pbisapps.org/Applications/Pages/SWIS-Suite.aspx
ISIS-SWIS is a decision system for students receiving more intensive supports for academic, social, or mental health services. Teams using ISIS-SWIS can:
1. Define data collection measures: Teams tailor ISIS-SWIS to each student’s file to effectively monitor the student’s specific outcomes as well as the overall fidelity of the plan. Each individualized plan is setup across the following fields:
a. Number of measures b. Team member access to the data c. Measure details d. Data collection schedule e. Goals f. Reports g. Plan change history and notes
2. Upload and store documentation: ISIS-SWIS supports compliance with federal procedures around Tier III supports by supplying teams with a place to store all documents related to a student’s plan.
3. Summarize data for decision: ISIS-SWIS brings together the goals and objectives from a student’s
support plan into a comprehensive student file allowing for quality decision making. Team members can enter all data efficiently keeping all records current.
48

• What current system is used by our team to make data-based decisions?
• What data does our team currently look at?
• Does our team use the data they collect to make decisions?
49

education.ohio.gov
50

Social Media
@OHEducation
ohio-department-of-education
Ohio Families and Education
Ohio Teachers’ Homeroom
OhioEdDept
storify.com/ohioEdDept
51