Embed Size (px)
Citation preview
Positive Impact of Industrial Robots
on Employment
Metra Martech
Positive Impact of
Industrial Robots
on Employment

Metra Martech
Peter Gorle CEng FIMechE and Andrew Clive MA Econ (Cantab)
21st February 2011
METRA MARTECH Limited Telephone: (0)20 8742 7888
7 Chiswick High Road Facsimile: (0)20 8742 8558
London W4 2ND email:[email protected]
http://www.metra-martech.com/
Metra Martech
7319
2011
Page
1. SUMMARY 1.1 Overall rise in employment 1 1.2 Employment directly due to the use of robotics 2 1.3 Employment indirectly due to the use of robotics 3 1.4 Potential for new job creation up to 2016 6
2 INTRODUCTION 9
3 THE ECONOMIC FACTORS 11 3.1 Displacement and re-employment 11 3.2 Globalisation of the market 14 3.3 Increasing speed of technology development 14 3.4 Age and skills profiles 15 3.5 Wage costs and the availability of low cost labour 18 3.6 Health, safety and environment 21
4. NOTES ON THE SECTORS AS ROBOT USERS 23 4.1 The robotics industry itself 23 4.2 Need for precision and consistency 23 4.3 Health and Safety may cause change to robots 25 4.4 Making or maintaining manufacturing viability 27
5 HOW MUCH EMPLOYMENT IS DEPENDENT ON ROBOTICS 29 5.1 Background 29 5.2 Precision and consistency 29 5.3 Unsatisfactory working conditions 32 5.4 Protection of local industry 34
6. THE POSITION OF SME 39 6.1 Profile of SME 39 6.2 SME and use of robots 40
7 EXPECTATIONS UP TO 2016 43
7.1 Economic factors 43 7.2 Growth per sector 44 7.3 Change factors 46 7.4 New growth sectors 47 7.5 Food and drink 47 7.6 Renewable energy 49 7.7 Electrical storage media and electric vehicles 52 7.8 Growth of service robots 55
8. COUNTRY PROFILES 57
Notes on definitions 64
Metra Martech
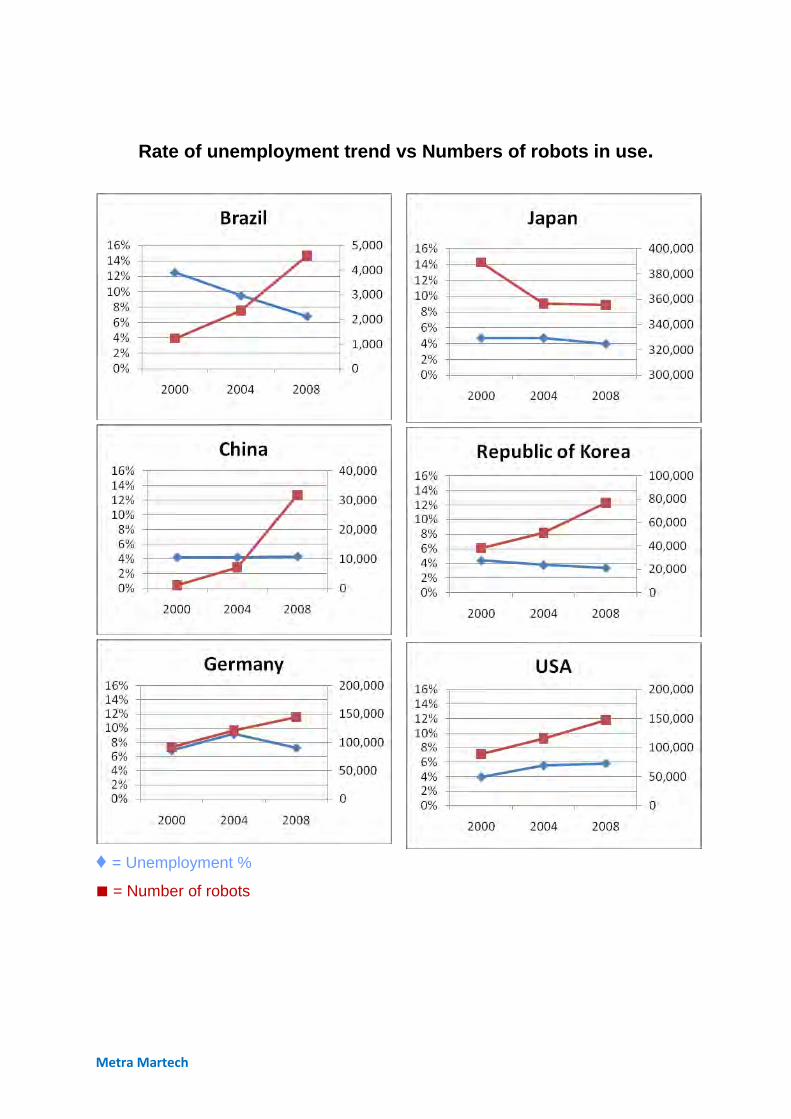
Rate of unemployment trend vs Numbers of robots in use.
♦ = Unemployment %
■ = Number of robots
1 Positive Impact of Industrial Robots on Employment
Metra Martech
1. SUMMARY
1.1 Overall rise in employment
Overall paid employment has risen in most countries. In the six considered here, only Japan has seen a decline.
This is driven by increasing participation of women, and increases in population, including immigration in some cases. It is also caused by the increasing demand for services, and the creation of completely new products and markets, often related to the application of electronics to communication.
The statistics mainly point to reduction in employment in manufacturing in the developed countries, but this is often a small reduction. It coincides with an increase in output and an increase in robotics use except in the case of Japan.
The extra number that have gained employment in the years 2000 to 2008 is far greater than the small numbers losing their jobs in manufacturing.
The new jobs have been in:
1) distribution and services, Some of the distribution jobs are the result of manufacturers outsourcing their distribution. In the past these jobs would have been classified as part of manufacturing.
2) and also in new manufacturing applications, particularly using technology advances to create new consumer products [mobile phones, computers, games etc].
In the industrialising countries, as could be expected, there has been a sharp rise in employment in manufacturing, as well as increase in output.
Productivity increases are not just caused by automation and robotics, but it is one of three main factors, along with increased size of manufacturing plants and the globalisation of sourcing. Note: while the IFR numbers provide a clear basis from which to work, it has not always been possible to separate robotics from automation in our analyses.
Individual countries differ greatly, the importance of manufacturing is only 11% of employment in USA…but 24% in Germany and as high as 27% in more recently industrialising countries such as The Republic of Korea,
The level of robotics use has almost always doubled, in all of the six countries [except Japan] in the eight years covered by the study. The proportion of the workforce that is unemployed has hardly changed in this period. [see charts opposite and table overleaf].
2 Positive Impact of Industrial Robots on Employment
Metra Martech
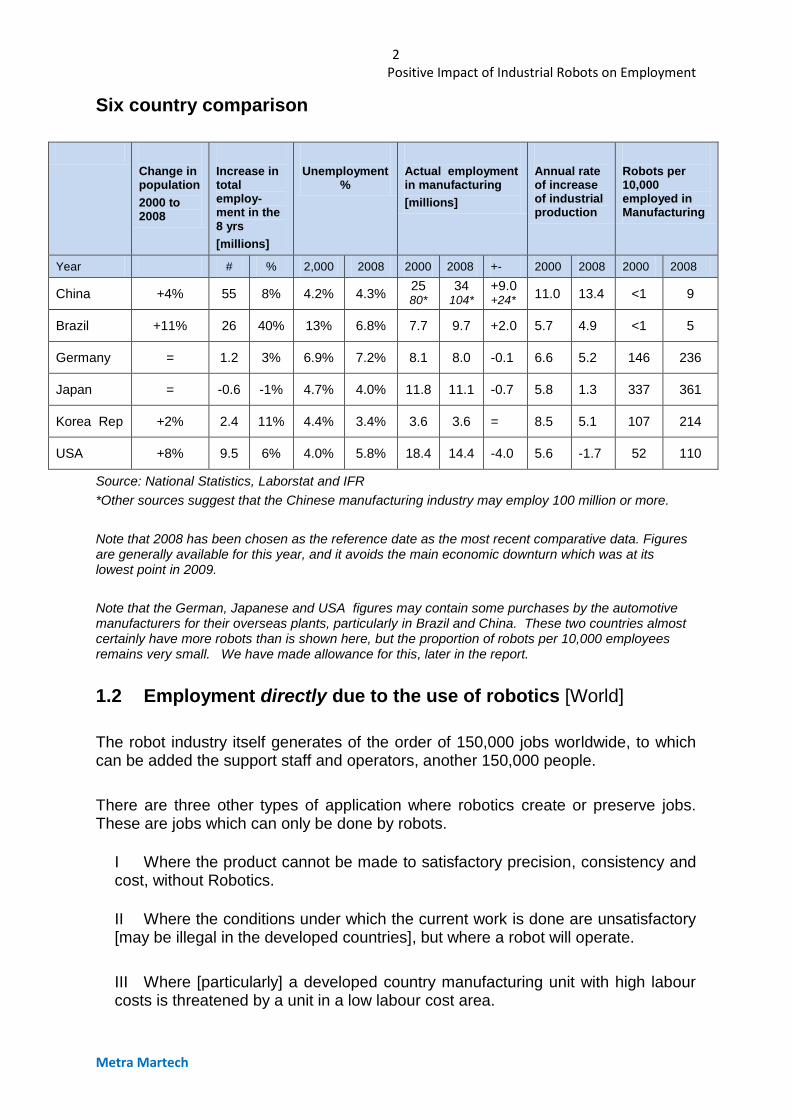
Six country comparison
Change in population
2000 to 2008
Increase in total employ- ment in the 8 yrs
[millions]
Unemployment %
Actual employment in manufacturing
[millions]
Annual rate of increase of industrial production
Robots per 10,000 employed in Manufacturing
Year # % 2,000 2008 2000 2008 +- 2000 2008 2000 2008
China +4% 55 8% 4.2% 4.3% 25 80*
34 104*
+9.0 +24*
11.0 13.4 <1 9
Brazil +11% 26 40% 13% 6.8% 7.7 9.7 +2.0 5.7 4.9 <1 5
Germany = 1.2 3% 6.9% 7.2% 8.1 8.0 -0.1 6.6 5.2 146 236
Japan = -0.6 -1% 4.7% 4.0% 11.8 11.1 -0.7 5.8 1.3 337 361
Korea Rep +2% 2.4 11% 4.4% 3.4% 3.6 3.6 = 8.5 5.1 107 214
USA +8% 9.5 6% 4.0% 5.8% 18.4 14.4 -4.0 5.6 -1.7 52 110
Source: National Statistics, Laborstat and IFR
*Other sources suggest that the Chinese manufacturing industry may employ 100 million or more.
Note that 2008 has been chosen as the reference date as the most recent comparative data. Figures are generally available for this year, and it avoids the main economic downturn which was at its lowest point in 2009.
Note that the German, Japanese and USA figures may contain some purchases by the automotive manufacturers for their overseas plants, particularly in Brazil and China. These two countries almost certainly have more robots than is shown here, but the proportion of robots per 10,000 employees remains very small. We have made allowance for this, later in the report.
1.2 Employment directly due to the use of robotics [World]
The robot industry itself generates of the order of 150,000 jobs worldwide, to which can be added the support staff and operators, another 150,000 people.
There are three other types of application where robotics create or preserve jobs. These are jobs which can only be done by robots.
I Where the product cannot be made to satisfactory precision, consistency and cost, without Robotics.
II Where the conditions under which the current work is done are unsatisfactory [may be illegal in the developed countries], but where a robot will operate.
III Where [particularly] a developed country manufacturing unit with high labour costs is threatened by a unit in a low labour cost area.
3 Positive Impact of Industrial Robots on Employment
Metra Martech
1.3 Employment indirectly due to the use of robotics
A much larger source of employment, at least partly due to robotics, is the newly created downstream activity necessary to support manufacturing which can only be done by robots. We have been conservative in what we have chosen to include here. Some of the people we have spoken to, for example, would have liked us to have included large parts of the automotive sector sales and distribution employment. Our conclusion was that much of this infrastructure was in place before robots were widely used, and so not resulting from the use of robots.
The best example is the communication and leisure equipment business, from distribution to retailing. In the USA, this part of retailing is of the order of 1 million. In world terms this accounts for 3 to 5 million of jobs which would not exist if automation and robotics had not been developed to allow production of millions of electronic products, from Phones to Playstations.
In world terms, these groups directly and indirectly generate jobs of the following order and in the country groups shown :
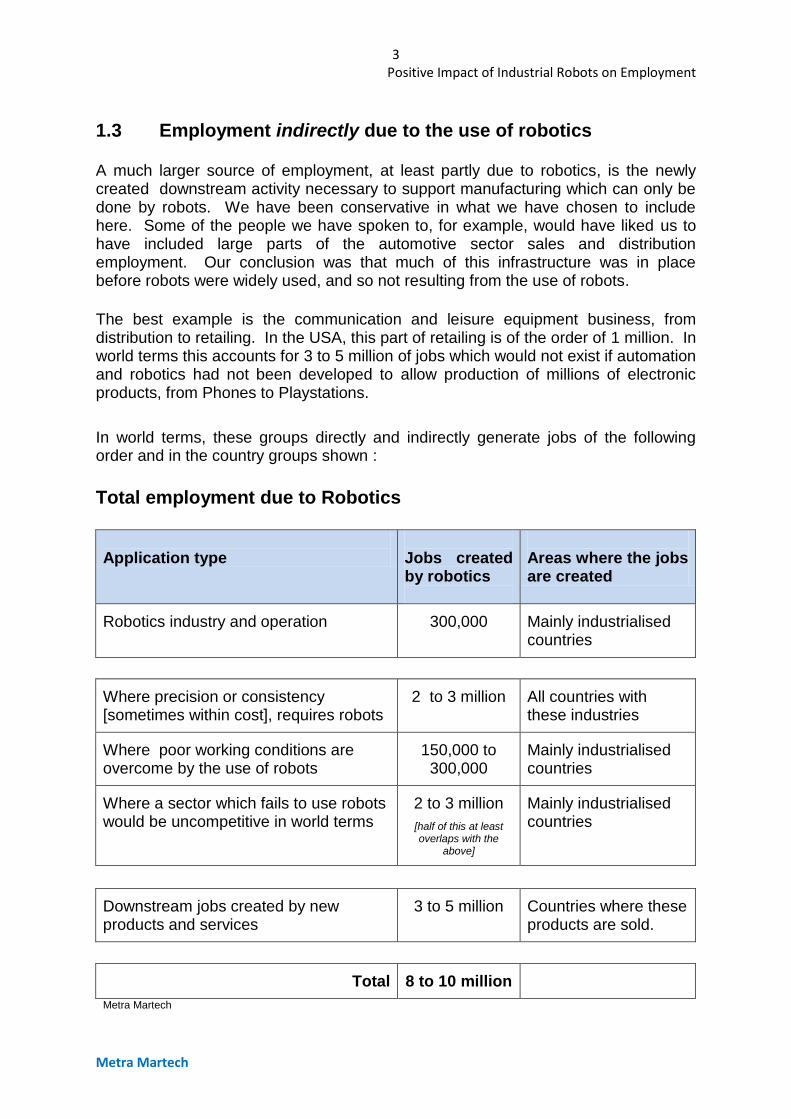
Total employment due to Robotics
Application type
Jobs created by robotics
Areas where the jobs are created
Robotics industry and operation 300,000 Mainly industrialised countries
Where precision or consistency [sometimes within cost], requires robots
2 to 3 million All countries with these industries
Where poor working conditions are overcome by the use of robots
150,000 to 300,000
Mainly industrialised countries
Where a sector which fails to use robots would be uncompetitive in world terms
2 to 3 million
[half of this at least overlaps with the
above]
Mainly industrialised countries
Downstream jobs created by new products and services
3 to 5 million Countries where these products are sold.
Total 8 to 10 million
Metra Martech
4 Positive Impact of Industrial Robots on Employment
Metra Martech
Metra Martech
Metra Martech
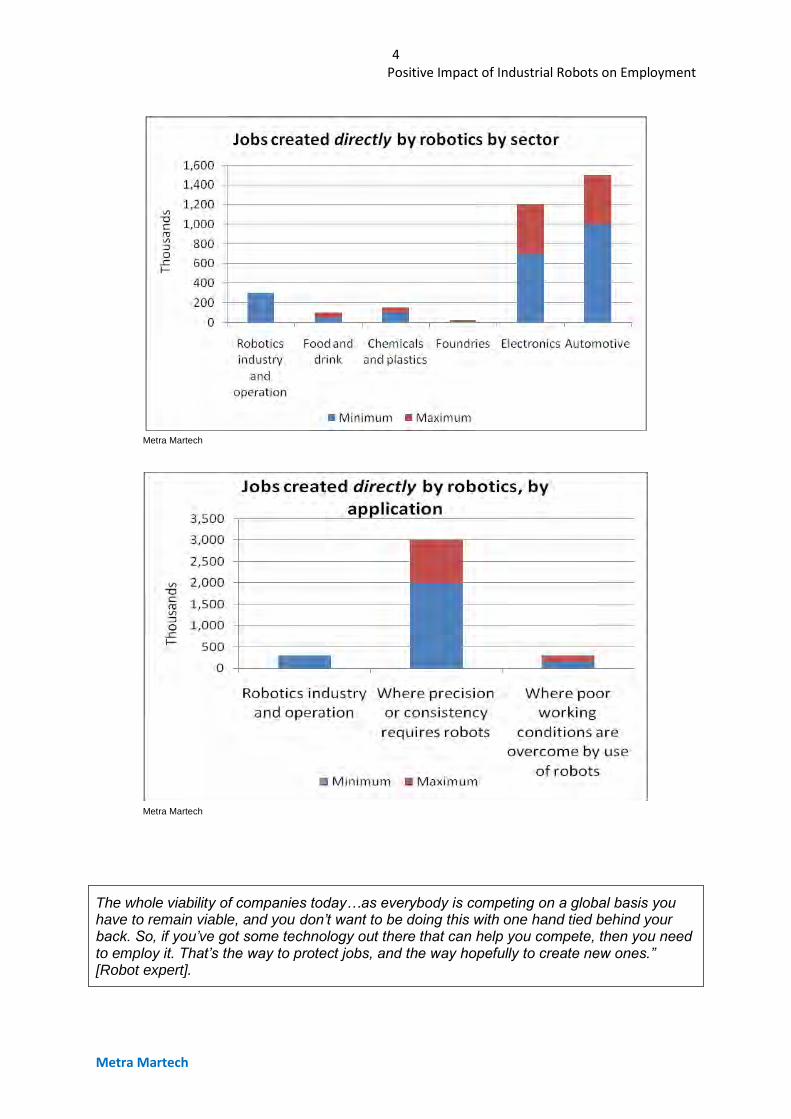
The whole viability of companies today…as everybody is competing on a global basis you have to remain viable, and you don’t want to be doing this with one hand tied behind your back. So, if you’ve got some technology out there that can help you compete, then you need to employ it. That’s the way to protect jobs, and the way hopefully to create new ones.” [Robot expert].
5 Positive Impact of Industrial Robots on Employment
Metra Martech
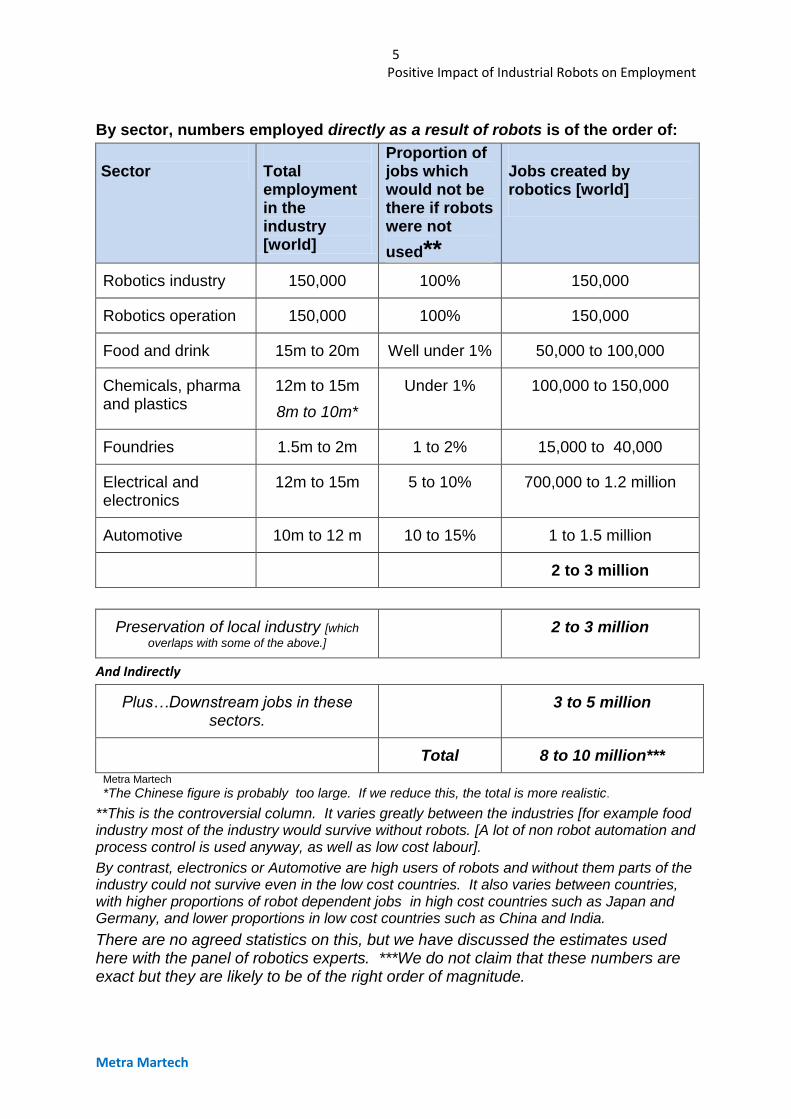
By sector, numbers employed directly as a result of robots is of the order of:
Sector
Total employment in the industry [world]
Proportion of jobs which would not be there if robots were not
used**
Jobs created by robotics [world]
Robotics industry 150,000 100% 150,000
Robotics operation 150,000 100% 150,000
Food and drink 15m to 20m Well under 1% 50,000 to 100,000
Chemicals, pharma and plastics
12m to 15m
8m to 10m*
Under 1% 100,000 to 150,000
Foundries 1.5m to 2m 1 to 2% 15,000 to 40,000
Electrical and electronics
12m to 15m 5 to 10% 700,000 to 1.2 million
Automotive 10m to 12 m 10 to 15% 1 to 1.5 million
2 to 3 million
Preservation of local industry [which
overlaps with some of the above.] 2 to 3 million
And Indirectly
Plus…Downstream jobs in these sectors.
3 to 5 million
Total 8 to 10 million***
Metra Martech
*The Chinese figure is probably too large. If we reduce this, the total is more realistic.
**This is the controversial column. It varies greatly between the industries [for example food industry most of the industry would survive without robots. [A lot of non robot automation and process control is used anyway, as well as low cost labour].
By contrast, electronics or Automotive are high users of robots and without them parts of the industry could not survive even in the low cost countries. It also varies between countries, with higher proportions of robot dependent jobs in high cost countries such as Japan and Germany, and lower proportions in low cost countries such as China and India.
There are no agreed statistics on this, but we have discussed the estimates used here with the panel of robotics experts. ***We do not claim that these numbers are exact but they are likely to be of the right order of magnitude.
6 Positive Impact of Industrial Robots on Employment
Metra Martech
Note that China now produces more cars than USA, but the number of robots used in vehicle manufacture in China is estimated at 28,000 compared with 77,000 in USA.
Robot density in a sector only provides a partial view of employment which is dependent on robotics. For example, use of robotics in the automotive sector does not cover all parts of the industry. However, large parts of the motor vehicle assembly sector would be lost to a country if it did not employ robotics. Probably not the components side, this is often highly automated but less likely to depend on robotics.
In the electronics sector some components could not be made without robotics, or could not be made at a cost which would sell, which would cause job losses not just in manufacture but downstream as well.
1.4 Potential for new job creation in the years up to 2016
There are five main areas where new jobs may be created in the next five years by the use of robotics.
I. Continued development of new products based on the development of electronics and communication technology. One of the new areas identified, for example, is the manufacture of service robots. Another is the development and mass adoption of renewable energy technologies.
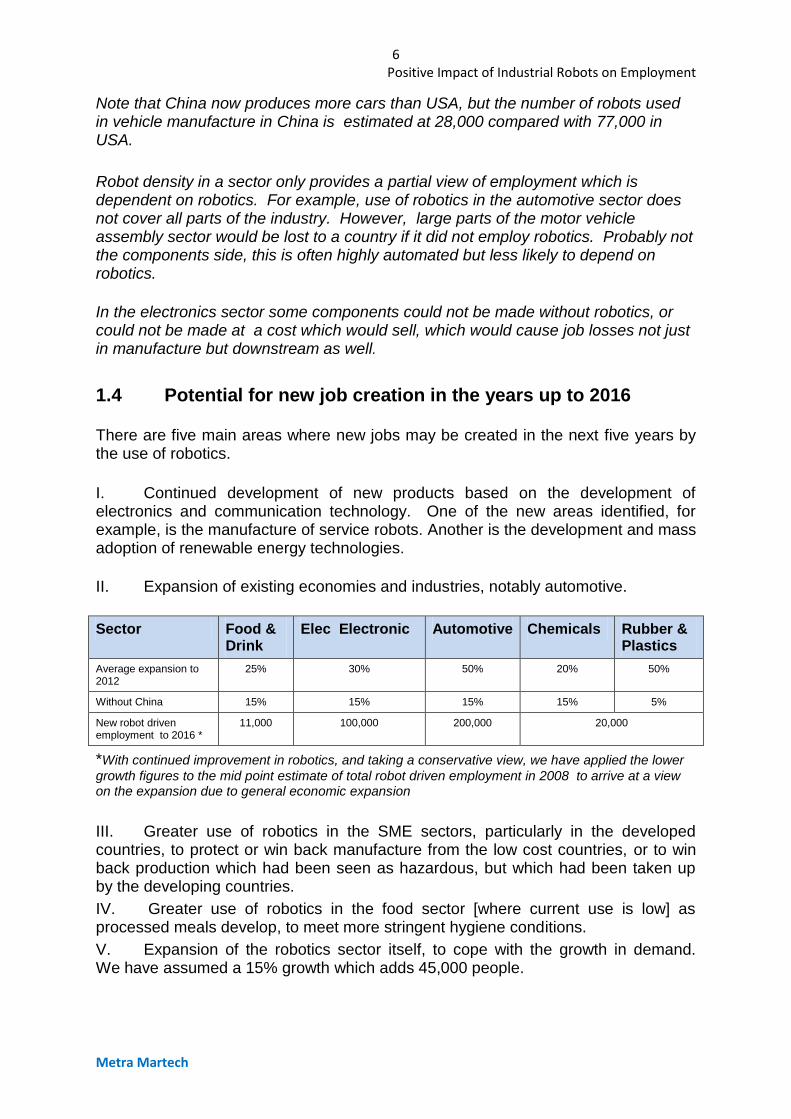
II. Expansion of existing economies and industries, notably automotive.
Sector Food & Drink
Elec Electronic Automotive Chemicals Rubber & Plastics
Average expansion to 2012
25% 30% 50% 20% 50%
Without China 15% 15% 15% 15% 5%
New robot driven employment to 2016 *
11,000 100,000 200,000 20,000
*With continued improvement in robotics, and taking a conservative view, we have applied the lower
growth figures to the mid point estimate of total robot driven employment in 2008 to arrive at a view on the expansion due to general economic expansion
III. Greater use of robotics in the SME sectors, particularly in the developed countries, to protect or win back manufacture from the low cost countries, or to win back production which had been seen as hazardous, but which had been taken up by the developing countries.
IV. Greater use of robotics in the food sector [where current use is low] as processed meals develop, to meet more stringent hygiene conditions.
V. Expansion of the robotics sector itself, to cope with the growth in demand. We have assumed a 15% growth which adds 45,000 people.
7 Positive Impact of Industrial Robots on Employment
Metra Martech
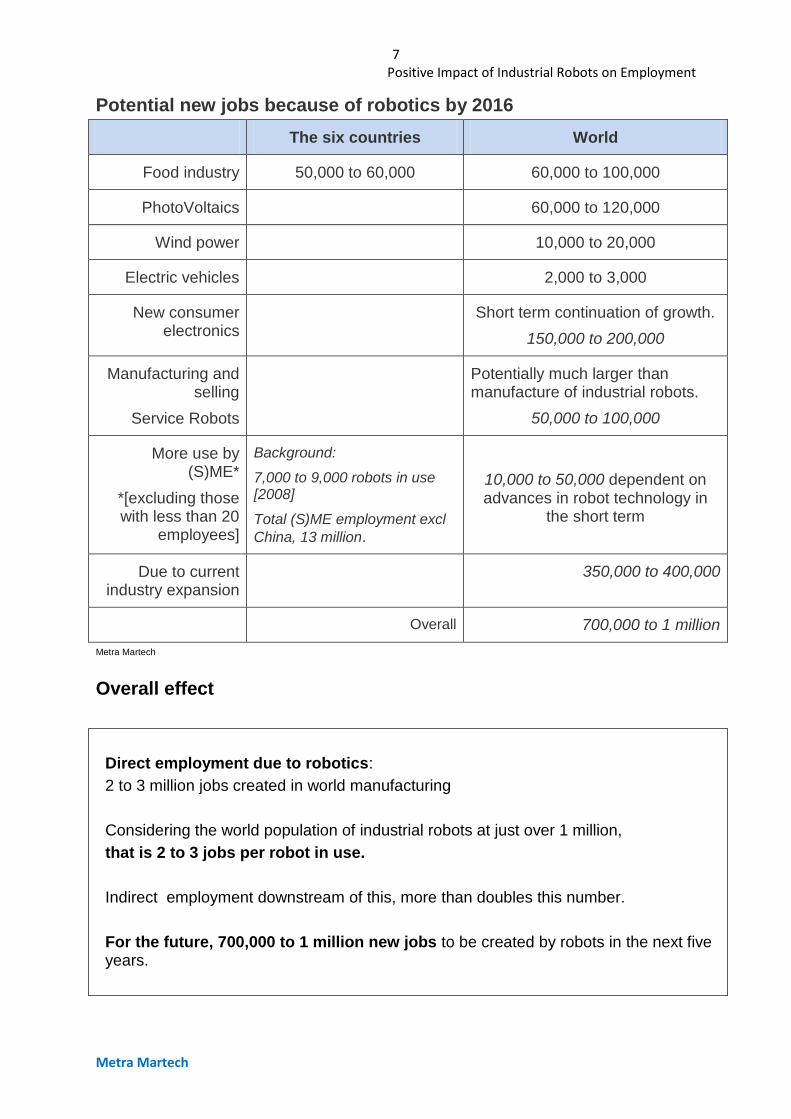
Potential new jobs because of robotics by 2016
The six countries World
Food industry 50,000 to 60,000 60,000 to 100,000
PhotoVoltaics 60,000 to 120,000
Wind power 10,000 to 20,000
Electric vehicles 2,000 to 3,000
New consumer electronics
Short term continuation of growth.
150,000 to 200,000
Manufacturing and selling
Service Robots
Potentially much larger than manufacture of industrial robots.
50,000 to 100,000
More use by (S)ME*
*[excluding those with less than 20
employees]
Background:
7,000 to 9,000 robots in use [2008]
Total (S)ME employment excl
China, 13 million.
10,000 to 50,000 dependent on advances in robot technology in
the short term
Due to current industry expansion
350,000 to 400,000
Overall 700,000 to 1 million
Metra Martech
Overall effect
Direct employment due to robotics:
2 to 3 million jobs created in world manufacturing
Considering the world population of industrial robots at just over 1 million,
that is 2 to 3 jobs per robot in use.
Indirect employment downstream of this, more than doubles this number.
For the future, 700,000 to 1 million new jobs to be created by robots in the next five years.

8 Positive Impact of Industrial Robots on Employment
Metra Martech
Blank page
9 Positive Impact of Industrial Robots on Employment
Metra Martech
2. INTRODUCTION
Study Aim
The study analyses the impact of the use of robots in the industrialized production of goods on employment. The study covers years 2000 to 2016.
Project scope
The sectors considered are:
1.The large automotive players as well as the component suppliers,
2.Electronics and its interface with specialist plastics [solar cells, photovoltaics etc or other advanced materials], particularly clean rooms [but not the very specialised microchip manufacturing application].
3.Food and beverage, [health, cleanliness and safety*]
4.Plastics [and Rubber] Industry as such, not only in combination with Electronics, Chemicals and Pharmaceuticals,
Definitions of the industries are given in the appendix.
Other than the automotive sector, the brief specified that SMEs (Small and Medium Enterprises) up to 250 employees were specified as the target where possible. By agreement, this has been given less emphasis in the project as there is little available information on the use of robots specifically by smaller companies.
Industrial robots are the target.
Global markets are covered by the economic background data. The study then focused on six key countries. Brazil, China, Germany, Japan, Republic of Korea and USA.
Method The project is based largely on analyses of economic data on the six selected countries. This has been combined with the data on Robot use provided by IFR.
Conclusions were drawn by the Metra Martech team based on economic and industry knowledge. There are considerable gaps in the information available and the main quantifications show orders of magnitude rather than precise numbers. These conclusions have been tested on IFR members in the countries. The testing process involved a two stage set of questions which were responded to by eighteen of these experts. The first question set established the validity of the main assumptions made by Metra Martech; the second was a more detailed set of questions, sent by IFR to selected experts. The Metra team completed two discussions each in German, Chinese and French, and in English with participants in Scandinavia[3], USA[3].
Metra Martech is a long established specialist in industrial and economic analysis, clients are governments and international organisations.
10 Positive Impact of Industrial Robots on Employment
Metra Martech
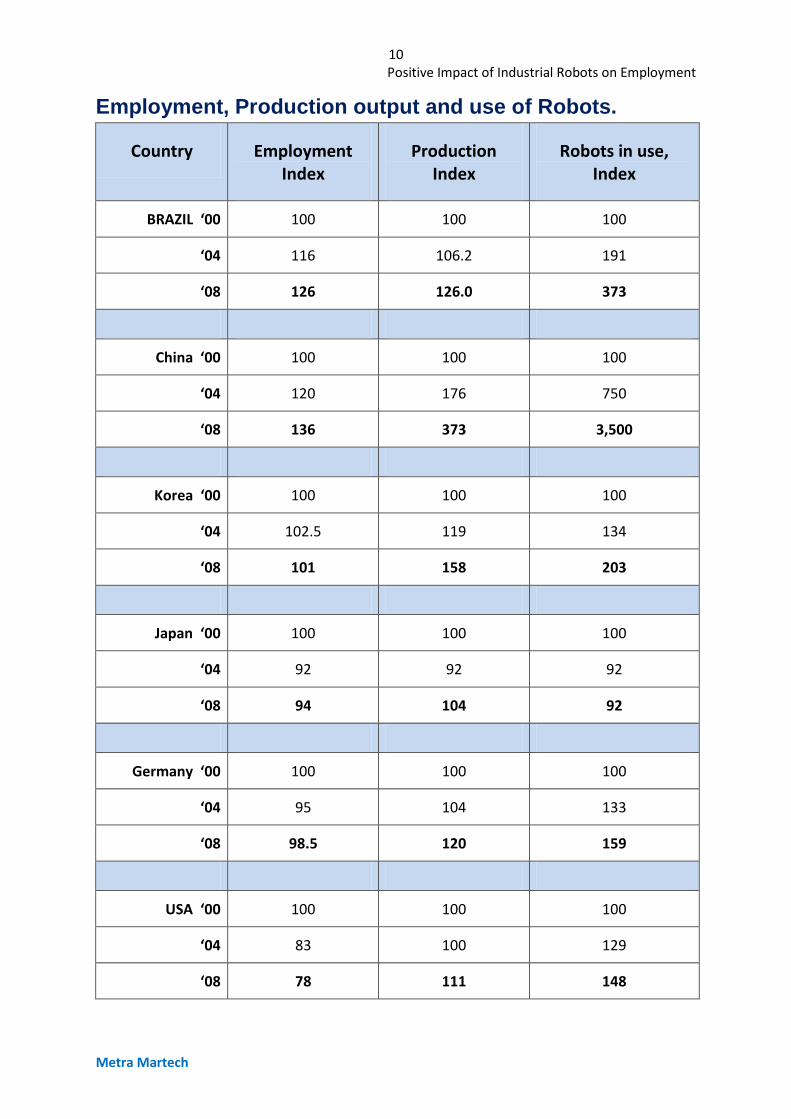
Employment, Production output and use of Robots.
Country Employment Index
Production Index
Robots in use, Index
BRAZIL ‘00 100 100 100
‘04 116 106.2 191
‘08 126 126.0 373
China ‘00 100 100 100
‘04 120 176 750
‘08 136 373 3,500
Korea ‘00 100 100 100
‘04 102.5 119 134
‘08 101 158 203
Japan ‘00 100 100 100
‘04 92 92 92
‘08 94 104 92
Germany ‘00 100 100 100
‘04 95 104 133
‘08 98.5 120 159
USA ‘00 100 100 100
‘04 83 100 129
‘08 78 111 148
11 Positive Impact of Industrial Robots on Employment
Metra Martech
3. THE ECONOMIC FACTORS and their effect on the use of robotics.
3.1 Displacement and re-employment
Where automation displaces people in manufacturing it almost always increases output [see table opposite]. In some cases it allows such an increase in production and related decrease in unit price, that it creates a whole new market and generates the need for downstream jobs to get the product to the consumer. It releases employees for other, often new jobs outside manufacturing. Historically, this has always been the case.
An alternative view is that this displacement in the future will be more difficult to place, as service robotics may take over many of the new job opportunities in human tasks such as in banking, fast food chains, and retailing petrol forecourts.
What is likely is that the growth of the production, marketing, selling and maintaining service robots will create the next wave of employment.
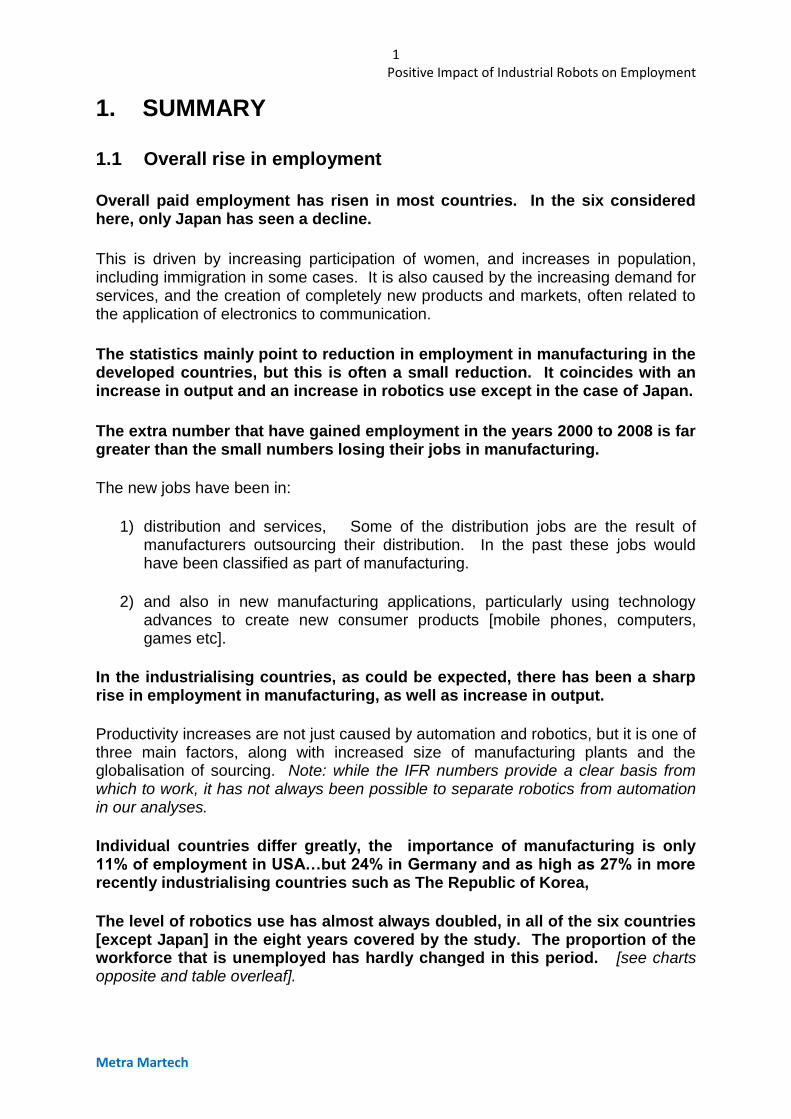
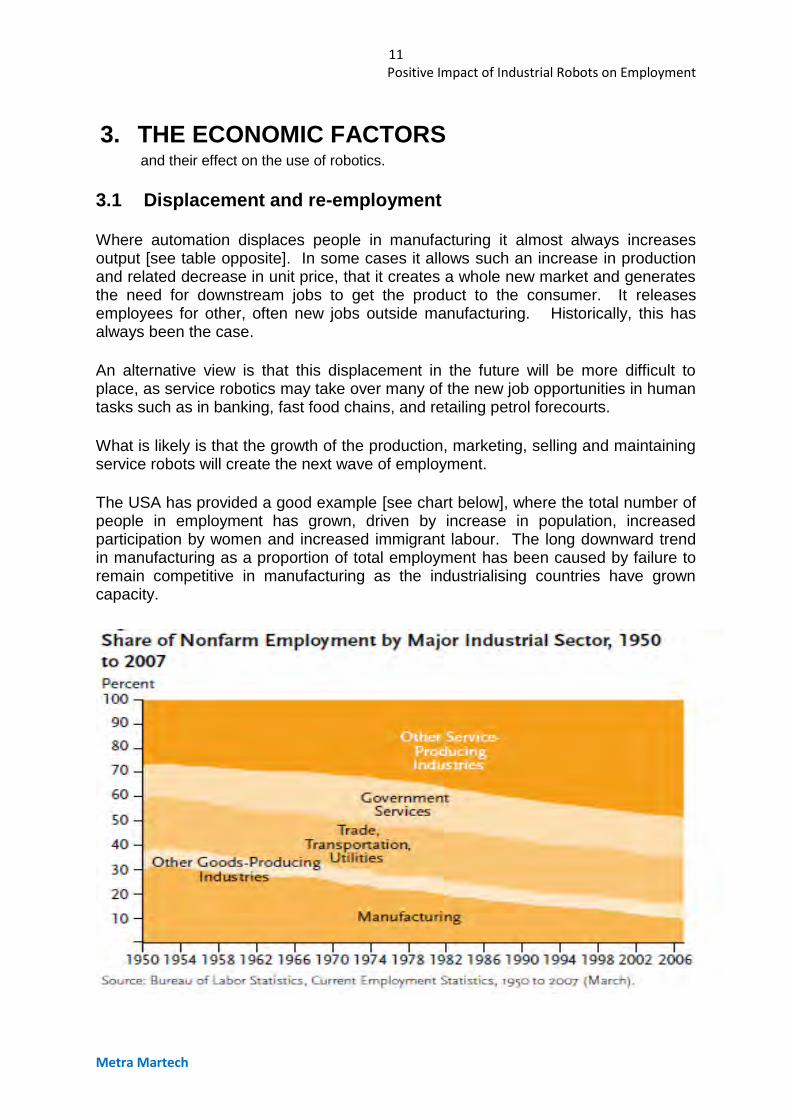
The USA has provided a good example [see chart below], where the total number of people in employment has grown, driven by increase in population, increased participation by women and increased immigrant labour. The long downward trend in manufacturing as a proportion of total employment has been caused by failure to remain competitive in manufacturing as the industrialising countries have grown capacity.
12 Positive Impact of Industrial Robots on Employment
Metra Martech
Metra Martech
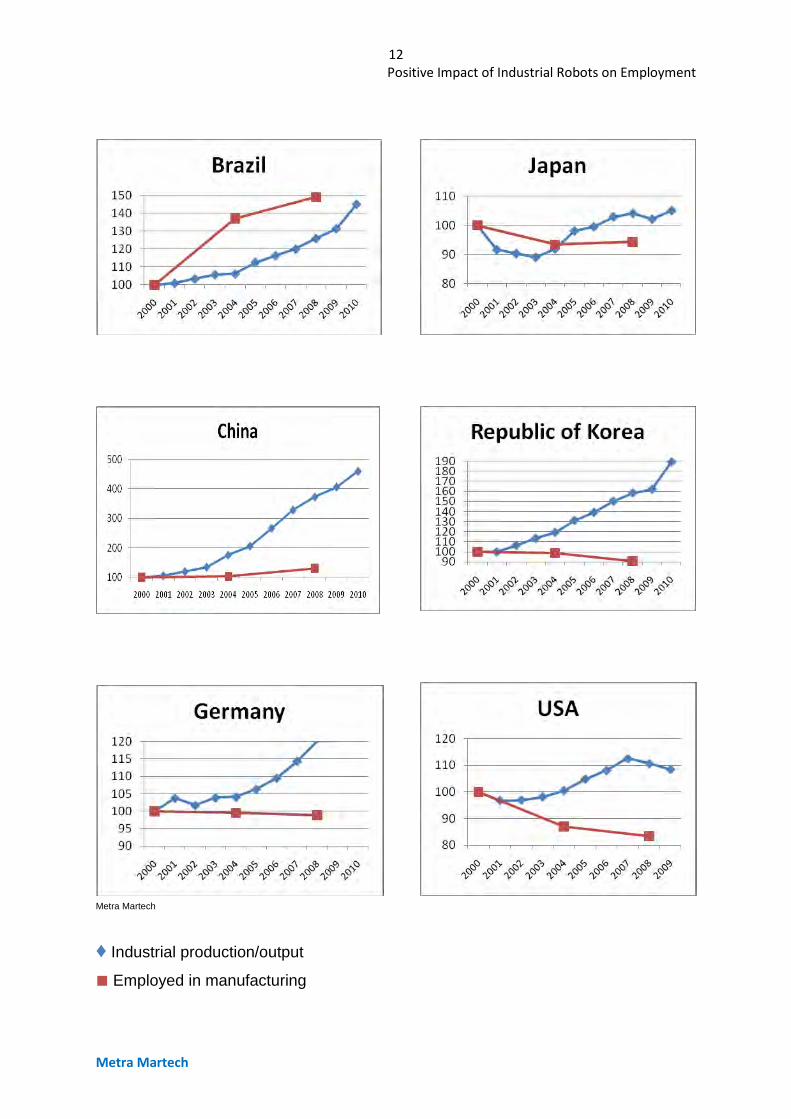
♦ Industrial production/output
■ Employed in manufacturing
13 Positive Impact of Industrial Robots on Employment
Metra Martech
The charts opposite show that manufacturing output has increased while employment in manufacturing has fallen except in Brazil and China.
What it is driving this trend to fewer employees in manufacturing is that manufacturers have steadily improved manufacturing productivity, largely by increasing the size of production units, automating tasks and sourcing components globally.
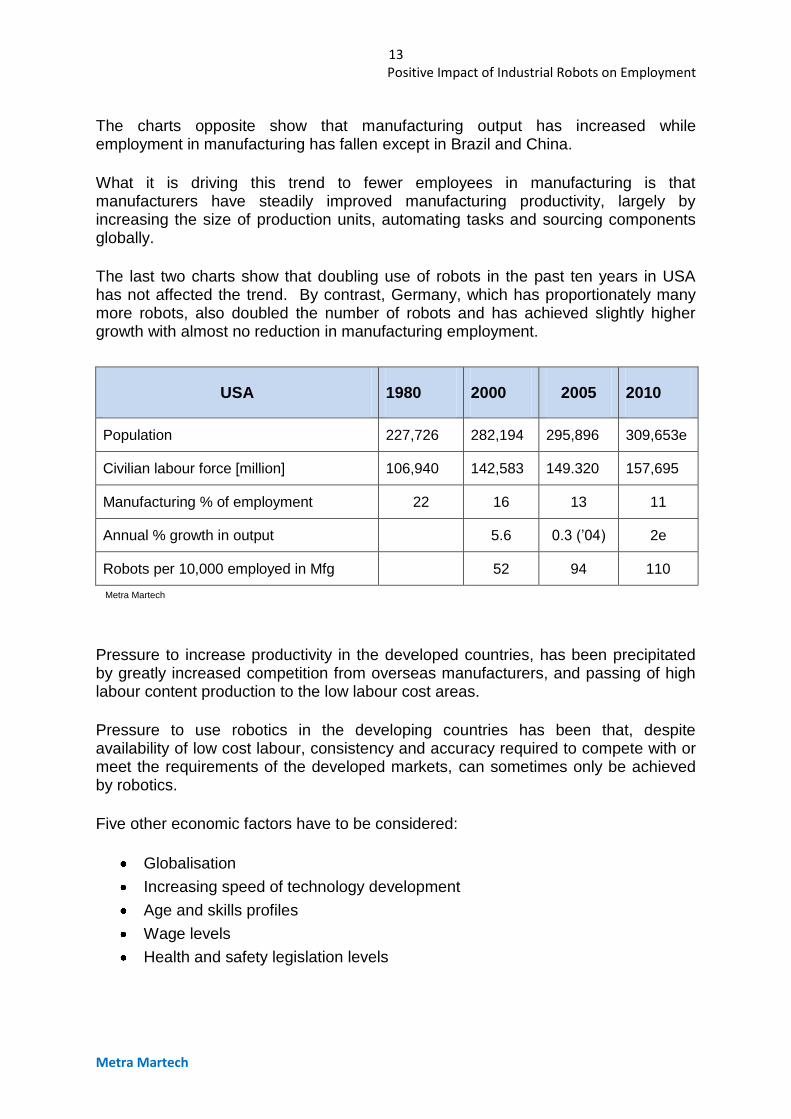
The last two charts show that doubling use of robots in the past ten years in USA has not affected the trend. By contrast, Germany, which has proportionately many more robots, also doubled the number of robots and has achieved slightly higher growth with almost no reduction in manufacturing employment.
USA 1980 2000 2005 2010
Population 227,726 282,194 295,896 309,653e
Civilian labour force [million] 106,940 142,583 149.320 157,695
Manufacturing % of employment 22 16 13 11
Annual % growth in output 5.6 0.3 (’04) 2e
Robots per 10,000 employed in Mfg 52 94 110
Metra Martech
Pressure to increase productivity in the developed countries, has been precipitated by greatly increased competition from overseas manufacturers, and passing of high labour content production to the low labour cost areas.
Pressure to use robotics in the developing countries has been that, despite availability of low cost labour, consistency and accuracy required to compete with or meet the requirements of the developed markets, can sometimes only be achieved by robotics.
Five other economic factors have to be considered:
Globalisation
Increasing speed of technology development
Age and skills profiles
Wage levels
Health and safety legislation levels
14 Positive Impact of Industrial Robots on Employment
Metra Martech
3.2 Globalisation of the market
There has been very rapid growth of the very large developing markets of China and India.
These are low labour cost countries and while labour costs can be expected to level up around the world, these two countries are likely to be relatively low cost areas for at least 20 years. The markets are so large that they encourage the development of locally grown research and technology. This means the phase when China, for example, largely produced goods to western specifications is passing.
Two defences that the developed countries have to maintain their wealth creating production capacity [without putting up trade barriers] are:
1. To put more money into research and development. The success of the Frauenhofer Institutes in Germany, and the new 150bn Yen FIRST projects [Funding program for world leading Innovative R&D on Science and Technology] in Japan are examples of this.
2. To reduce dependence on high cost labour by introducing automation when it offers an economic alternative.
3.3 Increasing speed of technology development
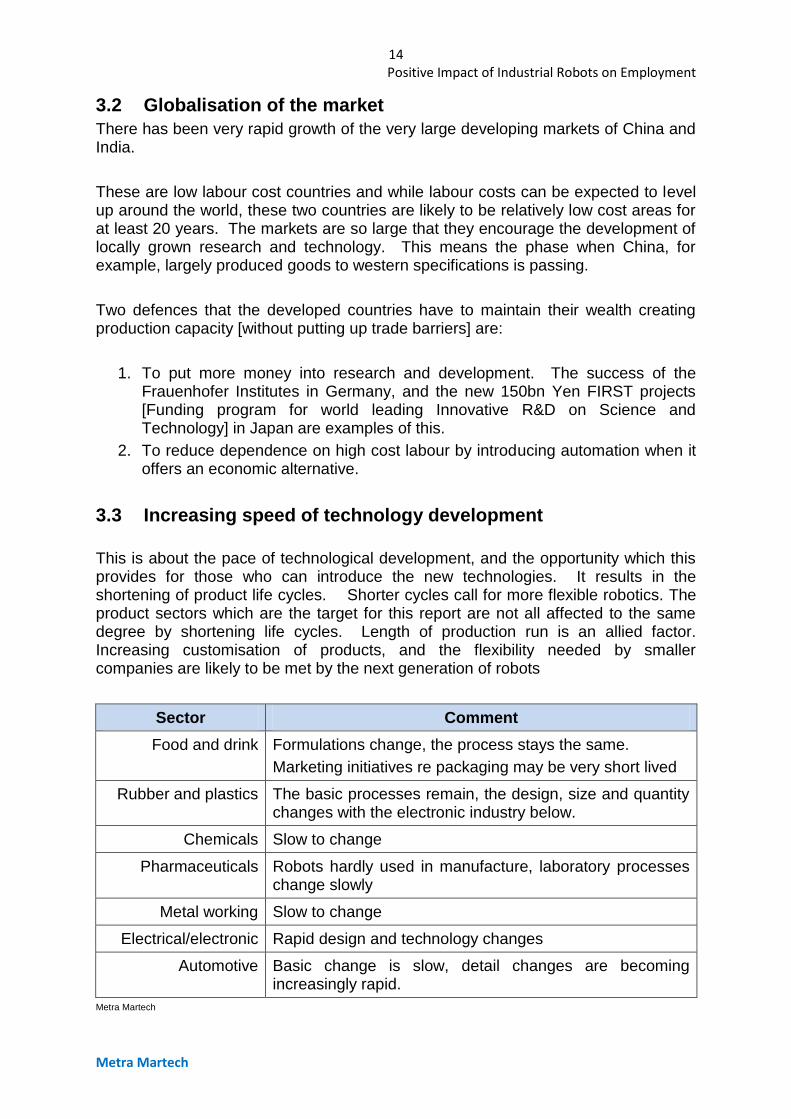
This is about the pace of technological development, and the opportunity which this provides for those who can introduce the new technologies. It results in the shortening of product life cycles. Shorter cycles call for more flexible robotics. The product sectors which are the target for this report are not all affected to the same degree by shortening life cycles. Length of production run is an allied factor. Increasing customisation of products, and the flexibility needed by smaller companies are likely to be met by the next generation of robots
Sector Comment
Food and drink Formulations change, the process stays the same.
Marketing initiatives re packaging may be very short lived
Rubber and plastics The basic processes remain, the design, size and quantity changes with the electronic industry below.
Chemicals Slow to change
Pharmaceuticals Robots hardly used in manufacture, laboratory processes change slowly
Metal working Slow to change
Electrical/electronic Rapid design and technology changes
Automotive Basic change is slow, detail changes are becoming increasingly rapid.
Metra Martech
15 Positive Impact of Industrial Robots on Employment
Metra Martech
3.4 Age and skills profiles
The ageing populations in, for example China, Japan and Germany are often cited as an added reason for adoption of robotics. USA is also affected but to a lesser degree.
A very significant ageing is forecast, but if we consider the workforce, within the timescale of the survey, only Japan is significantly affected, with a projected 5% loss of people of employable age. The German situation will become critical in the following years, but is projected to be less than 2% loss in workforce because of ageing, between now and 2016. Our discussions with robotics experts identify specific problems with ageing workforce in the aerospace sector in USA, but this is outside the scope of the present study.
The existence of skills gaps is reported to be a problem, but this is more a question of education and training regimes than the effect of population ageing.
Several factors are involved in addition to age, the change in population as a whole, the change in people of [currently] employable age, the overall number of people employed and the success of skills training in the country.
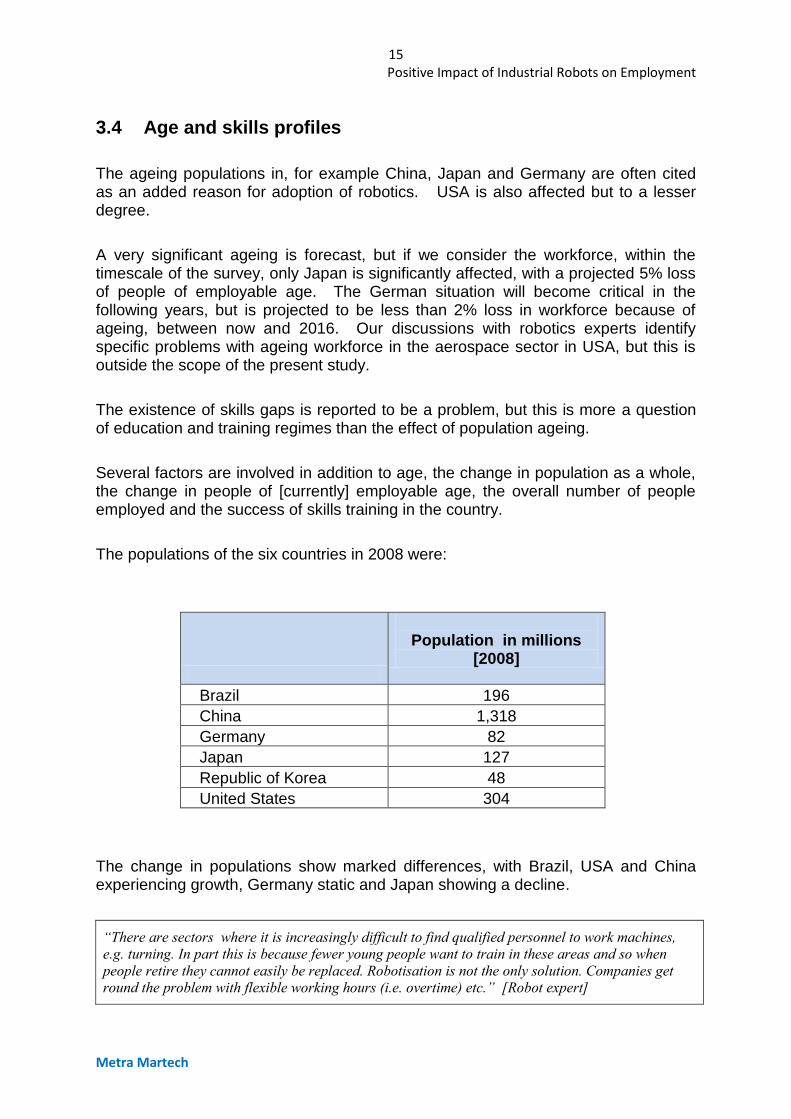
The populations of the six countries in 2008 were:
Population in millions
[2008]
Brazil 196
China 1,318
Germany 82
Japan 127
Republic of Korea 48
United States 304
The change in populations show marked differences, with Brazil, USA and China experiencing growth, Germany static and Japan showing a decline.
“There are sectors where it is increasingly difficult to find qualified personnel to work machines,
e.g. turning. In part this is because fewer young people want to train in these areas and so when
people retire they cannot easily be replaced. Robotisation is not the only solution. Companies get
round the problem with flexible working hours (i.e. overtime) etc.” [Robot expert]
16 Positive Impact of Industrial Robots on Employment
Metra Martech
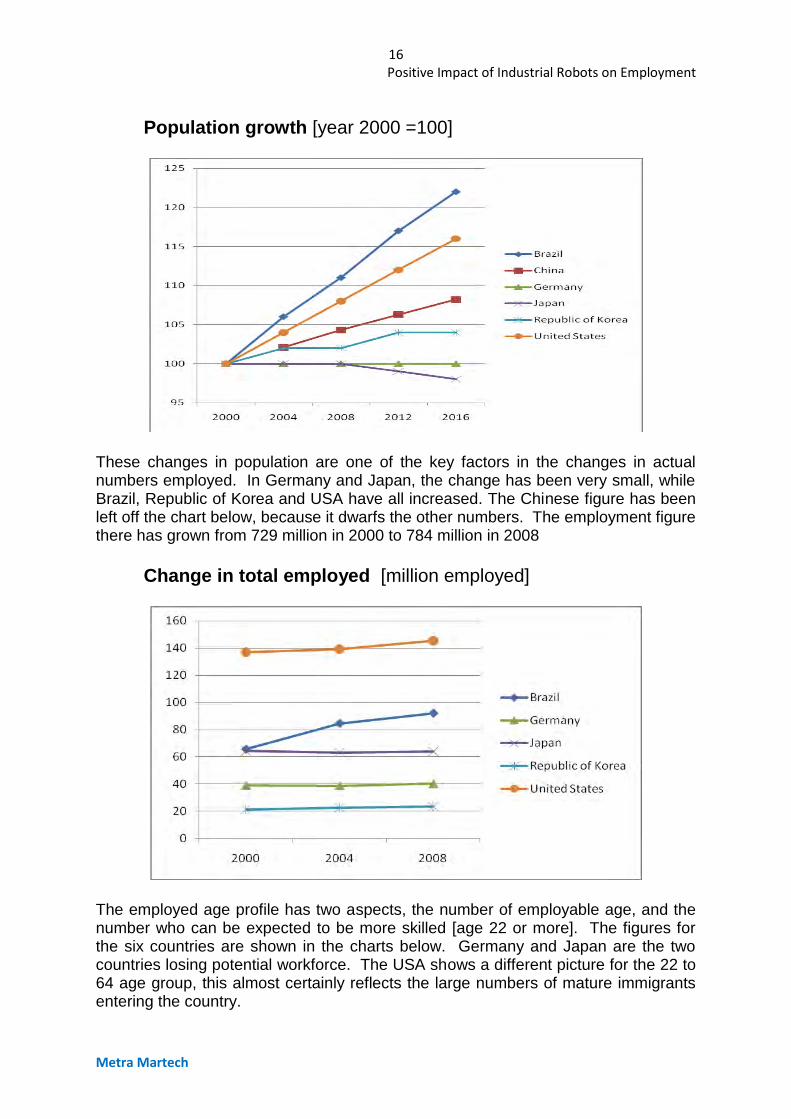
Population growth [year 2000 =100]
These changes in population are one of the key factors in the changes in actual numbers employed. In Germany and Japan, the change has been very small, while Brazil, Republic of Korea and USA have all increased. The Chinese figure has been left off the chart below, because it dwarfs the other numbers. The employment figure there has grown from 729 million in 2000 to 784 million in 2008
Change in total employed [million employed]
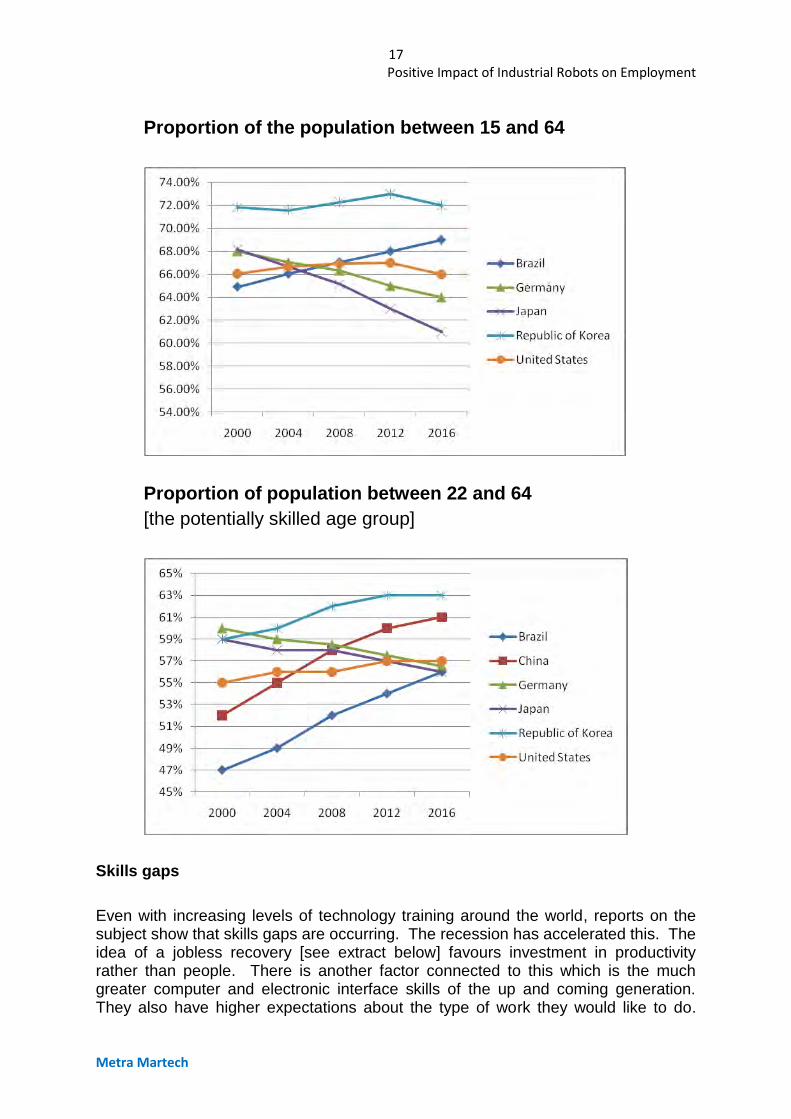
The employed age profile has two aspects, the number of employable age, and the number who can be expected to be more skilled [age 22 or more]. The figures for the six countries are shown in the charts below. Germany and Japan are the two countries losing potential workforce. The USA shows a different picture for the 22 to 64 age group, this almost certainly reflects the large numbers of mature immigrants entering the country.
17 Positive Impact of Industrial Robots on Employment
Metra Martech
Proportion of the population between 15 and 64
Proportion of population between 22 and 64
[the potentially skilled age group]
Skills gaps
Even with increasing levels of technology training around the world, reports on the subject show that skills gaps are occurring. The recession has accelerated this. The idea of a jobless recovery [see extract below] favours investment in productivity rather than people. There is another factor connected to this which is the much greater computer and electronic interface skills of the up and coming generation. They also have higher expectations about the type of work they would like to do.
18 Positive Impact of Industrial Robots on Employment
Metra Martech
The problem is more of skills mismatch than overall skills availability. This is a structural training problem rather than a consequence of the ageing population.
jobs are changing
educational attainment is lagging.
Shortages of skilled workers are acute in many of the world’s biggest economies, including the United States, Germany, France, Italy, Canada and Brazil, where employers ranked skilled trades as their number one or number two hiring challenge, according to Manpower’s 2010 Talent Shortage Survey. Strategic Migration calls for long-term, collaborative strategies to alleviate shortages of skilled workers, including promoting positive attitudes towards skilled trades work and ensuring that the technical training workers receive reflects the current demands of industry.
[Manpower Inc]
The American Society for training and development [ASTD] reports major skills gaps in USA. It also identifies the trend to a jobless recovery… one in which firms put off hiring new workers and achieve productivity gains with existing employees. Anthony Carnevale, director of the Center on Education and the Workforce at Georgetown University, notes that the last three recessions have been followed by jobless recoveries in which there was gross domestic product growth without job creation.
“Recessions accelerate the trend to eliminate low-wage, low-skills jobs,” notes Carnevale, “and those jobs don’t come back.” Instead, companies create jobs requiring more education and skill. Growth of these jobs is slow in part because they require paying higher salaries and providing costly technological infrastructure for these workers. “Employers will hire cautiously to fill skill gaps that they couldn’t address by hiring during the recession,”
[ASTD]
3.5 Wage costs and availability of low cost labour
One of the arguments against robots, contested by the suppliers, is that they are less flexible in operation and demand more up-front investment than the employment of low cost [often immigrant in the developed countries] labour.
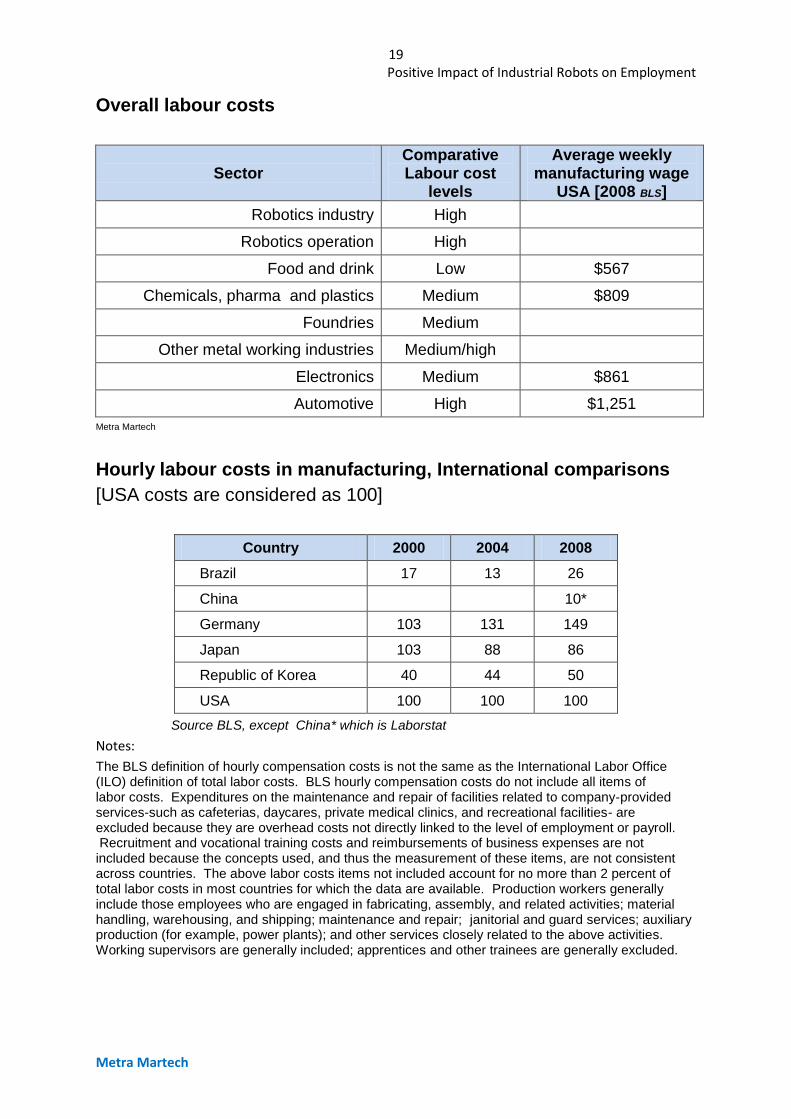
The high labour cost sectors are more likely to use robots.
The differences between the countries are large too, although the interpretation of comparative data is often difficult.
19 Positive Impact of Industrial Robots on Employment
Metra Martech
Overall labour costs
Sector
Comparative Labour cost
levels
Average weekly manufacturing wage
USA [2008 BLS]
Robotics industry High
Robotics operation High
Food and drink Low $567
Chemicals, pharma and plastics Medium $809
Foundries Medium
Other metal working industries Medium/high
Electronics Medium $861
Automotive High $1,251
Metra Martech
Hourly labour costs in manufacturing, International comparisons
[USA costs are considered as 100]
Country 2000 2004 2008
Brazil 17 13 26
China 10*
Germany 103 131 149
Japan 103 88 86
Republic of Korea 40 44 50
USA 100 100 100
Source BLS, except China* which is Laborstat
Notes:
The BLS definition of hourly compensation costs is not the same as the International Labor Office (ILO) definition of total labor costs. BLS hourly compensation costs do not include all items of labor costs. Expenditures on the maintenance and repair of facilities related to company-provided services-such as cafeterias, daycares, private medical clinics, and recreational facilities- are excluded because they are overhead costs not directly linked to the level of employment or payroll. Recruitment and vocational training costs and reimbursements of business expenses are not included because the concepts used, and thus the measurement of these items, are not consistent across countries. The above labor costs items not included account for no more than 2 percent of total labor costs in most countries for which the data are available. Production workers generally include those employees who are engaged in fabricating, assembly, and related activities; material handling, warehousing, and shipping; maintenance and repair; janitorial and guard services; auxiliary production (for example, power plants); and other services closely related to the above activities. Working supervisors are generally included; apprentices and other trainees are generally excluded.
20 Positive Impact of Industrial Robots on Employment
Metra Martech
All employees include production workers as well as all others employed full or part time in an establishment during a specified payroll period. Temporary employees are included. Persons are considered employed if they receive pay for any part of the specified pay period. Self-employed, unpaid family workers, contract workers, and workers in private households are excluded. Hourly Compensation Costs consist of: Hourly Direct Pay Pay for Time Worked Basic wages Piece rate Overtime premiums Shift, holiday, or night work premiums. Cost-of-living adjustments Bonuses and premiums paid each pay period Other Direct Pay Pay for time not worked (vacations, holidays, and other leave, except sick leave) Seasonal and irregular bonuses Allowances for family events, commuting expenses, etc. The cash value of payments in kind Severance pay (where explicitly not linked to a collective agreement)
Employer Social Insurance Expenditures (both legally required and contractual and private) and Labor-related Taxes Retirement and disability pensions Health insurance Income guarantee insurance and sick leave Life and accident insurance Occupational injury and illness compensation Unemployment insurance Severance pay (where linked to a collective agreement) Other social insurance expenditure Taxes (or subsidies) on payrolls or employment
Comment from the China Industry File: In China, autoworkers get paid around $240 a month. This works out to about $1.50 an hour, compared to $30 an hour in Germany and $5 an hour in Poland. In the United States, some workers get $65 an hour when their pensions, health insurance and other benefits are factored in. There are no independent unions in China. There are strong government pressures for workers to stay in line.
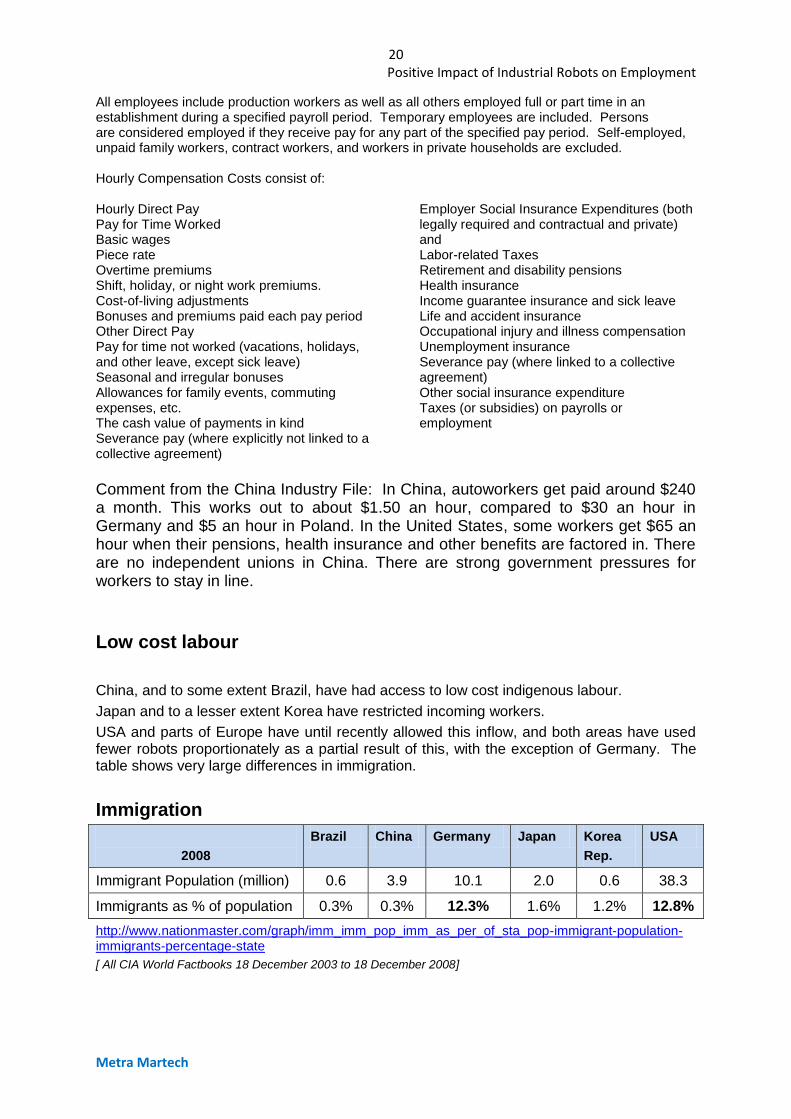
Low cost labour
China, and to some extent Brazil, have had access to low cost indigenous labour.
Japan and to a lesser extent Korea have restricted incoming workers.
USA and parts of Europe have until recently allowed this inflow, and both areas have used fewer robots proportionately as a partial result of this, with the exception of Germany. The table shows very large differences in immigration.
Immigration
2008
Brazil China Germany Japan Korea
Rep.
USA
Immigrant Population (million) 0.6 3.9 10.1 2.0 0.6 38.3
Immigrants as % of population 0.3% 0.3% 12.3% 1.6% 1.2% 12.8%
http://www.nationmaster.com/graph/imm_imm_pop_imm_as_per_of_sta_pop-immigrant-population-immigrants-percentage-state
[ All CIA World Factbooks 18 December 2003 to 18 December 2008]
21 Positive Impact of Industrial Robots on Employment
Metra Martech
3.6 Health, safety [H&S] and environment
The increasing attention to these factors adds impetus to the employment of robotics in hazardous environments, or those involving great monotony. In the developed countries, H&S is a steadily advancing area; in the developing countries, progress is very sporadic.
According to the International Labor Organization (ILO), 270 million workers fall victim to occupational injuries and illnesses, leading to 2.3 million deaths annually,
showing that the problem is significant.
There is pressure from consumer groups to force manufactures in developing countries to look after their workers to a standard approaching that achieved by the developed world manufacturers, but progress is slow.
However, no specific new initiatives have been identified in the study so far, which would cause a step change in the current trend to gradual improvement of health and safety practices in the six countries being studied.
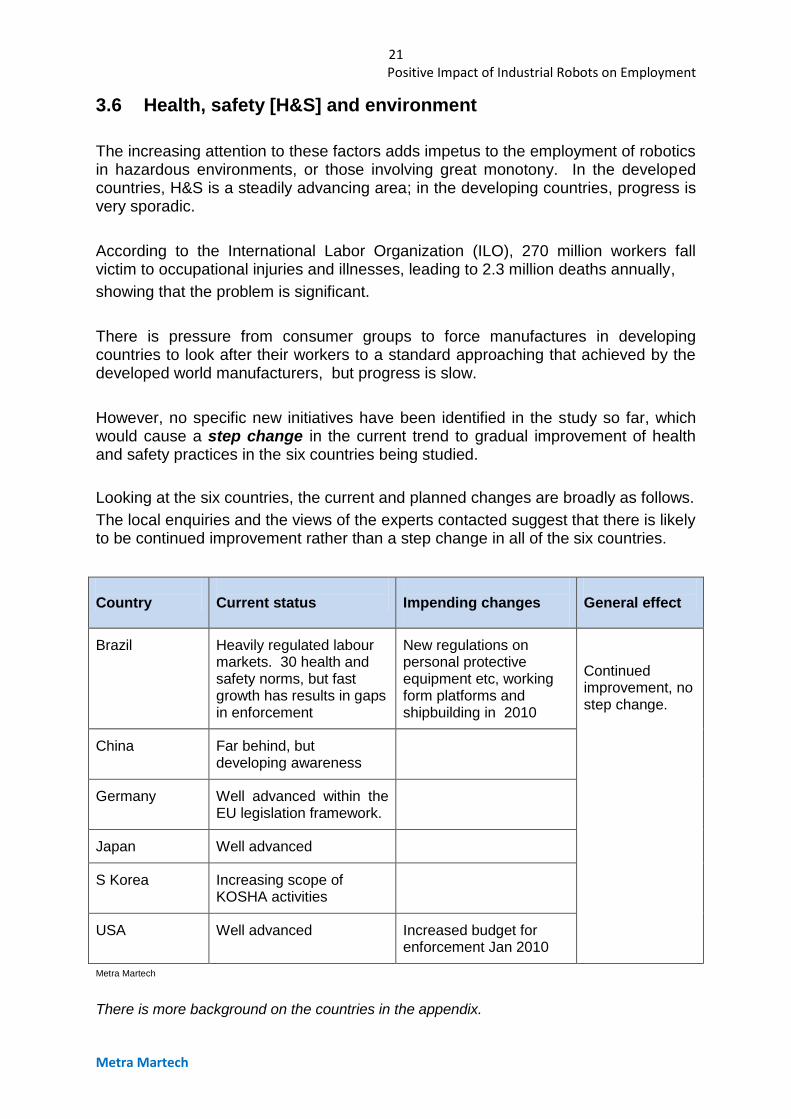
Looking at the six countries, the current and planned changes are broadly as follows.
The local enquiries and the views of the experts contacted suggest that there is likely to be continued improvement rather than a step change in all of the six countries.
Country
Current status
Impending changes
General effect
Brazil Heavily regulated labour markets. 30 health and safety norms, but fast growth has results in gaps in enforcement
New regulations on personal protective equipment etc, working form platforms and shipbuilding in 2010
Continued improvement, no step change.
China Far behind, but developing awareness
Germany Well advanced within the EU legislation framework.
Japan Well advanced
S Korea Increasing scope of KOSHA activities
USA Well advanced Increased budget for enforcement Jan 2010
Metra Martech
There is more background on the countries in the appendix.

22 Positive Impact of Industrial Robots on Employment
Metra Martech
Blank page
23 Positive Impact of Industrial Robots on Employment
Metra Martech
4. NOTES ON THE SECTORS AS ROBOT USERS
The paragraphs below provide orders of magnitude for the applications to put them into a world perspective.
4.1 The robotics industry itself
The numbers employed in manufacturing robot systems now are relatively small…of the order of 150,000 worldwide.
This can be compared with almost zero thirty years ago.
The second group is the skilled systems integrator and the in-house skilled technicians of the robot systems. IFR figures show 1 to 1.3 million robots in use. If a car plant has 500 robots this could require say 50 skilled technicians for the robots. This is 1 job gained per 10 robots
The automotive industry has 365,000 robots [IFR report] so 365,000 divided by 10 = 36,000 dedicated staff.
Non automotive, typically smaller robot installations, could gain proportionately twice as many dedicated staff per 10 robots installed. 656,000 robots divided by 5 or 6 = 110 to 131,000 dedicated staff.
The total of the two groups is 145,000 to 167,000 people. We have taken the more conservative figure of 150,000
The total for the industry is of the order of 300,000
[This figure has been agreed as the right order of magnitude by a selection of the IFR members.]
4.2 Where the product cannot be made to satisfactory precision or consistency without the use of robotics.
These are typically new industries made possible by robotics, where accuracy and consistency cannot be achieved without robotics, but parts of traditional industry, notably motor vehicle manufacture, require robots to achieve international standards.
24 Positive Impact of Industrial Robots on Employment
Metra Martech
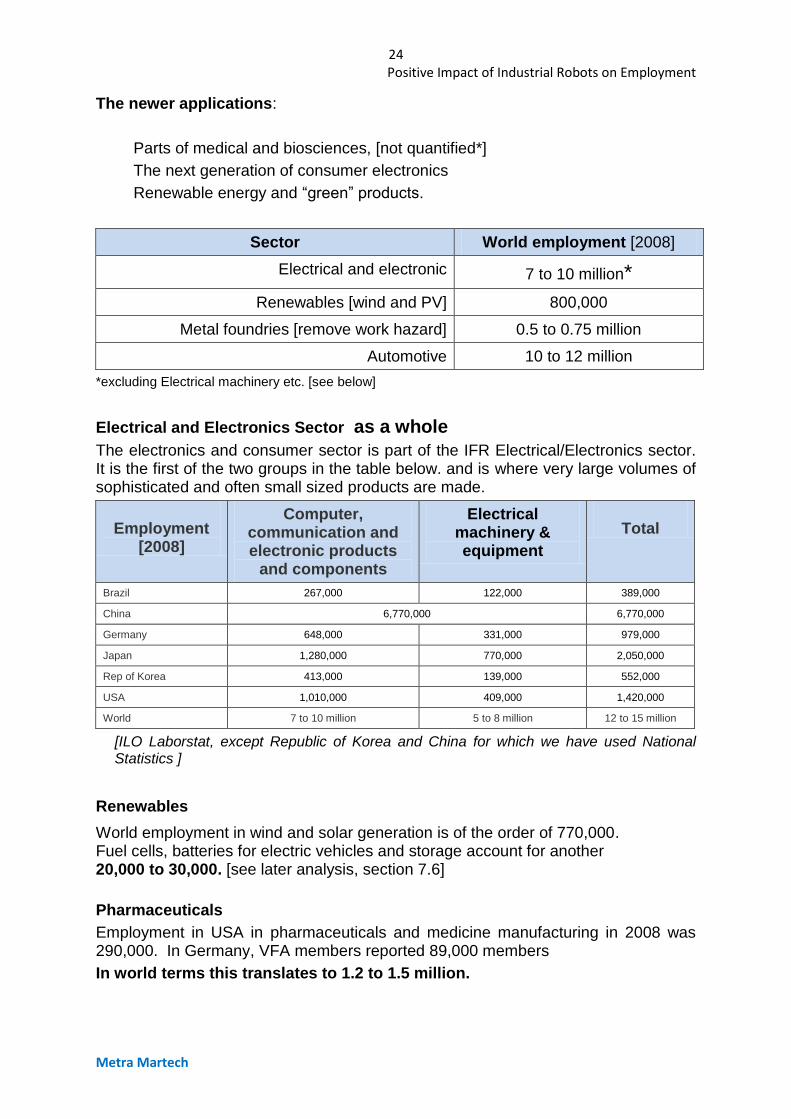
The newer applications:
Parts of medical and biosciences, [not quantified*]
The next generation of consumer electronics
Renewable energy and “green” products.
Sector World employment [2008]
Electrical and electronic 7 to 10 million*
Renewables [wind and PV] 800,000
Metal foundries [remove work hazard] 0.5 to 0.75 million
Automotive 10 to 12 million
*excluding Electrical machinery etc. [see below]
Electrical and Electronics Sector as a whole
The electronics and consumer sector is part of the IFR Electrical/Electronics sector. It is the first of the two groups in the table below. and is where very large volumes of sophisticated and often small sized products are made.
Employment
[2008]
Computer, communication and electronic products
and components
Electrical machinery & equipment
Total
Brazil 267,000 122,000 389,000
China 6,770,000 6,770,000
Germany 648,000 331,000 979,000
Japan 1,280,000 770,000 2,050,000
Rep of Korea 413,000 139,000 552,000
USA 1,010,000 409,000 1,420,000
World 7 to 10 million 5 to 8 million 12 to 15 million
[ILO Laborstat, except Republic of Korea and China for which we have used National Statistics ]
Renewables
World employment in wind and solar generation is of the order of 770,000. Fuel cells, batteries for electric vehicles and storage account for another 20,000 to 30,000. [see later analysis, section 7.6]
Pharmaceuticals
Employment in USA in pharmaceuticals and medicine manufacturing in 2008 was 290,000. In Germany, VFA members reported 89,000 members
In world terms this translates to 1.2 to 1.5 million.
25 Positive Impact of Industrial Robots on Employment
Metra Martech
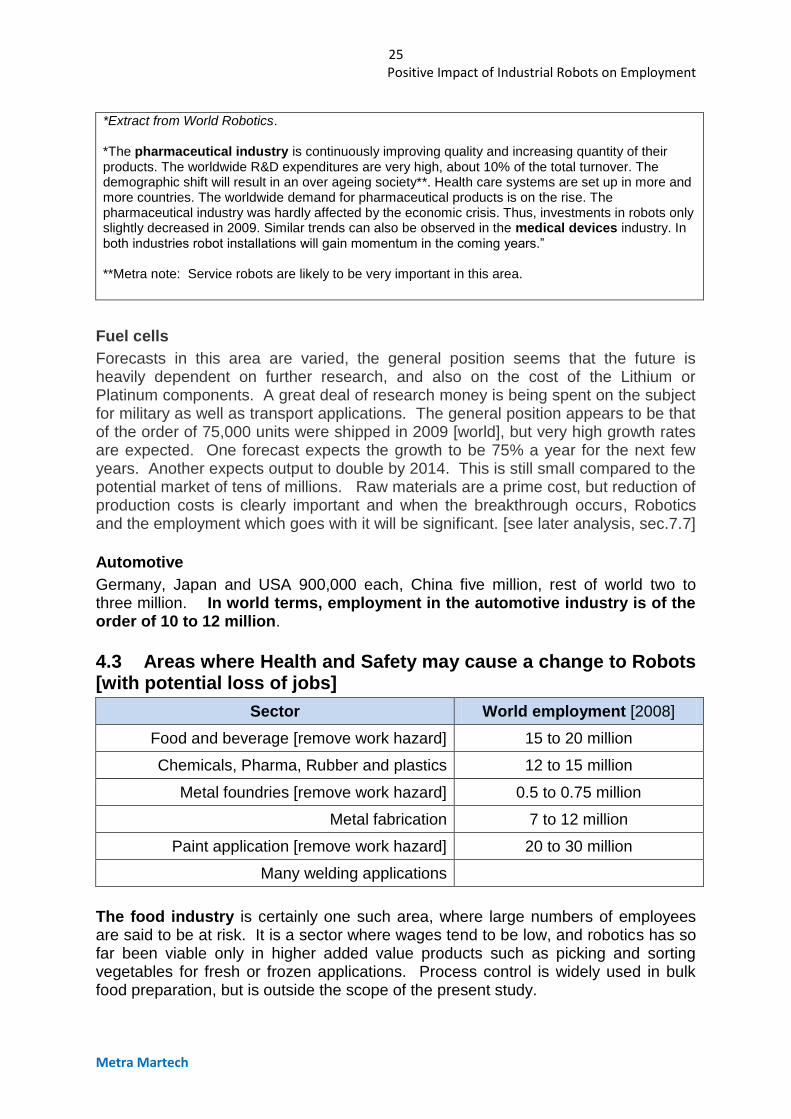
*Extract from World Robotics. *The pharmaceutical industry is continuously improving quality and increasing quantity of their products. The worldwide R&D expenditures are very high, about 10% of the total turnover. The demographic shift will result in an over ageing society**. Health care systems are set up in more and more countries. The worldwide demand for pharmaceutical products is on the rise. The pharmaceutical industry was hardly affected by the economic crisis. Thus, investments in robots only slightly decreased in 2009. Similar trends can also be observed in the medical devices industry. In both industries robot installations will gain momentum in the coming years.” **Metra note: Service robots are likely to be very important in this area.
Fuel cells
Forecasts in this area are varied, the general position seems that the future is heavily dependent on further research, and also on the cost of the Lithium or Platinum components. A great deal of research money is being spent on the subject for military as well as transport applications. The general position appears to be that of the order of 75,000 units were shipped in 2009 [world], but very high growth rates are expected. One forecast expects the growth to be 75% a year for the next few years. Another expects output to double by 2014. This is still small compared to the potential market of tens of millions. Raw materials are a prime cost, but reduction of production costs is clearly important and when the breakthrough occurs, Robotics and the employment which goes with it will be significant. [see later analysis, sec.7.7]
Automotive
Germany, Japan and USA 900,000 each, China five million, rest of world two to three million. In world terms, employment in the automotive industry is of the order of 10 to 12 million.
4.3 Areas where Health and Safety may cause a change to Robots [with potential loss of jobs]
Sector World employment [2008]
Food and beverage [remove work hazard] 15 to 20 million
Chemicals, Pharma, Rubber and plastics 12 to 15 million
Metal foundries [remove work hazard] 0.5 to 0.75 million
Metal fabrication 7 to 12 million
Paint application [remove work hazard] 20 to 30 million
Many welding applications
The food industry is certainly one such area, where large numbers of employees are said to be at risk. It is a sector where wages tend to be low, and robotics has so far been viable only in higher added value products such as picking and sorting vegetables for fresh or frozen applications. Process control is widely used in bulk food preparation, but is outside the scope of the present study.
26 Positive Impact of Industrial Robots on Employment
Metra Martech
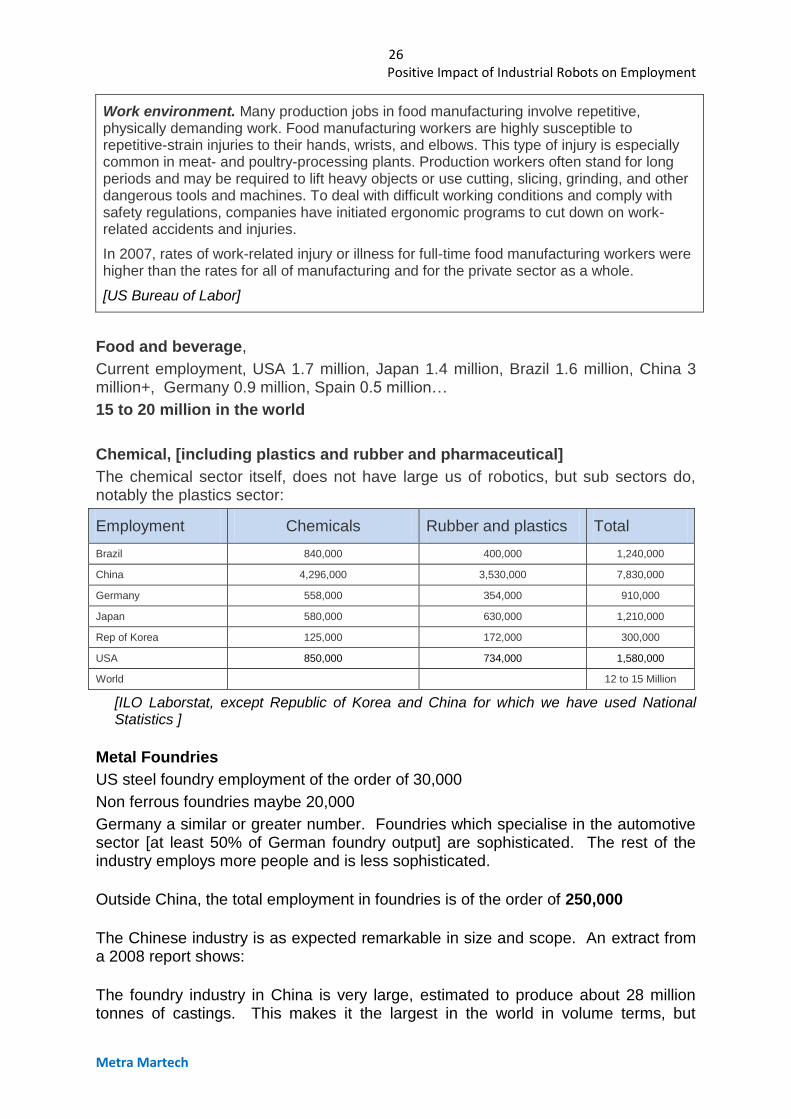
Work environment. Many production jobs in food manufacturing involve repetitive, physically demanding work. Food manufacturing workers are highly susceptible to repetitive-strain injuries to their hands, wrists, and elbows. This type of injury is especially common in meat- and poultry-processing plants. Production workers often stand for long periods and may be required to lift heavy objects or use cutting, slicing, grinding, and other dangerous tools and machines. To deal with difficult working conditions and comply with safety regulations, companies have initiated ergonomic programs to cut down on work-related accidents and injuries.
In 2007, rates of work-related injury or illness for full-time food manufacturing workers were higher than the rates for all of manufacturing and for the private sector as a whole.
[US Bureau of Labor]
Food and beverage,
Current employment, USA 1.7 million, Japan 1.4 million, Brazil 1.6 million, China 3 million+, Germany 0.9 million, Spain 0.5 million…
15 to 20 million in the world
Chemical, [including plastics and rubber and pharmaceutical]
The chemical sector itself, does not have large us of robotics, but sub sectors do, notably the plastics sector:
Employment Chemicals Rubber and plastics Total
Brazil 840,000 400,000 1,240,000
China 4,296,000 3,530,000 7,830,000
Germany 558,000 354,000 910,000
Japan 580,000 630,000 1,210,000
Rep of Korea 125,000 172,000 300,000
USA 850,000 734,000 1,580,000
World 12 to 15 Million
[ILO Laborstat, except Republic of Korea and China for which we have used National Statistics ]
Metal Foundries
US steel foundry employment of the order of 30,000
Non ferrous foundries maybe 20,000
Germany a similar or greater number. Foundries which specialise in the automotive sector [at least 50% of German foundry output] are sophisticated. The rest of the industry employs more people and is less sophisticated.
Outside China, the total employment in foundries is of the order of 250,000
The Chinese industry is as expected remarkable in size and scope. An extract from a 2008 report shows:
The foundry industry in China is very large, estimated to produce about 28 million tonnes of castings. This makes it the largest in the world in volume terms, but
27 Positive Impact of Industrial Robots on Employment
Metra Martech
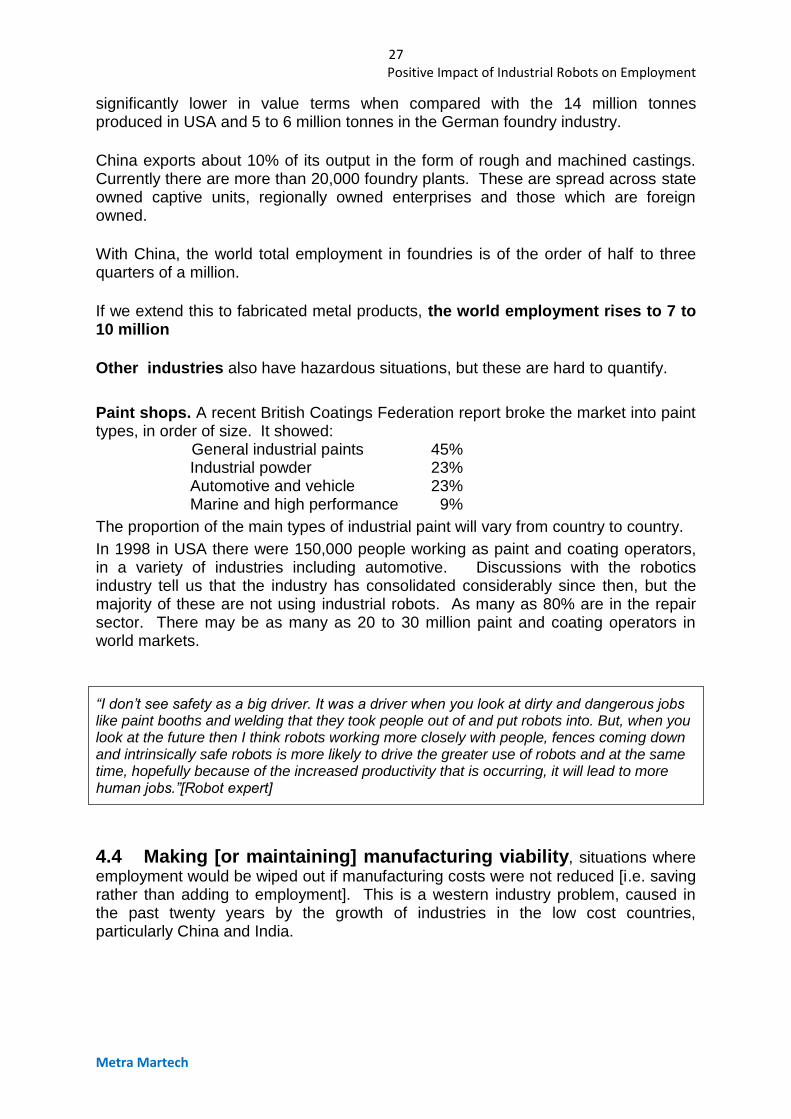
significantly lower in value terms when compared with the 14 million tonnes produced in USA and 5 to 6 million tonnes in the German foundry industry.
China exports about 10% of its output in the form of rough and machined castings. Currently there are more than 20,000 foundry plants. These are spread across state owned captive units, regionally owned enterprises and those which are foreign owned.
With China, the world total employment in foundries is of the order of half to three quarters of a million.
If we extend this to fabricated metal products, the world employment rises to 7 to 10 million
Other industries also have hazardous situations, but these are hard to quantify.
Paint shops. A recent British Coatings Federation report broke the market into paint types, in order of size. It showed: General industrial paints 45%
Industrial powder 23% Automotive and vehicle 23% Marine and high performance 9%
The proportion of the main types of industrial paint will vary from country to country.
In 1998 in USA there were 150,000 people working as paint and coating operators, in a variety of industries including automotive. Discussions with the robotics industry tell us that the industry has consolidated considerably since then, but the majority of these are not using industrial robots. As many as 80% are in the repair sector. There may be as many as 20 to 30 million paint and coating operators in world markets.
“I don’t see safety as a big driver. It was a driver when you look at dirty and dangerous jobs like paint booths and welding that they took people out of and put robots into. But, when you look at the future then I think robots working more closely with people, fences coming down and intrinsically safe robots is more likely to drive the greater use of robots and at the same time, hopefully because of the increased productivity that is occurring, it will lead to more human jobs.”[Robot expert]
4.4 Making [or maintaining] manufacturing viability, situations where
employment would be wiped out if manufacturing costs were not reduced [i.e. saving rather than adding to employment]. This is a western industry problem, caused in the past twenty years by the growth of industries in the low cost countries, particularly China and India.
28 Positive Impact of Industrial Robots on Employment
Metra Martech
Sectors affected are those which have high labour costs. In the terms of the current study, this means the Automotive sector, parts of Electronics and parts of the Metal industry.
The numbers of jobs saved could be tens of millions but it has not been possible in this survey to analyse which applications these come from.
No doubt, Japan, Germany and now Republic of Korea have invested more, and have lost fewer jobs in manufacturing in the period covered by the study.
“Automation is not likely to enable industries that have already gone offshore (e.g.consumer electronics) to return but can help to stop others from having to go offshore. In the consumer electronics sector, France can no longer hope to compete with Chinese companies such as Foxconn, which have built facilities employing hundreds of thousands of people. A more likely development is that over time, companies like Foxconn decide to set up in Europe in order to be closer to the marketplace, but they are more likely to set up in Romania or Hungary than Germany or France. Over time it won’t be possible for everything to be done from China. The cost of living will rise there and the cost base will change.” [Robot expert]
“I agree with inclusion of downstream employment beyond the actual manufacture. However, it is hard to assign all associated jobs with the cell phone example. Could you also assign all jobs in the automotive industry including selling cars and servicing cars?
I believe that most viable products would be produced in some manner with or without robots and cell phones fall into this category. Automation may very well be part of the acceleration of the products success.”[Robot expert]
29 Positive Impact of Industrial Robots on Employment
Metra Martech
5. HOW MUCH EMPLOYMENT IS DEPENDENT ON ROBOTICS ?
5.1 Background
The tables which follow are based on the fact that only part of the workforce is there because of robotics. The rest of the jobs in the sector, to do with design, distribution etc, could be fed from a manufacturing plant elsewhere.
The factors that go to make up the estimated proportion are not easily quantified, but we have identified several which help to derive the overall view for a sector. The proportions shown are an indication only, but they have been refined as a result of the discussions with robotics experts during this survey
The proportion of the industry which uses robotics,
For example, this is low in the food industry, high in the automobile assembly subsector, but less evident in the automotive components sector [part of which may be heavily automated, but not robot users].
The sophistication of the manufacturing operation, or its special needs,
For example the need for cleanrooms in the electronics component sector, but not necessarily in assembly. Or the need to meet health and safety requirements in the more developed countries.
The cost of labour,
For example, the cost of labour is relatively low throughout the world in the food sector, which results in lower use of robotics. In China where the cost of labour is low, there is a much greater likelihood of employing large teams for assembly work in any industry, rather than robots
5.2 Precision, Consistency and Cost. Sectors which require robotics.
A very important element here is the role of automation in allowing large volumes of often complex products to be produced at a quality that is not otherwise achievable and at a cost which is affordable in the consumer market. In the days of manually assembled cars, they were expensive and the numbers purchased were relatively few. From the Ford Model T to the present day, mass production and then automation has brought the cost to an affordable level for most families in the developed world. Mobile/cell phones, computers etc have a very similar pattern of growth, except this has happened over a period of ten years and is now dependent on Robots.
30 Positive Impact of Industrial Robots on Employment
Metra Martech
Electrical and Electronics sector relationship with robots.
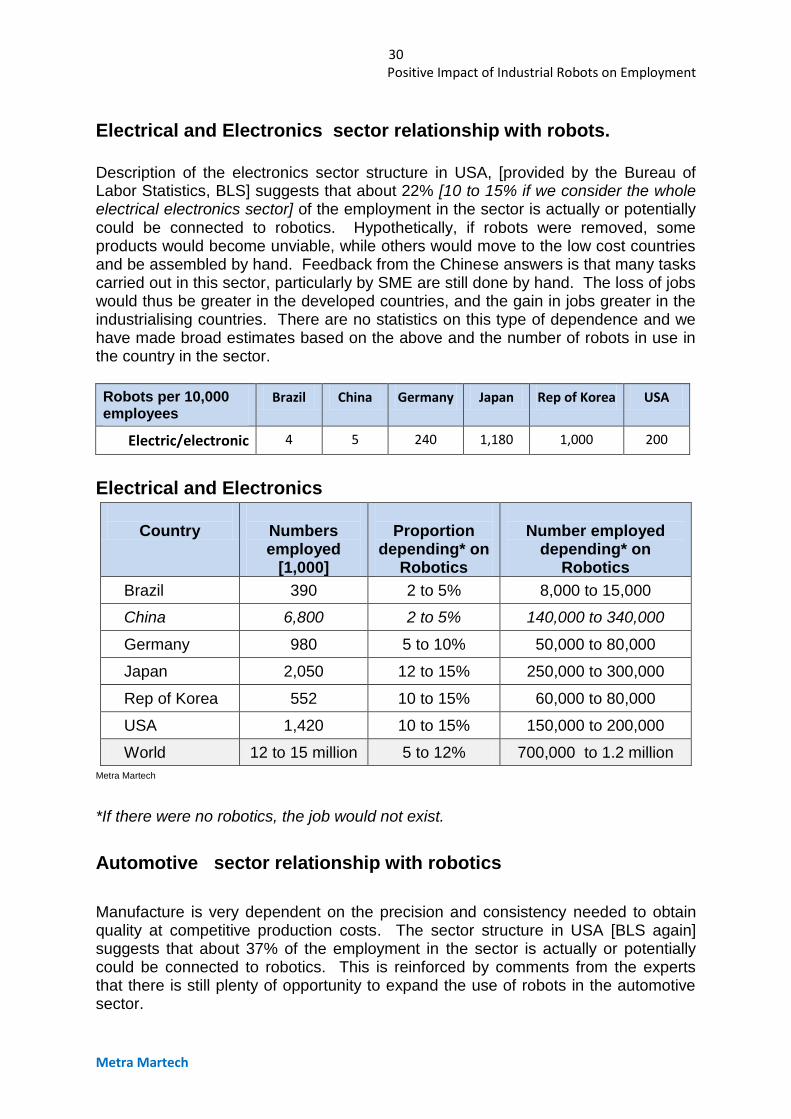
Description of the electronics sector structure in USA, [provided by the Bureau of Labor Statistics, BLS] suggests that about 22% [10 to 15% if we consider the whole electrical electronics sector] of the employment in the sector is actually or potentially could be connected to robotics. Hypothetically, if robots were removed, some products would become unviable, while others would move to the low cost countries and be assembled by hand. Feedback from the Chinese answers is that many tasks carried out in this sector, particularly by SME are still done by hand. The loss of jobs would thus be greater in the developed countries, and the gain in jobs greater in the industrialising countries. There are no statistics on this type of dependence and we have made broad estimates based on the above and the number of robots in use in the country in the sector.
Robots per 10,000 employees
Brazil China Germany Japan Rep of Korea USA
Electric/electronic 4 5 240 1,180 1,000 200
Electrical and Electronics
Country
Numbers employed
[1,000]
Proportion
depending* on Robotics
Number employed
depending* on Robotics
Brazil 390 2 to 5% 8,000 to 15,000
China 6,800 2 to 5% 140,000 to 340,000
Germany 980 5 to 10% 50,000 to 80,000
Japan 2,050 12 to 15% 250,000 to 300,000
Rep of Korea 552 10 to 15% 60,000 to 80,000
USA 1,420 10 to 15% 150,000 to 200,000
World 12 to 15 million 5 to 12% 700,000 to 1.2 million
Metra Martech
*If there were no robotics, the job would not exist.
Automotive sector relationship with robotics
Manufacture is very dependent on the precision and consistency needed to obtain quality at competitive production costs. The sector structure in USA [BLS again] suggests that about 37% of the employment in the sector is actually or potentially could be connected to robotics. This is reinforced by comments from the experts that there is still plenty of opportunity to expand the use of robots in the automotive sector.
31 Positive Impact of Industrial Robots on Employment
Metra Martech
“Automation and robotics will enter new areas of the car making process, essentially the assembly area, and this will drive growth in both the industrialised and the industrialising markets.
The reasons this has not been possible so far are technical but as technological improvements resulting in more intelligent robot systems with better sensors enable closer interaction between human workers and robots, it will become a reality. This will drive automation into new areas and provide additional growth even in areas that appear saturated already.
Every new production line built for the automotive industry results in orders for more robots and these orders are augmented by the new assembly activities that are becoming robotised.” [Robot expert]
Robots are mainly used in the body shop where welding, painting and material handling applications take place. The final assembly is a different segment of the plant, and that’s where robots have not penetrated so much. There are a lot of people doing final assembly where robots cannot currently be used because they need to be working side by side with the people, but legislation says they have to be fenced off. GM have a joint research with NASA to produce a robot system with spatial awareness that is safe to work alongside, in the final assembly area. The component sector is also a user of robotics, but the nature of the components allows more automation rather than robotics.
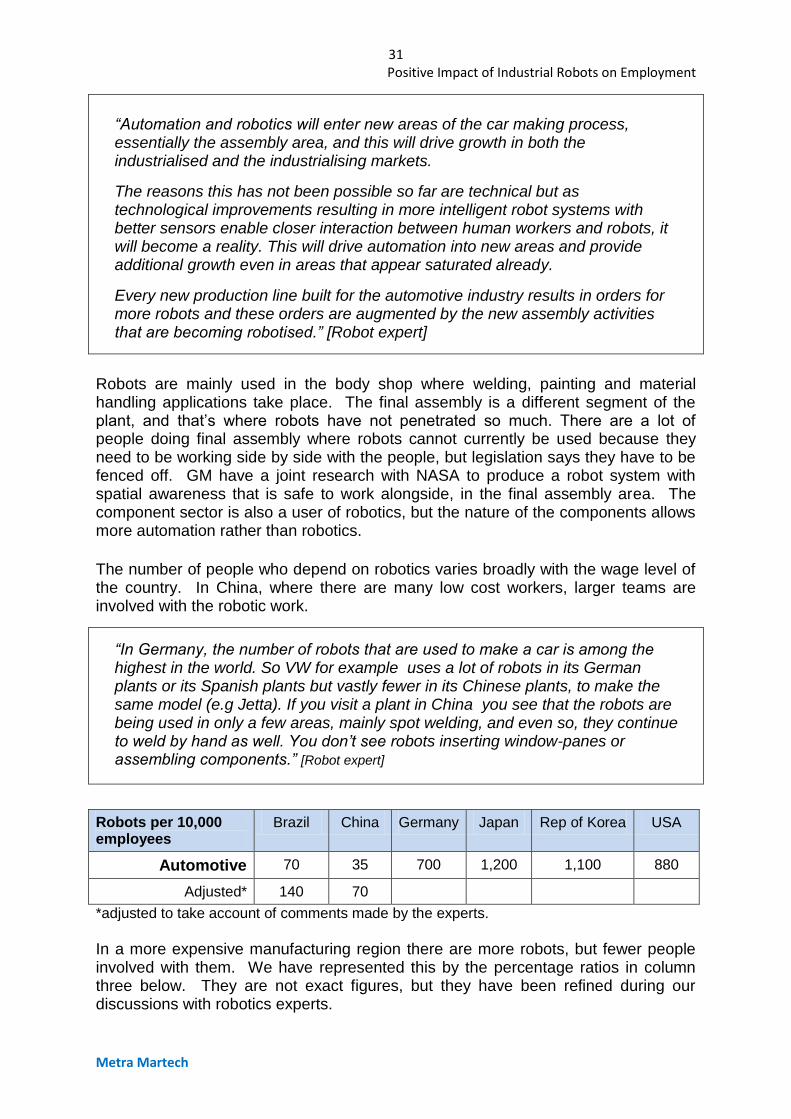
The number of people who depend on robotics varies broadly with the wage level of the country. In China, where there are many low cost workers, larger teams are involved with the robotic work.
“In Germany, the number of robots that are used to make a car is among the highest in the world. So VW for example uses a lot of robots in its German plants or its Spanish plants but vastly fewer in its Chinese plants, to make the same model (e.g Jetta). If you visit a plant in China you see that the robots are being used in only a few areas, mainly spot welding, and even so, they continue to weld by hand as well. You don’t see robots inserting window-panes or assembling components.” [Robot expert]
Robots per 10,000 employees
Brazil China Germany Japan Rep of Korea USA
Automotive 70 35 700 1,200 1,100 880
Adjusted* 140 70
*adjusted to take account of comments made by the experts.
In a more expensive manufacturing region there are more robots, but fewer people involved with them. We have represented this by the percentage ratios in column three below. They are not exact figures, but they have been refined during our discussions with robotics experts.
32 Positive Impact of Industrial Robots on Employment
Metra Martech
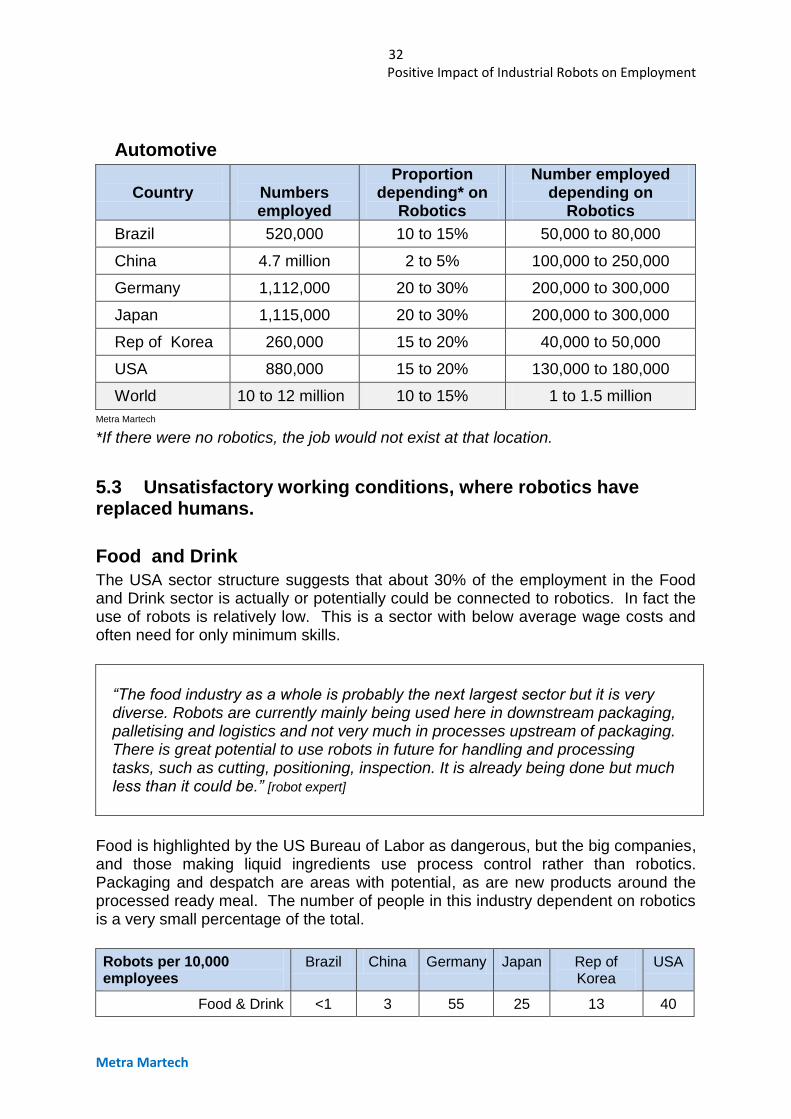
Automotive
Country
Numbers employed
Proportion depending* on
Robotics
Number employed depending on
Robotics
Brazil 520,000 10 to 15% 50,000 to 80,000
China 4.7 million 2 to 5% 100,000 to 250,000
Germany 1,112,000 20 to 30% 200,000 to 300,000
Japan 1,115,000 20 to 30% 200,000 to 300,000
Rep of Korea 260,000 15 to 20% 40,000 to 50,000
USA 880,000 15 to 20% 130,000 to 180,000
World 10 to 12 million 10 to 15% 1 to 1.5 million
Metra Martech
*If there were no robotics, the job would not exist at that location.
5.3 Unsatisfactory working conditions, where robotics have replaced humans.
Food and Drink
The USA sector structure suggests that about 30% of the employment in the Food and Drink sector is actually or potentially could be connected to robotics. In fact the use of robots is relatively low. This is a sector with below average wage costs and often need for only minimum skills.
“The food industry as a whole is probably the next largest sector but it is very diverse. Robots are currently mainly being used here in downstream packaging, palletising and logistics and not very much in processes upstream of packaging. There is great potential to use robots in future for handling and processing tasks, such as cutting, positioning, inspection. It is already being done but much less than it could be.” [robot expert]
Food is highlighted by the US Bureau of Labor as dangerous, but the big companies, and those making liquid ingredients use process control rather than robotics. Packaging and despatch are areas with potential, as are new products around the processed ready meal. The number of people in this industry dependent on robotics is a very small percentage of the total.
Robots per 10,000 employees
Brazil China Germany Japan Rep of Korea
USA
Food & Drink <1 3 55 25 13 40
33 Positive Impact of Industrial Robots on Employment
Metra Martech
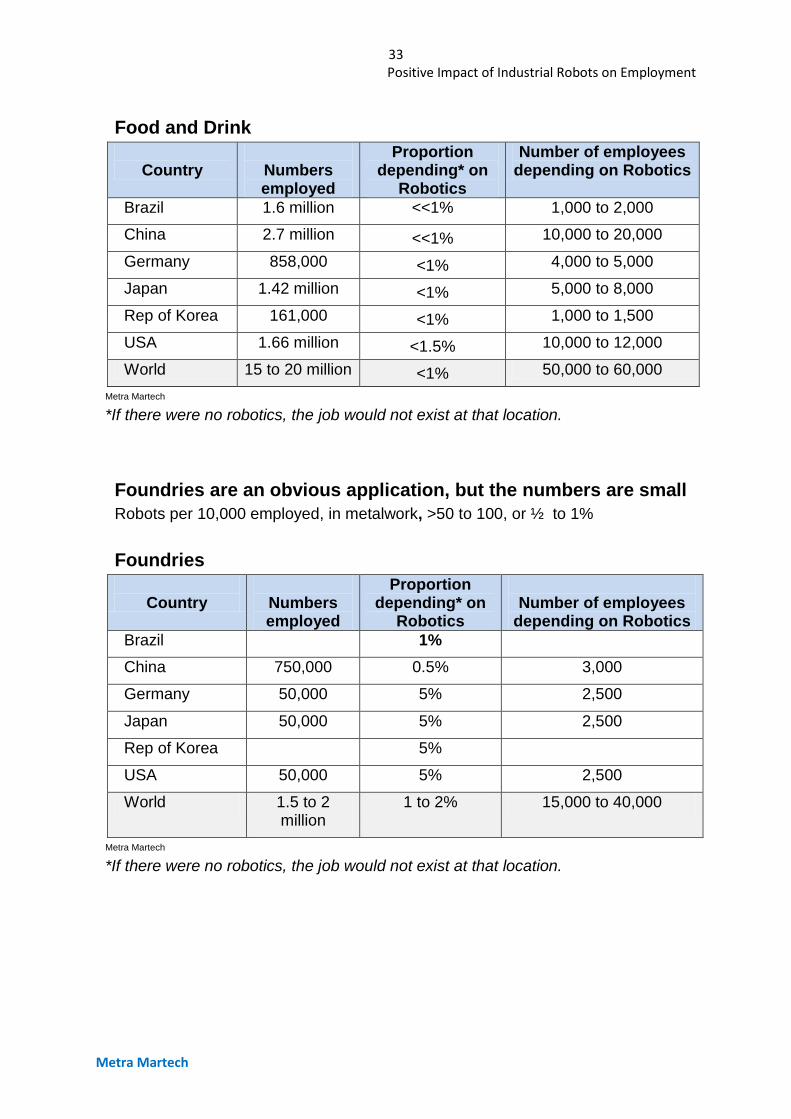
Food and Drink
Country
Numbers employed
Proportion depending* on
Robotics
Number of employees depending on Robotics
Brazil 1.6 million <<1% 1,000 to 2,000
China 2.7 million <<1% 10,000 to 20,000
Germany 858,000 <1% 4,000 to 5,000
Japan 1.42 million <1% 5,000 to 8,000
Rep of Korea 161,000 <1% 1,000 to 1,500
USA 1.66 million <1.5% 10,000 to 12,000
World 15 to 20 million <1% 50,000 to 60,000
Metra Martech
*If there were no robotics, the job would not exist at that location.
Foundries are an obvious application, but the numbers are small
Robots per 10,000 employed, in metalwork, >50 to 100, or ½ to 1%
Foundries
Country
Numbers employed
Proportion depending* on
Robotics
Number of employees
depending on Robotics
Brazil 1%
China 750,000 0.5% 3,000
Germany 50,000 5% 2,500
Japan 50,000 5% 2,500
Rep of Korea 5%
USA 50,000 5% 2,500
World 1.5 to 2 million
1 to 2% 15,000 to 40,000
Metra Martech
*If there were no robotics, the job would not exist at that location.
34 Positive Impact of Industrial Robots on Employment
Metra Martech
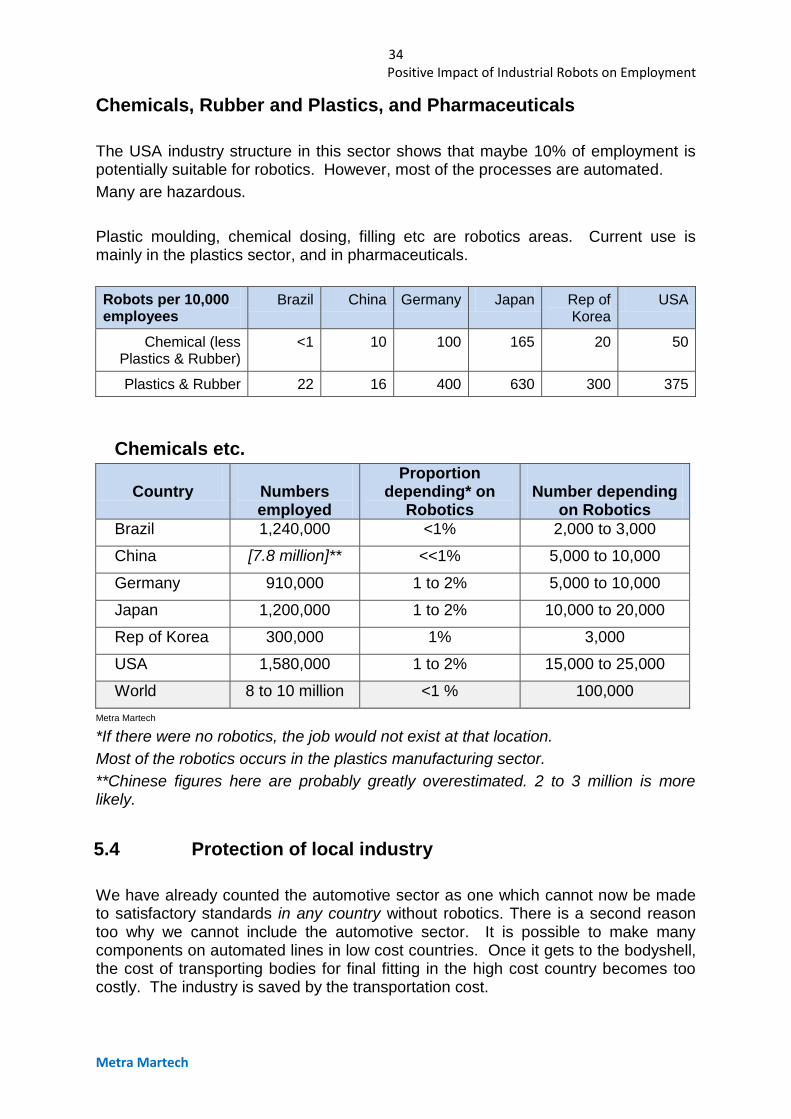
Chemicals, Rubber and Plastics, and Pharmaceuticals
The USA industry structure in this sector shows that maybe 10% of employment is potentially suitable for robotics. However, most of the processes are automated.
Many are hazardous.
Plastic moulding, chemical dosing, filling etc are robotics areas. Current use is mainly in the plastics sector, and in pharmaceuticals.
Robots per 10,000 employees
Brazil China Germany Japan Rep of Korea
USA
Chemical (less Plastics & Rubber)
<1 10 100 165 20 50
Plastics & Rubber 22 16 400 630 300 375
Chemicals etc.
Country
Numbers employed
Proportion depending* on
Robotics
Number depending
on Robotics
Brazil 1,240,000 <1% 2,000 to 3,000
China [7.8 million]** <<1% 5,000 to 10,000
Germany 910,000 1 to 2% 5,000 to 10,000
Japan 1,200,000 1 to 2% 10,000 to 20,000
Rep of Korea 300,000 1% 3,000
USA 1,580,000 1 to 2% 15,000 to 25,000
World 8 to 10 million <1 % 100,000
Metra Martech
*If there were no robotics, the job would not exist at that location.
Most of the robotics occurs in the plastics manufacturing sector.
**Chinese figures here are probably greatly overestimated. 2 to 3 million is more likely.
5.4 Protection of local industry
We have already counted the automotive sector as one which cannot now be made to satisfactory standards in any country without robotics. There is a second reason too why we cannot include the automotive sector. It is possible to make many components on automated lines in low cost countries. Once it gets to the bodyshell, the cost of transporting bodies for final fitting in the high cost country becomes too costly. The industry is saved by the transportation cost.
35 Positive Impact of Industrial Robots on Employment
Metra Martech
The choice is then to import the complete vehicles, or to find a lower cost region in which to make the cars. Examples of these are the Southern states in USA and East Europe for the Europeans.
The electronics sector has already conceded much of electronics manufacture to the low cost areas. There they already use robots when necessary to get the quality/volume equation right.
The opportunity for protecting local manufacturing employment appears to lie in situations where:
The total cost of producing locally can be kept equal to or below the lower cost overseas manufacture plus the added transport cost.
The benefits of having local service and support almost outweigh the lower cost overseas manufacture plus the added transport cost but there would be a clear advantage if cost could be lowered.
A company cannot get enough production in the local market to be viable, but with robotics could increase production, lower cost and sell internationally.
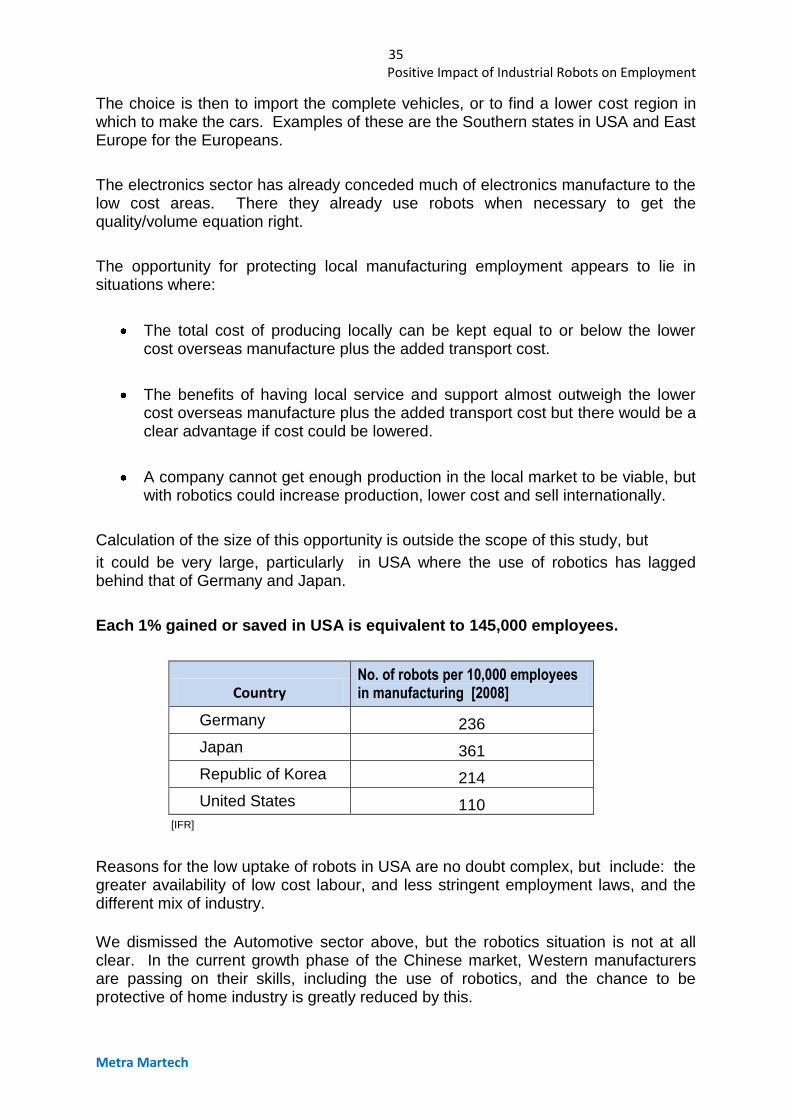
Calculation of the size of this opportunity is outside the scope of this study, but
it could be very large, particularly in USA where the use of robotics has lagged behind that of Germany and Japan.
Each 1% gained or saved in USA is equivalent to 145,000 employees.
Country No. of robots per 10,000 employees in manufacturing [2008]
Germany 236
Japan 361
Republic of Korea 214
United States 110 [IFR]
Reasons for the low uptake of robots in USA are no doubt complex, but include: the greater availability of low cost labour, and less stringent employment laws, and the different mix of industry.
We dismissed the Automotive sector above, but the robotics situation is not at all clear. In the current growth phase of the Chinese market, Western manufacturers are passing on their skills, including the use of robotics, and the chance to be protective of home industry is greatly reduced by this.
36 Positive Impact of Industrial Robots on Employment
Metra Martech
However, after a period when the Japanese car industry exported large numbers of cars around the globe, they and later Korean and German industry developed overseas manufacture. This was partly to overcome the cost of transport, but also because the local requirements for safety and emissions were not always met by overseas cars. The same applies to exporters to Europe and to Japan. The car manufacturing implants to US were are also able to set up plants in lower cost States, and to avoid the costs of pensions which the US car producers faced.
Governments have offered major incentives in Europe to attract these implant car factories.
Chinese car production is so low cost, that there are reports of GM and others importing direct from their plants in China or Korea.
The “simple” solution of more automation to protect industry is thus only a part of the story. An analysis of production shows a complex picture.
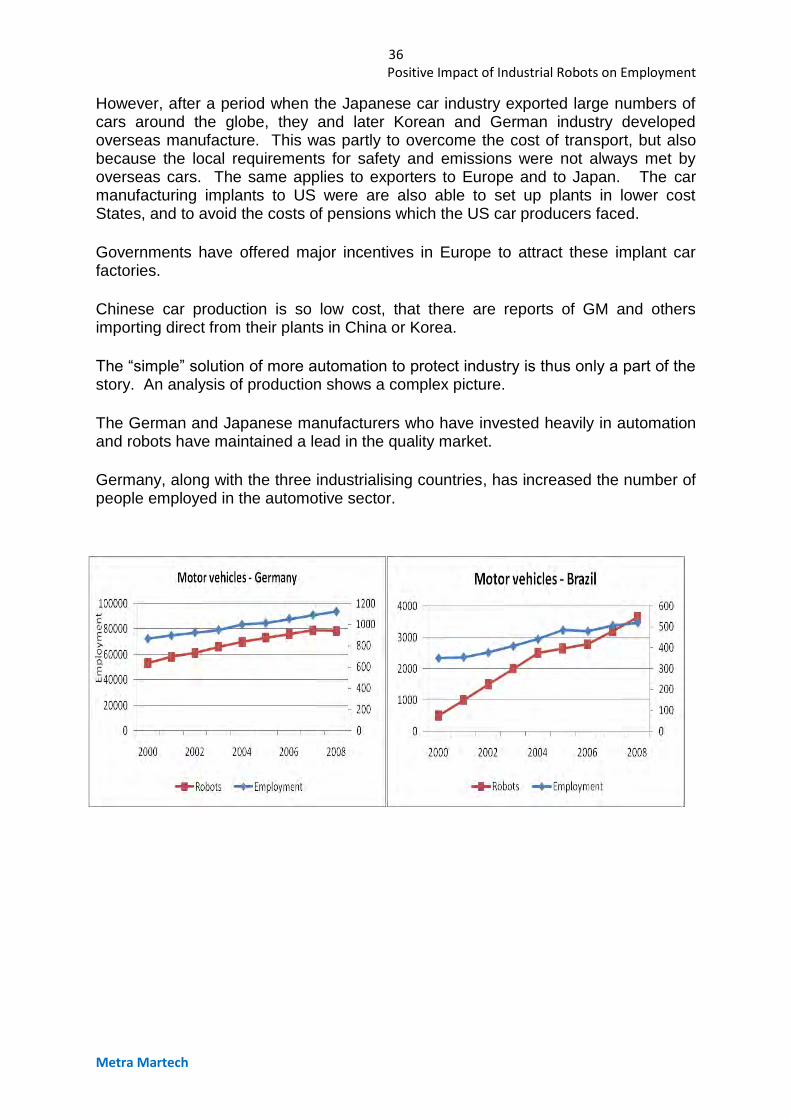
The German and Japanese manufacturers who have invested heavily in automation and robots have maintained a lead in the quality market.
Germany, along with the three industrialising countries, has increased the number of people employed in the automotive sector.
37 Positive Impact of Industrial Robots on Employment
Metra Martech
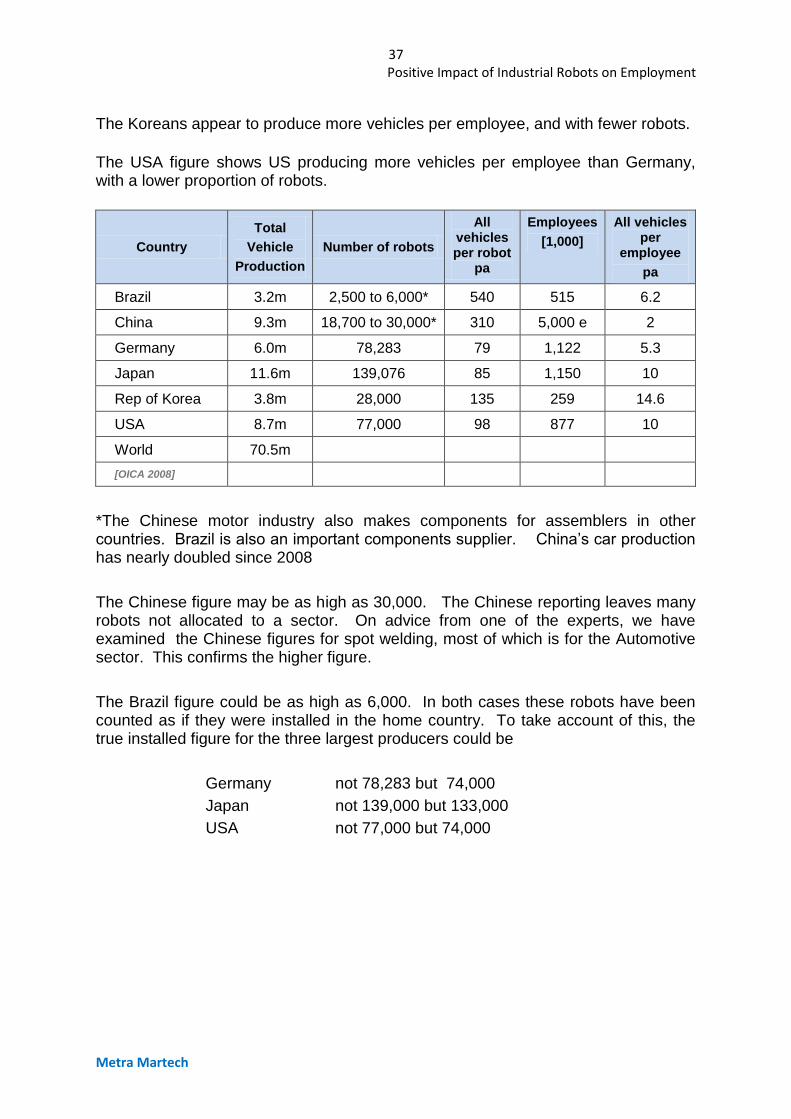
The Koreans appear to produce more vehicles per employee, and with fewer robots.
The USA figure shows US producing more vehicles per employee than Germany, with a lower proportion of robots.
Country
Total
Vehicle
Production
Number of robots
All vehicles per robot
pa
Employees
[1,000]
All vehicles per
employee
pa
Brazil 3.2m 2,500 to 6,000* 540 515 6.2
China 9.3m 18,700 to 30,000* 310 5,000 e 2
Germany 6.0m 78,283 79 1,122 5.3
Japan 11.6m 139,076 85 1,150 10
Rep of Korea 3.8m 28,000 135 259 14.6
USA 8.7m 77,000 98 877 10
World 70.5m
[OICA 2008]
*The Chinese motor industry also makes components for assemblers in other countries. Brazil is also an important components supplier. China’s car production has nearly doubled since 2008
The Chinese figure may be as high as 30,000. The Chinese reporting leaves many robots not allocated to a sector. On advice from one of the experts, we have examined the Chinese figures for spot welding, most of which is for the Automotive sector. This confirms the higher figure.
The Brazil figure could be as high as 6,000. In both cases these robots have been counted as if they were installed in the home country. To take account of this, the true installed figure for the three largest producers could be
Germany not 78,283 but 74,000
Japan not 139,000 but 133,000
USA not 77,000 but 74,000

38 Positive Impact of Industrial Robots on Employment
Metra Martech
Blank page
39 Positive Impact of Industrial Robots on Employment
Metra Martech
6. THE POSITION OF SME 6.1 Profile of SME
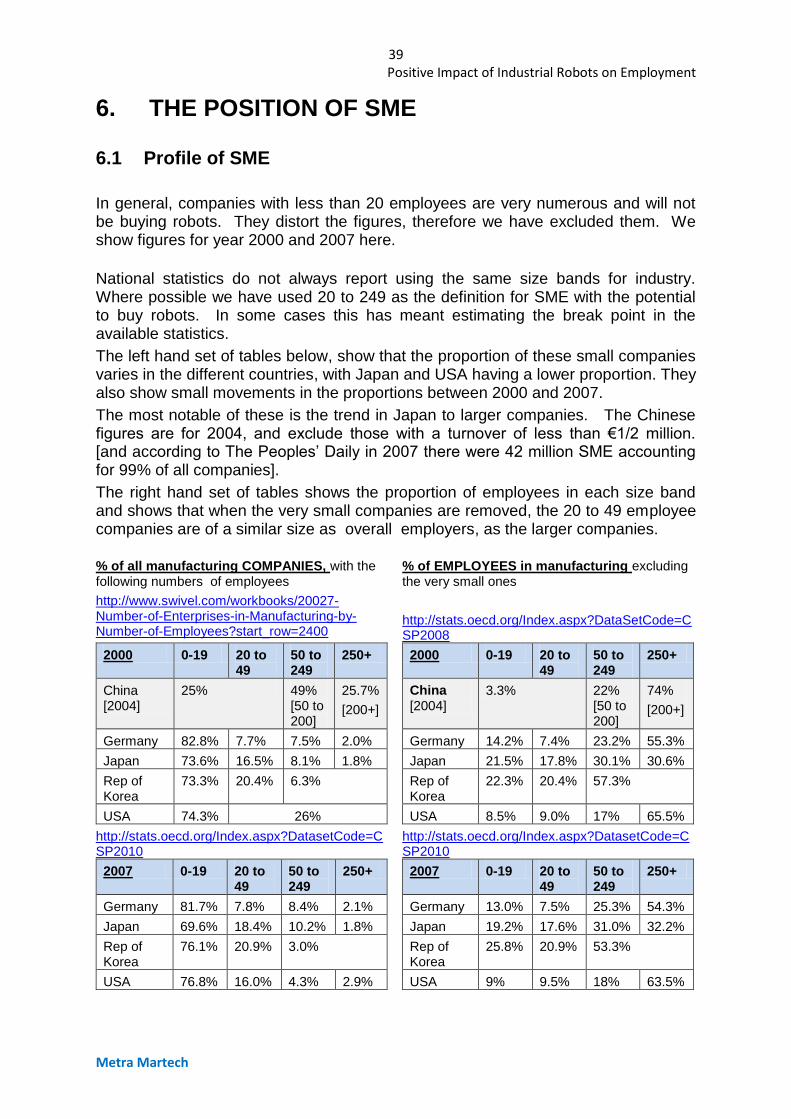
In general, companies with less than 20 employees are very numerous and will not be buying robots. They distort the figures, therefore we have excluded them. We show figures for year 2000 and 2007 here.
National statistics do not always report using the same size bands for industry. Where possible we have used 20 to 249 as the definition for SME with the potential to buy robots. In some cases this has meant estimating the break point in the available statistics.
The left hand set of tables below, show that the proportion of these small companies varies in the different countries, with Japan and USA having a lower proportion. They also show small movements in the proportions between 2000 and 2007.
The most notable of these is the trend in Japan to larger companies. The Chinese figures are for 2004, and exclude those with a turnover of less than €1/2 million. [and according to The Peoples’ Daily in 2007 there were 42 million SME accounting for 99% of all companies].
The right hand set of tables shows the proportion of employees in each size band and shows that when the very small companies are removed, the 20 to 49 employee companies are of a similar size as overall employers, as the larger companies.
% of all manufacturing COMPANIES, with the following numbers of employees
http://www.swivel.com/workbooks/20027-Number-of-Enterprises-in-Manufacturing-by-Number-of-Employees?start_row=2400
% of EMPLOYEES in manufacturing excluding the very small ones
http://stats.oecd.org/Index.aspx?DataSetCode=CSP2008
2000 0-19 20 to 49
50 to 249
250+
China [2004]
25% 49% [50 to 200]
25.7%
[200+]
Germany 82.8% 7.7% 7.5% 2.0%
Japan 73.6% 16.5% 8.1% 1.8%
Rep of Korea
73.3% 20.4% 6.3%
USA 74.3% 26%
2000 0-19 20 to 49
50 to 249
250+
China [2004]
3.3% 22% [50 to 200]
74%
[200+]
Germany 14.2% 7.4% 23.2% 55.3%
Japan 21.5% 17.8% 30.1% 30.6%
Rep of Korea
22.3% 20.4% 57.3%
USA 8.5% 9.0% 17% 65.5%
http://stats.oecd.org/Index.aspx?DatasetCode=CSP2010
2007 0-19 20 to 49
50 to 249
250+
Germany 81.7% 7.8% 8.4% 2.1%
Japan 69.6% 18.4% 10.2% 1.8%
Rep of Korea
76.1% 20.9% 3.0%
USA 76.8% 16.0% 4.3% 2.9%
http://stats.oecd.org/Index.aspx?DatasetCode=CSP2010
2007 0-19 20 to 49
50 to 249
250+
Germany 13.0% 7.5% 25.3% 54.3%
Japan 19.2% 17.6% 31.0% 32.2%
Rep of Korea
25.8% 20.9% 53.3%
USA 9% 9.5% 18% 63.5%
40 Positive Impact of Industrial Robots on Employment
Metra Martech
6.2 SME and use of robots
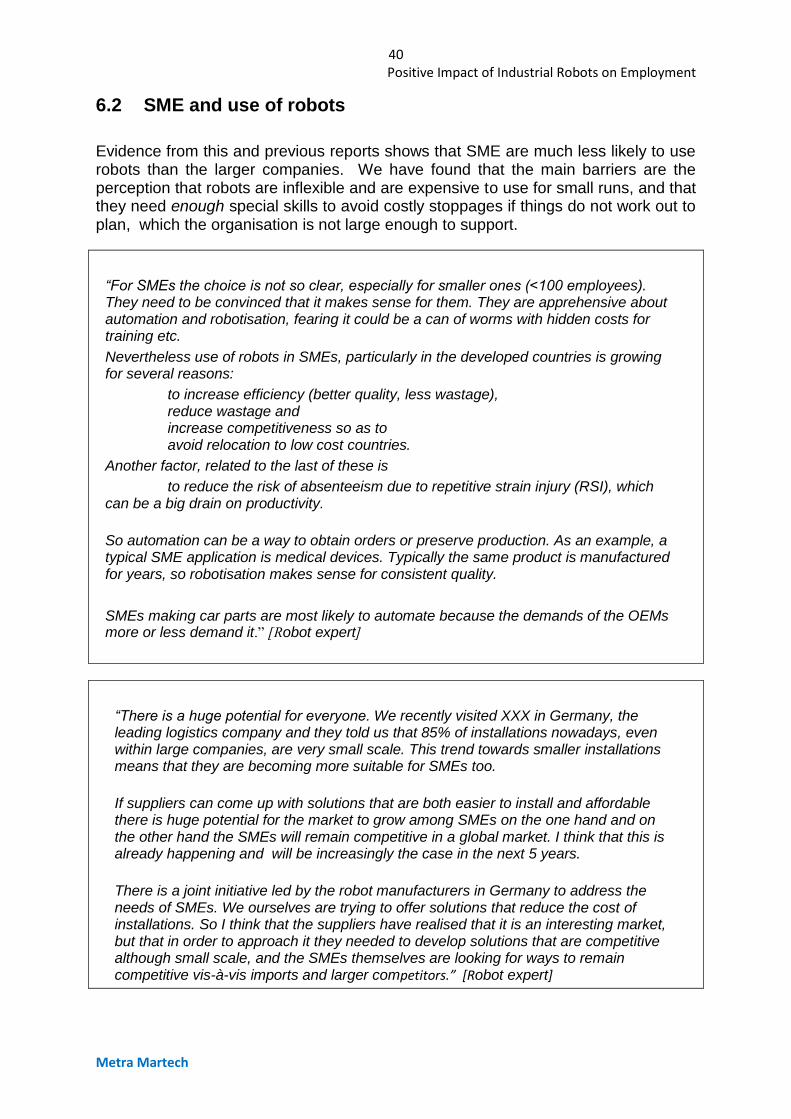
Evidence from this and previous reports shows that SME are much less likely to use robots than the larger companies. We have found that the main barriers are the perception that robots are inflexible and are expensive to use for small runs, and that they need enough special skills to avoid costly stoppages if things do not work out to plan, which the organisation is not large enough to support.
“For SMEs the choice is not so clear, especially for smaller ones (<100 employees). They need to be convinced that it makes sense for them. They are apprehensive about automation and robotisation, fearing it could be a can of worms with hidden costs for training etc.
Nevertheless use of robots in SMEs, particularly in the developed countries is growing for several reasons:
- to increase efficiency (better quality, less wastage), - reduce wastage and - increase competitiveness so as to - avoid relocation to low cost countries.
Another factor, related to the last of these is
- to reduce the risk of absenteeism due to repetitive strain injury (RSI), which can be a big drain on productivity.
So automation can be a way to obtain orders or preserve production. As an example, a typical SME application is medical devices. Typically the same product is manufactured for years, so robotisation makes sense for consistent quality.
SMEs making car parts are most likely to automate because the demands of the OEMs more or less demand it.” [Robot expert]
“There is a huge potential for everyone. We recently visited XXX in Germany, the leading logistics company and they told us that 85% of installations nowadays, even within large companies, are very small scale. This trend towards smaller installations means that they are becoming more suitable for SMEs too.
If suppliers can come up with solutions that are both easier to install and affordable there is huge potential for the market to grow among SMEs on the one hand and on the other hand the SMEs will remain competitive in a global market. I think that this is already happening and will be increasingly the case in the next 5 years.
There is a joint initiative led by the robot manufacturers in Germany to address the needs of SMEs. We ourselves are trying to offer solutions that reduce the cost of installations. So I think that the suppliers have realised that it is an interesting market, but that in order to approach it they needed to develop solutions that are competitive although small scale, and the SMEs themselves are looking for ways to remain competitive vis-à-vis imports and larger competitors.” [Robot expert]

41 Positive Impact of Industrial Robots on Employment
Metra Martech
There is no accepted measure for the likelihood of SME to use robots. We have tried various combinations to allow for the different industries, but for simplicity have adopted the hypothesis that the small companies are 20 times less likely to use a robot as the larger companies. For China, which has such a large pool of low cost labour, we have used the figure of 200 times less likely. Because the numbers of robots used by SME is small, the effect of changing the ratio is not critical in the context of the current study.
In a later project it should be possible to test these hypotheses.
The number of robots in use in each sector is based on IFR figures where they are available. Where they are not, we have made an analysis of shipment data provided by IFR.
The effect on employment is likely to be to give these companies advantage over those who have not adopted robotics.
The potential is large, but as there are many more companies to sell to than for the larger companies, penetration is likely to be slower.
Use of robots by (S)ME* [estimates 2008]
Numbers of robots in use
Food / Drink
Automotive Electrical/ Electronic
Plastics/ Chemicals
Total
Brazil - 100 to 200 - 40 to 50 150 to 250
China V few <50 V few V few 50 to 100
Germany 200 to 250 650 to 750 130 to 160 300 to 400 1,250 to 1,600
Japan 50 to 100 1,100 to 1,400
1,250 to 1,500
550 to 625 3,000 to 3,700
Rep of Korea <50 500 to 800 800 to 1,000
170 to 210 1,500 to 2,000
USA 80 to 100 400 to 500 200 to 400 150 to 250 800 to 1,200
Total 450 to 550 2,800 to
4,000
2,600 to 3,200
1,300 to 1,500
7,000 to 10,000
Total (S)ME employment*
39 million
13m excl China
Robots per 10,000
2 per 10,000
[6 per 10,000 excl China]
Metra Martech
*SME without the very small ones [generally those with less than 20 employees].

42 Positive Impact of Industrial Robots on Employment
Metra Martech
Blank page
43 Positive Impact of Industrial Robots on Employment
Metra Martech
7. EXPECTATIONS UP TO 2016
7.1 The economic factors
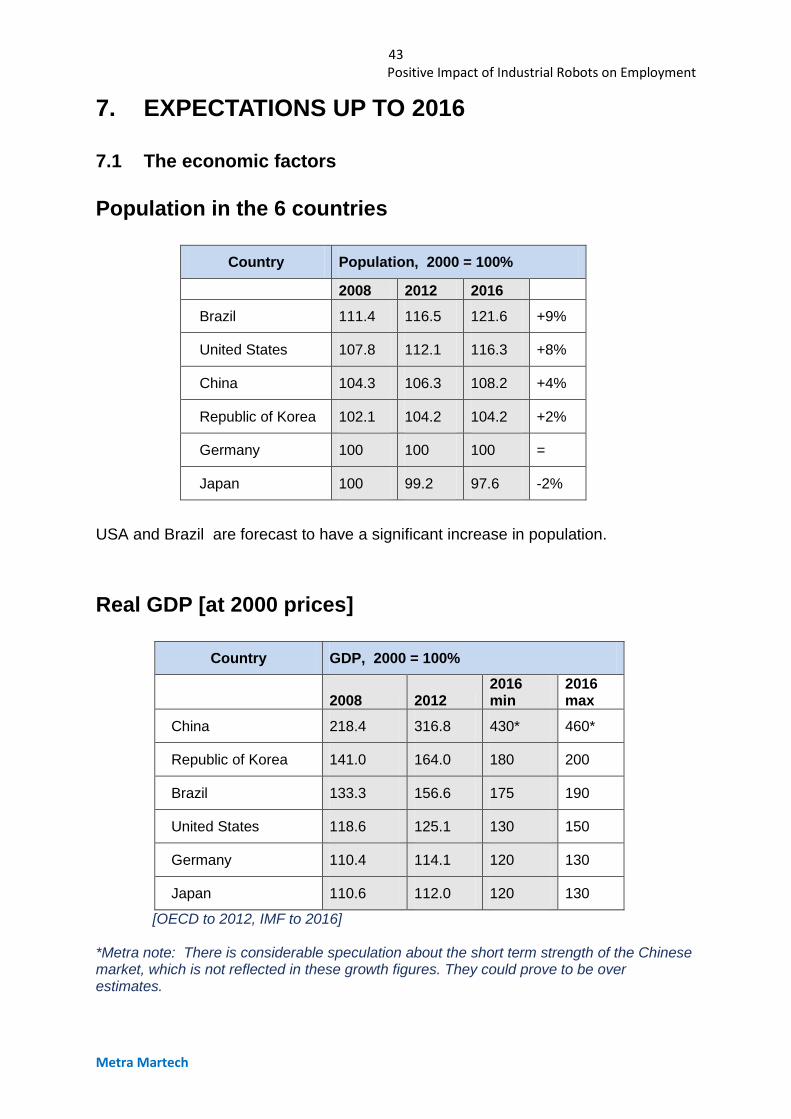
Population in the 6 countries
Country Population, 2000 = 100%
2008 2012 2016
Brazil 111.4 116.5 121.6 +9%
United States 107.8 112.1 116.3 +8%
China 104.3 106.3 108.2 +4%
Republic of Korea 102.1 104.2 104.2 +2%
Germany 100 100 100 =
Japan 100 99.2 97.6 -2%
USA and Brazil are forecast to have a significant increase in population.
Real GDP [at 2000 prices]
Country GDP, 2000 = 100%
2008 2012 2016 min
2016 max
China 218.4 316.8 430* 460*
Republic of Korea 141.0 164.0 180 200
Brazil 133.3 156.6 175 190
United States 118.6 125.1 130 150
Germany 110.4 114.1 120 130
Japan 110.6 112.0 120 130
[OECD to 2012, IMF to 2016] *Metra note: There is considerable speculation about the short term strength of the Chinese market, which is not reflected in these growth figures. They could prove to be over estimates.
44 Positive Impact of Industrial Robots on Employment
Metra Martech
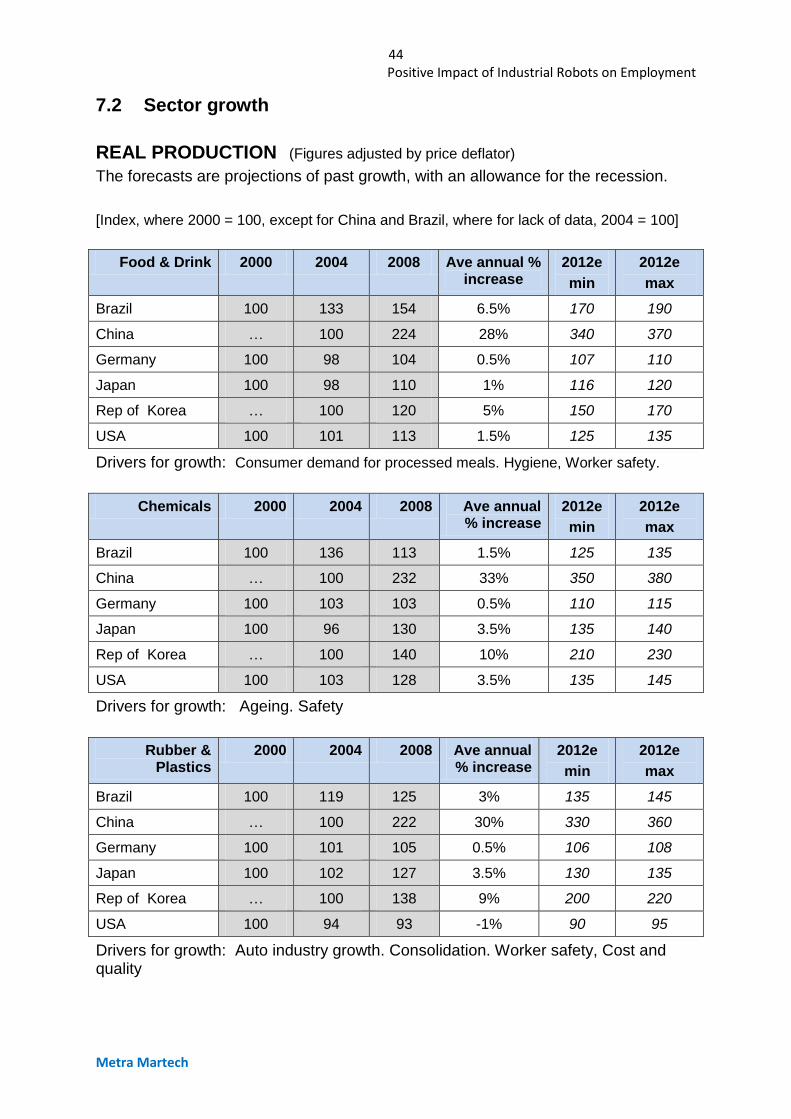
7.2 Sector growth
REAL PRODUCTION (Figures adjusted by price deflator)
The forecasts are projections of past growth, with an allowance for the recession.
[Index, where 2000 = 100, except for China and Brazil, where for lack of data, 2004 = 100]
Food & Drink 2000 2004 2008 Ave annual % increase
2012e
min
2012e
max
Brazil 100 133 154 6.5% 170 190
China … 100 224 28% 340 370
Germany 100 98 104 0.5% 107 110
Japan 100 98 110 1% 116 120
Rep of Korea … 100 120 5% 150 170
USA 100 101 113 1.5% 125 135
Drivers for growth: Consumer demand for processed meals. Hygiene, Worker safety.
Chemicals 2000 2004 2008 Ave annual % increase
2012e
min
2012e
max
Brazil 100 136 113 1.5% 125 135
China … 100 232 33% 350 380
Germany 100 103 103 0.5% 110 115
Japan 100 96 130 3.5% 135 140
Rep of Korea … 100 140 10% 210 230
USA 100 103 128 3.5% 135 145
Drivers for growth: Ageing. Safety
Rubber & Plastics
2000 2004 2008 Ave annual % increase
2012e
min
2012e
max
Brazil 100 119 125 3% 135 145
China … 100 222 30% 330 360
Germany 100 101 105 0.5% 106 108
Japan 100 102 127 3.5% 130 135
Rep of Korea … 100 138 9% 200 220
USA 100 94 93 -1% 90 95
Drivers for growth: Auto industry growth. Consolidation. Worker safety, Cost and quality
45 Positive Impact of Industrial Robots on Employment
Metra Martech
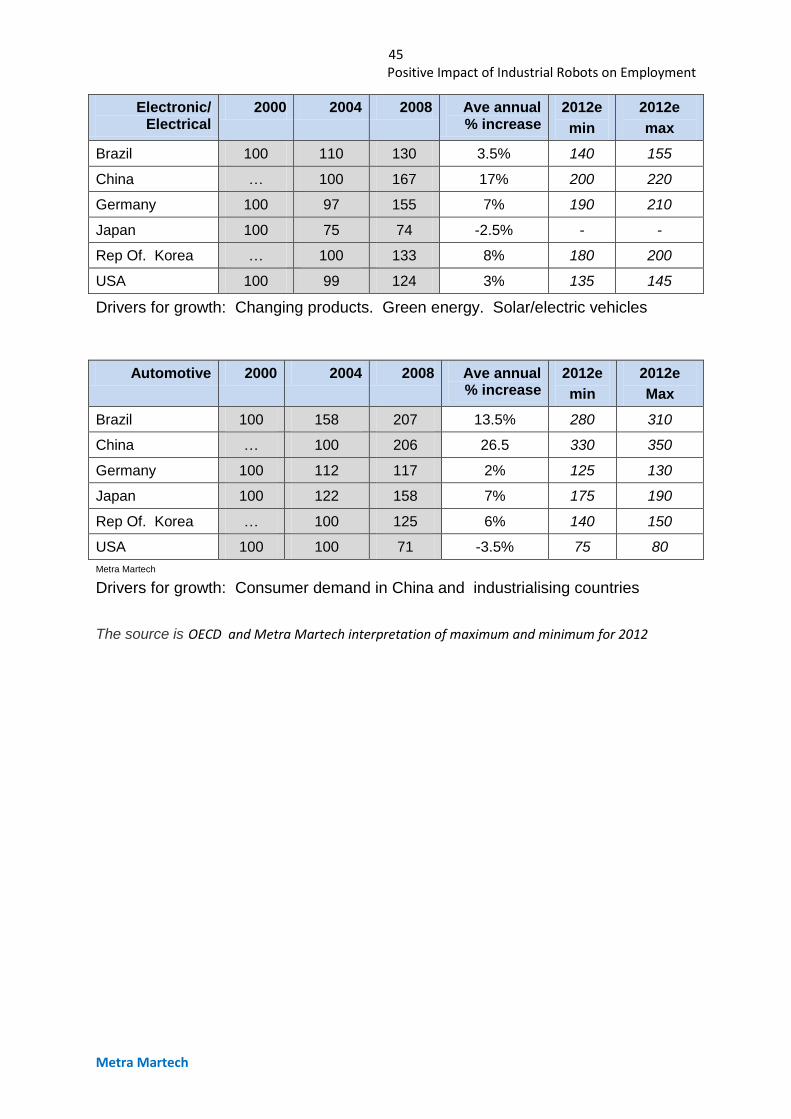
Electronic/ Electrical
2000 2004 2008 Ave annual % increase
2012e
min
2012e
max
Brazil 100 110 130 3.5% 140 155
China … 100 167 17% 200 220
Germany 100 97 155 7% 190 210
Japan 100 75 74 -2.5% - -
Rep Of. Korea … 100 133 8% 180 200
USA 100 99 124 3% 135 145
Drivers for growth: Changing products. Green energy. Solar/electric vehicles
Automotive 2000 2004 2008 Ave annual % increase
2012e
min
2012e
Max
Brazil 100 158 207 13.5% 280 310
China … 100 206 26.5 330 350
Germany 100 112 117 2% 125 130
Japan 100 122 158 7% 175 190
Rep Of. Korea … 100 125 6% 140 150
USA 100 100 71 -3.5% 75 80
Metra Martech
Drivers for growth: Consumer demand in China and industrialising countries
The source is OECD and Metra Martech interpretation of maximum and minimum for 2012
46 Positive Impact of Industrial Robots on Employment
Metra Martech
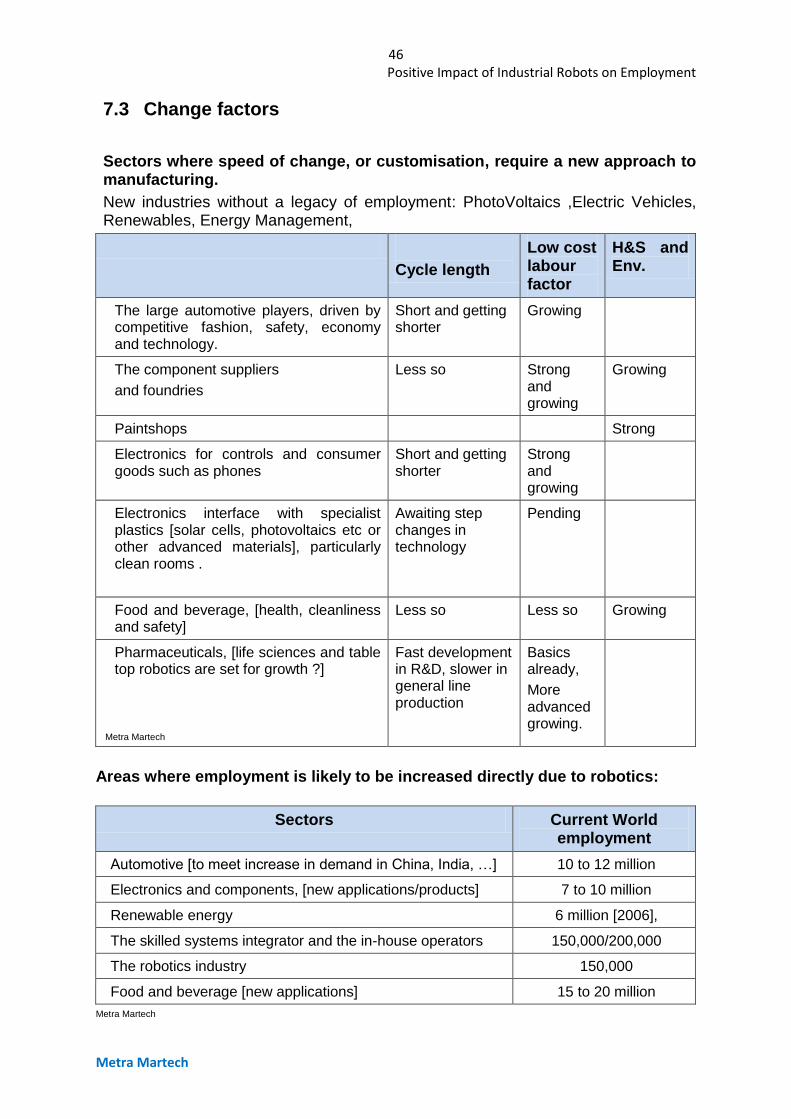
7.3 Change factors
Sectors where speed of change, or customisation, require a new approach to manufacturing.
New industries without a legacy of employment: PhotoVoltaics ,Electric Vehicles, Renewables, Energy Management,
Cycle length
Low cost labour factor
H&S and Env.
The large automotive players, driven by competitive fashion, safety, economy and technology.
Short and getting shorter
Growing
The component suppliers
and foundries
Less so Strong and growing
Growing
Paintshops Strong
Electronics for controls and consumer goods such as phones
Short and getting shorter
Strong and growing
Electronics interface with specialist plastics [solar cells, photovoltaics etc or other advanced materials], particularly clean rooms .
Awaiting step changes in technology
Pending
Food and beverage, [health, cleanliness and safety]
Less so Less so Growing
Pharmaceuticals, [life sciences and table top robotics are set for growth ?]
Metra Martech
Fast development in R&D, slower in general line production
Basics already,
More advanced growing.
Areas where employment is likely to be increased directly due to robotics:
Sectors Current World employment
Automotive [to meet increase in demand in China, India, …] 10 to 12 million
Electronics and components, [new applications/products] 7 to 10 million
Renewable energy 6 million [2006],
The skilled systems integrator and the in-house operators 150,000/200,000
The robotics industry 150,000
Food and beverage [new applications] 15 to 20 million
Metra Martech
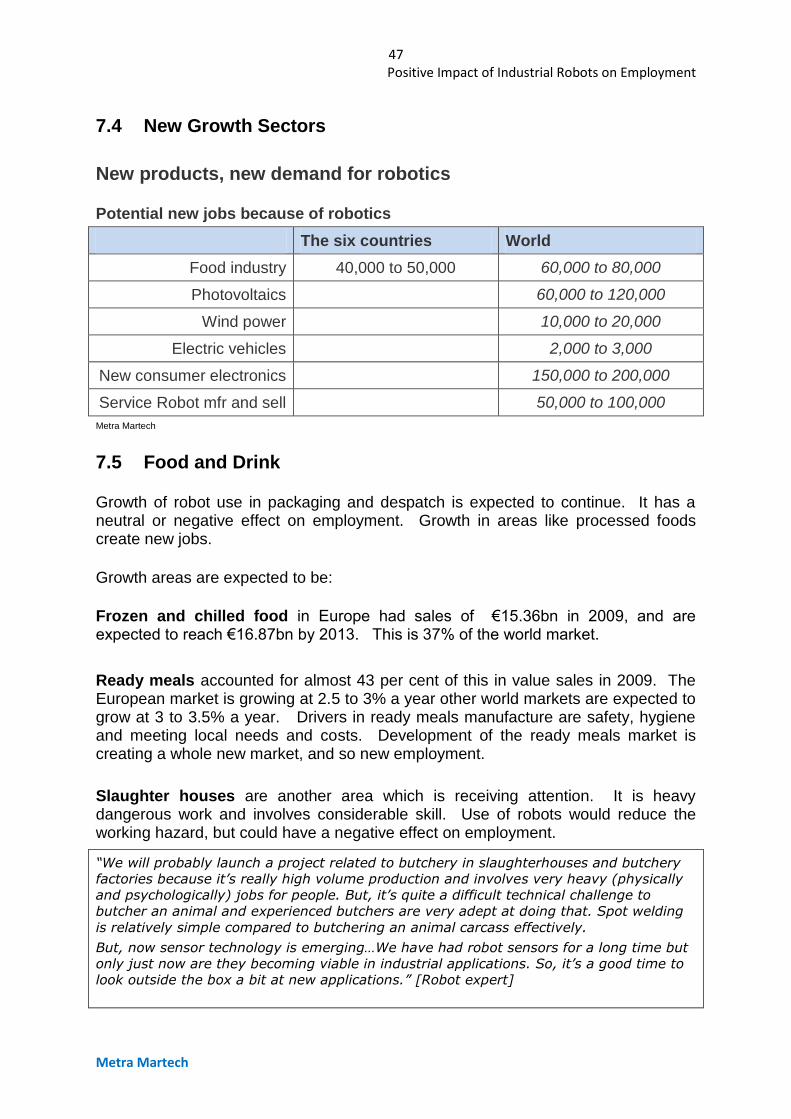
47 Positive Impact of Industrial Robots on Employment
Metra Martech
7.4 New Growth Sectors
New products, new demand for robotics
Potential new jobs because of robotics
The six countries World
Food industry 40,000 to 50,000 60,000 to 80,000
Photovoltaics 60,000 to 120,000
Wind power 10,000 to 20,000
Electric vehicles 2,000 to 3,000
New consumer electronics 150,000 to 200,000
Service Robot mfr and sell 50,000 to 100,000
Metra Martech
7.5 Food and Drink
Growth of robot use in packaging and despatch is expected to continue. It has a neutral or negative effect on employment. Growth in areas like processed foods create new jobs.
Growth areas are expected to be:
Frozen and chilled food in Europe had sales of €15.36bn in 2009, and are expected to reach €16.87bn by 2013. This is 37% of the world market.
Ready meals accounted for almost 43 per cent of this in value sales in 2009. The European market is growing at 2.5 to 3% a year other world markets are expected to grow at 3 to 3.5% a year. Drivers in ready meals manufacture are safety, hygiene and meeting local needs and costs. Development of the ready meals market is creating a whole new market, and so new employment.
Slaughter houses are another area which is receiving attention. It is heavy dangerous work and involves considerable skill. Use of robots would reduce the working hazard, but could have a negative effect on employment.
“We will probably launch a project related to butchery in slaughterhouses and butchery
factories because it’s really high volume production and involves very heavy (physically
and psychologically) jobs for people. But, it’s quite a difficult technical challenge to
butcher an animal and experienced butchers are very adept at doing that. Spot welding
is relatively simple compared to butchering an animal carcass effectively.
But, now sensor technology is emerging…We have had robot sensors for a long time but
only just now are they becoming viable in industrial applications. So, it’s a good time to
look outside the box a bit at new applications.” [Robot expert]
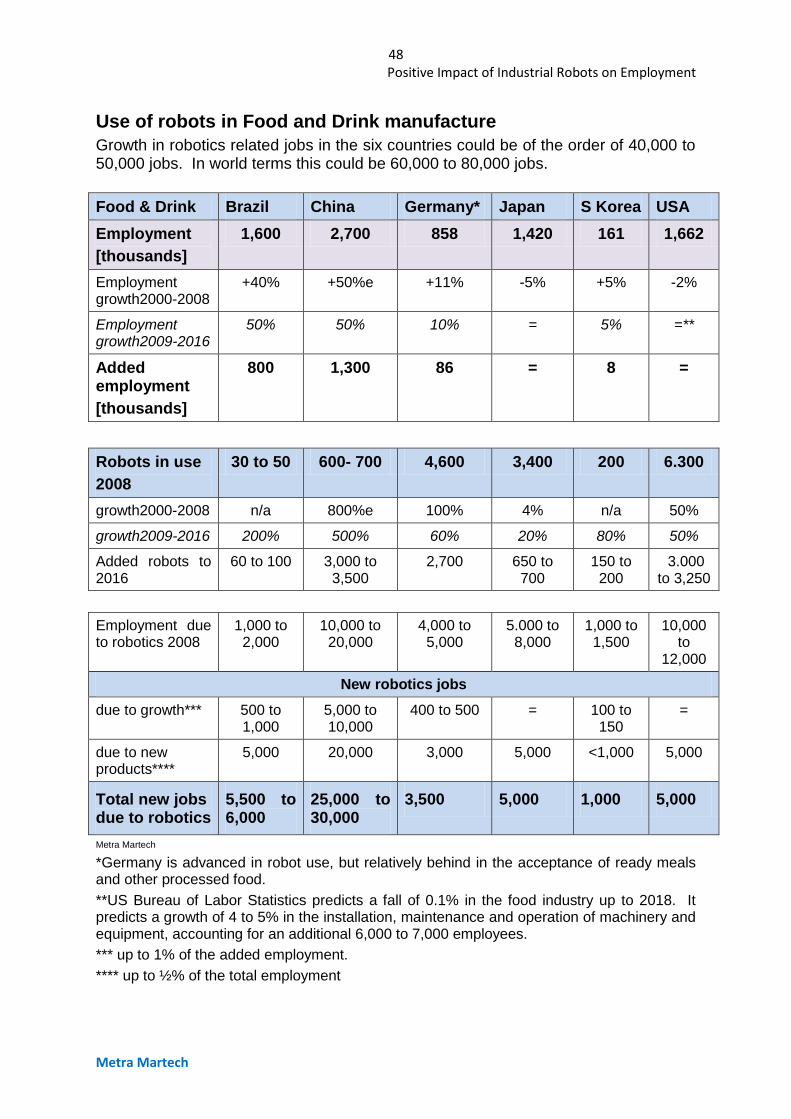
48 Positive Impact of Industrial Robots on Employment
Metra Martech
Use of robots in Food and Drink manufacture
Growth in robotics related jobs in the six countries could be of the order of 40,000 to 50,000 jobs. In world terms this could be 60,000 to 80,000 jobs.
Food & Drink Brazil China Germany* Japan S Korea USA
Employment
[thousands]
1,600 2,700 858 1,420 161 1,662
Employment growth2000-2008
+40% +50%e +11% -5% +5% -2%
Employment growth2009-2016
50% 50% 10% = 5% =**
Added employment
[thousands]
800 1,300 86 = 8 =
Robots in use
2008
30 to 50 600- 700 4,600 3,400 200 6.300
growth2000-2008 n/a 800%e 100% 4% n/a 50%
growth2009-2016 200% 500% 60% 20% 80% 50%
Added robots to 2016
60 to 100 3,000 to 3,500
2,700 650 to 700
150 to 200
3.000 to 3,250
Employment due to robotics 2008
1,000 to 2,000
10,000 to 20,000
4,000 to 5,000
5.000 to 8,000
1,000 to 1,500
10,000 to
12,000
New robotics jobs
due to growth*** 500 to 1,000
5,000 to 10,000
400 to 500 = 100 to 150
=
due to new products****
5,000 20,000 3,000 5,000 <1,000 5,000
Total new jobs due to robotics
5,500 to 6,000
25,000 to 30,000
3,500 5,000 1,000 5,000
Metra Martech
*Germany is advanced in robot use, but relatively behind in the acceptance of ready meals and other processed food.
**US Bureau of Labor Statistics predicts a fall of 0.1% in the food industry up to 2018. It predicts a growth of 4 to 5% in the installation, maintenance and operation of machinery and equipment, accounting for an additional 6,000 to 7,000 employees.
*** up to 1% of the added employment.
**** up to ½% of the total employment
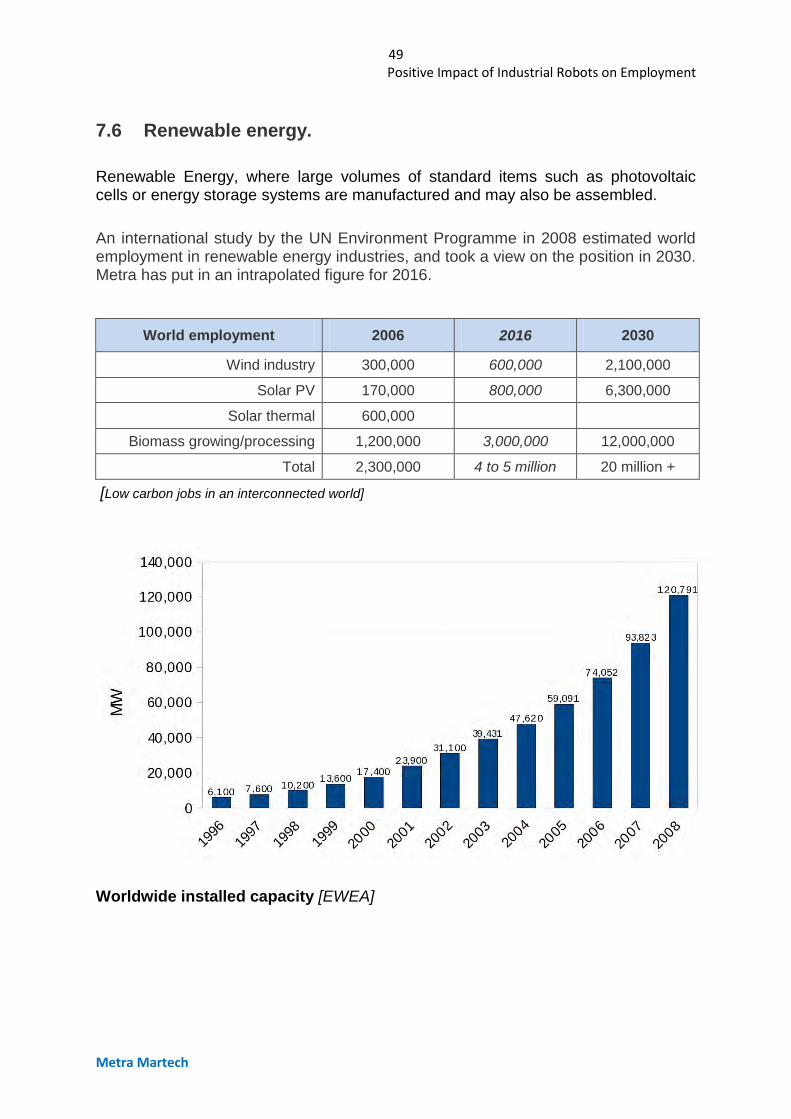
49 Positive Impact of Industrial Robots on Employment
Metra Martech
7.6 Renewable energy.
Renewable Energy, where large volumes of standard items such as photovoltaic cells or energy storage systems are manufactured and may also be assembled.
An international study by the UN Environment Programme in 2008 estimated world employment in renewable energy industries, and took a view on the position in 2030. Metra has put in an intrapolated figure for 2016.
World employment 2006 2016 2030
Wind industry 300,000 600,000 2,100,000
Solar PV 170,000 800,000 6,300,000
Solar thermal 600,000
Biomass growing/processing 1,200,000 3,000,000 12,000,000
Total 2,300,000 4 to 5 million 20 million +
[Low carbon jobs in an interconnected world]
Worldwide installed capacity [EWEA]
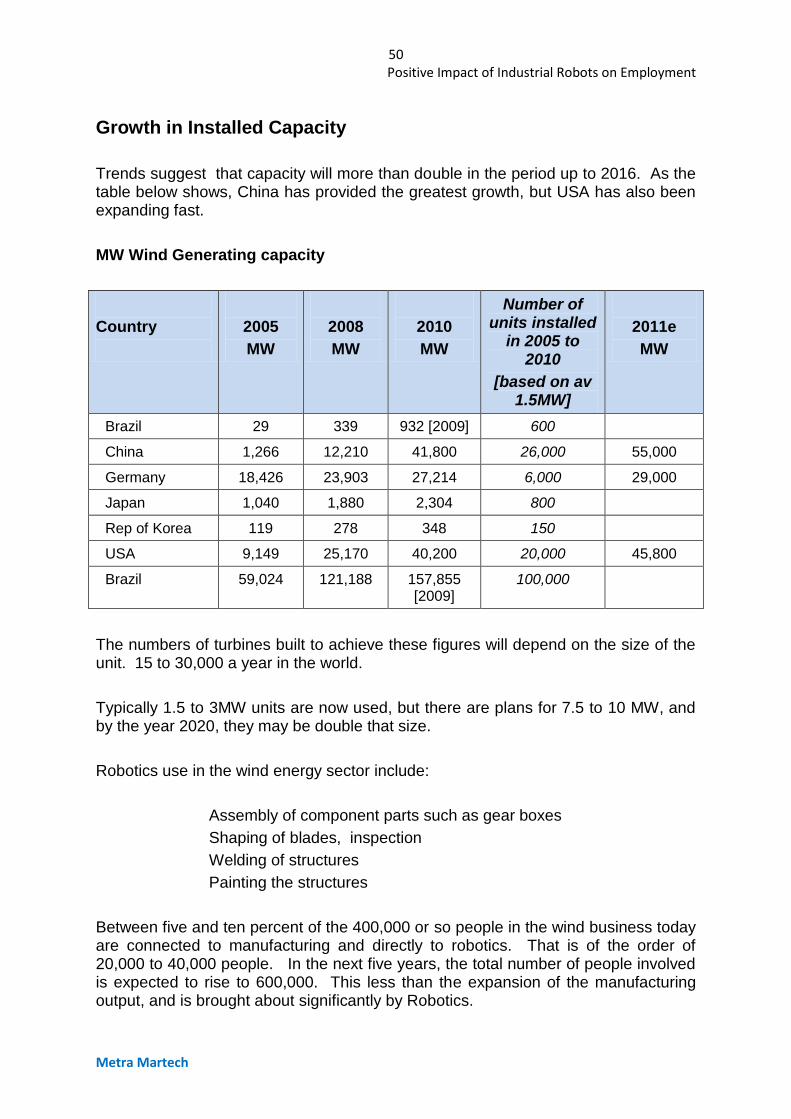
50 Positive Impact of Industrial Robots on Employment
Metra Martech
Growth in Installed Capacity
Trends suggest that capacity will more than double in the period up to 2016. As the table below shows, China has provided the greatest growth, but USA has also been expanding fast.
MW Wind Generating capacity
Country
2005
MW
2008
MW
2010
MW
Number of units installed
in 2005 to 2010
[based on av 1.5MW]
2011e
MW
Brazil 29 339 932 [2009] 600
China 1,266 12,210 41,800 26,000 55,000
Germany 18,426 23,903 27,214 6,000 29,000
Japan 1,040 1,880 2,304 800
Rep of Korea 119 278 348 150
USA 9,149 25,170 40,200 20,000 45,800
Brazil 59,024 121,188 157,855 [2009]
100,000
The numbers of turbines built to achieve these figures will depend on the size of the unit. 15 to 30,000 a year in the world.
Typically 1.5 to 3MW units are now used, but there are plans for 7.5 to 10 MW, and by the year 2020, they may be double that size.
Robotics use in the wind energy sector include:
Assembly of component parts such as gear boxes
Shaping of blades, inspection
Welding of structures
Painting the structures
Between five and ten percent of the 400,000 or so people in the wind business today are connected to manufacturing and directly to robotics. That is of the order of 20,000 to 40,000 people. In the next five years, the total number of people involved is expected to rise to 600,000. This less than the expansion of the manufacturing output, and is brought about significantly by Robotics.
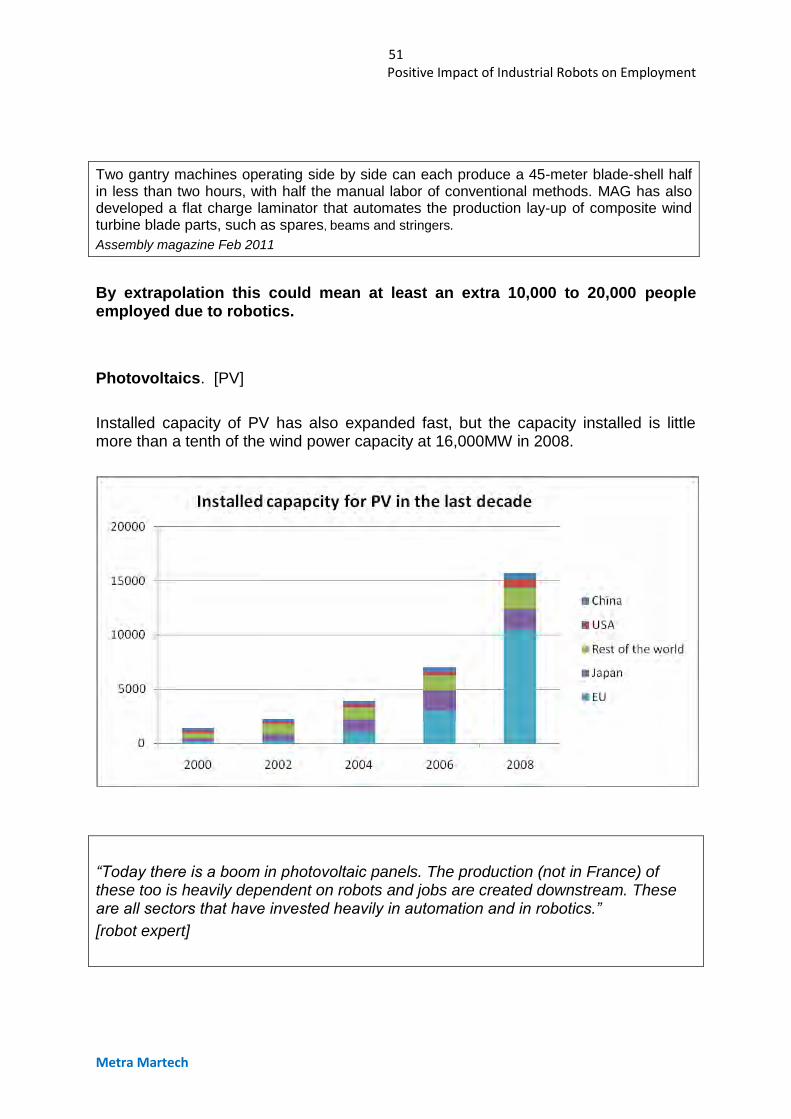
51 Positive Impact of Industrial Robots on Employment
Metra Martech
Two gantry machines operating side by side can each produce a 45-meter blade-shell half in less than two hours, with half the manual labor of conventional methods. MAG has also developed a flat charge laminator that automates the production lay-up of composite wind turbine blade parts, such as spares, beams and stringers.
Assembly magazine Feb 2011
By extrapolation this could mean at least an extra 10,000 to 20,000 people employed due to robotics.
Photovoltaics. [PV]
Installed capacity of PV has also expanded fast, but the capacity installed is little more than a tenth of the wind power capacity at 16,000MW in 2008.
“Today there is a boom in photovoltaic panels. The production (not in France) of these too is heavily dependent on robots and jobs are created downstream. These are all sectors that have invested heavily in automation and in robotics.”
[robot expert]
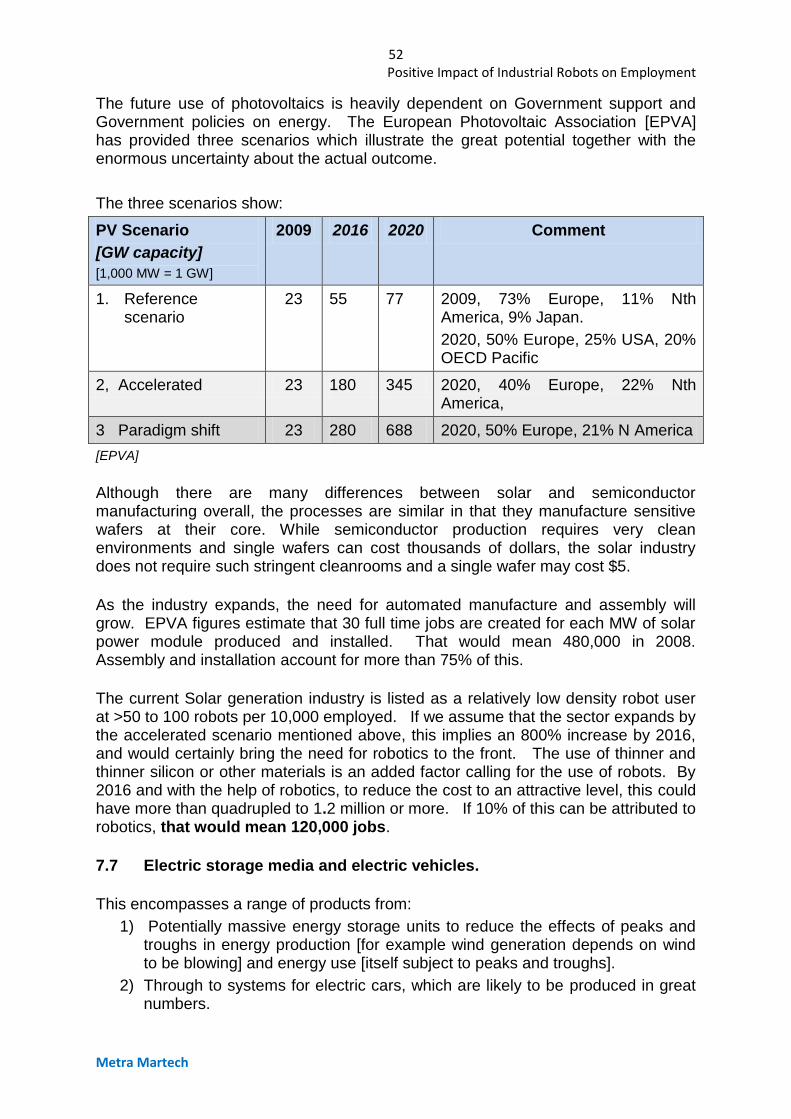
52 Positive Impact of Industrial Robots on Employment
Metra Martech
The future use of photovoltaics is heavily dependent on Government support and Government policies on energy. The European Photovoltaic Association [EPVA] has provided three scenarios which illustrate the great potential together with the enormous uncertainty about the actual outcome.
The three scenarios show:
PV Scenario
[GW capacity]
[1,000 MW = 1 GW]
2009 2016 2020 Comment
1. Reference scenario
23 55 77 2009, 73% Europe, 11% Nth America, 9% Japan.
2020, 50% Europe, 25% USA, 20% OECD Pacific
2, Accelerated 23 180 345 2020, 40% Europe, 22% Nth America,
3 Paradigm shift 23 280 688 2020, 50% Europe, 21% N America
[EPVA]
Although there are many differences between solar and semiconductor manufacturing overall, the processes are similar in that they manufacture sensitive wafers at their core. While semiconductor production requires very clean environments and single wafers can cost thousands of dollars, the solar industry does not require such stringent cleanrooms and a single wafer may cost $5.
As the industry expands, the need for automated manufacture and assembly will grow. EPVA figures estimate that 30 full time jobs are created for each MW of solar power module produced and installed. That would mean 480,000 in 2008. Assembly and installation account for more than 75% of this.
The current Solar generation industry is listed as a relatively low density robot user at >50 to 100 robots per 10,000 employed. If we assume that the sector expands by the accelerated scenario mentioned above, this implies an 800% increase by 2016, and would certainly bring the need for robotics to the front. The use of thinner and thinner silicon or other materials is an added factor calling for the use of robots. By 2016 and with the help of robotics, to reduce the cost to an attractive level, this could have more than quadrupled to 1.2 million or more. If 10% of this can be attributed to robotics, that would mean 120,000 jobs.
7.7 Electric storage media and electric vehicles.
This encompasses a range of products from:
1) Potentially massive energy storage units to reduce the effects of peaks and troughs in energy production [for example wind generation depends on wind to be blowing] and energy use [itself subject to peaks and troughs].
2) Through to systems for electric cars, which are likely to be produced in great numbers.
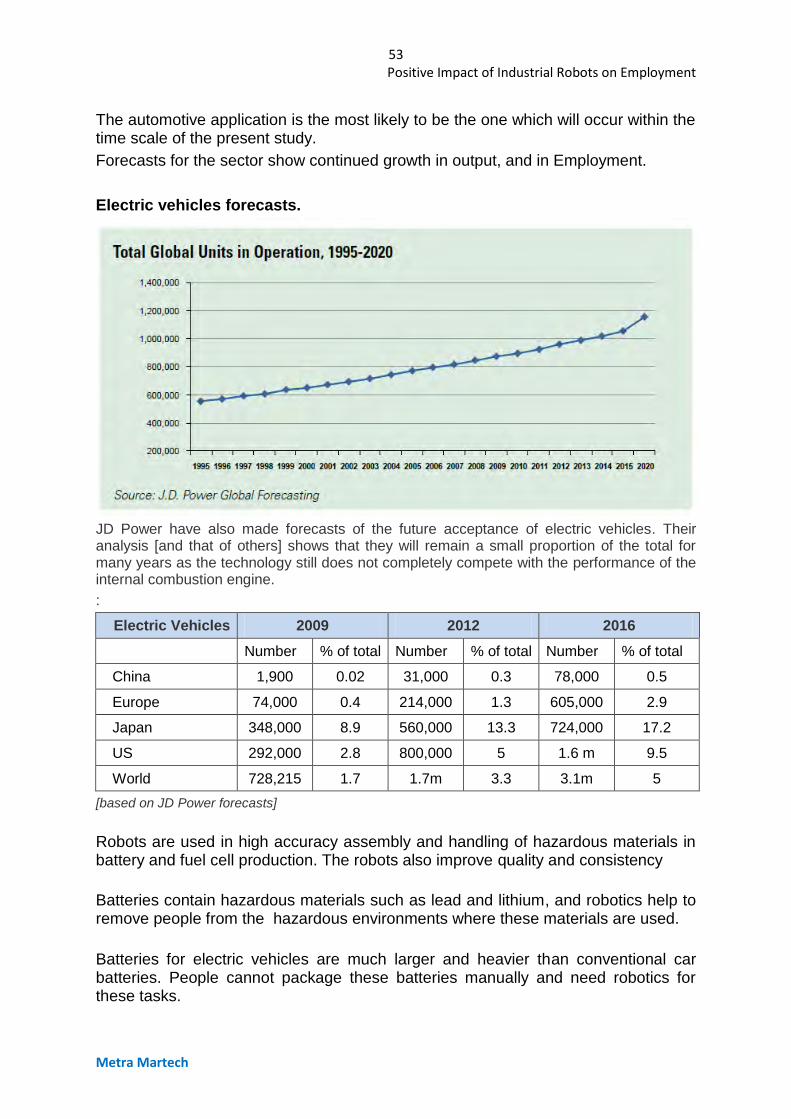
53 Positive Impact of Industrial Robots on Employment
Metra Martech
The automotive application is the most likely to be the one which will occur within the time scale of the present study.
Forecasts for the sector show continued growth in output, and in Employment.
Electric vehicles forecasts.
JD Power have also made forecasts of the future acceptance of electric vehicles. Their analysis [and that of others] shows that they will remain a small proportion of the total for many years as the technology still does not completely compete with the performance of the internal combustion engine.
:
Electric Vehicles 2009 2012 2016
Number % of total Number % of total Number % of total
China 1,900 0.02 31,000 0.3 78,000 0.5
Europe 74,000 0.4 214,000 1.3 605,000 2.9
Japan 348,000 8.9 560,000 13.3 724,000 17.2
US 292,000 2.8 800,000 5 1.6 m 9.5
World 728,215 1.7 1.7m 3.3 3.1m 5
[based on JD Power forecasts]
Robots are used in high accuracy assembly and handling of hazardous materials in battery and fuel cell production. The robots also improve quality and consistency
Batteries contain hazardous materials such as lead and lithium, and robotics help to remove people from the hazardous environments where these materials are used.
Batteries for electric vehicles are much larger and heavier than conventional car batteries. People cannot package these batteries manually and need robotics for these tasks.
54 Positive Impact of Industrial Robots on Employment
Metra Martech
Currently Lithium ion batteries are the preferred type, but their manufactured cost needs to be greatly reduced. The opportunity identified by Paul Kellett of AIA is for increased use of vision systems. [The Electric Car Of The Future, AIA 2009]
One of the other prospects here, is that cars may have batteries replaced rather than re-charged [this is still being widely debated]. This saves the user hours of re-charging, It also means that there will be more than twice as many of these large battery sets in circulation than is the case with the conventional car battery.
There is likely to be a whole new set of service station facilities to cope with these battery changes or charging requirements.
Hybrid vehicles require a high voltage battery of about 150V, which is currently provided by connecting nickel-metal-hydride cells in series.
Worldwide, employment in the automotive battery industry is believed to be of the order of 25,000. VB Autobatterie in Europe has an output of 4 million+ batteries a year, six plants and employs 2,400 people [about 1,600 batteries per person a year, selling at $100]. This is a turnover of $160,000 per employee. Now part of the Johnsons Controls group, it is the largest supplier of automotive batteries in Europe.
Coda in USA, planning a new Lithium ion battery plant for automotive applications is reported to be planning an initial output of 20,000 battery sets a year, with 1,000 employees, [20 battery sets a year per person], but each set can cost the user $10,000. The turnover per employee is $200,000.
The cost per battery pack can be broken into two parts – the batteries themselves and the pack. The pack costs can be trimmed considerably with mass-manufacturing. Instead of hand assembling each battery pack and set of battery modules (a series of cells), semi-automated assembly can increase the throughput of the teams assembling dramatically while keeping the same number of people around, reducing the amount of employee-hours spent per battery pack.
The cell costs don’t come down as easily.
The introduction of electric vehicles is likely to increase the number of robots used, and to affect overall employment, adding at least 10% or 2,000 to 3,000.
It is too early to say how many employees will be added downstream, until accepted standards for charging or replacement are agreed.
Fuel cells
Forecasts in this area are varied, the general position seems that the future is heavily dependent on further research, and also on the cost of the Lithium or Platinum components. A great deal of research money is being spent on the subject for military as well as transport applications.
55 Positive Impact of Industrial Robots on Employment
Metra Martech
The general position appears to be that of the order of 75,000 units were shipped in 2009 [world], but very high growth rates are expected. One forecast expects the growth to be 75% a year for the next few years. Another expects output to double by 2014. This is still small compared to the potential market of tens of millions.
Raw materials are a prime cost, but reduction of production costs is clearly important and when the breakthrough occurs Robotics and the employment which goes with it will be significant.
7.8 The growth of service robotics as a new industry
The next generation of service robots will be used in industry, but some are forecast to become “Consumer products”. This implies major new manufacturing activity. As quantities will be large, and precision and consistency are critical, this new manufacturing is going to need robotics. Alongside this is the employment of a whole new workforce.
RIA note
“As stated by the US Roadmap, “Robotics technology has historically been defined by the automotive sector and driven by price and the need to automate specific tasks particular to large volume manufacturing. The new economy is much less focused on mass manufacturing, however, and more concentrated on producing customized products.
The model company is no longer a large entity such as GM, Chrysler, or Ford but small and medium sized enterprises…. The need in such an economy is far more dependent on higher degrees of adaptation, ease of use, and other factors that enable small runs of made-to-order products.”
According to the European Roadmap, the future of robotics will be one of much greater ubiquity. Miniaturization and new sensing capabilities will mean that robotics is used in an increasing number of industries, including those with small and varying lot sizes, materials and product geometries.
Robotics will make great inroads in service industries, especially healthcare where an aging population will require support services, for which human care givers will be too few in number to provide.
Robots will likewise play an important role in transportation and in the provision of home services. Robots will also help protect homes and offices, secure borders and monitor the environment in both routine and emergency operations. Finally, robots will perform key roles in both manned and unmanned space missions.” [Robot Industries Association]
56 Positive Impact of Industrial Robots on Employment
Metra Martech
Extract from World Robotics 2010 It is estimated that today more than 200 product ideas, demonstrators, prototypes and products in service robotics are documented for almost any kind of tasks. Even though most ideas have already been introduced, there is still an abundance of specific product opportunities to be taken up by companies. Service robots provide mobility, functionality and multi-media possibilities in all areas of daily life: at home, at work, in public environments, and in remote locations such as deep sea, battlefields and space. In the recent past, experts have seriously discussed the possibilities of emulating the success of the personal computer with the goal of creating a personal robot that would assist individuals in their daily lives. Even though these robot companions or assistants offer up the prospect of appealing to a mass market, it is felt that the required technological progress, attractive product designs and lowcost manufacturing pose significant challenges and may make this idea more of a long-term project that will not reach full maturity before the year 2020. However, a number of efforts, ranging from internationally funded research initiatives through providing platforms for robot companions for advanced research to engaging in ambitious competitions such as RoboCup@home,5 are clearly geared towards addressing the numerous technological challenges on the way to providing dependable personal robots for assisting in everyday tasks. As the statistics demonstrate, today’s service robot market is composed of many niche products for professional services and a few high-volume applications in the domestic environment. Pioneers in the field of service robotics stress the serious opportunities for new companies entering this growth market with innovative products beyond the occasional robotics hype. [IFR]

57 Positive Impact of Industrial Robots on Employment
Metra Martech
8. COUNTRY PROFILES
The tables which follow provide a summary of the current situation for each of the countries.
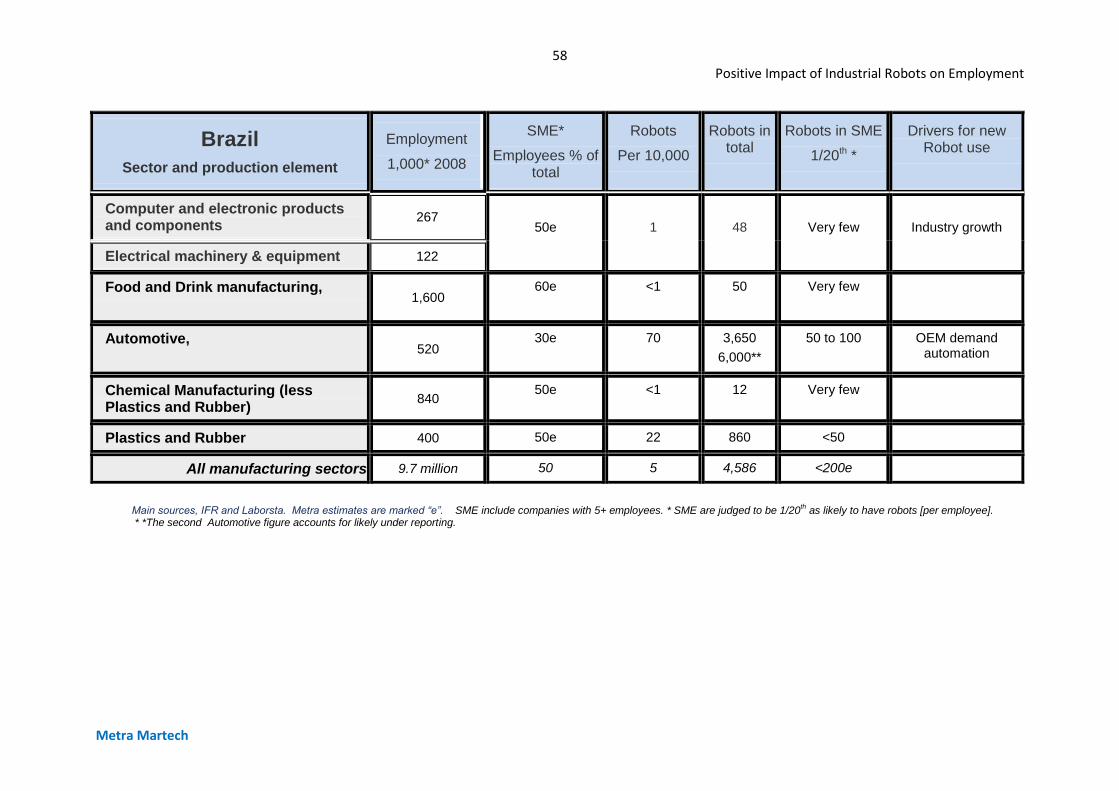
58 Positive Impact of Industrial Robots on Employment
Metra Martech
Brazil
Sector and production element
Employment
1,000* 2008
SME*
Employees % of total
Robots
Per 10,000
Robots in total
Robots in SME
1/20th *
Drivers for new Robot use
Computer and electronic products and components
267
50e
1
48
Very few
Industry growth
Electrical machinery & equipment 122
Food and Drink manufacturing,
1,600
60e <1 50 Very few
Automotive,
520
30e 70 3,650
6,000**
50 to 100 OEM demand automation
Chemical Manufacturing (less Plastics and Rubber)
840 50e <1 12 Very few
Plastics and Rubber 400 50e 22 860 <50
All manufacturing sectors 9.7 million 50 5 4,586 <200e
Main sources, IFR and Laborsta. Metra estimates are marked “e”. SME include companies with 5+ employees. * SME are judged to be 1/20th as likely to have robots [per employee].
* *The second Automotive figure accounts for likely under reporting.
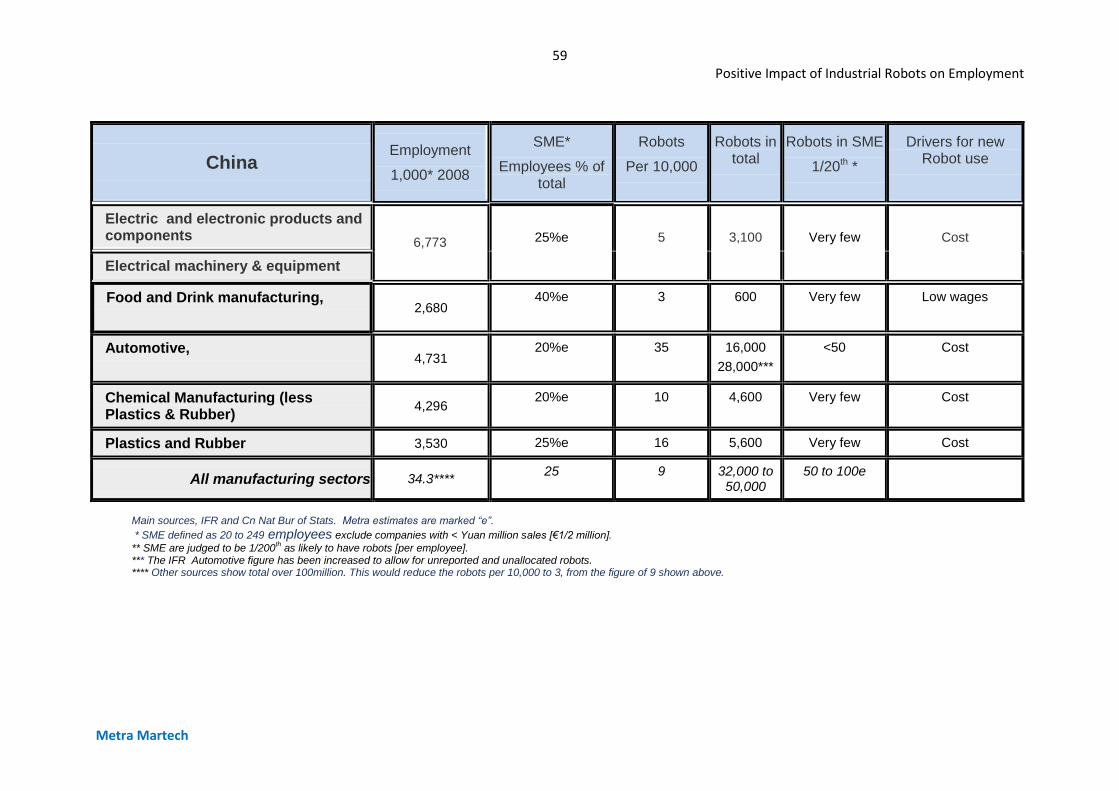
59 Positive Impact of Industrial Robots on Employment
Metra Martech
China Employment
1,000* 2008
SME*
Employees % of total
Robots
Per 10,000
Robots in total
Robots in SME
1/20th *
Drivers for new Robot use
Electric and electronic products and components
6,773
25%e
5
3,100
Very few
Cost
Electrical machinery & equipment
Food and Drink manufacturing,
2,680
40%e 3 600 Very few Low wages
Automotive,
4,731
20%e 35 16,000
28,000***
<50 Cost
Chemical Manufacturing (less Plastics & Rubber)
4,296 20%e 10 4,600 Very few Cost
Plastics and Rubber 3,530 25%e 16 5,600 Very few Cost
All manufacturing sectors 34.3**** 25 9 32,000 to
50,000 50 to 100e
Main sources, IFR and Cn Nat Bur of Stats. Metra estimates are marked “e”.
* SME defined as 20 to 249 employees exclude companies with < Yuan million sales [€1/2 million].
** SME are judged to be 1/200th as likely to have robots [per employee].
*** The IFR Automotive figure has been increased to allow for unreported and unallocated robots. **** Other sources show total over 100million. This would reduce the robots per 10,000 to 3, from the figure of 9 shown above.
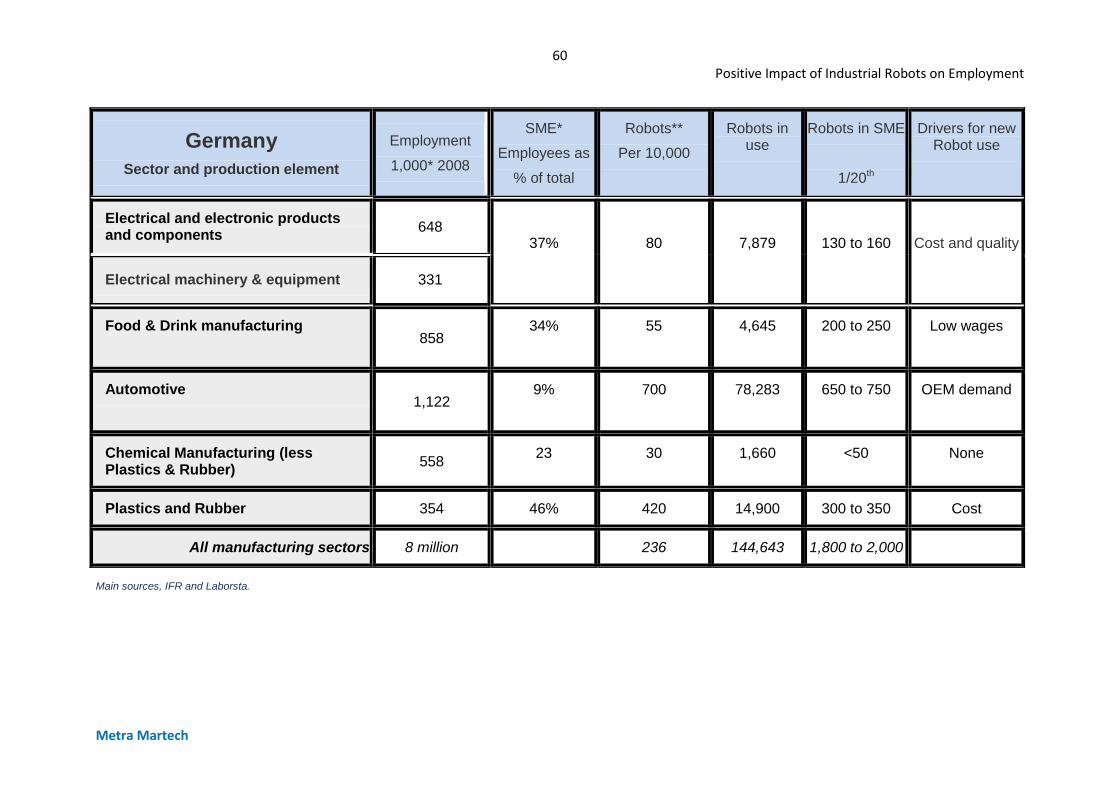
60 Positive Impact of Industrial Robots on Employment
Metra Martech
Germany
Sector and production element
Employment
1,000* 2008
SME*
Employees as
% of total
Robots**
Per 10,000
Robots in use
Robots in SME
1/20th
Drivers for new Robot use
Electrical and electronic products and components
648
37%
80
7,879
130 to 160
Cost and quality
Electrical machinery & equipment 331
Food & Drink manufacturing
858
34% 55 4,645 200 to 250 Low wages
Automotive
1,122
9% 700 78,283 650 to 750 OEM demand
Chemical Manufacturing (less Plastics & Rubber)
558 23 30 1,660 <50 None
Plastics and Rubber 354 46% 420 14,900 300 to 350 Cost
All manufacturing sectors 8 million 236 144,643 1,800 to 2,000
Main sources, IFR and Laborsta.
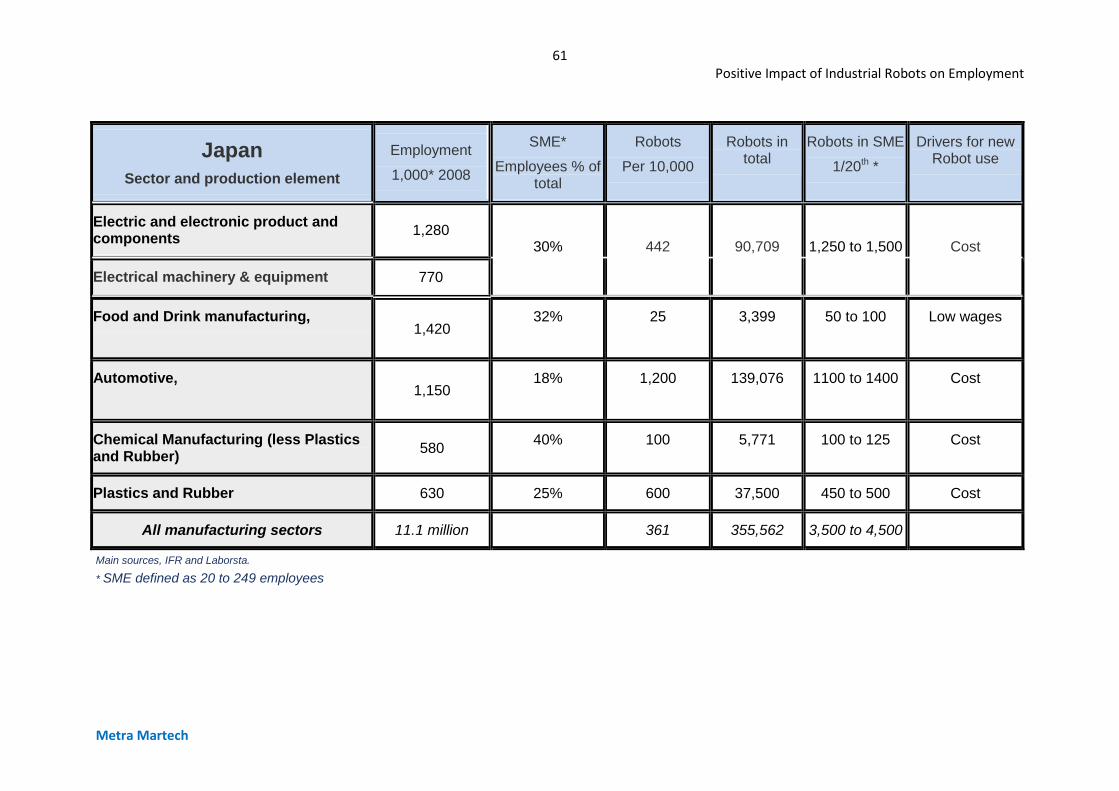
61 Positive Impact of Industrial Robots on Employment
Metra Martech
Japan
Sector and production element
Employment
1,000* 2008
SME*
Employees % of total
Robots
Per 10,000
Robots in total
Robots in SME
1/20th *
Drivers for new Robot use
Electric and electronic product and components
1,280
30%
442
90,709
1,250 to 1,500
Cost
Electrical machinery & equipment 770
Food and Drink manufacturing,
1,420
32% 25 3,399 50 to 100 Low wages
Automotive,
1,150
18% 1,200 139,076 1100 to 1400 Cost
Chemical Manufacturing (less Plastics and Rubber)
580 40% 100 5,771 100 to 125 Cost
Plastics and Rubber 630 25% 600 37,500 450 to 500 Cost
All manufacturing sectors 11.1 million 361 355,562 3,500 to 4,500
Main sources, IFR and Laborsta.
* SME defined as 20 to 249 employees
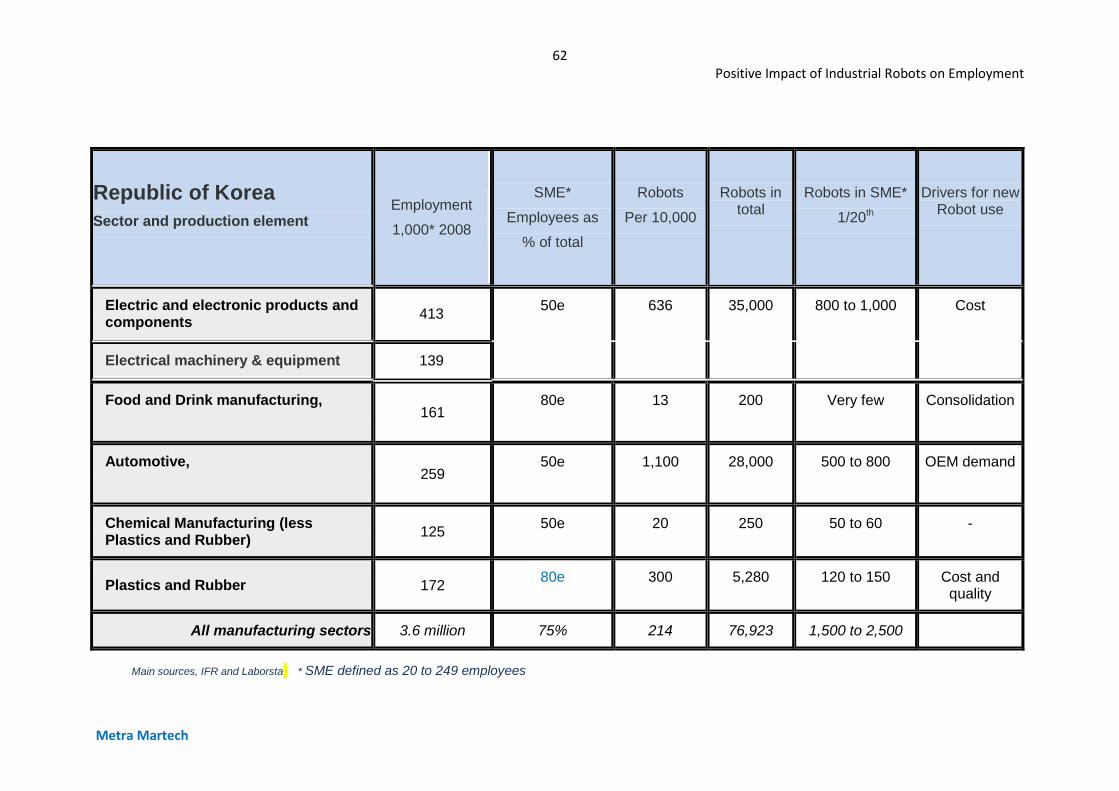
62 Positive Impact of Industrial Robots on Employment
Metra Martech
Republic of Korea
Sector and production element
Employment
1,000* 2008
SME*
Employees as
% of total
Robots
Per 10,000
Robots in total
Robots in SME*
1/20th
Drivers for new Robot use
Electric and electronic products and components
413 50e 636 35,000 800 to 1,000 Cost
Electrical machinery & equipment 139
Food and Drink manufacturing,
161
80e 13 200 Very few Consolidation
Automotive,
259
50e 1,100 28,000 500 to 800 OEM demand
Chemical Manufacturing (less Plastics and Rubber)
125 50e 20 250 50 to 60 -
Plastics and Rubber 172 80e 300 5,280 120 to 150 Cost and
quality
All manufacturing sectors 3.6 million 75% 214 76,923 1,500 to 2,500
Main sources, IFR and Laborsta * SME defined as 20 to 249 employees
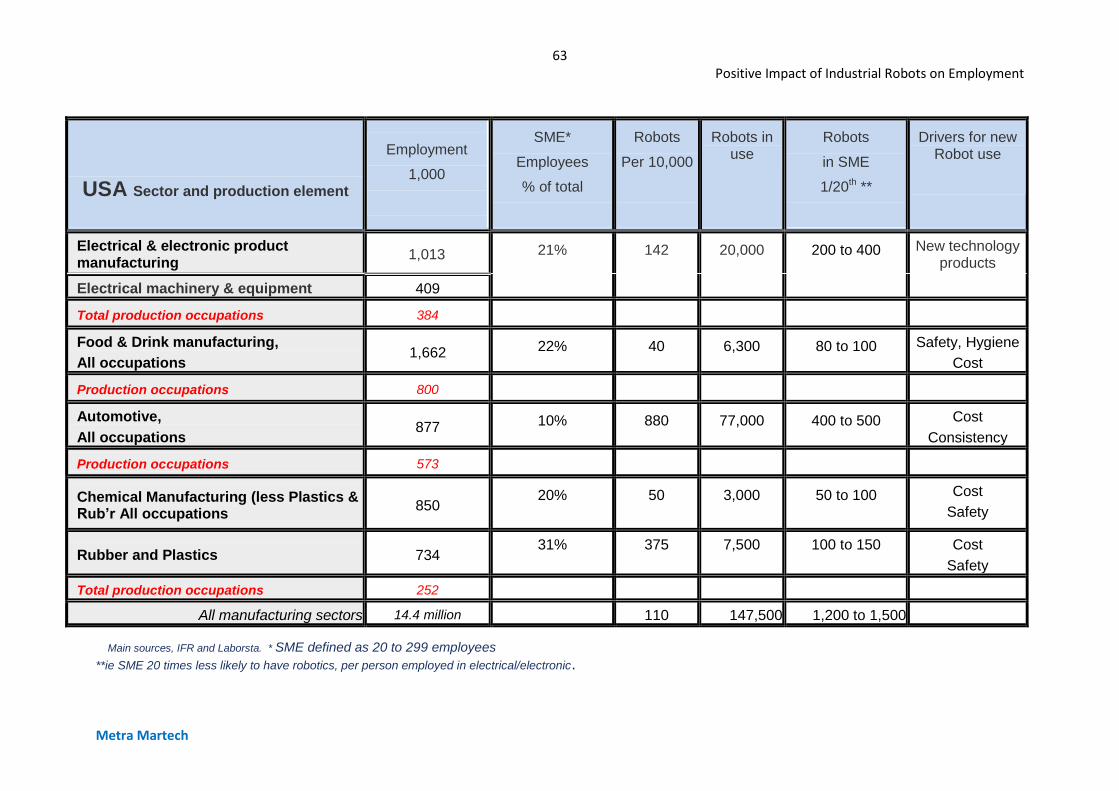
63 Positive Impact of Industrial Robots on Employment
Metra Martech
USA Sector and production element
Employment
1,000
SME*
Employees
% of total
Robots
Per 10,000
Robots in use
Robots
in SME
1/20th **
Drivers for new Robot use
Electrical & electronic product manufacturing
1,013 21% 142 20,000 200 to 400 New technology products
Electrical machinery & equipment 409
Total production occupations 384
Food & Drink manufacturing,
All occupations 1,662 22% 40 6,300 80 to 100 Safety, Hygiene
Cost
Production occupations 800
Automotive,
All occupations 877 10% 880 77,000 400 to 500 Cost
Consistency
Production occupations 573
Chemical Manufacturing (less Plastics & Rub’r All occupations
850 20%
50
3,000 50 to 100 Cost
Safety
Rubber and Plastics 734 31% 375 7,500 100 to 150 Cost
Safety
Total production occupations 252
All manufacturing sectors 14.4 million 110 147,500 1,200 to 1,500
Main sources, IFR and Laborsta. * SME defined as 20 to 299 employees
**ie SME 20 times less likely to have robotics, per person employed in electrical/electronic.
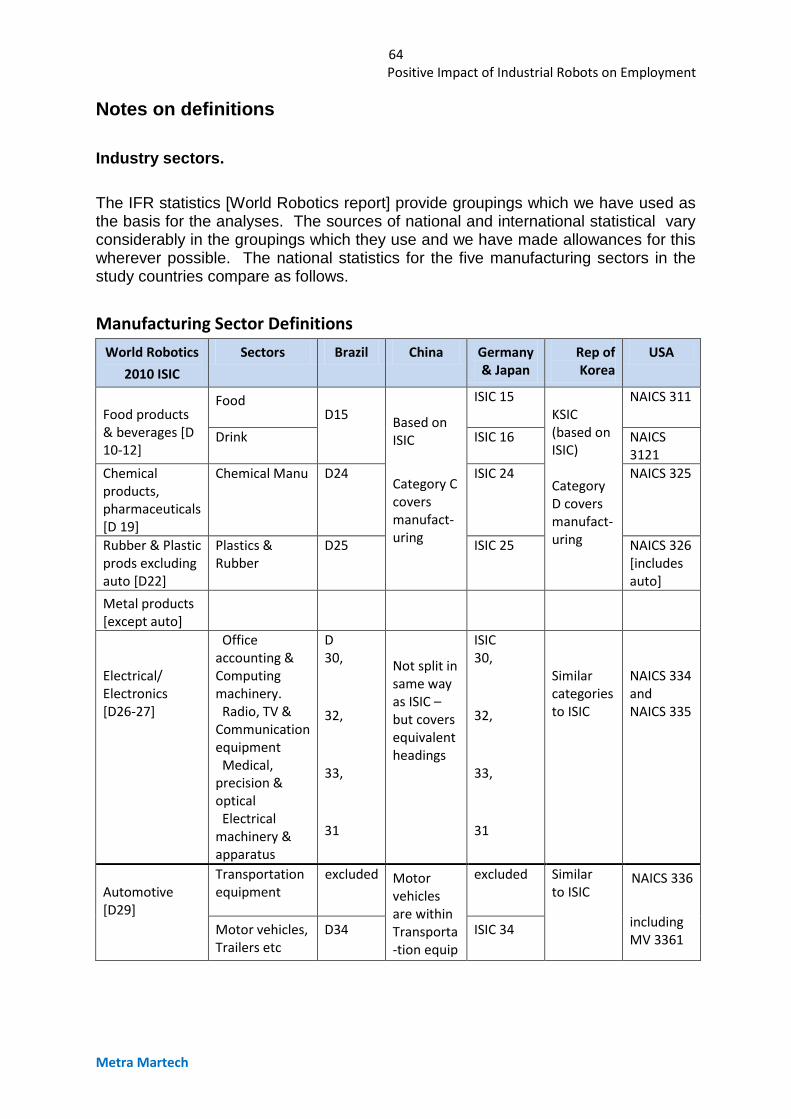
64 Positive Impact of Industrial Robots on Employment
Metra Martech
Notes on definitions
Industry sectors.
The IFR statistics [World Robotics report] provide groupings which we have used as the basis for the analyses. The sources of national and international statistical vary considerably in the groupings which they use and we have made allowances for this wherever possible. The national statistics for the five manufacturing sectors in the study countries compare as follows.
Manufacturing Sector Definitions
World Robotics
2010 ISIC
Sectors Brazil China Germany & Japan
Rep of Korea
USA
Food products & beverages [D 10-12]
Food
D15
Based on ISIC
Category C covers manufact-uring
ISIC 15 KSIC (based on ISIC) Category D covers manufact-uring
NAICS 311
Drink ISIC 16 NAICS 3121
Chemical products, pharmaceuticals [D 19]
Chemical Manu D24 ISIC 24 NAICS 325
Rubber & Plastic prods excluding auto [D22]
Plastics & Rubber
D25 ISIC 25 NAICS 326 [includes auto]
Metal products [except auto]
Electrical/ Electronics [D26-27]
Office accounting & Computing machinery. Radio, TV & Communication equipment Medical, precision & optical Electrical machinery & apparatus
D 30,
32,
33,
31
Not split in same way as ISIC – but covers equivalent headings
ISIC 30,
32,
33,
31
Similar categories to ISIC
NAICS 334 and NAICS 335
Automotive [D29]
Transportation equipment
excluded Motor vehicles are within Transporta-tion equip
excluded Similar to ISIC
NAICS 336
including MV 3361
Motor vehicles, Trailers etc
D34 ISIC 34
65 Positive Impact of Industrial Robots on Employment
Metra Martech
Definition of Industrial Robots
[provided by IFR]
The annual surveys carried out by IFR focus on the collection of yearly statistics on the production, imports, exports and domestic installations/shipments of
multipurpose manipulating industrial robots with at least three or more axes A robot which has its own control system and is not controlled by the machine should be included in the statistics, although it may be dedicated for a special machine. Other dedicated industrial robots should not be included in the statistics. •Wafer handlers have their own control system and should be included in the statistics of industrial robots. Wafers handlers can be articulated, cartesian, cylindrical or Scara robots. Irrespective from the type of robots they are reported in the application “cleanroom for semiconductors”. •Flat panel handlers also should be included. Mainly they are articulated robots. Irrespective from the type of robots they are reported in the application “cleanroom for FPD”. Examples of dedicated industrial robots not included in the international survey are:
• Equipment dedicated for loading/unloading of machine tools (see figure I.3).
• Dedicated assembly equipment, e.g. for assembly on printed circuit boards
• Integrated Circuit Handlers (pick and place)
• Automated storage and retrieval systems
• Automated guided vehicles (AGVs)

66 Positive Impact of Industrial Robots on Employment
Metra Martech
.
METRA MARTECH Limited
7 Chiswick High Road London W4 2ND
Tel: +44 (0) 20 8742 7888 Fax: +44 (0) 20 8742 8558
email: [email protected]
http://www.metra-martech.com/


![Positive Impact of Industrial Robots on Employment by Metra Martech [Feb. 2013]](https://img.pdfslide.net/doc/110x75/568bd8e41a28ab2034a50937/positive-impact-of-industrial-robots-on-employment-by-metra-martech-feb-2013.jpg)