Embed Size (px)
Citation preview

Journal of Sustainable Architecture and Civil Engineering 2021/1/2880
*Corresponding author: [email protected]
Possibilities of Using Building Information Model Data in Reinforcement Processing PlantReceived
2020/07/14
Accepted after revision 2021/05/19
Journal of Sustainable Architecture and Civil EngineeringVol. 1 / No. 28 / 2021pp. 80-93DOI 10.5755/j01.sace.28.1.27593
Possibilities of Using Building Information Model Data in Reinforcement Processing Plant
JSACE 1/28
http://dx.doi.org/10.5755/j01.sace.28.1.27593
Darius Pupeikis* Mindaugas Daukšys, Arūnas Aleksandras NavickasKaunas University of Technology, Faculty of Civil Engineering and Architecture, Studentų st. 48, LT-51367 Kaunas, Lithuania
Lina MorkūnaitėAalborg University, Department of Built Environment, Thomas Manns Vej 23, 9220 Aalborg Ø, Denmark
Svajūnas AbromasJSC “Serfas”, Technikos str. 7C, LT-51209 Kaunas, Lithuania
Introduction
While the AEC industry is moving towards digitalization off-site rebar prefabrication became a common practice. Now most companies use a long-established standard order processing method, where the customer submits 2D paper or PDF-based drawings. Subsequently, the manufacturers are obligated to make additional detailing, redrawing, calculations, and preparation of other required information for manufacturing. Thus, in this typical scenario, there is a great repetition of the same tasks, with the obvious loss of time and increased likelihood of human error. However, improvements can be made by the application of advanced digital production workflow and the use of open BIM standards (e.g., IFC, XML, BVBS). Therefore, this paper presents the typical data flow algorithm in contrast to the automated data flow for reinforcement manufacturing. Further, the two approaches are compared and analyzed based on Multi-Criteria Decision Making (MCDM) methods. The results have shown promising prospects for companies willing to automate their data flow processes by the use of 3D drawings and digital data from the BIM model in their plants.
Keywords: BVBS, IFC, machine-readable data, reinforcement.
Building Information Modelling (BIM) technologies are meant to facilitate not only design but also all the life-cycle stages of the project. Thus, the use of production raw materials and time to manufacture final products can be optimized by using BIM data. To reach this goal, the producers of construction raw materials need to build their product libraries (Hamid et al., 2018) using ma-chine-readable data standards intended for the whole supply chain (Zhong et al., 2017). This would allow the manufacturers to link their products to the price, pre-inspection (Martinez et al., 2019), sustainability factors, technical specifications, etc. In that way, the customers could immediately get information on how much the specific construction products would cost or technically influ-ence the project. This will save the customers and manufacturers time to bid, make decisions or solve issues (Maciel and Corrêa 2017). Using information from the BIM platform, the customers could receive their orders much faster and with less chance of error (Xu et al., 2020).
81Journal of Sustainable Architecture and Civil Engineering 2021/1/28
However, the shift to using BIM in manufacturing requires additional training of personnel and the recruitment of new specialists to perform programming of the production equipment and custom-ization of BIM data (Piroozfar et al., 2019, Ignatova et al., 2018). Also, companies need to upgrade their manufacturing equipment to be able to take full advantage of BIM capabilities (Abanda et al., 2017, Lee et al., 2019). Though, following the experience of other countries, it is highly recommend-ed to introduce BIM into manufacturing (Wang et al., 2018), as in the future, plants that are incapable to work innovatively, will start to lose orders and customers. There are many ways how BIM tech-nology could facilitate manufacturing. Yet, the main benefits come from the 3D model and the pos-sibility to automatically generate 2D drawings, which are more detailed and gives a complete view of the designed products (Nath et al., 2015, Cho et al., 2014, Yanga et al., 2020). That being said, 3D models help to reduce errors during product assembly while saving time and cost (Yuan et al., 2018).
To ensure the usability of BIM, it is significant to analyze the data standards compatible with man-ufacturing machinery (Liu et al., 2021, Kouhestani and Nik-Bakht 2020), such as BVBS (Bundes-Vereinigung der Bausoftware), XML, or IFC (Industry Foundation Classes). The BVBS standard is widely used for CNC (Computer Numerically Controlled) bending and cutting machines, and it is a
2
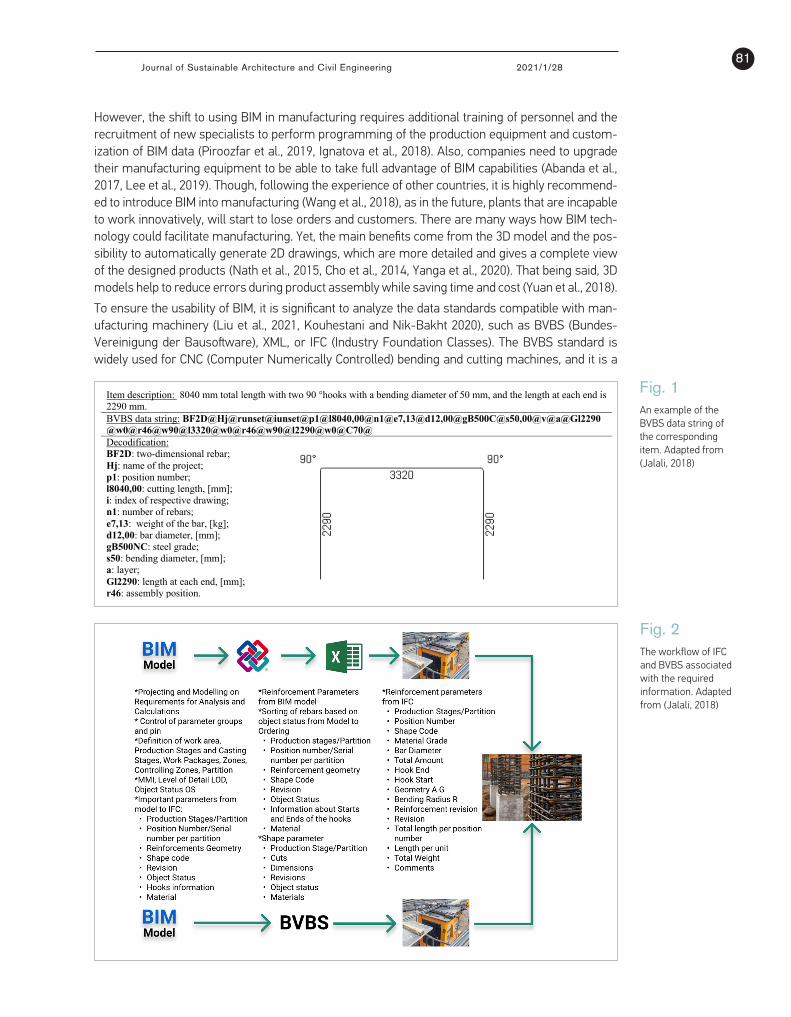
Item description: 8040 mm total length with two 90 °hooks with a bending diameter of 50 mm, and the length at each end is 2290 mm. BVBS data string: BF2D@Hj@runset@iunset@p1@l8040,00@n1@e7,13@d12,00@gB500C@s50,00@v@a@Gl2290 @w0@r46@w90@l3320@w0@r46@w90@l2290@w0@C70@ Decodification: BF2D: two-dimensional rebar; Hj: name of the project; p1: position number; l8040,00: cutting length, [mm]; i: index of respective drawing; n1: number of rebars; e7,13: weight of the bar, [kg]; d12,00: bar diameter, [mm]; gB500NC: steel grade; s50: bending diameter, [mm]; a: layer; Gl2290: length at each end, [mm]; r46: assembly position.
Fig. 1An example of the BVBS data string of the corresponding item. Adapted from (Jalali, 2018)
Fig. 2The workflow of IFC and BVBS associated with the required information. Adapted from (Jalali, 2018)

Journal of Sustainable Architecture and Civil Engineering 2021/1/2882
European Standard Equipment Provider (BVBS – Guidelines, 2000). This standard assists the ex-change of information between rebar detailing software and CNC bending machines or PPS (Pro-duction Planning and Scheduling) software without manual intervention. The reinforcement data is exchanged through an ASCII (American Standard Code for Information Interchange) encoded text file and, as other CAD-CAM (Computer-Aided Design - Computer-Aided Manufacturing) formats like BVBS which is based on 2D drawings (Maciel and Corrêa, 2016). Jalali (2018) in her research presented an example of BVBS data string of corresponding item (Fig. 1).
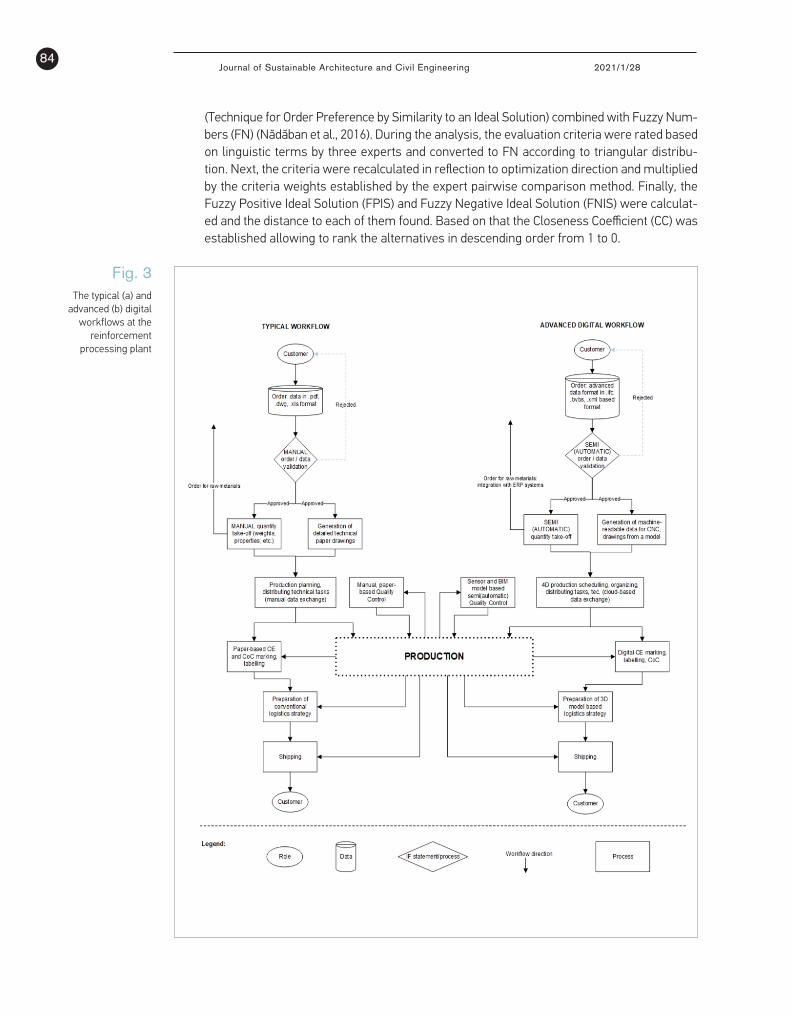
The workflow of 3D reinforcement production can be executed in both, IFC or BVBS format. The required information associated with each of the workflows is illustrated in Fig. 2.
Table 1 IFC-based
interoperability capabilities of
the reviewed BIM software tools.
Adapted from (Aram et al 2013b)
IFC-basedinteroperability
Structural design & analysis
Detailing
Scia Eng. Allplan PrecastBentley
ProConcreteTekla Structures
Single rebar elements(geometric representation — IFC entity mapping)
Extruded & facet-ed Brep —
IfcReinforcingBar
Extruded & facet-ed Brep —
IfcReinforcingBar
Extruded — If-cReinforcingBar
(only export)
Extruded — If-cReinforcingBar
Rebar groups and assemblies (geometric representation — IFC entity mapping)
NoExtruded & facet-
ed Brep —IfcReinforcingBar
Extruded — If-cReinforcingBar
(only export)
Faceted Brep — IfcReinforcingBar
Mesh (geometric representation — IFC entity mapping)
Extruded & facet-ed Brep —
IfcReinforcing-Mesh
Extruded & facet-ed Brep —
IfcReinforcing-Mesh
NoFaceted Brep — IfcReinforcingBar
Rebar basic attributes including name, type, geometry type, IFC GUID, BIM tool’s GUID, location, quantity & volume
Yes (all) Yes (all) Yes (all) Yes (all)
Rebar structural attributes
Length, grade, & bar diameter
Length, grade, bar diameter & mark
number
Rebar grade, bar diameter, sur-face attributes & gross/ net cross-section
area
Length, grade, & bar diameter, shape number,
hook angle, gross/net weight
& gross/net cross section
area
Number of individual rebars in an assembly like a cage or mesh
No No No No
Rebar subassembly attributes (e.g., a group of stirrups in a cage)
No
All basic attributes as well as length,
grade, & size, shape number
All basic attri-butes as well as grade, bar diam-
eter & surface attributes
All basic attri-butes as well as
length, grade, bar diameter & shape number
According to BuildingSMART (2012), the IFC geometric kernel offers three major representation types for solid models including Swept solid, Brep (Boundary representation), and CSG (Construc-

83Journal of Sustainable Architecture and Civil Engineering 2021/1/28
Methodology
tion Solid Geometry). While the support of Faceted Brep is important to enable clash detection, exported reinforcement models that use Faceted Brep do not support further geometric detailing of a model as well as identification or editing of an element’s features and increase the model size. Aram et al. (2013a) in their work analyzed reinforcement products’ IFC modeling workflows, infor-mation creation, and exchange practices during design, manufacturing, and installation phases. Based on the results some recommendations were presented. For example, for metadata, the name and description should be provided at the type and assembly level. Since one defined type can be used in different locations of a project modeled by different people, owner history should be defined either in the instance level or assembly of identical elements. For geometric represen-tation: (a) extruded solid models through IfcSweptDiskSolid (or its subtype IfcSweptDiskSolid-Polygonal) are recommended; (b) should be defined in the type level, so elements with identical geometry will share one geometric representation. For material definition: (a) should be defined in the type level, (b) in the detailing stage of a project, a material profile should be defined using IfcMaterialProfileSet.
Autodesk Revit Structure has not yet implemented the IFC schema for reinforcement. According to Aram et. al. (2013b) the three detailing software packages (Allplan Engineering, Tekla Structures, and Bentley ProConcrete) as well as Scia Engineer export some level of reinforcement information through the IFC (Table 1).
Further, in this study, we present two types of manufacturing workflows for construction rein-forcement products. The main purpose of this work is to compare the standard (currently used) method in contrast to the proposed digital order fulfillment method and to determine how digital processes facilitate the acquisition of information from work projects during the construction product manufacturing phase.
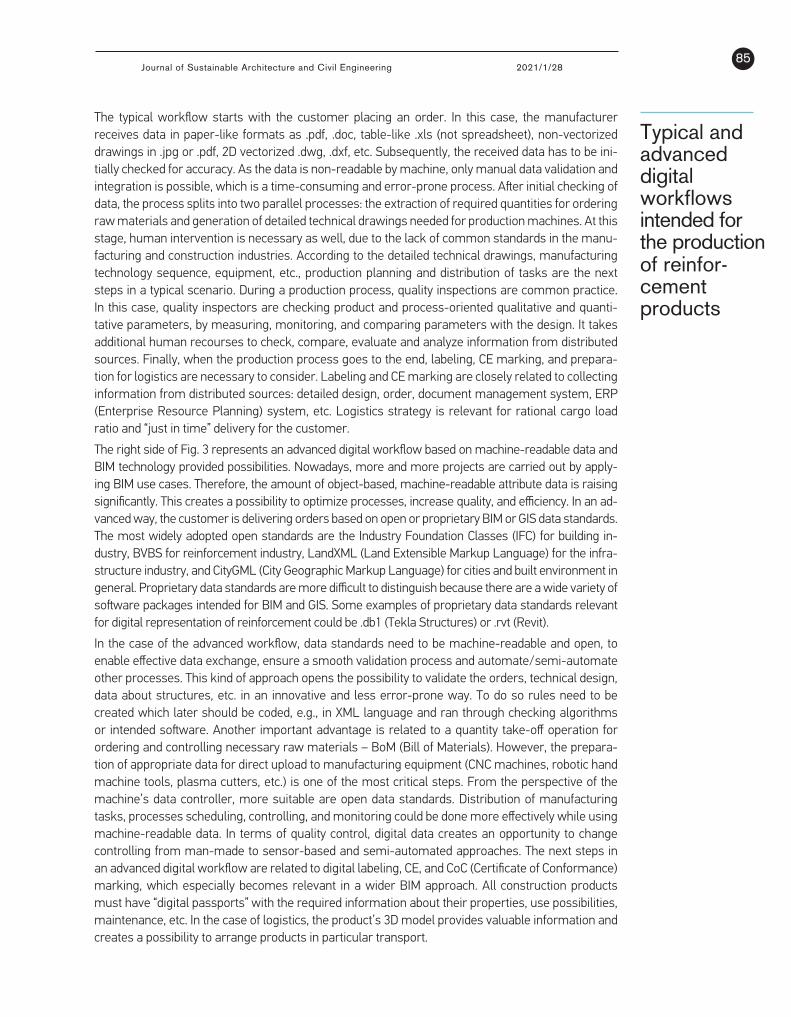
The literature review has revealed that to understand the prospects of BIM data use for the pro-duction of reinforcement products, it is useful to analyze two types of processing workflows (Fig. 3): typical (a) and advanced (b). The typical workflow is based only on human-readable, usually paper-based drawings and corresponding information. Furthermore, this production information is typically distributed across the various industry stakeholders. The second one is the advanced workflow method, which relies on the 3D model, and in a perfect case is enriched with attributes.
In this study the two algorithms for factory-based reinforcement production represented in Fig. 3 were analyzed and put into comparison based on five evaluative criteria:
_ K1 – performance, efficiency (production unit per time). The optimization direction is to max-imize the criterion.
_ K2 – environmental impact (raw materials and energy consumption, waste management). The optimization direction is to minimize the criterion.
_ K3 – investments (capital expenditure of hardware and software, machinery, tools, etc.). The optimization direction is to minimize the criterion.
_ K4 – training (periodical improvement of employee’s competencies). The optimization direc-tion is to minimize the criterion.
_ K5 – quality assurance (reduction of errors). The optimization direction is to maximize the criterion.
_ The priority ranking and significance of the evaluation criteria, which could define the choice of digital workflows, were determined using an expert pairwise comparison method adapted from Duleba & Moslem (2018). Subsequently, the two workflow alternatives- typical (A1) and advanced (A2) were compared using Multicriteria Decision Making Method (MCDM) TOPSIS
Journal of Sustainable Architecture and Civil Engineering 2021/1/2884
Fig. 3The typical (a) and
advanced (b) digital workflows at the
reinforcement processing plant
.
(Technique for Order Preference by Similarity to an Ideal Solution) combined with Fuzzy Num-bers (FN) (Nădăban et al., 2016). During the analysis, the evaluation criteria were rated based on linguistic terms by three experts and converted to FN according to triangular distribu-tion. Next, the criteria were recalculated in reflection to optimization direction and multiplied by the criteria weights established by the expert pairwise comparison method. Finally, the Fuzzy Positive Ideal Solution (FPIS) and Fuzzy Negative Ideal Solution (FNIS) were calculat-ed and the distance to each of them found. Based on that the Closeness Coefficient (CC) was established allowing to rank the alternatives in descending order from 1 to 0.
85Journal of Sustainable Architecture and Civil Engineering 2021/1/28
The typical workflow starts with the customer placing an order. In this case, the manufacturer receives data in paper-like formats as .pdf, .doc, table-like .xls (not spreadsheet), non-vectorized drawings in .jpg or .pdf, 2D vectorized .dwg, .dxf, etc. Subsequently, the received data has to be ini-tially checked for accuracy. As the data is non-readable by machine, only manual data validation and integration is possible, which is a time-consuming and error-prone process. After initial checking of data, the process splits into two parallel processes: the extraction of required quantities for ordering raw materials and generation of detailed technical drawings needed for production machines. At this stage, human intervention is necessary as well, due to the lack of common standards in the manu-facturing and construction industries. According to the detailed technical drawings, manufacturing technology sequence, equipment, etc., production planning and distribution of tasks are the next steps in a typical scenario. During a production process, quality inspections are common practice. In this case, quality inspectors are checking product and process-oriented qualitative and quanti-tative parameters, by measuring, monitoring, and comparing parameters with the design. It takes additional human recourses to check, compare, evaluate and analyze information from distributed sources. Finally, when the production process goes to the end, labeling, CE marking, and prepara-tion for logistics are necessary to consider. Labeling and CE marking are closely related to collecting information from distributed sources: detailed design, order, document management system, ERP (Enterprise Resource Planning) system, etc. Logistics strategy is relevant for rational cargo load ratio and “just in time” delivery for the customer.
The right side of Fig. 3 represents an advanced digital workflow based on machine-readable data and BIM technology provided possibilities. Nowadays, more and more projects are carried out by apply-ing BIM use cases. Therefore, the amount of object-based, machine-readable attribute data is raising significantly. This creates a possibility to optimize processes, increase quality, and efficiency. In an ad-vanced way, the customer is delivering orders based on open or proprietary BIM or GIS data standards. The most widely adopted open standards are the Industry Foundation Classes (IFC) for building in-dustry, BVBS for reinforcement industry, LandXML (Land Extensible Markup Language) for the infra-structure industry, and CityGML (City Geographic Markup Language) for cities and built environment in general. Proprietary data standards are more difficult to distinguish because there are a wide variety of software packages intended for BIM and GIS. Some examples of proprietary data standards relevant for digital representation of reinforcement could be .db1 (Tekla Structures) or .rvt (Revit).
In the case of the advanced workflow, data standards need to be machine-readable and open, to enable effective data exchange, ensure a smooth validation process and automate/semi-automate other processes. This kind of approach opens the possibility to validate the orders, technical design, data about structures, etc. in an innovative and less error-prone way. To do so rules need to be created which later should be coded, e.g., in XML language and ran through checking algorithms or intended software. Another important advantage is related to a quantity take-off operation for ordering and controlling necessary raw materials – BoM (Bill of Materials). However, the prepara-tion of appropriate data for direct upload to manufacturing equipment (CNC machines, robotic hand machine tools, plasma cutters, etc.) is one of the most critical steps. From the perspective of the machine’s data controller, more suitable are open data standards. Distribution of manufacturing tasks, processes scheduling, controlling, and monitoring could be done more effectively while using machine-readable data. In terms of quality control, digital data creates an opportunity to change controlling from man-made to sensor-based and semi-automated approaches. The next steps in an advanced digital workflow are related to digital labeling, CE, and CoC (Certificate of Conformance) marking, which especially becomes relevant in a wider BIM approach. All construction products must have “digital passports” with the required information about their properties, use possibilities, maintenance, etc. In the case of logistics, the product’s 3D model provides valuable information and creates a possibility to arrange products in particular transport.
Typical and advanced digital workflows intended for the production of reinfor- cement products
Journal of Sustainable Architecture and Civil Engineering 2021/1/2886
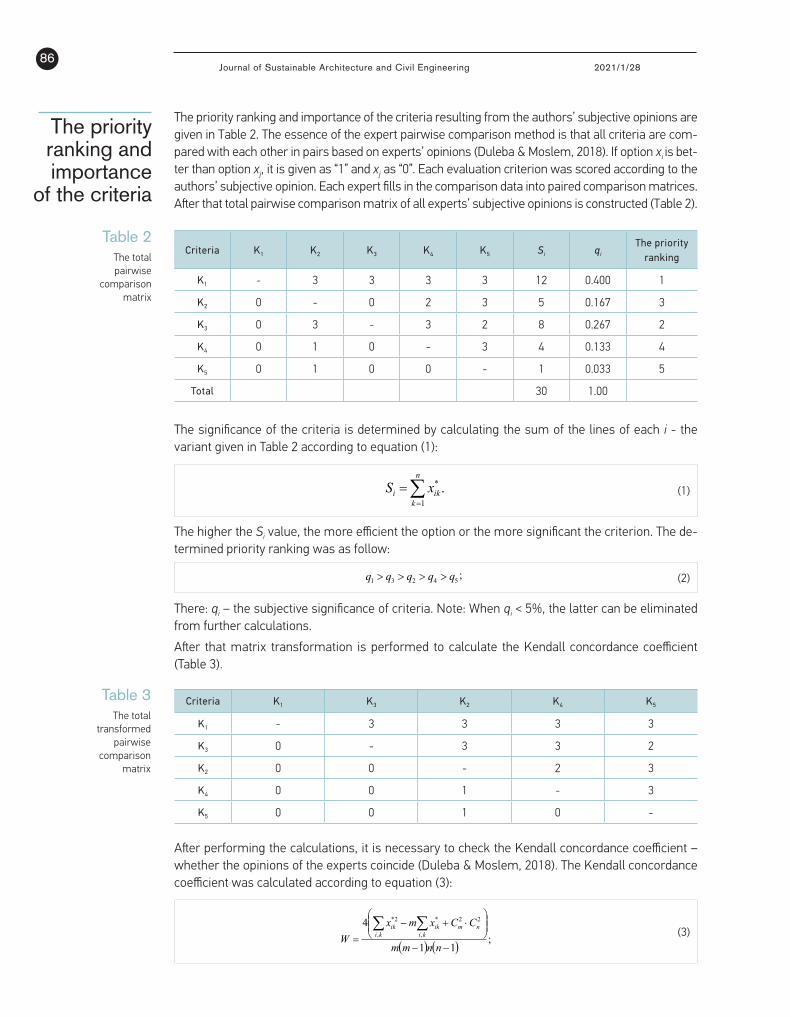
Criteria K1 K2 K3 K4 K5 Si qi
The priority ranking
K1 - 3 3 3 3 12 0.400 1
K2 0 - 0 2 3 5 0.167 3
K3 0 3 - 3 2 8 0.267 2
K4 0 1 0 - 3 4 0.133 4
K5 0 1 0 0 - 1 0.033 5
Total 30 1.00
The priority ranking and importance
of the criteria
The priority ranking and importance of the criteria resulting from the authors’ subjective opinions are given in Table 2. The essence of the expert pairwise comparison method is that all criteria are com-pared with each other in pairs based on experts’ opinions (Duleba & Moslem, 2018). If option xi is bet-ter than option xj, it is given as “1” and xj as “0”. Each evaluation criterion was scored according to the authors’ subjective opinion. Each expert fills in the comparison data into paired comparison matrices. After that total pairwise comparison matrix of all experts’ subjective opinions is constructed (Table 2).
The significance of the criteria is determined by calculating the sum of the lines of each i - the variant given in Table 2 according to equation (1):
8
(1)
The higher the Si value, the more efficient the option or the more significant the criterion. The determined priority ranking was as follow:
; (2)
There: qi – the subjective significance of criteria. Note: When qi < 5%, the latter can be eliminated from further calculations. After that matrix transformation is performed to calculate the Kendall concordance coefficient (Table 3).
Table 3. The total transformed pairwise comparison matrix
Criteria K1 K3 K2 K4 K5 K1 - 3 3 3 3 K3 0 - 3 3 2 K2 0 0 - 2 3 K4 0 0 1 - 3 K5 0 0 1 0 -
After performing the calculations, it is necessary to check the Kendall concordance coefficient – whether the opinions of the experts coincide (Duleba & Moslem, 2018). The Kendall concordance coefficient was calculated according to equation (3):
(3)
There: m – number of experts; n – is the number of alternatives being compared; – possible
combinations according to experts; – possible combinations according to evaluation criteria; –
possible combinations according to reasons; – possible combinations according to experts.
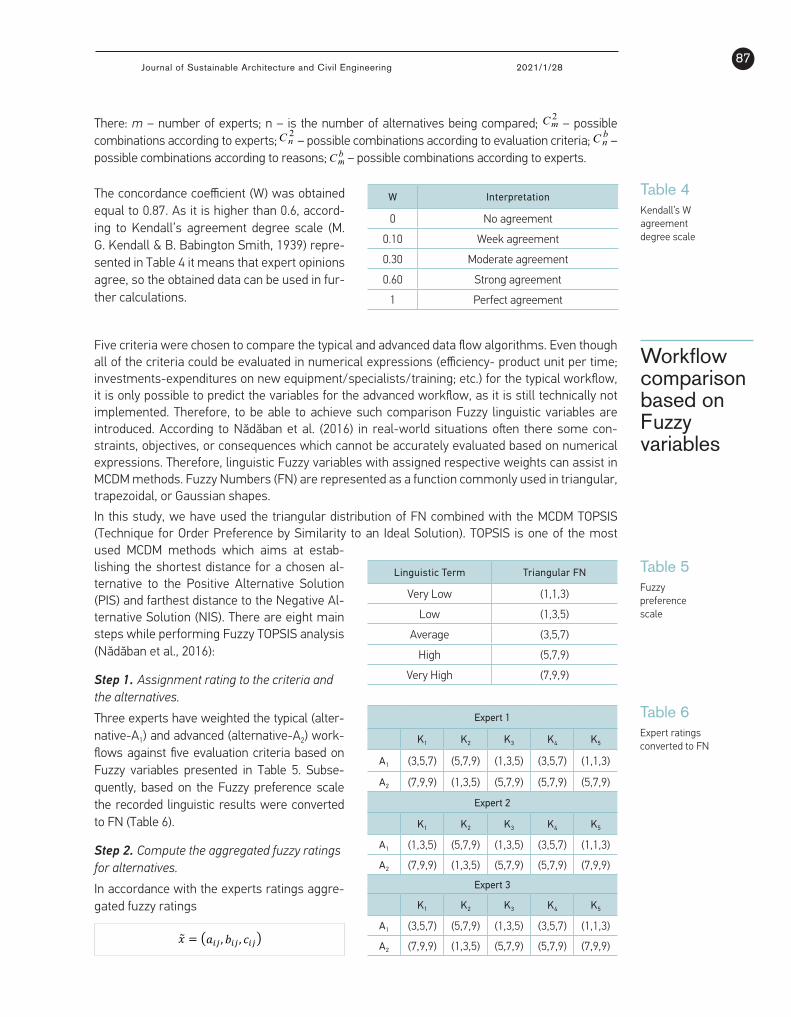
The concordance coefficient (W) was obtained equal to 0.87. As it is higher than 0.6, according to Kendall’s agreement degree scale (M. G. Kendall & B. Babington Smith, 1939) represented in Table 4 it means that expert opinions agree, so the obtained data can be used in further calculations.
Table 4. Kendall’s W agreement degree scale.
W Interpretation 0 No agreement
0.10 Week agreement 0.30 Moderate agreement 0.60 Strong agreement
1 Perfect agreement
å=
=n
kiki xS
1
* .
54231 qqqqq >>>>
( ) ( ) ;11
4 22
,
*
,
2*
--
÷÷ø
öççè
æ×+-
=åå
nnmm
CCxmxW
nmki
ikki
ik
2mC
2nC
bnC
bmC
(1)
The higher the Si value, the more efficient the option or the more significant the criterion. The de-termined priority ranking was as follow:
;
54231 qqqqq >>>> (2)
There: qi – the subjective significance of criteria. Note: When qi < 5%, the latter can be eliminated from further calculations.
After that matrix transformation is performed to calculate the Kendall concordance coefficient (Table 3).
Table 2 The total pairwise
comparison matrix
Table 3 The total
transformed pairwise
comparison matrix
Criteria K1 K3 K2 K4 K5
K1 - 3 3 3 3
K3 0 - 3 3 2
K2 0 0 - 2 3
K4 0 0 1 - 3
K5 0 0 1 0 -
After performing the calculations, it is necessary to check the Kendall concordance coefficient – whether the opinions of the experts coincide (Duleba & Moslem, 2018). The Kendall concordance coefficient was calculated according to equation (3):
( ) ( ) ;11
4 22
,
*
,
2*
--
÷÷ø
öççè
æ×+-
=åå
nnmm
CCxmxW
nmki
ikki
ik (3)
87Journal of Sustainable Architecture and Civil Engineering 2021/1/28
Table 4 Kendall’s W agreement degree scale
W Interpretation
0 No agreement
0.10 Week agreement
0.30 Moderate agreement
0.60 Strong agreement
1 Perfect agreement
There: m – number of experts; n – is the number of alternatives being compared;
8
2mC – possible
combinations according to experts;
2nC – possible combinations according to evaluation criteria;
bnC –
possible combinations according to reasons;
bmC – possible combinations according to experts.
Workflow comparison based on Fuzzy variables
Table 5 Fuzzy preference scale
Table 6 Expert ratings converted to FN
Linguistic Term Triangular FN
Very Low (1,1,3)
Low (1,3,5)
Average (3,5,7)
High (5,7,9)
Very High (7,9,9)
Expert 1
K1 K2 K3 K4 K5
A1 (3,5,7) (5,7,9) (1,3,5) (3,5,7) (1,1,3)
A2 (7,9,9) (1,3,5) (5,7,9) (5,7,9) (5,7,9)
Expert 2
K1 K2 K3 K4 K5
A1 (1,3,5) (5,7,9) (1,3,5) (3,5,7) (1,1,3)
A2 (7,9,9) (1,3,5) (5,7,9) (5,7,9) (7,9,9)
Expert 3
K1 K2 K3 K4 K5
A1 (3,5,7) (5,7,9) (1,3,5) (3,5,7) (1,1,3)
A2 (7,9,9) (1,3,5) (5,7,9) (5,7,9) (7,9,9)
The concordance coefficient (W) was obtained equal to 0.87. As it is higher than 0.6, accord-ing to Kendall’s agreement degree scale (M. G. Kendall & B. Babington Smith, 1939) repre-sented in Table 4 it means that expert opinions agree, so the obtained data can be used in fur-ther calculations.
Five criteria were chosen to compare the typical and advanced data flow algorithms. Even though all of the criteria could be evaluated in numerical expressions (efficiency- product unit per time; investments-expenditures on new equipment/specialists/training; etc.) for the typical workflow, it is only possible to predict the variables for the advanced workflow, as it is still technically not implemented. Therefore, to be able to achieve such comparison Fuzzy linguistic variables are introduced. According to Nădăban et al. (2016) in real-world situations often there some con-straints, objectives, or consequences which cannot be accurately evaluated based on numerical expressions. Therefore, linguistic Fuzzy variables with assigned respective weights can assist in MCDM methods. Fuzzy Numbers (FN) are represented as a function commonly used in triangular, trapezoidal, or Gaussian shapes.
In this study, we have used the triangular distribution of FN combined with the MCDM TOPSIS (Technique for Order Preference by Similarity to an Ideal Solution). TOPSIS is one of the most used MCDM methods which aims at estab-lishing the shortest distance for a chosen al-ternative to the Positive Alternative Solution (PIS) and farthest distance to the Negative Al-ternative Solution (NIS). There are eight main steps while performing Fuzzy TOPSIS analysis (Nădăban et al., 2016):
Step 1. Assignment rating to the criteria and the alternatives.
Three experts have weighted the typical (alter-native-A1) and advanced (alternative-A2) work-flows against five evaluation criteria based on Fuzzy variables presented in Table 5. Subse-quently, based on the Fuzzy preference scale the recorded linguistic results were converted to FN (Table 6).
Step 2. Compute the aggregated fuzzy ratings for alternatives.
In accordance with the experts ratings aggre-gated fuzzy ratings
𝑥𝑥" = $𝑎𝑎!" , 𝑏𝑏!" , 𝑐𝑐!")
Journal of Sustainable Architecture and Civil Engineering 2021/1/2888
Table 7 Aggregated
fuzzy ratings
K1 K2 K3 K4 K5
A1 (1,4.33,7) (5,7,9) (1,3,5) (3,5,7) (1,2.33,5)
A2 (7,9,9) (1,3,5) (5,7,9) (5,7,9) (5,8.33,9)
Table 8Normalized fuzzy
decision matrix
Table 9 Weighted
normalized decision matrix
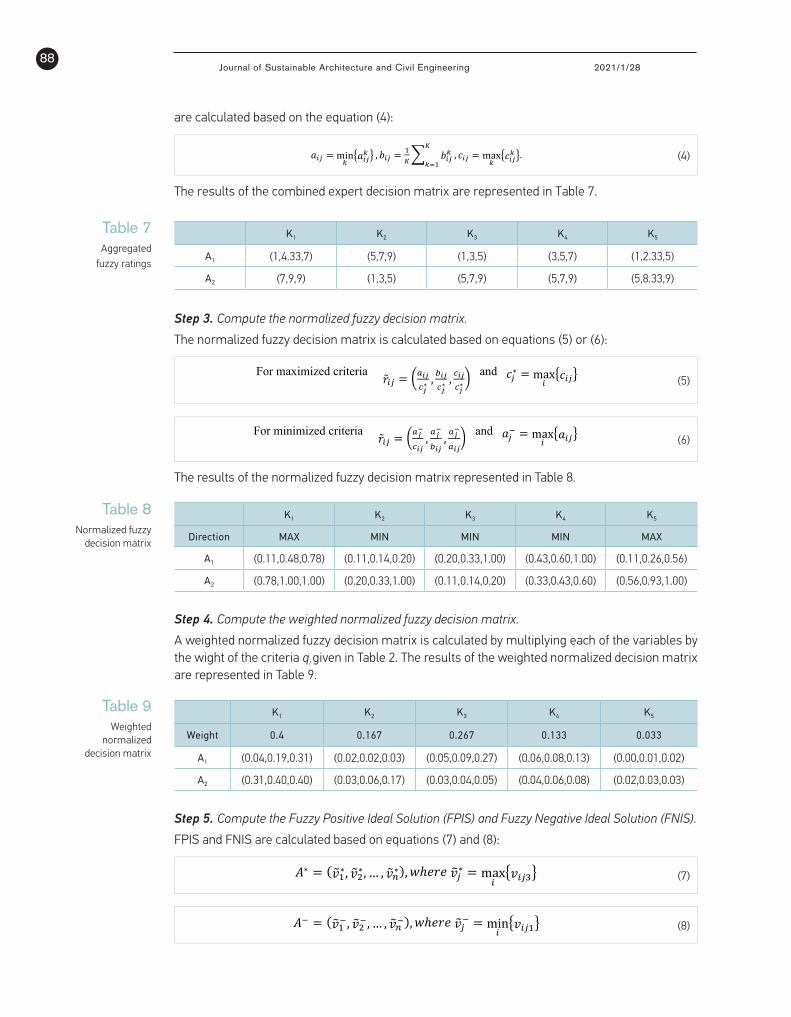
are calculated based on the equation (4):
𝑎𝑎!" = min
#-𝑎𝑎!"# . , 𝑏𝑏!" =
$%/ 𝑏𝑏!"#
%
#&$, 𝑐𝑐!" = max
#-𝑐𝑐!"# ..
(4)
The results of the combined expert decision matrix are represented in Table 7.
K1 K2 K3 K4 K5
Direction MAX MIN MIN MIN MAX
A1 (0.11,0.48,0.78) (0.11,0.14,0.20) (0.20,0.33,1.00) (0.43,0.60,1.00) (0.11,0.26,0.56)
A2 (0.78,1.00,1.00) (0.20,0.33,1.00) (0.11,0.14,0.20) (0.33,0.43,0.60) (0.56,0.93,1.00)
Step 3. Compute the normalized fuzzy decision matrix.
The normalized fuzzy decision matrix is calculated based on equations (5) or (6):
10
For maximized criteria �̃�𝑟!" = 9'!"("∗ ,
)!"("∗ ,
(!"("∗:
and 𝑐𝑐"∗ = max!
-𝑐𝑐!".
FPIS and FNIS are calculated based on equations (7) and (8): 𝐴𝐴∗ = (𝑣𝑣"$∗, 𝑣𝑣",∗, … , 𝑣𝑣"-∗), 𝑤𝑤ℎ𝑒𝑒𝑟𝑟𝑒𝑒𝑣𝑣""∗ = max
!-𝑣𝑣!".. (7)
𝐴𝐴+ = (𝑣𝑣"$+, 𝑣𝑣",+, … , 𝑣𝑣"-+), 𝑤𝑤ℎ𝑒𝑒𝑟𝑟𝑒𝑒𝑣𝑣""+ = min!-𝑣𝑣!"$. (8)
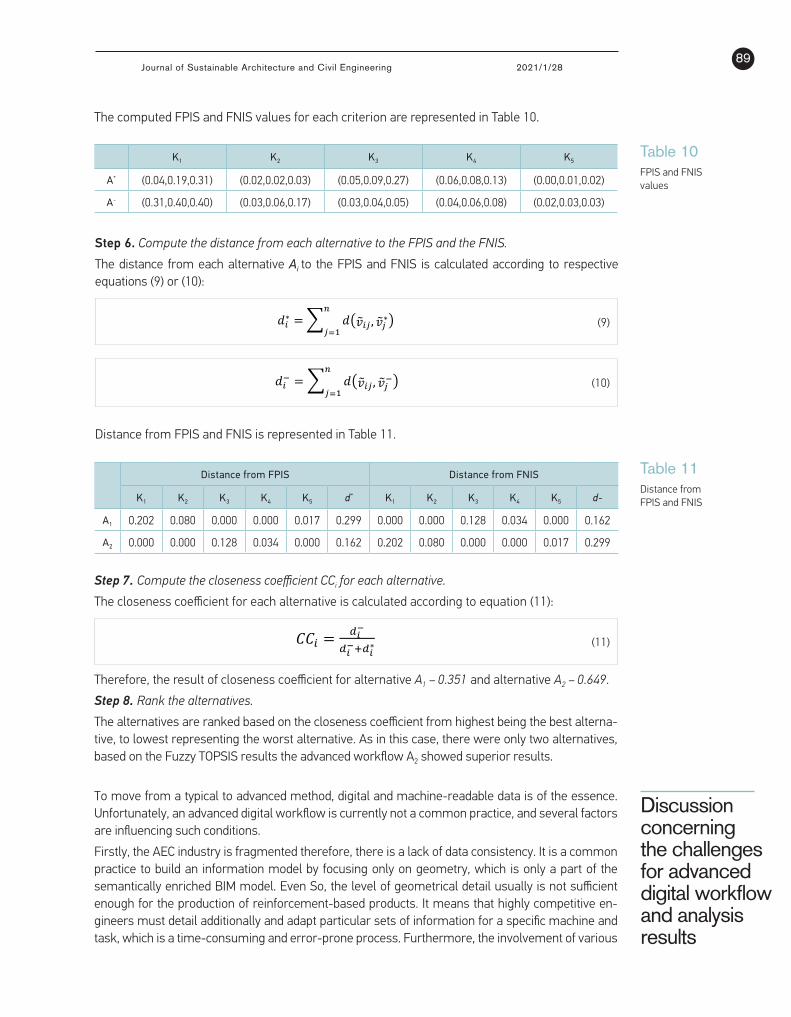
The computed FPIS and FNIS values for each criterion are represented in Table 10.
Table 10. FPIS and FNIS values
K1 K2 K3 K4 K5 A* (0.04,0.19,0.31) (0.02,0.02,0.03) (0.05,0.09,0.27) (0.06,0.08,0.13) (0.00,0.01,0.02) A- (0.31,0.40,0.40) (0.03,0.06,0.17) (0.03,0.04,0.05) (0.04,0.06,0.08) (0.02,0.03,0.03)
Step 6. Compute the distance from each alternative to the FPIS and the FNIS. The distance from each alternative Ai to the FPIS and FNIS is calculated according to respective equations (9) or (10):
𝑑𝑑!∗ = / 𝑑𝑑$𝑣𝑣"!" , 𝑣𝑣""∗)
-
"&$
(9)
(5)
10
For minimized criteria �̃�𝑟!" = 9'"$
(!",'"$
)!",'"$
'!": and 𝑎𝑎"+ = max
!-𝑎𝑎!".
s wight of the criteria qi given in Table 2. The results of the weighted normalized decision matrix are represented in Table 9.
Table 9. Weighted normalized decision matrix
K1 K2 K3 K4 K5 Weight 0.4 0.167 0.267 0.133 0.033
A1 (0.04,0.19,0.31) (0.02,0.02,0.03) (0.05,0.09,0.27) (0.06,0.08,0.13) (0.00,0.01,0.02) A2 (0.31,0.40,0.40) (0.03,0.06,0.17) (0.03,0.04,0.05) (0.04,0.06,0.08) (0.02,0.03,0.03)
Step 5. Compute the Fuzzy Positive Ideal Solution (FPIS) and Fuzzy Negative Ideal Solution (FNIS).
FPIS and FNIS are calculated based on equations (7) and (8): 𝐴𝐴∗ = (𝑣𝑣"$∗, 𝑣𝑣",∗, … , 𝑣𝑣"-∗), 𝑤𝑤ℎ𝑒𝑒𝑟𝑟𝑒𝑒𝑣𝑣""∗ = max
!-𝑣𝑣!".. (7)
𝐴𝐴+ = (𝑣𝑣"$+, 𝑣𝑣",+, … , 𝑣𝑣"-+), 𝑤𝑤ℎ𝑒𝑒𝑟𝑟𝑒𝑒𝑣𝑣""+ = min!-𝑣𝑣!"$. (8)
The computed FPIS and FNIS values for each criterion are represented in Table 10.
Table 10. FPIS and FNIS values
K1 K2 K3 K4 K5 A* (0.04,0.19,0.31) (0.02,0.02,0.03) (0.05,0.09,0.27) (0.06,0.08,0.13) (0.00,0.01,0.02) A- (0.31,0.40,0.40) (0.03,0.06,0.17) (0.03,0.04,0.05) (0.04,0.06,0.08) (0.02,0.03,0.03)
Step 6. Compute the distance from each alternative to the FPIS and the FNIS. The distance from each alternative Ai to the FPIS and FNIS is calculated according to respective equations (9) or (10):
𝑑𝑑!∗ = / 𝑑𝑑$𝑣𝑣"!" , 𝑣𝑣""∗)
-
"&$
(9)
(6)
The results of the normalized fuzzy decision matrix represented in Table 8.
K1 K2 K3 K4 K5
Weight 0.4 0.167 0.267 0.133 0.033
A1 (0.04,0.19,0.31) (0.02,0.02,0.03) (0.05,0.09,0.27) (0.06,0.08,0.13) (0.00,0.01,0.02)
A2 (0.31,0.40,0.40) (0.03,0.06,0.17) (0.03,0.04,0.05) (0.04,0.06,0.08) (0.02,0.03,0.03)
Step 4. Compute the weighted normalized fuzzy decision matrix.
A weighted normalized fuzzy decision matrix is calculated by multiplying each of the variables by the wight of the criteria qi given in Table 2. The results of the weighted normalized decision matrix are represented in Table 9.
Step 5. Compute the Fuzzy Positive Ideal Solution (FPIS) and Fuzzy Negative Ideal Solution (FNIS).
FPIS and FNIS are calculated based on equations (7) and (8):
𝐴𝐴∗ = (𝑣𝑣"$∗, 𝑣𝑣",∗, … , 𝑣𝑣"-∗), 𝑤𝑤ℎ𝑒𝑒𝑒𝑒𝑒𝑒𝑣𝑣""∗ = max
!-𝑣𝑣!".. (7) (7)
10
𝐴𝐴+ = (𝑣𝑣"$+, 𝑣𝑣",+, … , 𝑣𝑣"-+), 𝑤𝑤ℎ𝑒𝑒𝑒𝑒𝑒𝑒𝑣𝑣""+ = min!-𝑣𝑣!"$.
Step 6. Compute the distance from each alternative to the FPIS and the FNIS. The distance from each alternative Ai to the FPIS and FNIS is calculated according to respective equations (9) or (10):
𝑑𝑑!∗ = / 𝑑𝑑$𝑣𝑣"!" , 𝑣𝑣""∗)
-
"&$
(9)
(8)
89Journal of Sustainable Architecture and Civil Engineering 2021/1/28
Table 10 FPIS and FNIS values
K1 K2 K3 K4 K5
A* (0.04,0.19,0.31) (0.02,0.02,0.03) (0.05,0.09,0.27) (0.06,0.08,0.13) (0.00,0.01,0.02)
A- (0.31,0.40,0.40) (0.03,0.06,0.17) (0.03,0.04,0.05) (0.04,0.06,0.08) (0.02,0.03,0.03)
Table 11 Distance from FPIS and FNIS
Distance from FPIS Distance from FNIS
K1 K2 K3 K4 K5 d* K1 K2 K3 K4 K5 d-
A1 0.202 0.080 0.000 0.000 0.017 0.299 0.000 0.000 0.128 0.034 0.000 0.162
A2 0.000 0.000 0.128 0.034 0.000 0.162 0.202 0.080 0.000 0.000 0.017 0.299
The computed FPIS and FNIS values for each criterion are represented in Table 10.
Discussion concerning the challenges for advanced digital workflow and analysis results
Step 6. Compute the distance from each alternative to the FPIS and the FNIS.
The distance from each alternative Ai to the FPIS and FNIS is calculated according to respective equations (9) or (10):
𝑑𝑑!∗ = / 𝑑𝑑$𝑣𝑣"!" , 𝑣𝑣""∗)
-
"&$
(9)
11
𝑑𝑑!+ = / 𝑑𝑑$𝑣𝑣"!" , 𝑣𝑣""+)-
"&$
(10)
Step 8. Rank the alternatives. The alternatives are ranked based on the closeness coefficient from highest being the best alternative, to lowest representing the worst alternative. As in this case, there were only two alternatives, based on the Fuzzy TOPSIS results the advanced workflow A2 showed superior results.
Discussion concerning the challenges for advanced digital workflow and analysis results To move from a typical to advanced method, digital and machine-readable data is of the essence. Unfortunately, an advanced digital workflow is currently not a common practice, and several factors are influencing such conditions.
Firstly, the AEC industry is fragmented therefore, there is a lack of data consistency. It is a common practice to build an information model by focusing only on geometry, which is only a part of the semantically enriched BIM model. Even So, the level of geometrical detail usually is not sufficient enough for the production of reinforcement-based products. It means that highly competitive engineers must detail additionally and adapt particular sets of information for a specific machine and task, which is a time-consuming and error-prone process. Furthermore, the involvement of various stakeholders as structural engineers and manufacturers brings into consideration the accountability issues for the final product.
Another challenge is related to the reliability of data. As a common practice, designers “blindly” use BIM libraries, in which usually object attributes are not standardized. Therefore, a bunch of mixed and manufacturer/product-specific untrustworthy data gets involved in the projects. Depending on the specific product, the use of unstandardized libraries is quite common practice in BIM, because it reduces the time for modeling. Data exchange possibilities as well play a very important role. AEC industry is a huge sector with high fragmentation in information and processes, especially when taking into account the whole building life cycle. That is why even specific tasks (e.g., production of reinforcement-based products) are highly influenced by distributed sources of information prepared by various stakeholders. It shows that data exchange between the industry’s stakeholders is crucial. Currently, some of the most common data exchange scenarios intended for reinforcement products are: 1) exchange of geometrical and attribute
(10)
Distance from FPIS and FNIS is represented in Table 11.
Step 7. Compute the closeness coefficient CCi for each alternative.
The closeness coefficient for each alternative is calculated according to equation (11):
11
𝐶𝐶𝐶𝐶! =/!$
/!$0/!
∗
Therefore, the result of closeness coefficient for alternative A1=0.351 and alternative A2=0.649.
Step 8. Rank the alternatives. The alternatives are ranked based on the closeness coefficient from highest being the best alternative, to lowest representing the worst alternative. As in this case, there were only two alternatives, based on the Fuzzy TOPSIS results the advanced workflow A2 showed superior results.
Discussion concerning the challenges for advanced digital workflow and analysis results To move from a typical to advanced method, digital and machine-readable data is of the essence. Unfortunately, an advanced digital workflow is currently not a common practice, and several factors are influencing such conditions.
Firstly, the AEC industry is fragmented therefore, there is a lack of data consistency. It is a common practice to build an information model by focusing only on geometry, which is only a part of the semantically enriched BIM model. Even So, the level of geometrical detail usually is not sufficient enough for the production of reinforcement-based products. It means that highly competitive engineers must detail additionally and adapt particular sets of information for a specific machine and task, which is a time-consuming and error-prone process. Furthermore, the involvement of various stakeholders as structural engineers and manufacturers brings into consideration the accountability issues for the final product.
Another challenge is related to the reliability of data. As a common practice, designers “blindly” use BIM libraries, in which usually object attributes are not standardized. Therefore, a bunch of mixed and manufacturer/product-specific untrustworthy data gets involved in the projects. Depending on the specific product, the use of unstandardized libraries is quite common practice in BIM, because it reduces the time for modeling. Data exchange possibilities as well play a very important role. AEC industry is a huge sector with high fragmentation in information and processes, especially when taking into account the whole building life cycle. That is why even specific tasks (e.g., production of reinforcement-based products) are highly influenced by distributed sources of information prepared by various stakeholders. It shows that data exchange between the industry’s stakeholders is crucial. Currently, some of the most common data exchange scenarios intended for reinforcement products are: 1) exchange of geometrical and attribute
(11)
Therefore, the result of closeness coefficient for alternative A1 – 0.351 and alternative A2 – 0.649.
Step 8. Rank the alternatives.
The alternatives are ranked based on the closeness coefficient from highest being the best alterna-tive, to lowest representing the worst alternative. As in this case, there were only two alternatives, based on the Fuzzy TOPSIS results the advanced workflow A2 showed superior results.
To move from a typical to advanced method, digital and machine-readable data is of the essence. Unfortunately, an advanced digital workflow is currently not a common practice, and several factors are influencing such conditions.
Firstly, the AEC industry is fragmented therefore, there is a lack of data consistency. It is a common practice to build an information model by focusing only on geometry, which is only a part of the semantically enriched BIM model. Even So, the level of geometrical detail usually is not sufficient enough for the production of reinforcement-based products. It means that highly competitive en-gineers must detail additionally and adapt particular sets of information for a specific machine and task, which is a time-consuming and error-prone process. Furthermore, the involvement of various
Journal of Sustainable Architecture and Civil Engineering 2021/1/2890
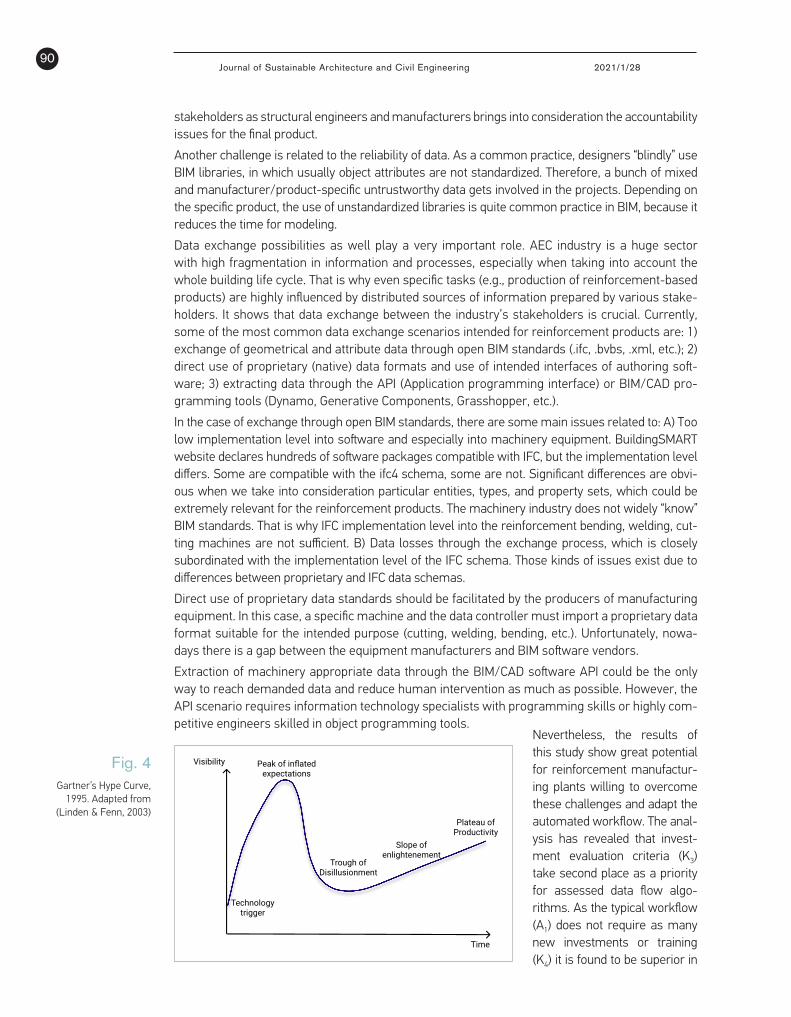
Fig. 4Gartner’s Hype Curve,
1995. Adapted from (Linden & Fenn, 2003)
13
Fig. 4. Gartner’s Hype Curve, 1995. Adapted from (Linden & Fenn, 2003)
Conclusions
Even though, the built environment is moving towards digitalization there are still challenges to overcome in order to apply advanced digital workflow and enhance efficiency. On top of the challenges mentioned during the discussion, it is appropriate to notice the training of the whole AEC sector supply chain and the need for investments in hardware and software. Furthermore, the popularity of BIM-based projects in the market, BIM demand from the client-side (especially public sector), lack of standards and supportive legislation system, rules, guides, or manuals are the vital components to carry out BIM throughout the whole building life cycle as well. In addition, but out of the scope of this research, there are some common challenges related to data consistency and reliability, software and machinery implementation level of BIM data standards. According to the results of this study, the following main conclusions were drawn:
1. The digital workflow algorithm proposed in this study showed that a typical workflow does not demand so many investments and training compared to the advanced workflow. However, the potential to increase efficiency, reduce environmental impact and probability of errors, by applying advanced digital workflow methods in the reinforcement processing plant, is promising.
2. The following priority ranking, and significance of the selected rating criteria was obtained using the expert pairwise comparison method: 40.0% - performance, efficiency (K1); 26.7% - environmental impact (K3); 16.7% - investments (K2); 13.3% - training (K4); 3.3% - quality assurance (K5). The most significant criterion was performance (efficiency).
3. The analysis done using the MCDM Fuzzy TOPSIS method for five rating criteria (K1—K5) showed that the advanced production workflow is the most rational alternative for the reinforcement processing plant. The closeness coefficient CCA2 for advanced production workflow (alternative A2) is 0.649, which is significantly better in comparison with typical workflow (alternative A1) CCA1 = 0
stakeholders as structural engineers and manufacturers brings into consideration the accountability issues for the final product.
Another challenge is related to the reliability of data. As a common practice, designers “blindly” use BIM libraries, in which usually object attributes are not standardized. Therefore, a bunch of mixed and manufacturer/product-specific untrustworthy data gets involved in the projects. Depending on the specific product, the use of unstandardized libraries is quite common practice in BIM, because it reduces the time for modeling.
Data exchange possibilities as well play a very important role. AEC industry is a huge sector with high fragmentation in information and processes, especially when taking into account the whole building life cycle. That is why even specific tasks (e.g., production of reinforcement-based products) are highly influenced by distributed sources of information prepared by various stake-holders. It shows that data exchange between the industry’s stakeholders is crucial. Currently, some of the most common data exchange scenarios intended for reinforcement products are: 1) exchange of geometrical and attribute data through open BIM standards (.ifc, .bvbs, .xml, etc.); 2) direct use of proprietary (native) data formats and use of intended interfaces of authoring soft-ware; 3) extracting data through the API (Application programming interface) or BIM/CAD pro-gramming tools (Dynamo, Generative Components, Grasshopper, etc.).
In the case of exchange through open BIM standards, there are some main issues related to: A) Too low implementation level into software and especially into machinery equipment. BuildingSMART website declares hundreds of software packages compatible with IFC, but the implementation level differs. Some are compatible with the ifc4 schema, some are not. Significant differences are obvi-ous when we take into consideration particular entities, types, and property sets, which could be extremely relevant for the reinforcement products. The machinery industry does not widely “know” BIM standards. That is why IFC implementation level into the reinforcement bending, welding, cut-ting machines are not sufficient. B) Data losses through the exchange process, which is closely subordinated with the implementation level of the IFC schema. Those kinds of issues exist due to differences between proprietary and IFC data schemas.
Direct use of proprietary data standards should be facilitated by the producers of manufacturing equipment. In this case, a specific machine and the data controller must import a proprietary data format suitable for the intended purpose (cutting, welding, bending, etc.). Unfortunately, nowa-days there is a gap between the equipment manufacturers and BIM software vendors.
Extraction of machinery appropriate data through the BIM/CAD software API could be the only way to reach demanded data and reduce human intervention as much as possible. However, the API scenario requires information technology specialists with programming skills or highly com-petitive engineers skilled in object programming tools.
Nevertheless, the results of this study show great potential for reinforcement manufactur-ing plants willing to overcome these challenges and adapt the automated workflow. The anal-ysis has revealed that invest-ment evaluation criteria (K3) take second place as a priority for assessed data flow algo-rithms. As the typical workflow (A1) does not require as many new investments or training (K4) it is found to be superior in
91Journal of Sustainable Architecture and Civil Engineering 2021/1/28
Conclusions
References
these two evaluation criteria. However, these factors can be considered short-term in the technology implementation cycle. According to Gartner’s Hype Curve (1995) represented in Fig. 4, organizations tend to be easily triggered by new technology and make efforts towards its adaptation (Linden & Fenn, 2003). Though at this time additional investments are necessary for the new technology imple-mentation and training of employees, yet the impact of the new technology is barely visible. Hence, at the peak of inflated expectations, many organizations drop the new technology and go back to the old ways, consequently newer reaching the plateau of productivity and losing their primary investments. However, as this research has revealed, the advanced workflow (A2) highly increases the effective-ness (K1) as well as reduces the environmental impact (K2) and the chance of error (K5). Therefore, it can be considered as a viable alternative from a long-term perspective.
Even though, the built environment is moving towards digitalization there are still challenges to overcome in order to apply advanced digital workflow and enhance efficiency. On top of the challeng-es mentioned during the discussion, it is appropriate to notice the training of the whole AEC sector supply chain and the need for investments in hardware and software. Furthermore, the popularity of BIM-based projects in the market, BIM demand from the client-side (especially public sector), lack of standards and supportive legislation system, rules, guides, or manuals are the vital components to carry out BIM throughout the whole building life cycle as well. In addition, but out of the scope of this research, there are some common challenges related to data consistency and reliability, software and machinery implementation level of BIM data standards. According to the results of this study, the following main conclusions were drawn:
1. The digital workflow algorithm proposed in this study showed that a typical workflow does not demand so many investments and training compared to the advanced workflow. However, the potential to increase efficiency, reduce environmental impact and probability of errors, by ap-plying advanced digital workflow methods in the reinforcement processing plant, is promising.
2. The following priority ranking, and significance of the selected rating criteria was obtained us-ing the expert pairwise comparison method: 40.0% - performance, efficiency (K1); 26.7% - envi-ronmental impact (K3); 16.7% - investments (K2); 13.3% - training (K4); 3.3% - quality assurance (K5). The most significant criterion was performance (efficiency).
3. The analysis done using the MCDM Fuzzy TOPSIS method for five rating criteria (K1—K5) showed that the advanced production workflow is the most rational alternative for the rein-forcement processing plant. The closeness coefficient CCA2 for advanced production workflow (alternative A2) is 0.649, which is significantly better in comparison with typical workflow (al-ternative A1) CCA1 = 0
Abanda F. H., Tah J. H. M., Cheung F. K. T. BIM in off-site manufacturing for buildings. Journal of Building Engineering, 2017; 14: 89-102. https://doi.org/10.1016/j.jobe.2017.10.002
Aram S., Eastman C., Venugopal M., Sacks R., Belsky M. Concrete reinforcement modeling for efficient in-formation sharing, Proceedings of the 30th ISARC, Montréal, Canada, 2013a: 1056-1064. https://doi.org/10.22260/ISARC2013/0116
Aram S., Eastman C., Sacks R. Requirements for BIM platforms in the concrete reinforcement supply chain. Automation in Construction, 2013b; 35: 1-17. https://doi.org/10.1016/j.autcon.2013.01.013
BuildingSMART: Model Support Group [MSG] & Imple-mentation Support Group [ISG] (2012a). Industry Foun-dation Classes, IFC 2x Edition 4 Release Candidate 4 (RC4). https://technical.buildingsmart.org/services/
BundesVereinigung der BauSoftwarehäuser, BVBS - Guidelines: Exchanging reinforcement data - interface description release 2.0, 2.0 ed., BundesVereinigung der BauSoftwarehäuser E.V., Bonn, Germany; 2000.
Cho Y.S., Lee S.I., Bae J.S. Reinforcement placement in a concrete slab object using structural building in-formation modeling. Computer-Aided Civil and Infra-structure Engineering. 2014; Volume 29, Issue 1: 47-59. https://doi.org/10.1111/j.1467-8667.2012.00794.x

Journal of Sustainable Architecture and Civil Engineering 2021/1/2892
Duleba, S., & Moslem, S. Sustainable Urban Trans-port Development with Stakeholder Participation, an AHP-Kendall Model: A Case Study for Mer-sin. Sustainability, 2018; 10.10: 3647. https://doi.org/10.3390/su10103647
Hamid M., Tolba O., Antably A. El. BIM semantics for digital fabrication: A knowledge-based approach. Automation in Construction, 2018; 91: 62-82. https://doi.org/10.1016/j.autcon.2018.02.031
Hwang B., Shan M., Looi K.-Y. Key constraints and mitigation strategies for prefabricated prefinished volumetric construction. Journal of Cleaner Produc-tion, 2018; 183: 183-193. https://doi.org/10.1016/j.jclepro.2018.02.136
Ignatova E., Zotkin S., Zotkina I. The extraction and processing of BIM data. IOP Conference Series: Materials Science and Engineering 365, 2018; IOP Publishing: 8 pages. https://doi.org/10.1088/1757-899X/365/6/062033
Jalali S. Use of BIM Technology and 3D-Modeling to Automate the Paperless Reinforcement Produc-tion, Master thesis, Universitetet i Agder; 2018; 104 p. https://uia.brage.unit.no/uia-xmlui/bitstream/handle/11250/2562904/Jalal i%2C%20Mota-heri%20Sarasadat.pdf?sequence=1&isAllowed=y
Kouhestani S. and Nik-Bakht M. IFC-based pro-cess mining for design authoring. Automation in Construction, 2020; 112: Article 103069, 15 pages. https://doi.org/10.1016/j.autcon.2019.103069
Lee J., Kwon N., Ham N., Kim J., Ahn Y. BIM-Based Digital Fabrication Process for a Free-Form Build-ing Project in South Korea. Hindawi, Advances in Civil Engineering. Volume 2019, Article ID 4163625: 18 pages. https://doi.org/10.1155/2019/4163625
Linden, A. and Fenn, J. Understanding Gartner’s hype cycles. Strategic Analysis Report Nº R-20-1971. Gartner, Inc, 2003, 88. http://www.ask-force.org/web/Discourse/Linden-HypeCycle-2003.pdf
Liu Y., Li M., Wong B. C. L., Chan Ch. M., Cheng J. C. P., Gan V. J. L. BIM-BVBS integration with openBIM standards for automatic prefabrication of steel rein-forcement. Automation in Construction, 2021; 125: Article 103654, 19 pages. https://doi.org/10.1016/j.autcon.2021.103654
Maciel A.R., Corrêa F.R. Interoperability with IFC in the automated rebar fabrication, 33rd International Sympo-sium on Automation and Robotics in Construction (IS-ARC 2016), 18 - 21 July, Auburn, Alabama, USA, 2016: 872-880. https://doi.org/10.22260/ISARC2016/0105
Maciel A.R., Corrêa F.R. IFC-based cut & bent rebar supply chain integration, 34th International Sympo-
sium on Automation and Robotics in Construction and Mining (ISARC 2017), 28 June - 1 July, Taipei, Taiwan, 2017: 140-147. https://pdfs.semanticscholar.org/e3fe/932c712d2abc9a8efb38884a08f27762d824.pdf
Martinez P., Ahmad R., Al-Hussein M. A vision-based system for pre-inspection of steel frame manufac-turing. Automation in Construction, 2019; 97: 151-163. https://doi.org/10.1016/j.autcon.2018.10.021
M. G. Kendall & B. Babington Smith. The Problem of m Rankings. The Annals of Mathematical Statis-tics, 1939; 10(3), 275-287. https://doi.org/10.1214/aoms/1177732186
Nădăban, S., Dzitac, S., & Dzitac, I. Fuzzy TOPSIS: A General View. Procedia Computer Science, 2016; 91: 823-831. https://doi.org/10.1016/j.procs.2016.07.088
Nath T., Attarzadeh M., Tiong R.L.K., Chidambaram C., Yu Z. Productivity improvement of precast shop draw-ings generation through BIM-based process re-engi-neering. Automation in Construction, 2015; 54: 54-68. https://doi.org/10.1016/j.autcon.2015.03.014
Piroozfar P., Farr E.R.P., Hvam L., Robinson D., Sha-fiee S. Configuration platform for customisation of design, manufacturing and assembly processes of building façade systems: A building information modelling perspective. Automation in Construction, 2019; 106: Article 102914. https://doi.org/10.1016/j.autcon.2019.102914
Wang Z., Hu H., Gong J., Ma X., Xiong W. Precast supply chain management in off-site construc-tion: A critical literature review. Journal of Clean-er Production, 2019; 2322: 1204-1217. https://doi.org/10.1016/j.jclepro.2019.05.229
Xu Z., Abualdenien J., Liu H., Kang R. An IDM-Based Approach for Information Requirement in Prefab-ricated Construction. Hindawi, Advances in Civil Engineering. Volume 2020, Article ID 8946530: 21 pages. https://doi.org/10.1155/2020/8946530
Yanga L., Chenga J. C. P., Wang Q. Semi-automated generation of parametric BIM for steel structures based on terrestrial laser scanning data. Automation in Construction, 2020; 112: Article 103037, 17 pages. https://doi.org/10.1016/j.autcon.2019.103037
Yuan Z., Sun Ch., Wang Y. Design for manufacture and assembly-oriented parametric design of prefabricat-ed buildings. Automation in Construction, 2018; 88: 13-22. https://doi.org/10.1016/j.autcon.2017.12.021
Zhong R. Y., Peng Y., Xue F., Fang J., Zou W., Luo H., Ng S. T., Lu W., Shen G. Q. P., Huang G. Q. Prefabri-cated construction enabled by the Internet-of-Things. Automation in Construction, 2017; 76: 59-70. https://doi.org/10.1016/j.autcon.2017.01.006

93Journal of Sustainable Architecture and Civil Engineering 2021/1/28
About the Author
DARIUS PUPEIKIS
Position at the organizationHead of Centre for Smart Cities and InfrastructureAt the Faculty of Civil Engineering and Architecture
Main research areaBIM, digital twins, civil engineering
AddressStudentu str. 48-415, LT-51367 Kaunas, LithuaniaTel. +370 689 77371E-mail:[email protected]
LINA MORKŪNAITĖ
Position at the organizationMSc at Department of Built Environment
Main research areaDigital construction, BIM, linked building data
AddressThomas Manns Vej 23, 9220 Aalborg Ø, DenmarkE-mail:[email protected]
MINDAUGAS DAUKŠYS
Position at the organizationProf. at Faculty of Civil Engineering and Architecture
Main research areaCivil engineering, construction technology
AddressStudentu str. 48, LT-51367 Kaunas, LithuaniaTel. +370 37 300473E-mail: [email protected]
ARŪNAS ALEKSANDRAS NAVICKAS
Position at the organizationDr. at Faculty of Civil Engineering and Architecture
Main research areaDigital construction, civil engineering
AddressStudentu str. 48, LT-51367 Kaunas, LithuaniaE-mail: [email protected]
SVAJŪNAS ABROMAS
Position at the organizationConstructor-technologist at JSC “Serfas”
Main research areaDigital construction, civil engineering
AddressTechnikos str. 7C, LT-51209 Kaunas, LithuaniaE-mail: [email protected]
This article is an Open Access article distributed under the terms and conditions of the Creative Commons Attribution 4.0 (CC BY 4.0) License (http://creativecommons.org/licenses/by/4.0/ ).