Embed Size (px)
Citation preview

Cost-Benefit Analysis of Proposed
New Health Warnings on Tobacco Products
Report Prepared for
Commonwealth Department of Health and Ageing
Applied Economics
December 2003

Contents
Summary 3
1 Introduction1.1 Proposed New Health Warnings 41.2 Aim and Layout of Report 5
2 Approach to Evaluation2.1 Introduction to Cost Benefit Analysis 62.2 Main Costs and Benefits 7
3 Impact of Proposed Health Warnings on Tobacco Consumption3.1 Trends in Tobacco Consumption 103.2 Forecast Impact of Health Warnings on Tobacco Consumption 11
4 Estimated Costs of Warnings to Tobacco Industry and Government4.1 The Tobacco Industry 154.2 Implementation Costs 194.3 Loss of Net Income from Tobacco Sales 204.4 Impact on Government Revenue 21
5 Forecast Health Improvements5.1 Introduction 235.2 Forecast Health Improvements 23
6 Estimated Benefits of Health Warnings 6.1 Benefits of Health Improvements 266.2 Savings in Public Health Care Expenditures 276.3 Benefits to Non-Tobacco Industries 286.4 Unquantified Benefits 29
7 Evaluation of Proposed Health Warnings7.1 Central Case Results 307.2 Sensitivity Tests 307.3 Impacts on Major Stakeholders 347.4 Conclusions 34
References 35
AppendicesA Submissions from ANZPAC and AMCOR 37B Measuring the Impacts of Reductions in Exposure to Tobacco 41
on the Burden of Disease and Injury in Australia
2

Summary
This report provides an economic evaluation of the Department of Health and Ageing’s proposals that larger and more graphic health warnings be displayed on tobacco products.
Recent market research has found that the impact of the current warnings is declining and that new warnings would be required to sustain an effective decline in tobacco consumption.
The Department of Health and Ageing proposes that, starting from 1 July 2004, tobacco products will carry 14 rotating graphic messages of the effects of tobacco consumption that cover 50 per cent of the front and back of cigarette packs. Other tobacco products would carry similar messages.
This report estimates the costs and benefits of the proposed new health warnings from the proposed introduction of the regulations in July 2004 through to 2030. The major estimated costs are health warning printing costs, the loss of income for the tobacco industry, and the loss of government revenue. The major benefits are health improvements leading to greater length and quality of life, savings in health care costs, and income gained by non-tobacco industries.
The evaluation report is based on the central forecast that the health warnings will induce a 3 per cent fall in tobacco consumption. Experts in epidemiology (Begg et al., 2003) forecast that this fall in tobacco consumption will lead to 332 fewer tobacco-related deaths in 2006 and to 488 fewer such deaths in 2021.
To put this in valuation perspective, a saving of 400 deaths with an average of 9 years of life valued at $87,500 per year, with a present value of $622,000 per life, generates a present value benefit of nearly $250 million a year. In addition, there are significant quality of life benefits.
The major cost is the loss of excise and customs revenue which exceeds an estimated $130 million per annum in the early years. In addition, with a 3 per cent fall in tobacco consumption, the tobacco industry may loss net revenue before tax of some $25 million a year as well as incurring significant printing costs.
The economic evaluation indicates that, under likely assumptions, there is a substantial net benefit of over $2 billion from the new health warnings and a benefit cost-ratio greater than 2:1.
The report considers two conservative sensitivity scenarios. One assumes that tobacco consumption will fall by 3 per cent par annum but allows for significantly reduced health outcomes and a lower value of a healthy life year. The other sensitivity test allows for only a 1 per cent reduction in tobacco consumption. In both cases the net benefit would be significantly reduced but it would remain significantly positive.
The report concludes that on balance the social benefits of the proposed health warnings offset the costs. Most of these costs will be borne by government and some by shareholders of the tobacco companies.
3

1 Introduction
1.1 Proposed New Health Warnings
The Australian Government introduced the present warnings on tobacco products in January 1995 under the Trade Practices (Consumer Products Information Standards, Tobacco) Regulations made under the Trade Practices Act 1974.
These Regulations require that all cigarette, loose tobacco and cigar packaging carry one of six specified health warnings (text messages), a corresponding explanatory message, and contents labelling of the tax, nicotine, and carbon monoxide levels of the product. The Regulations also specify the size, colour, and location of these warnings on the packaging. The text messages cover 25 per cent of the front and 33 per cent of the back of cigarette packs. The messages are also shown on pouch tobacco products and cigar boxes.
Recent market research (for example, Eliot and Shanahan, 2000) has found that the impact of the current warnings is declining and that new warnings would be required to sustain an effective decline in tobacco consumption.
Accordingly the Department of Health and Ageing proposes to mandate larger and more graphic health warnings on tobacco products. The proposed new health warnings will carry graphic images of the effects of tobacco consumption and cover 50 per cent of the front and back of cigarette packs with similar warnings on other tobacco products. The Quitline number will also be included on the side of cigarette packs.
These proposals are similar to current practice in Canada which introduced graphic warnings that cover half of the front and back of cigarette packs in January 2001. Brazil introduced large graphic warnings on tobacco products in February 2002.
The current Australian proposal requires that cigarette packs will carry seven new health messages from July 2004 and another seven new health messages from July 2005. These messages would then be rotated annually. Some concessions on rotation may be allowed for products with low turnover. Other details, for example the treatment of existing stocks of tobacco products, will be clarified. Although these issues are substantive, they do not affect the evaluation of the proposed warnings.
The Department proposes that the same 14 warnings and rotation arrangement apply to roll-your-own pouch tobacco as to cigarettes. The health warnings would cover 50 per cent of the front and back of the pouch.
There will also be new, though different, health warnings for cigars. The Government proposes that there will be six sets of health warnings for cigars within the current 25-33 per cent cover of cigar boxes on both front and back. The warning on the front of the pack would include a graphic message. Because of the relatively small runs, the messages will not be rotated. Again, some concessions may be made for products with low turnover. The proposed warnings will not be applied to individual cigar sales.
4

1.2 Aim and Layout of Report Under Commonwealth legislation, the Department is required to prepare a Regulation Impact Statement (RIS) to show the case for the proposed new health warnings. A RIS is required to show that a regulation provides a public benefit. A major part of the RIS is a cost-benefit analysis, which assesses the costs and benefits of the proposed health warnings for consumers, business, government and society as a whole.
This report provides this cost benefit analysis of the proposed new health warnings compared with no policy change. The report does not assess other ways to reduce tobacco consumption.
Chapter 2 outlines the approach to the cost benefit analysis. Chapter 3 describes the likely effects of the new health warnings on tobacco consumption. There follow chapters on the estimated costs and benefits of the proposed health warnings. Chapter 7 provides the overall evaluation. It also describes the likely impacts on producers and consumers of tobacco products as well as on government.
5

2 Approach to Evaluation
2.1 Introduction to Cost-Benefit Analysis
This report estimates the costs and benefits of the proposed new health warnings from the proposed introduction of the regulations in July 2004 through to 2030. As discussed below, the major costs are health warning printing costs, the loss of income for the tobacco industry, and the loss of government revenue. The major benefits are health improvement, savings in health care costs, and income gained by the non-tobacco industry. The report considers the sensitivity of the results to different end years.
The estimated costs and benefits over the period are discounted to present day values using a range of discount rates (5 and 7 per cent rates). Australian governments have traditionally favoured a discount rate of about 7 per cent because this is believed to be the approximate (marginal) rate of return available on alternative uses of capital. However, given current interest rates it is questionable whether the opportunity cost of capital is currently as high as 7 per cent. Moreover, governments sometimes prefer to use lower rates of discount for health and environmental policies which have long term implications for consumer welfare.
The estimated net present value (NPV) is the sum of benefits less costs in present day terms, that is after all costs and benefits have been discounted to the present day. When the estimated NPV is positive the estimated benefits exceed the costs and the policy or project is described as efficient.
However, in determining whether a policy is desirable, the incidence of costs and benefits is generally taken into account. An efficient policy may have undesirable distributional implications. Conversely, a policy with a negative NPV may sometimes be favoured because of its desirable distributional implications.
This report provides estimates of the total costs and benefits of the proposed health warnings and the impacts on separate social groups.
Box 2.1 outlines the main steps in the analysis. The starting point is the forecast impact of the proposed new health warnings on tobacco consumption. The forecast fall in tobacco consumption drives the costs and benefits of proposed warnings. In essence, the report examines the costs and benefits of a switch in expenditure from tobacco to other products along with the cost of achieving this switch.
The main costs and benefits associated with the proposed health warnings are described in the following section. After estimating these costs and benefits, the estimated costs and benefits are aggregated into an overall net present value figure. The evaluation also considers the risks associated with the proposed policy (as well as the risk of not implementing the policy) and the impacts of the policy on different social groups.
6

Box 2.1 Main steps in the cost-benefit analysis
1. Forecast impact of proposed health warnings on tobacco consumption
2. Estimate costs of health warnings to the tobacco industry
3. Estimate benefits to tobacco consumers
4. Estimate impact on government
5. Estimate other industry and household effects
6. Aggregate costs and benefits into an estimated total net benefit value
7. Assess policy risks and uncertainties
8. Consider incidence of the policy on different social groups
2.2 Main Costs and Benefits
The proposed regulations are likely to affect four main groups: the tobacco industry, tobacco consumers, government, and third parties. The tobacco industry includes tobacco growers, manufacturers of tobacco products and their suppliers, importers, and retailers of tobacco products.
In the Australian tobacco industry, the tobacco manufacturers play a dominant role. They process much of the tobacco leaf that they purchase, manufacture most of the tobacco products, control most of the printing on cigarette packages, stock, transport and deliver the tobacco products to the retailer.
Table 2.1 shows the main groups likely to be affected by the proposed regulation and the main potential impacts on these groups.
The tobacco industry faces two main costs. They are the costs of implementing the proposals, principally printing costs, and the loss of net income due to any fall in consumption of cigarettes, loose tobacco, cigars or other tobacco products. Loss of net income equals loss of gross income less reduction in expenses. In practice, printing costs may be passed on to tobacco consumers. Also government will lost some company tax revenue.
7

Table 2.1 Major impacts by social groupSocial group and impact Notes on impacts
1. Tobacco industry costs Tobacco growers Loss of net income Manufacturers of tobacco products Loss of net income, compliance / printing costs Importers of tobacco products Loss of net income Retailers of tobacco products Loss of net income
2. Tobacco consumers’ benefits Longevity, health, productivity, quality of life benefits
3. Government costs and benefits Public health information expenses Net loss of tax revenues Savings in health care expenditures
4. Third party impacts Other industry Gain of economic profit, labour productivity Other third party effects Reduced risk of fires, improved health of babies, lower
passive smoking costs
Turning to tobacco consumers, smoking is estimated to cause nearly 20,000 premature deaths from tobacco-related diseases, which include lung cancer and other cancers, coronary heart disease, chronic obstructive pulmonary disease, and strokes. These diseases reduce life by an average of 9 to 10 years and may greatly impair quality of life before death (see Chapter 5). Thus individuals who give up, or significantly reduce, smoking because of improved awareness of the health risks gain longevity and an improved quality of life. Given that these expenditure switchers are giving up tobacco consumption willingly on the basis of improved information, it may be inferred that individuals who switch expenditure are not losing any consumer surplus.
No allowance is made in this report for losses of consumer surplus. The welfare of smokers who consume as much tobacco as before is unchanged. Those who give up smoking or who reduce their smoking do so because the price of tobacco products exceed their value to them and thus lose no consumer surplus. While they may forego the pleasure of smoking, they gain pleasure from the substitute purchase.
If consumers switch expenditure from tobacco products to other goods, government will lose some tax revenues and gain others. On balance government will lose revenue because of the loss of excise tax and customs duties.1 Relatively few other products attract excise or customs duties. Government may also lose some GST because GST is not payable on about 40 per cent of purchases of other goods. However, government will collect some GST from alternative expenditures. 2 Government may also lose some corporate tax revenue because corporate profits are relatively high in tobacco manufacture. However, income tax on individuals is unlikely to fall with the switch in expenditure.
1 As discussed in Section 3.2, smokers are expected to switch to non-tobacco products rather than to illicitly traded cigarettes.2 GST revenue accrues to the states (less an ATO administration fee).
8

Indirect taxes are sometimes regarded as transfer payments and not therefore included in a cost-benefit analysis. In this case consumers who switch to non-tobacco products no longer pay the excise tax and it may be argued that this represents a saving to them. However, when a consumer switches $x from a tobacco product to a non-tobacco product, it is immaterial to her welfare whether the $x goes to the supplier of the product or to the government. If there were no excise and the $x were to go wholly to the tobacco suppliers instead of partly to government, there would be a loss of producer surplus instead of a loss of excise revenue.
On the other hand, there will be savings in public (and private) health care expenditures because of the reduction in tobacco related morbidities. The savings will occur in hospital costs, general medical services, pharmaceuticals, allied health consultations and care, and in nursing home costs.
A reduction in smoking will also provide significant benefits to third parties. Other industry is likely to gain net income as smokers switch expenditure to non-tobacco products. Other industry may also gain from an increase in workforce productivity. These gains may offset partly the loss of income in the tobacco industry.
In addition, reduced smoking leads to lower morbidity and improved amenity from improved air quality, fewer victims from smoking–related fires, and reduction in perinatal care for low-birth weight babies.
Table 2.2 lists the major costs and benefits that are quantified in this report as well as some of the unquantified factors.
Table 2.2 Quantified and unquantified impacts of reduced tobacco consumptionGeneral cost or benefit Social group Specific cost or benefit
Quantified cost Tobacco industryGovernment
Net loss of income, compliance costsPublic health information costsNet loss of tax revenue
Unquantified cost Government Extra long-term health care expenditures
Quantified benefit Ex-smokersGovernmentOther industry
Benefits of longevity and improved healthSavings in tobacco-related health care costsNet gain in income
Unquantified benefit Third parties Reduced fire riskImproved infant healthGains from lower passive smoking
9

3 Impact of Proposed Health Warnings on Tobacco Consumption
3.1 Trends in Tobacco Consumption
Tobacco consumption has been falling for many years. Table 3.1 shows trends in smoking prevalence: the percentage of male and female adults who smoke. The percentage of male adults who smoke fell from 40 per cent in 1980 to 25 per cent in 2001. The percentage of female adults who smoke fell from 30 per cent in 1980 to 21 per cent in 2001. In the most recent decade, the percentage of all adults who smoke fell from 28 per cent in 1989 to 23 per cent in 2001. Thus, in relative terms adult smoking prevalence fell by 18 per cent between 1989 and 2001 or by 1.4 per cent per annum. Table 3.1 Percentage of adults who smokea Year Male Female1969 45 281980 40 301989 29 271992 28 241995 28 241998 27 252001 25 21(a) 18 years plus. Source: www.quit.org.au
Table 3.2 shows estimated consumption of tobacco products per capita in volume terms (grams) in selected years. In terms of weight of tobacco consumed, cigarettes formed 91 per cent of the market in 2002. Loose tobacco made up 8 per cent of the market and cigars the balancing one per cent.
Table 3.2 Estimated per capita consumption of tobacco productsGrams per person over 15
Year ending 30 June Loose tobacco Cigars Cigarettes Total tobacco products1970 463 26 2836 33261980 289 22 2553 28641990 106 8 1990 21051995 108 5 1543 16561996 113 5 1353 14711997 114 5 1355 14741998 61 5 1301 13641999 96 2 1256 13592000 78 6 1221 13062001 89 6 1117 12122002 96 6 1083 1185
Source: www.quit.org.au
10

Over the period 1970 to 2002, consumption of tobacco products per capita fell by nearly two-thirds. Between 1990 and 2002, it fell by 44 per cent. This represented a fall of just over 3 per cent per annum. Given that adult prevalence declined by about 18 per cent over this period, it may be inferred that nearly half the fall in per capita consumption was due to a decline in prevalence and just over half was due to reduced tobacco consumption by smokers.
3.2 Forecast Impact of Health Warnings on Tobacco Consumption
Given the persistence of the downward trends in smoking prevalence and per capita consumption of tobacco products, these trends may be expected to continue. However, the trends reflect many factors including the impacts of health warnings. Forecasts need to take into account the effectiveness of health warnings as well as other factors.
Market research findings
In a major Australian study of the effectiveness of tobacco health warnings, Elliott and Shanahan (2000) found that 16 per cent of those who quit smoking reported health warnings on cigarette packs were a factor contributing towards quitting. Lantz, Jacobson et al. (2000) point to the need for an integrated, multi-faceted approach to smoking reduction to take advantage of synergies between the facets. The Department of Health and Aged Care (2001) notes that quitting smoking is a process, not an event. Elliott and Shanahan (2002) confirms that health warnings on tobacco products contribute to a growing environment of the unacceptability of smoking and are generally a contributing factor to quitting rather than a sole motivating factor.
On the other hand, Elliott and Shanahan (2000) also found that after six years of exposure the current health messages on cigarette packs are stale, have become less noticed, and lost potency. The report also found that an increasing proportion of smokers acknowledged that smoking affected their health or increased their health risk and agreed that health warnings should be stronger and (Department of Health and Ageing, 2001). Elliot and Shanahan (2000) concluded that there is a need to update the current health warnings to include new information on the health effects of tobacco.
Research has also found that the impact of messages is correlated with the size of the message up to about 60 per cent of pack size, where there are diminishing returns. Drawing on 1632 interviews, Les Etudes de Marche Createc (1999) found that an increase in warning area from 30 per cent to 40 per cent of package would have a significant impact on perception and behaviour. Liefield (1999) found that larger health warnings are effective and that messages with strong emotional appeal were especially important. Recent market research has tested the proposed Australian graphics and text as well as text messages by themselves. The research found that the graphics have more impact and consumers tested thought that graphics were a better approach to the issues.
Market research is generally premised on the idea that behaviour is driven in part by beliefs. Unhealthy behaviour such as smoking is the result of either ignorance of the consequences or
11

feelings of impotence to correct the situation. Communication of appropriate information helps to resolve the situation.
Prochaska and DiClemente (1983) emphasise that interventions must be tailored to the stage the target audience is in along the road to high-involvement behaviour change. Rosenstock (1990) reports that communicating information about the risks and benefits of action can change the knowledge, attitudes, and intentions of target individuals.
Kotler and Andreasen (1995) indicate that individuals are exposed to over a thousand messages in a day, but perceive far fewer. People attend to subjects, themes and images that interest them and ignore other messages. The implication is that tobacco warnings need to be more graphic and more insistent and related to the act of smoking by including them on the pack. These warnings ‘must be sufficiently salient and readable so that consumers will invest the time and effort to understand the information contained’ (Viscusi and Zeckhauser 1996). There is mixed evidence on the effectiveness of fear campaigns but Hastings and MacFadyen (2002) conclude that they have an important place in anti-smoking campaigns.
There is a large literature on the determinants of tobacco consumption, including the effectiveness of health warnings. Some studies use statistical or econometric analysis to estimate quantified relationships between tobacco consumption and its determinants. Other studies use social surveys of smokers and non-smokers to draw out the determining factors.
In a major survey of the literature on the causes and impacts of tobacco consumption, Chaloupka and Warner (1999) found considerable survey evidence that strong health messages have an impact on tobacco consumption. Applied Economics (2003) also reviews the impacts of public health programs on tobacco consumption and concludes that these programs reduced tobacco consumption by the order of 10 per cent. This report took into account the econometric study by Bardsley and Olekalns (1999) that found that Australian health warnings reduced tobacco consumption only by a small amount.
Drawing on the existing literature of all kinds, Canadian work (Hara Associates, 2000) found that health warnings had a long run impact on tobacco consumption ranging from negligible to 13.6 per cent. Hara Associates argued that 6.8 per cent represented a mid-point of the range for the initial impact of labelling and that moving from current to stronger health warnings in Canada could produce an incremental 3.4 per cent reduction in tobacco consumption.
Other Canadian reports support these general findings. Environics (1999a) ran 13 focus groups. The groups considered that the larger health warnings would have more impact and that warnings covering 60 per cent of the package was acceptable. Environics (1999b) describes the opinions of Canadians on the effectiveness of health warning messages based on two surveys one with 2018 adults and one with youth (12 to 18 years). Most respondents considered that the effectiveness of warnings would increase with the size of the warning.
Environics (2000) reported that an estimated 59 per cent of those surveyed believe that increasing the health warnings on cigarette packages would be more effective. Environics (2001) reported that
12

1 in 10 adult smokers and 2 in 10 youth smokers say that health warning messages have reduced the amount that they smoke.
Following the introduction of the new health warnings in Canada, Environics (2003) surveyed 2031 Canadians, including 633 smokers. The report found that the new warnings have had a significant impact. Fifty eight per cent of smokers think more about the health effects of smoking. Forty four per cent of smokers said that the new warnings increased their motivation to give up smoking. Among those who attempted to give up smoking in 2001, 38 per cent said that the new warnings were a factor.
Forecast impacts of health warnings
For the evaluation, this report adopts a central case assumption that the proposed health warnings will reduce tobacco consumption by 3 per cent compared with a business-as-usual (BAU) strategy in which current health warnings continue. This report also tests outcomes ranging from a 1 per cent reduction on tobacco consumption to a 5 per cent reduction. It is recognised that the health warnings could have differential impacts on smokers according to age or sex or other factors. However, this study is not aware of detailed evidence on relative impacts and no differentiation is attempted.
During industry consultations, industry representatives made a number of points about these assumptions. Some representatives (manufacturers and retailers) argued that price is the main determinant of tobacco consumption and questioned whether the proposed health warnings would have any impact on tobacco consumption, especially on male youths. Applied Economics agrees that price is the most important single determinant of consumption. However, the evidence given above suggests that health warnings do have a significant effect on tobacco consumption consistent with a 3 per cent forecast for the proposed graphic warnings.
This report accepts the point made by an industry representative that, to be effective, the proposed health warnings may require support from a concurrent public health promotion program. The cost-benefit analysis (Chapter 7) allows for such a program.
Representatives of the cigar industry contend that the proposed health warnings would have little effect on total cigar consumption (consultations and correspondence, 22 October 2003). One reason is that cigars are intended for palate sensation not for inhalation. A related reason is that, in giving up cigarettes, some consumers switch from cigarettes to cigars (transitional smoking). However representatives of the Department advised the industry that health warnings on cigar products reinforce the message about not smoking tobacco because cigars are not a safe alternative.
Several tobacco industry representatives also argued that the proposed new health warnings on legal products would encourage consumers to switch to illicit products, including undeclared imports, counterfeit and pouch sales. The illicit market, which is believed currently to constitute about 10 per cent of cigarette and loose tobacco sales, carries no health warnings. Illicit products would avoid the cost imposts due to printing health warnings and could appear more attractive because they might be perceived to be less unhealthy. If valid, this would create a revenue loss for government without offsetting health gains. Indeed illicit products are not cured, transported or stored properly.
13

However, the Department considers that there is already intensive monitoring of illicit tobacco trades and that an increase in illicit trade as a result of the new health warnings is unlikely.
Table 3.3 provides forecasts of tobacco consumption to 2031 with a business-as-usual strategy and the proposed health warnings. There are three sets of forecasts: for smoking prevalence rates, per capita consumption of tobacco products, and number of cigarettes consumed.
Table 3.3 Forecast tobacco consumption Year Prevalence ratesa
BAUc New warningsd
Per capita consumption of tobacco productsb
BAUe New warningsd
Cigarettes consumed including illicits (mn)BAUf New warningsd
2001 23.0 23.0 1212 1212 26000 260002006 21.6 21.0 1040 1008 23500 228002011 20.2 19.6 893 866 21250 206002021 17.7 17.2 658 638 17350 168002031 15.5 15.0 484 469 14200 13750(a) Percentage of adults who smoke.(b) Grams per person over 15.(c) Assumes 1.3 per cent fall in prevalence rate per annum and 12.3 per cent fall in 10 years. (d) Three per cent lower than BAU forecast from 2006.(e) Assumes 3.0 per cent fall in tobacco consumption per capita per annum and 26.3 per cent fall in 10 years. (f) Based on 2 per cent per annum decline - see text.
The basic assumptions are (i) that under BAU the rates of decline in prevalence rates and tobacco consumption would fall slightly below their rates of the last 15 years and (ii) that the new warnings would restore the rates of decline to recent trend rates. As discussed above, prevalence rates and tobacco consumption would be 3 per cent lower with the health warnings than in the BAU scenario from 2006 through to 2030. More detailed assumptions are shown in the table footnotes.
As discussed in Chapter 4, the aggregate consumption of cigarettes is not known precisely. Current consumption of legal cigarettes appears to be about 23.5 billion sticks per annum. Adding 10 per cent for illicit cigarettes, total consumption is about 26 billion sticks per annum.
Table 3.3 shows forecast total consumption including illicit sales. For BAU, this study allows for a 1 per cent increase per annum in population and a 3 per cent fall in per capita consumption of tobacco products per annum. Accordingly, in the BAU scenario, total cigarette consumption is forecast to fall by 2 per cent per annum. With the health warnings, total consumption would be 3 per cent lower than the BAU forecast from 2006.
Some industry representatives have suggested that as the industry would pass on the increase in printing costs to consumers, the price effect will further reduce sales. However, this impact is likely to be insignificant. The annualised cost of any increase in printing costs would be under 0.2 per cent of total retail turnover of about $8 billion. With a demand elasticity of about 0.4, any passing on of costs would reduce cigarette consumption by under 0.1 per cent.
14

As noted above, representatives of the cigar industry advise that there has been little change in the volume of cigar sales in recent years. In their view, the health warnings may constrain any potential for growth but are unlikely to reduce sales significantly. This view is accepted in this report.
15

4 Estimated Costs to Tobacco Industry and Government
4.1 The Tobacco Industry
The tobacco industry comprises tobacco leaf growing and processing, manufacturing of products, and distributing and retailing tobacco products.
In Australia, the three main suppliers of tobacco products (Philip Morris Limited, British American Tobacco Australasia Ltd, and Imperial Tobacco Australia Ltd) control most of the leaf processing and the distribution of products as well as the manufacture and importing of products. The three companies account for all cigarette production and virtually all cigarette sales in Australia, for most sales of roll-your-own pouch tobacco, and for a few cigar imports. Phillip Morris and British American Tobacco share slightly over 80 per cent of the cigarette market while Imperial Tobacco supplies slightly less than 20 per cent.
All three companies are wholly foreign owned. British American Tobacco Australasia Ltd (BATA) is a wholly owned subsidiary of British American Tobacco International. Phillip Morris Australia Ltd. (PM) is a wholly owned subsidiary of Phillip Morris International, USA. Imperial Tobacco Australia Ltd (ITA) is wholly owned by Imperial Tobacco UK.
The balance of the market is imported particular brands of cigarettes and cigars. All cigars are imported. Swedish Match Pty. Ltd and Stuart Alexander & Co Pty Ltd account for a high proportion of the remaining market. Stuart Alexander is locally owned firm that imports tobacco products. There are also a few small Chinese and Korean importers.
Table 4.1 shows selected key statistics for the tobacco industry, drawing on four sources. The first source is PriceWaterhouseCoopers (2001) which provides an overview of the tobacco industry in 1999/2000. Second, BATA provided some industry data for 2002. The third source is the VicHealth website, which provides a useful summary of tobacco-related statistics, mainly drawn in turn from the Australian Bureau of Statistics. Table 4.1 shows some key statistics for excise and customs duty as well as recommended retail prices. Fourth, the table shows some industry supplied statistics for the cigar industry. Inevitably there are some discrepancies between these figures.
Consumption of tobacco products
In 2002, the three cigarette companies sold an estimated 24.0 billion sticks to retailers. This included estimated imports of 800 million sticks. On the other hand industry (AC Nielsen) figures indicated that sales to consumers totalled only 22.6 billion. The reason for this difference is not known. Under-reporting by retailers is a possible explanation.
If we take Australian consumption of legal cigarettes to be 23.5 billion sticks per annum and average retail value to be about $0.34 per stick, the retail value of legal Australian consumption is about 8.0 billion.
.
16

Table 4.1 Selected key statistics for tobacco industryUnit Period Value Source
Value of retail salesa $m 1999/2000 $7347 million PWCValue of output ex factory $m 1999/2000 $6614 million PWCValue of domestic leaf sold $m 1999/2000 $53 millionb PWCValue of imported leaf $m 1999/2000 $81 million PWCValue added Wages and salaries $m 1999/2000 $650 million PWC Profit and depreciation $m 1999/2000 $510 million PWC Indirect taxesc $m 1999/2000 $5091 million PWC Inputs excluding leaf $m 1999/2000 $1157 million PWCEmployment Growing No. 1999/2000 311 PWC Manufacturing No. 1999/2000 3270 PWCImports Tobacco leaf $m 1999/2000 $81m PWC Tobacco products $m 1999/2000 $130m PWCVolume of leaf production Tonnes 1999/2000 9000 tonnes PWCProduction of cigarettes No 1999/2000 26.2 billion PWC
Cigarette sales to retailers No 2002 24.0 billion BATAd
Retail sales to consumers No 2002 22.6 billion BATAd
Excise and customs duty Cigarettes per stick $ 2003 $0.21804 /stick VicHealth Loose tobacco $ 2003 $272.55 per kg VicHealth Cigarettes excised No 2001-02 22613 million VicHealth Cigarettes imported No 2001-02 801 million VicHealth Excise $bn 2002/03 $5.14 billion VicHealth Customs duty total $m 2001/02 $399 million VicHealth Customs duty cigarettes $m 2001/02 $170 million VicHealthRecommended retail prices Peter Jackson $ 2003 $0.36 / stick VicHealth Winfield $ 2003 $0.38 / stick VicHealth Drum (RYO) 50g $ 2003 $20.60 VicHealth
Value of cigar sales $m 2003 $92 million ConsultationsCigar sales (= imports) No. 2003 73 million Consultations
(a) Legal sales include small proportion of imported finished tobacco products, including cigarettes, cigars, pipe and roll-your-own tobacco.
(b) These are legal sales. There is an estimated $9 million in Chop Chop (illegal) sales.(c) Taxes paid by three major tobacco companies. They includes $5,071 million in excise tax and $20 million
in other indirect taxes including payroll taxes. (d) Based on AC Nielsen – Industry Exchange of Sales Year 2002.
Sources: PriceWaterhouse Coopers, 2001. British American Tobacco Australasia, VicHealth Centre for Tobacco Control (drawing on ABS and other sources). Swedish Match P/L.
17
As shown in Chapter 3, in terms of weight roll-your-own pouch tobacco accounts for about 8 per cent of tobacco consumption. In terms of value, it accounts for about 5 per cent of tobacco consumption
In addition, an estimated 73 million cigars consisting of over 800 different types are sold in Australia each year with an estimated wholesale value of $66 million. Fourteen cigar lines account for 80 per cent of the market. Mark ups vary greatly, starting from 30 per cent. Allowing for an average mark up of 40 per cent, the total retail value would be $92 million. All cigars are imported and bear import duty. Informal imports over the internet and via other channels could increase this total by some 5 per cent.
These figures are consistent with the ABS estimate of $9.2 billion household expenditure for all tobacco products, which would presumably include some expenditure on illicit sales.
Tobacco leaf production
In 1999/2000, Australia’s 300 tobacco leaf producers supplied around 40 per cent of the domestic demand for leaf from 3200 hectares devoted to growing tobacco. Tobacco leaf was grown in the Mareeba-Dimbulah area in north Queensland and the Glasshouse Mountains area of southern Queensland and in the Myrtleford area in north-east Victoria. However there is virtually no growing now in Southern Queensland.
The volume of local leaf production has now fallen to about 6000 tonnes. About 11000 tones are currently imported. BATA purchases about 55 per cent of its leaf through imports and 45 per cent locally, partly because the major Winfield brand has high local inclusion rate. PM’s use of Australian tobacco leaf has fallen below 30 per cent of its tobacco purchases. Leaf production is dominated by China, India, Brazil and the United States. It seems likely that the tobacco manufacturers will shortly terminate some 100 contracts with North Queensland tobacco growers because the quality and price of tobacco produced in Queensland are not comparable with overseas tobacco. The harvest is dried on farm and the on-farm storage is poor. The manufacturers forecast a continuing decline in the purchase of Australian tobacco.
BATA processes overseas tobacco leaf at Bundamba, Queensland. The Victorian Tobacco Cooperative processes all Victorian tobacco leaf in Myrtleford, Victoria.
Manufacture and imports of tobacco products
BATA and PM have large manufacturing and packaging plants in Australia. BATA manufactures and packages tobacco products in Eastgardens, Sydney. As well as producing cigarettes, BATA manufactures pouch tobacco locally. The company also imports some cigars and a few cigarette brands. ANZPAC, a wholly owned subsidiary of BATA located in Smithfield in western Sydney, provides printing and packages for BATA.
18

PM manufactures its cigarettes from its manufacturing plant at Moorabin, Victoria. AMCOR provides printing for PM in Moorabin and Sydney. PM focuses on the supply of cigarettes. The company has 192 stock keeping units (SKUs) for cigarettes. It also imports some 30 cigar brands. It does not produce roll your own tobacco or any other tobacco products.
ITA contracts all manufacturing to BATA’s plant in Eastgardens and its printing requirements to ANZPAC and AMCOR. ITA does not have an independent Australian production facility.
Cigarettes account for about 83 per cent of ITA turnover. ITA sources 85 per cent of its cigarettes in Sydney and the rest of its cigarettes mainly from New Zealand, Germany, Holland and the UK. ITA imports loose tobacco products, accounting for some 17 per cent of its total turnover, from Holland, UK and New Zealand.
Retailing of tobacco products
Table 4.2 shows the estimated distribution of retail sales in 1997, the latest year for which detailed data on sales by retail outlets are apparently available. In that year, supermarkets and large groceries sold over a third of all tobacco products and specialist tobacconists had a 20 per cent market share. Given recent trends in retailing, supermarkets and large groceries are now likely to account for to 40 per cent of the market and specialist tobacconists for less than 20 per cent of the market. The latter are of course highly dependent on the tobacco industry.
Table 4.2 Retail outlets for tobacco products in 1997Retail outlet Value of
tobacco products ($m)
Percentage of total market (%)
Tobacco sales as % of total sales (%)
Gross margin from sales of tobacco products($m)a
Supermarketsb 2485 35.2 7 248Tobacconists 1425 20.1 95 85Petrol stations 1140 16.1 30 228Mixed businesses 1050 14.9 10 210Convenience stores 363 5.1 33 54Newsagents 329 4.7 8 53Hotels and clubs 133 1.9 1 33Liquor stores 94 1.3 2 19Other premises 39 0.5 1 12Total 7058 100.0 9 942(a) Gross margin is sale revenue less purchase costs.(b) Including grocers.
Source: PriceWaterhouseCoopers, 1999.
19

Retail prices and taxes
As at mid-2003, the recommended selling prices (RSP) of major cigarette brands such as Peter Jackson 30s, Winfield 25s and Longbeach 40s, was about $0.36 per stick. However this includes a recommend retail mark up of about 14 per cent. As a result of strong competition among retailers, retail mark-ups are often only 6-8 per cent in supermarkets and specialist tobacconist stores and as high as 14 per cent only in corner stores. With an average mark up of 10 per cent, the average sale price would be around $0.345 per stick.
Of this average price per stick, $0.218 represents Federal Government excise and $0.031 represents GST. Of the remaining $0.095 per stick, the tobacco grower receives about $0.005, the cigarette manufacturer receives $0.06, and the retailer receives $0.03.
An average packet of roll-your-own pouch tobacco retails for about $20 per 50 grams. Excise on roll your own (pouch) tobacco is similar to, but very slightly lower than, excise on cigarettes.
4.2 Implementation Costs
The major implementation costs are the preparation and production of the new packages for cigarettes, pouch tobacco and cigars. The costs for locally produced cigarettes and pouch tobacco will be borne initially by AMCOR and ANZPAC. These companies have provided estimates of the costs involved (see Appendix A).
Printing the new graphic health warnings would require pack design changes for most products and various capital purchases and costs for both gravure and lithographic processes. The costs include:
Capital costs. Purchase of new print units and machine modifications. Site costs. Structural changes to factories. Tooling costs. Remaking the cutting and embossing forms. Engraving cost. A new library of cylinders will need to be engraved. Down time costs. Loss of capacity to service other customers.
As shown in Appendix A, ANZPAC estimate that the capital costs at its Smithfield plant would be about $6.8 million. AMCOR estimates that its costs would total $6 million at its Moorabbin plant and $3.2 million at its Botany plant. The various printing costs total $16 million.
The recurrent printing costs associated with the proposed regulations appear to be closer to $100,000 per annum than to $1.0 million and are ignored in the economic evaluation. However, AMCOR advises that much of the plant and equipment would have to be replaced after about 10 years. For the cost-benefit analysis, we have allowed a one-off complete replacement of all capital costs in year 11. Both printing companies have advised that it will be difficult to meet a July 2004 deadline for implementing the changes (see AMCOR submission).
20

Warnings present special problems for imported and ancillary tobacco products, which are often produced and sold in small numbers. However, the costs associated with imported tobacco products are difficult to estimate because of the number and variety of imported products and uncertainty about the detailed requirements.
Swedish March estimate that the cigar industry costs of compliance with the proposed health warnings would be $1.2 million.
The economic evaluation in Chapter 7 allows a cost of $2 million in years 1 and 11 for all compliance and implementation costs other than those incurred by ANZPAC and AMCOR.
4.3 Loss of Net Income from Tobacco Sales
As discussed in Chapter 2, all main elements of the tobacco industry may lose net income due to a loss of turnover. This is the loss of gross income less the cost of producing that income. The marginal cost of producing and selling an additional 3 per cent of cigarettes is likely to be below the average cost of producing and selling cigarettes.
Starting with local tobacco growing, the growers currently receive about $6.5 per kg of leaf. For 6000 tonnes, this is about $39 million per annum. This figure is likely to fall as local cigarette manufacturers turn increasingly towards imported leaf. Assuming a fall in sales of 3 per cent due to the health warnings, in line with the fall in total consumption forecast in Chapter 3, local growers would lose gross income of about $1.0 million per annum.
Discussions with the Victorian Tobacco Cooperative indicated that specialist tobacco growers achieve 80 tonnes of leaf per annum. Other farmers grow only 10 tonnes of tobacco as a side product of other activities. Assuming that the marginal cost of producing tobacco leaf is 50 per cent of revenue, the net loss of income to growers would be around $0.5 million per annum.
From Table 3.3, the proposed health warnings would reduce forecast total consumption of cigarettes, including illicit cigarettes, as follows:
2006 700 million sticks2011 650 million sticks2021 550 million sticks2031 450 million sticks
The numbers fall over time because forecast BAU consumption of cigarettes falls. The major manufacturers and importers of tobacco products would lose about 90 per cent of these sales.
As notes above, the major cigarette manufacturers receive a gross margin of about $0.06 per stick, which is the value of a sale to a retailer less excise tax and cost of leaf purchases.
21

Drawing on data in Table 4.1, in 1999 the value of output ex factory less indirect taxes was $1523 million. Inputs excluding leaf were $1157 million. Thus the companies made an estimated surplus of $366 million. This implies that the companies made a surplus of 24 per cent on each dollar of sales made (excluding excise taxes).
These figures are consistent with more recent annual accounts. For the year ending 2002, PM reported gross revenue of $615 million and profits before income tax of $173 million. For the year ending September 2002, ITA reported gross income of $269 million and profits of $39 million before income tax. For the year ending December 2000, BATA reported an operating profit before income tax of $172 million on a turnover after excise payment of $1025 million. Note that these figures include export-related transactions.
Marginal production costs are most likely below average costs. This evaluation allows that 50 per cent of the revenue per marginal stick sold is surplus that would be lost with a fall in sales. Thus there would be a loss of pre-tax surplus of $0.03 per stick. For a loss of 630 million sticks (90 per cent of 700 million) in 2006, the three major companies would loss about $19 million in pre-tax profits.
In consultations, some company representatives expressed concern about losses of brand values and stated that it could be difficult to maintain low volume brands. This report considers that these losses are included in the costs assessed above (some $19 million in 2006) and are not additional costs.
Retailers would also lose income on the fall in sales shown above. Cigarettes are high volume, low-space, commodities that are attractive to retailers. However this is partly what drives down the gross margins. We allow a loss of surplus of $0.015 per stick. This would represent a loss of about $9.5 million in 2006.
Losses on sales of roll-your-own products are treated pro-rata with losses on cigarettes. Thus an additional 5 per cent is allowed for these losses.
As discussed in Chapter 3, cigar sales and profit margins are not expected to be affected by the new health warnings other than as a result of the higher printing costs.
Note that all the losses are pre-tax losses borne initially by the industry. However, with a corporate tax of 30 per cent, after tax industry may bear 70 per cent of these losses and the government may bear 30 per cent of the losses.
4.4 Impact on Government Revenue
As discussed in Chapter 2, government will lose excise tax and customs duties due to the fall in sales on both cigarettes and customs duties.
In 2006, government would lose excise and customs revenue on approximately 630 million sticks (being 90 per cent of 700 million sticks). With a loss of revenue of $0.218 per stick, government
22

would lose $135 million in annual revenue. This would fall to a loss of $108 million in 2021. The economic evaluation allows for an additional 5 per cent loss of excise on loose tobacco products. These figures assume that consumers of tobacco products do not switch to other excised goods. The report does not allow for any offsetting excise or customs duty on expenditure switched to other commodities.
On the other hand, the report makes no allowance for any loss in GST revenue. Government may lose some GST because GST is payable on all tobacco products but is not payable on about 40 per cent of other goods and services purchased in Australia.
As noted above, government may lose tax revenue from the fall in the profits of the tobacco industry. On the other hand, it may gain income tax revenue from the switch in expenditure to other goods and services (see further discussion in Chapters 6 and 7).
In so far as the population is healthier and more productive, personal income tax could increase, but most health benefits accrue to retired persons and income tax gains would probably be small.
23

5 Forecast Health Improvements
5.1 Introduction
Tobacco is responsible for a large number of morbidities. The national burden of disease study (Mathers et al. 1999) estimated that in 1996 tobacco consumption was responsible for 16,875 deaths and 242,138 DALYs. As shown in Table 5.1, lung cancer, chronic obstructive pulmonary disease and coronary heart disease accounted for 80 per cent of these deaths.
Table 5.1 Attributable Burden of tobacco smoking in Australia in 1996Condition Attributable
deathsAttributable YLL
Attributable YLD
Attributable DALYs
Percentage of DALYs
Lung cancer 6,262 69,662 6,267 75,929 31.3COPD 4,645 40,464 19,322 59,786 24.7Heart disease 2,507 32,317 6,254 38,571 15.9Other 3,461 40,937 26,916 67,852 28.0Total 16,875 183,380 58,759 242,138 100.0Source: Mathers et al. 1999, Table 7.1.
Looking at the total figures, the following ratios can be inferred:
Attributable DALYs per attributable death 14.3 Attributable YLL per attributable death 10.9 Attributable YLD per attributable death 3.5 Attributable YLD / attributable YLL 0.32
For this report, the Department of Health and Ageing commissioned Professor Lopez (University of Queensland) and associated researchers to provide estimates of mortality and morbidity impacts of changes in tobacco consumption in 2011 and 2021. Their report (Begg at al. 2003) is provided in Appendix B along with their detailed tables for the BAU scenarios and a 3 per cent fall in tobacco consumption. The main procedures and findings are summarised below.
5.2 Forecast Health Improvements
For the BAU scenarios, Begg et al. (2003) forecast mortality from all causes for 2006, 2011 and 2021 by extrapolating observed mortality rates over the period 1979 to 2001 using a log-linear Poisson regression model and applying these mortality rates to population forecasts by the Australian Bureau of Statistics. Mortality was classified in 51 clinically meaningful conditions.
For the tobacco reduction scenarios, Begg et al. based their forecasts of lung cancer on a comparison of observed lung cancer mortality rates in smokers and non-smokers for different population groups. To estimate mortality attributable to smoking from causes other than lung cancer, the study used a reference population of smokers and non-smokers with known mortality rates and applied this to the forecast Australian population.
24

To allow for lost quality of life, Begg at al. draw on the concept of a disability-adjusted life year (DALY) lost. One DALY is equivalent to one year lost of healthy life. With a DALY, a disability weight of 0 represents perfect health and a weight of 1 represents death. 3 If a health state has a DALY value of say 0.33, being in that state for three years is equivalent to losing one year of healthy life (i.e. one DALY). The basic source for estimates of DALYs in Australia is Mathers et al. (1999), who estimated DALYs in 1996 for a large number of diseases and health states in Australia.
For any morbidity, the total health cost to an individual is the sum of years of life lost due to premature death (YLL) and equivalent years of healthy life lost due to disability (YLD). Thus total DALYs are:
DALYs = YLLs + YLDs (5.1)
In the Begg et al (2003) report,
Projected YLL – projected deaths × YLL conversion factorProjected YLD = projected YLL × YLD:YLL ratio from Mathers et al. (1999).
The YLD estimate assumes that the contribution of the loss of quality of life to the total burden of disease will be constant for each type of morbidity.
Table 5.2 shows forecast tobacco related death and DALYs for the BAU scenarios and for a 3 per cent decline in tobacco consumption. Begg et al. (2003) forecast that a 3 per cent decline in tobacco consumption from the start of the new warnings (assumed to be July 2004) will result in a 1.7 per cent decline in premature deaths and DALYs in 2006 rising to a 2.6 per cent decline in premature deaths and DALYs in 2021.
It may be noted that the estimated ratio of DALYs to deaths is a little lower than in Mathers et al. (1999). The estimated ratio is 12.3 in 2006 and falls to 10.4 in 2021.
Drawing on both the information provided by Mathers et al. (1999) and Begg et al. (2003), this report makes the following assumptions:
Average years of life lost due to tobacco-related early death in 2006 9 years Average years of life lost due to tobacco-related early death in 2006 8 years The DALY ratio of YLD to YLL 0.30
The third assumption means that the cost of years of disability is assumed to be 30 per cent of the cost of years or life lost.
3 A disability-adjusted life year may be viewed as the converse of a quality adjusted life year (QALY). With a QALY, 1.0 usually represents perfect health and 0 represents being dead.
25

Table 5.2 Forecast tobacco-related deaths and DALYsPremature Deaths
BAU 3% tobacco fall Difference
Nos. %
2006 19,712 19,380 332 1.72011 19.751 19,337 414 2.12021 18,745 18,257 488 2.6
DALYs BAU 3% tobacco fall
Difference Nos. %
2006 242,260 238,116 4114 1.72011 226,587 221,750 4836 2.12021 195,283 190,196 6087 2.6
DALY / premature death BAU 3% tobacco fall
Difference Nos. %
2006 12.28 12.28 - -2011 11.47 11.47 - -2021 10.41 10.41 - -Source: Begg et al., 2003, Appendix B.
Table 5.3 and 5.4 give additional forecasts for premature deaths and DALYs respectively for 2006, 2011 and 2021. It may be observed that the figures are directly proportional to the assumptions about tobacco consumption. The deaths saved with a 1 per cent fall in tobacco consumption are one-third of those with a 3 per cent fall in tobacco consumption. On the other hand, deaths saved with a 5 per cent fall in tobacco consumption are two-thirds higher than with a 3 per cent fall in tobacco consumption These forecasts are adopted in the sensitivity tests in the evaluation in Chapter 7.
Table 5.3 Further forecasts of tobacco related deathsBAU Fall in tobacco consumption
1% 3% 5%2006 19,712 19,601 19,380 19,1602011 19,751 19,613 19,337 18,7452021 18,745 18,582 18,257 17,932Source: Begg et al., 2003.
Table 5.4 Further forecasts of tobacco related DALYs
BAU Fall in tobacco consumption 1% 3% 5%
2006 242,260 240,879 238,116 235,3542011 226,587 224.974 221,750 218,5262021 195,283 193,587 190,196 186,805Source: Begg et al., 2003.
26

6 Estimated Benefits of Health Warnings
6.1 Benefits of Health Improvements
Personal health benefits are a function of length and quality of life. Chapter 5 provided the epidemiological forecasts of deaths and DALYs averted as a function of tobacco consumption. This section provides the valuation parameters.
The basic value needed is the value of a life year. As observed in Chapter 5, premature deaths results in the loss of an average number of years of life. The cost of these lost years can then be factored up to account for the associated loss of quality of life before the early death occurs.
In this study, we follow the standard approach in the economics literature and derive the value of a healthy year from the value of life. For example, if the estimated value of life is $2.0 million, the average loss of healthy life is 40 years, and the discount rate is 5 per cent per annum, the value of a healthy year would be $118,000.4 Tolley et al (1994) review the literature on valuing life and life years and conclude that a range of US$70,000 to US$175,000 per life year is reasonable. In a major study of the value of health of the U.S. population, Cutler and Richardson (1997) adopt an average value of US$100,000 in 1990 dollars for a healthy year.
Although there is an extensive international literature on the value of life (Viscusi, 1993), there is little Australian research on this subject. The BTE (2000) adopted estimates of $1.0 million to $1.4 million per fatality, reflecting a 7 per cent and 4 per cent discount rate respectively. The higher figure of $1.4 million is made up of loss of workforce productivity of $540 000, loss of household productivity of $500 000, and loss of quality of life of $319 000. This is an unusual approach that combines human capital and willingness to pay concepts and adds household output to workforce output.
As the Bureau of Transport Economics (BTE, 2000) notes, international research on willingness-to-pay values usually places a higher value on life at between A$1.8 and A$4.3 million. Abelson’s (2003) survey of international values for life shows that the European Union has adopted a value of about A$2.5 million per fatality and that this is at the lower end of the research findings, which range up to $10 million and even beyond. Abelson proposes that A$2.5 million is an appropriate standard for Australian public policy requirements.
If we were to assume a value of life of $2.5 million, 40 years loss of life and a utility (or consumer) rate of discount of 3 per cent, the value of a life year (or a DALY) would be $108,000. This is a comprehensive value for the cost of a morbidity, which includes the cost of pain and suffering and loss of quality of life as well as loss of productivity.
4 In round numbers, $2,000,000 = $118,000/1.05 + $118,000/(1.05)2…+ $118,000/(1.05)40.
27

The value of a DALY would be higher if a higher discount rate were used. On the other hand, the value of a DALY would be lower if a more conservative value of life of say $1.5 million were adopted, which is more in line with recent Australian practice. A value of life of $1.5 million combined with 40 years of life and a 5 per cent discount rate would produce a value for a healthy life year of $87,500. This report adopts this value ($87,500) for a life year for its central case evaluation.
Finally, to estimate the value of life lost in any year, it is necessary to estimate the present or discounted value of 9 or 8 years of future life lost. Using a discount rate of 5 per cent, the following values are used for loss of life in the economic evaluation:
Loss of 8 years $566,000 Loss of 9 years $622,000
6.2 Savings in Public Health Expenditures
Government will save health treatment costs, inclusive of hospital, medical, pharmaceutical and other costs, associated with reduced smoking-related morbidities. Given that this report is based on the unit of a DALY, we estimate that health care costs associated with a DALY for morbidities related to tobacco smoking.
Drawing on Mathers et al. (1999), Table 6.1 shows estimated health care costs associated with lung cancer, COPD and ischaemic heart disease in 1993/94 and the respective estimated DALYs in 1996. Note that the figures are morbidity from all causes, not just from tobacco consumption. As shown, total health care costs in 1993/94 were $1.30 billion and the DALYs in 1996 were 494,763. Thus the average cost per DALY in 1996 was $2629 in 1993/4 expenditures and prices.
Allowing for 20 per cent inflation in the 10 years to 2003, the cost per DALY figure would be $3150 in 2003 prices. Alternatively, allowing 12 DALYs per early death, the cost is about $37,000 per early death. Given about 240,000 DALYs per annum related to tobacco consumption, the gross cost of health care treatments related to tobacco-induced morbidity would be about $765 million.
Table 6.1 Health care costs associated with three morbidities (from all causes)Condition Health care costs in 1993/94 ($m)
Hospital Medical Pharmacy Other TotalDALYs in 1996
Cost/DALY
Lung cancer 81 7 3 17 107 90,521 1,182COPD 112 61 66 61 300 93,182 3,219Ischaemic heart disease 574 88 105 127 894 311,330 2,871
Total 767 156 174 205 1301 494,763 2,629Source: Mathers et al. 1999.
28

Of course, health care expenditures are not related directly to DALYs because they are designed to avert or reduce the burden of disease. Estimated DALYs reflect the disease burden not averted by the health system. Nevertheless the estimated costs indicate the size of the financial burden associated with tobacco smoking. Also, the figure of $3150 per DALY can be taken to indicate the approximate benefit of a reduction in DALYs. This is the value parameter employed in the evaluation in Chapter 7.
6.3 Benefits to Non-Tobacco Industries
Our central case estimate of a 3 per cent decline in consumption of cigarettes and pouch tobacco would result in a significant switch in expenditure to non-tobacco products. In 2006, the switch would be in the order of $225 million, made up of $214 million in lower expenditure on cigarettes produced by the three major manufacturing companies and a balance of about $10 million on ancillary products. This assumes no switch out of illicit products. In 2021, the switch in expenditure would be an estimated $165 million.
Just as the tobacco industry loses some profits from the loss of turnover, other industries gain from the switch in expenditure. Chaloupka and Warner (1999) report on a number of international studies that show that the income and employment gains in the non-tobacco industries are broadly similar to the income and expenditure losses in the tobacco industry. These studies draw on a variety of macroeconomic and regional economic studies.
The gains from an expenditure switch depend on the difference between extra gross income obtained and the marginal costs of providing these goods. Much depends on the way in which expenditure is reallocated, in particular whether it is reallocated towards competitive industries where margins are small or to imported goods where there are no local surpluses. It is not possible to estimate in detail in this report how expenditure would be reallocated and the consequent gains in net income.
We saw in Chapter 4 that the cigarette manufacturers achieve an estimated surplus of 24 per cent on each dollar of gross margin (6 cents per stick) and the evaluation allows that the manufactures make a profit of 50 cents on each marginal dollar of gross margin revenue. In the more competitive retail sector, the retail margin is only 10 per cent of revenue and the surplus on the marginal dollar was assumed to be 50 per cent of the retail margin.
For the central case evaluation, this report allows that non-tobacco industry achieves a 7.5 per cent surplus on each dollar switched to non-tobacco products. Thus the surplus on non-tobacco products in 2006 would be $17 million. This is about half the surplus that the tobacco industry loses in 2006. The differential reflects the smaller gaps between prices and marginal costs in the more competitive non-tobacco industries than in the tobacco industry.
29

6.4 Unquantified Benefits
There many other social costs of smoking that are generally not costed (Chaloupka and Warner, 1999). These costs include the costs of victims of burns and other morbidities from smoking–related fires, perinatal care for low-birth weight babies, and complications with illnesses such as diabetes that are not directly associated with smoking. Collins and Lapsley (2002) quote work by the Queensland Fire and Rescue Service which indicates that smokers’ materials are responsible for 1.9 per cent of fires in Queensland. Few studies attempt to cost the environmental impact of passive smoking on morbidity as well as the disamenity created by tobacco-polluted air, and costs of increased frequency of laundering. Few studies estimate the pain and suffering of relatives and friends of tobacco-smoking victims.
These costs are cumulatively quite significant. However, in the absence of a solid basis for estimating these costs, this report does not attempt to quantify these costs.
30

7 Evaluation of Proposed Health Warnings
7.1 Central Case Results
The results of the evaluation using best estimates (central case assumption) are shown in Table 7.1. The evaluation runs from 2004 to 2030 and uses a 5 per cent discount rate. The evaluation is based on forecasts for 2006, 2022 and 2021, with figures for other years estimated by interpolation or extrapolation.
A key central case assumption is that the health warnings will induce a 3 per cent fall in tobacco consumption. Begg et al (2003) forecast that this fall in tobacco consumption will lead to 332 fewer tobacco-related deaths in 2006 and to 488 fewer such deaths in 2021.
To put this in valuation perspective, a saving of 400 deaths and 9 years of life valued at $87,500 per year in each case, with a present value of $622,000 per life, generates a present value benefit of nearly $250 million a year. In addition, there are significant quality of life benefits. Other estimated benefits include health care savings and gains to non-tobacco firms.
The major cost is the loss of excise and customs revenue which exceeds an estimated $130 million per annum in the early years. In addition, with a 3 per cent fall in tobacco consumption, the tobacco industry may loss net revenue before tax of some $25 million a year as well as incurring significant printing costs.
In aggregate the estimated present value of the benefits exceeds the present value of the costs by $2.9 billion. The estimated ratio of discounted benefits to discounted costs is 2.4:1.
7.2 Sensitivity Tests
As usual in major policy issues, there are many uncertainties. This report focuses on two sets of issues that consider possible downsides to the results.
Sensitivity test one assumes a 3 per cent reduction in tobacco consumption but also allows:
A 40 per cent reduction in value of health benefits, which allows for both a lower value of life and for some reduction in the deaths and DALYs averted;
A 7 per cent discount rate; An evaluation period from 2004 to 2021.
The full results are shown in Table 7.2. Despite these conservative assumptions, the estimated net present value (the net benefit) is $454 million and the estimated BCR is 1.3: 1
Sensitivity test two allows for only a 1 per cent reduction in tobacco consumption resulting from the health warnings. Table 7.3 shows the results. In this case, there is a significant decline in costs as well as in benefits. The estimated net benefit falls to $905 million but the BCR falls only to 2.2: 1.
31

Table 7.1 Cost-Benefit Analysis of Proposed Health Warnings: Central Case ($m 2003 prices) (a)
2004 ‘05 ‘06 ‘07 ‘08 ‘09 ‘10 ‘11 ‘12 ‘13 ‘14 ‘15 ‘16 ‘17 ‘18 ‘19 ‘20 ‘21 ‘22 ‘23 ‘24 ‘25 ‘26 ‘27 ‘28 ‘29 ‘30Costs to tobacco industry Printing costs - cigarettes (b) 16 0 0 0 0 0 0 0 0 0 0 16 0 0 0 0 0 0 0 0 0 0 0 0 0 0 0 Printing costs - cigars/other (b) 2 0 0 0 0 0 0 0 0 0 0 2 0 0 0 0 0 0 0 0 0 0 0 0 0 0 0 Loss of gross profits (cigarettes) (c) Tobacco growers 0 1 1 1 1 1 1 1 1 1 1 1 1 1 1 1 1 1 1 1 1 1 1 1 1 1 1 Manufacturers 8 19 19 19 19 18 18 18 17 17 17 16 16 16 16 15 15 15 15 15 14 14 14 13 13 13 12 Retailers 4 9 9 9 9 9 8 9 8 8 8 8 8 8 8 7 7 7 7 7 7 7 7 6 6 6 6Total 30 29 29 29 29 28 27 28 26 26 26 43 25 25 25 23 23 23 23 23 22 22 22 20 20 20 19
Gross costs to government Information programs 5 5 0 0 0 0 5 0 0 0 0 5 0 0 0 0 0 0 0 0 0 0 0 0 0 0 0 Loss of excise/customs revenue 70 139 137 135 133 131 129 128 126 124 122 120 118 116 114 112 110 108 106 104 102 100 98 96 94 92 90Total 75 144 137 135 133 131 134 128 126 124 122 125 118 116 114 112 110 108 106 104 102 100 98 96 94 92 90
Total costs 105 173 167 164 162 159 161 155 152 150 148 168 143 141 139 135 133 131 129 127 124 122 120 116 114 112 109
Benefits Value of increased length of life 0 100 206 215 225 235 245 257 262 267 272 277 282 287 292 297 301 304 304 304 304 304 304 304 304 304 304 Value of increased quality of life 0 30 62 65 68 71 74 77 79 80 82 83 85 86 88 89 90 91 91 91 91 91 91 91 91 91 91 Health care savings government 0 6 13 13 13 14 14 14 14 15 15 16 16 17 17 18 18 19 19 19 19 19 19 19 19 19 19 Gains to non-tobacco firms 0 16 16 16 16 15 15 15 15 15 14 14 14 13 13 13 13 13 12 12 12 12 11 11 11 11 11Total benefits 0 152 298 309 322 335 348 364 370 377 383 390 397 403 410 417 422 427 426 426 426 426 425 425 425 425 425
Net benefits -105 -21 131 145 160 176 187 209 218 227 235 222 254 262 271 282 289 295 297 299 302 304 305 309 311 313 316
NPV @ 5% 2,860BCR @ 5% 2.35
a) Figures to nearest $million. A zero does not mean literally no cost.(b) Printing costs may be passed on to consumers.(c) Profit before income tax.
31
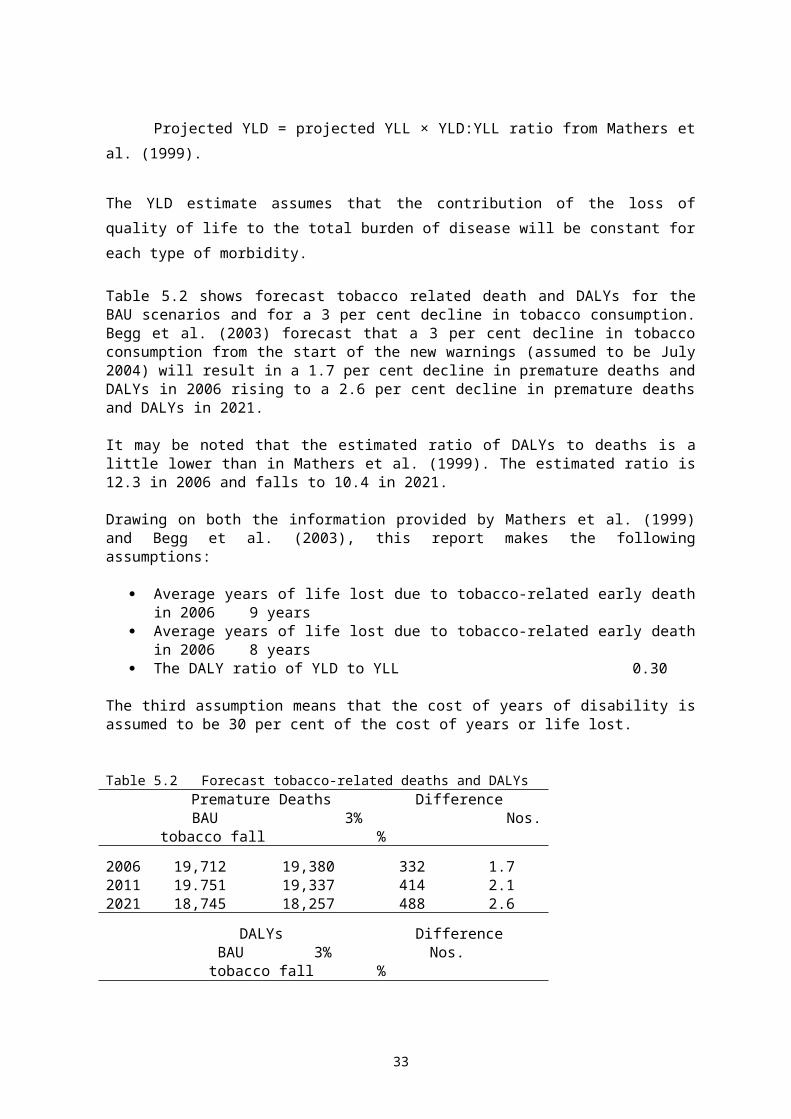
Table 7.2 Cost-Benefit Analysis of Proposed Health Warnings: Sensitivity Test One ($m 2003 prices) (a)
2004 ‘05 ‘06 ‘07 ‘08 ‘09 ‘10 ‘11 ‘12 ‘13 ‘14 ‘15 ‘16 ‘17 ‘18 ‘19 ‘20 ‘21 ‘22 ‘23 ‘24 ‘25 ‘26 ‘27 ‘28 ‘29 ‘30Costs to tobacco industry Printing costs - cigarettes (b) 16 0 0 0 0 0 0 0 0 0 0 16 0 0 0 0 0 0 0 0 0 0 0 0 0 0 0 Printing costs - cigars/other (b) 2 0 0 0 0 0 0 0 0 0 0 2 0 0 0 0 0 0 0 0 0 0 0 0 0 0 0 Loss of gross profits (cigarettes) (c) Tobacco growers 0 1 1 1 1 1 1 1 1 1 1 1 1 1 1 1 1 1 1 1 1 1 1 1 1 1 1 Manufacturers 8 19 19 19 19 18 18 18 17 17 17 16 16 16 16 15 15 15 15 15 14 14 14 13 13 13 12 Retailers 4 9 9 9 9 9 8 9 8 8 8 8 8 8 8 7 7 7 7 7 7 7 7 6 6 6 6Total 30 29 29 29 29 28 27 28 26 26 26 43 25 25 25 23 23 23 23 23 22 22 22 20 20 20 19
Gross costs to government Information programs 5 5 0 0 0 0 5 0 0 0 0 5 0 0 0 0 0 0 0 0 0 0 0 0 0 0 0 Loss of excise/customs revenue 70 139 137 135 133 131 129 128 126 124 122 120 118 116 114 112 110 108 106 104 102 100 98 96 94 92 90Total 75 144 137 135 133 131 134 128 126 124 122 125 118 116 114 112 110 108 106 104 102 100 98 96 94 92 90
Total costs 105 173 167 164 162 159 161 155 152 150 148 168 143 141 139 135 133 131 129 127 124 122 120 116 114 112 109
Benefits Value of increased length of life 0 60 124 129 135 141 147 154 157 160 163 166 169 172 175 178 181 182 182 182 182 182 182 182 182 182 182 Value of increased quality of life 0 18 37 39 41 42 44 46 47 48 49 50 51 52 53 53 54 55 55 55 55 55 55 55 55 55 55 Health care savings government 0 6 13 13 13 14 14 14 14 15 15 16 16 17 17 18 18 19 19 19 19 19 19 19 19 19 19 Gains to non-tobacco firms 0 16 16 16 16 15 15 15 15 15 14 14 14 13 13 13 13 13 12 12 12 12 11 11 11 11 11Total benefits 0 100 190 197 205 212 220 230 233 238 241 246 250 254 258 263 266 269 268 268 268 268 267 267 267 267 267
Net benefits -105 -73 24 33 43 53 59 75 81 88 93 78 107 113 119 128 133 138 139 141 144 146 147 151 153 155 158
NPV @ 7% to 2021 454BCR @7% to 2021 1.30
a) See text for description of sensitivity test. Figures to nearest $ million.(b) Printing costs may be passed on to consumers.(c) Profit before income tax.
32

Table 7.3 Cost-Benefit Analysis of Proposed Health Warnings: Sensitivity Test Two ($m 2003 prices) (a)
2004 ‘05 ‘06 ‘07 ‘08 ‘09 ‘10 ‘11 ‘12 ‘13 ‘14 ‘15 ‘16 ‘17 ‘18 ‘19 ‘20 ‘21 ‘22 ‘23 ‘24 ‘25 ‘26 ‘27 ‘28 ‘29 ‘30Costs to tobacco industry Printing costs - cigarettes (b) 16 0 0 0 0 0 0 0 0 0 0 16 0 0 0 0 0 0 0 0 0 0 0 0 0 0 0 Printing costs - cigars/other (b) 2 0 0 0 0 0 0 0 0 0 0 2 0 0 0 0 0 0 0 0 0 0 0 0 0 0 0 Loss of gross profits (cigarettes) (c) Tobacco growers 0 1 1 1 1 1 1 1 1 1 1 1 1 1 1 1 1 1 1 1 1 1 1 1 1 1 1 Manufacturers 3 6 6 6 6 6 6 6 6 6 6 6 6 5 5 5 5 5 5 5 5 5 5 5 5 5 5 Retailers 1 3 3 3 3 3 3 3 3 3 3 3 3 2 2 2 2 2 2 2 2 2 2 2 2 2 2Total 22 10 10 10 10 10 10 10 10 10 10 28 10 8 8 8 8 8 8 8 8 8 8 8 8 8 8
Gross costs to government Information programs 5 5 0 0 0 0 5 0 0 0 0 5 0 0 0 0 0 0 0 0 0 0 0 0 0 0 0 Loss of excise/customs revenue 22 45 45 44 44 43 43 42 42 41 41 41 40 40 39 38 37 36 35 34 33 32 31 30 29 28 27Total 27 50 45 44 44 43 45 42 42 41 41 46 40 40 39 38 37 36 35 34 33 32 31 30 29 28 27
Total costs 49 60 56 54 54 53 58 52 52 51 51 74 50 48 47 46 45 44 43 42 41 40 39 38 37 36 35
Benefits Value of increased length of life 0 34 68 71 74 78 82 85 87 88 90 91 93 94 96 97 98 100 100 100 100 100 100 100 100 100 100 Value of increased quality of life 0 10 20 21 22 23 25 25 26 27 27 27 28 28 29 29 29 30 30 30 30 30 30 30 30 30 30 Health care savings government 0 2 4 4 4 5 5 5 5 5 5 5 6 6 6 6 6 6 6 6 6 6 6 6 6 6 6 Gains to non-tobacco firms 0 3 5 5 5 5 5 5 5 5 5 5 5 4 4 4 4 4 4 4 4 4 4 4 4 4 4Total benefits 0 49 98 101 105 111 117 120 123 124 127 128 132 135 136 137 141 141 141 141 141 141 141 141 141 141 141
Net benefits -49 -11 43 47 51 58 59 68 70 73 76 54 82 84 88 90 92 97 98 99 100 101 102 103 104 105 106
NPV @ 5% 905BCR @ 5% 2.23
a) See text for description of sensitivity test. Figures to nearest $ million.(b) Printing costs may be passed on to consumers.(c) Profit before income tax.
33
7.3 Impacts on Major Stakeholders
The major direct costs and benefits are evident from Tables 7.1 to 7.3. Evidently the Commonwealth Government will bear the major cost of the health warnings with a loss of excise and customs of over $100 million per annum in the central case assumptions. It may also lose some net income tax and GST revenue, which has not been quantified in the spreadsheets because the fall in income tax and GST revenue from tobacco sales may not be fully offset by increases in income tax and GST revenue from other industry. On the other hand, government will gain from some savings in health expenditures in the order of $15 million per annum in the central case.
The tobacco industry (growers, manufacturers and retailers) will bear estimated direct costs or losses in the order of $25 million per annum in the central case. The manufacturers will bear some two-thirds of these costs in the first instance. However, some of these costs may be passed on to consumers and some will be offset by reductions in income tax liabilities. The balance of these costs would be borne by foreign shareholders as all three manufacturing companies are foreign owned. Local retailers will bear a loss of income as tobacco products are quite profitable despite the low margins.
On the other hand, many local businesses including retailers will benefit from the switch of some $200 million dollars expenditure from tobacco products to non-tobacco products.
Evidently the major beneficiaries are those who give up or reduce their smoking significantly or who never take it up in the first place as a result of the new health warnings. On average these beneficiaries gain an extra 9 years of life and avoid some years of painful illness. While they lose the pleasure of smoking, they gain some other pleasures from the switch in expenditure.
7.4 Conclusions
The economic evaluation indicates that, under likely assumptions, there is a substantial net benefit of over $2 billion from the new health warnings and a benefit cost-ratio greater than 2:1. Under two conservative sensitivity scenarios, which allow for both lower health outcomes and for a lower value of a healthy life year, the net benefit would be significantly reduced but it would remain significantly positive.
The study has not allowed for any loss of consumer surplus of smokers who switch to other products while it has allowed for the benefits in terms of improved health. This may cause the net benefits to consumers who switch out of smoking to be overestimated. On the other hand, the report has not attempted to account for the reductions in the social costs of smoking, including the costs of victims of burns and other morbidities from smoking–related fires, perinatal care for low-birth weight babies, and complications with illnesses such as diabetes that are not directly associated with smoking.
Accordingly the report concludes that on balance the social benefits of the proposed health warnings offset the costs. Most of these costs will be borne by government and some by shareholders of the tobacco companies.
34

References
Abelson, P., 2003, ‘The value of life and health for public policy’, Economic Record, 79, S2-S13.
Andreasen, A.R., 2002, ‘Marketing social marketing in the social change marketplace’, Journal of Public Health Management and Practice, 21, 3-13.
Applied Economics, 2003, Returns on Investment in Public Health, An Epidemiological and Economic Analysis, prepared for the Commonwealth Department of Health and Ageing, Canberra.
Begg, S., Ezzati, M., Lopez, A. and T.Vos, 2003, Measuring the impact of reductions in tobacco on the burden of disease and injury in Australia. Report commissioned by the Department of Health and Ageing, Canberra. Bureau of Transport Economics, 2000, Road Crash Costs in Australia, Bureau of Transport Economics, Report 102, Canberra.
Chaloupka, F.J. and K.E.Warner, 1999, The Economics of Smoking, Working Paper 7047, National Bureau of Economic Research, Washington D.C.
Collins, D. and H.Lapsley, 2002, Counting the cost: estimates of the social costs of drug abuse in Australia in 1998-9, National Drug Strategy, Monograph Series No. 49, Commonwealth Department of Health and Ageing, Canberra.
Commonwealth Department of Health and Aged Care, 2001, Review of Health Warnings on Tobacco Products in Australia, Discussion Paper, Canberra.
Corbett, K. K., 2001, ‘Susceptibility of youth to tobacco: a social ecological framework for prevention’, Respiratory Physiology, 128, 103-118.
Cutler, D. and E. Richardson, 1997, Measuring the health of the US Population, Brookings Paper on Economic Activity, Microeconomics, Brookings Institute, Washington, D.C.
Elliott and Shanahan, 2000, Evaluation of the Health Warnings and Explanatory Health Messages on Tobacco Products, prepared for the Tobacco and Alcohol Strategies Section of the Department of Health and Aged Care.
Elliott and Shanahan, 2002, Developmental Research for New Australian Health Warnings on Tobacco Products, Stage 1, prepared for Population Health Division, Department of Health and Ageing, Canberra.
Environics Research Group, 1999a, Health Warning Testing, prepared for Health Canada.
Environics Research Group, 1999b, Canadian Adult and Youth Opinions on the Sizing of Health Warning Messages, prepared for Health Canada Office for Tobacco Control.
Environics Research Group, 2000, Canadian Opinion on the Size of Health Warning Messages: A Validation Survey, PN 4630, prepared for Health Canada, Bureau of Tobacco Control.
Environics, 2001, The Health Effects of Tobacco and Health Warning Messages on Cigarette Packages, prepared for Health Canada.
Environics, 2003, Evaluation of New Warnings on Cigarette Packaes, prepared for Health Canada and Consulting and Audit Canada.
35

Hale, J. L. and J. P. Dillard, 1995, Fear Appeals in Health Promotion Campaigns: Too much, too little, or just right? in Designing Health Messages: Approaches from Communication Theory and Public Health Practice, E. Maibach and R. L. Parrot, Thousand Oaks, California, SAGE: 65-80.
Hara Associates, 2000, Benefit/Cost Analysis of Proposed Tobacco Products Information Regulations, prepared for Health Canada & Consulting and Audit Canada.
Hastings, G. and L. MacFadyen, 2002, ‘The limitations of fear messages’, Tobacco Control, 11, 73-5.
Hornik, R., 1989, ‘The knowledge-behavior gap in public information campaigns: a development communication view’ in Information Campaigns:balancing social values and social change, C. T. Salmon. Newbury Park, Sage: 113-138.
Industry Commission, 1994, The Tobacco Growing and Manufacturing Industries, AGPS, Canberra.
Kotler, P. and A. R. Andreasen, 1995, Strategic marketing for non-profit organizations, Upper Saddle River, New Jersey, Prentice Hall.
Lantz, P. M., P. D. Jacobson, et al., 2000, ‘Investing in youth tobacco control: a review of smoking prevention and control strategies’, Tobacco Control, 9, 47-63.
Les Etudes do Marche Createc, 1999, Effects of Increasing the Area Occupied by Health Warnings on Cigarette Packages, prepared for Health Canada Office of Tobacco Control.
Liefield, J., 1999, The Relative Importance of the Size, Content and Pictures on Cigarette Package Warning Message, mimeo, Department of Consumer Studies, University of Guelph.
Liefeld, J. P., 2000, Partial replication: the relative importance of the size, content and pictures on cigarette package warning messages, Health Canada.
Mathers, C., Vos, T., and C.Stevenson, 1999, The Burden of Disease and Injury in Australia, Cat.No. PHE 18, Australian Institute of Health and Welfare, Canberra.
PriceWaterhouseCoopers, 1999, The Significance of Cigarettes and Tobacco Products to Retailers, An Analysis of Retail Sales.
PriceWaterhouseCoopers, 2002, The Current Economic and Policy Environment for the Australian Tobacco Industry.
Prochaska, J.A. and C.C. DiClemente, 1983, ‘Stages and processes of self-change of smoking: towards an integrative model if change,’ Journal of Consulting and Clinical Psychology, 51 390-95.
Rosenstock, I.M., 1990, ‘The health belief model: explaining health behaviour through expectancies’ pp.39-62 in Health Behaviour and Health Education, K.Glanz, F.M.Lewis, and B.K. Rimer, eds., Jossey-Bass Publishers, San Francisco.
Sutton, S., 1992, ‘Shock Tactics and the Myth of the Inverted U.’ British Journal of Addiction, 87, 17-19.
Tolley, G., Kenkel, D., and R.Fabian, Valuing Health for Policy: An Economic Approach, University of Chicago Press, Chicago.
Viscusi, W.K., 1993, ‘The value of risks to life and health’, Journal of Economic Literature, 31, 1912-46.
Viscusi, W.K. and R.J.Zeckhauser, 1996, ‘Hazard Communication: Warnings and Risk’, Annals, APSS, 545, 106-115.
36
Appendix A: Submissions from ANZPAC and AMCOR provided in November 20035
Dr Peter AbelsonDirector Applied Economics Pty LtdLevel 3, 101 Sussex StSYDNEY NSW 2000
Dear Dr Abelson
Cost Benefit Analysis – Printing Costs for Pictorial Health Warnings
Thank you for taking the time to visit Anzpac as part of the preparation of the cost-benefit analysis for the Department of Health and Ageing.
As you would appreciate from your visit to Anzpac, gravure printing is a complex process with long led times required to deal with large volumes. As you saw, under the current proposal, the two gravure presses that Anzpac currently uses would have to be expanded.
There is no commercial advantage for Anzpac in having more than an eight colour press. There is no demand in Australia or amongst our existing international customers for additional capability and Anzpac does not expect that this demand will eventuate because of any increased capability.
Anzpac has many other gravure printing customers, including export customers, other than British American Tobacco Australia across a range of industries. The upgrading of the machines will need to be done whilst maintaining our ability to meet the needs of our existing customers that are not impacted by this proposal.
While it was requested that Anzpac provide two separate costings, one for conversion from 1 July 2003 and another for conversion from 1 January 2005, only one costing as been provided. The one costing covers the implementation period of eighteen months. Under the proposal presented on 12 August 2003 by the Department of Health and Ageing, it would take a minimum of eighteen months for Anzpac to convert its current printing facilities.
The analysis that you are preparing will need to take into account the impact of any rotations of warnings on a twelve month or two year basis. These rotations will have an impact on our ability to service other customers and will also mean large retooling costs to our business on an annual basis.
We would anticipate that the Cost Benefit Analysis that is being prepared will break down the impacts on each stakeholder group so that the full impact on the printing industry can be stated.
5 These submissions have been edited very slightly but with no changes in figures or meaning.
37

Key Costings*Capital Costs Purchase of four new printing units (two for each
press). Anzpac has two printing machines, one that is more than ten years old and the other that is 2 years old. The cost of new units is greater for the older machine (as they must be built from plans) than for the newer machine.
$2.5-3 million
Site Costs Includes: Digging and relaying of factory floor Refitting machinery associated with new units Plumbing Electrical wiring etc…
$120,000
Design / printing Costs
Includes: Re-engraving of cylinders (approx. 800) Manufacture of new knives (approx. 50)
$1.5 million
Manufacturing Costs Includes: Costs of non-production runs to test and modify
machines Loss of capacity to service other customers Overtime costs
$2 million
Sundry costs i.e. costs associated with the impact of new machinery. For example, cost of compliance with EPA regulations
$100,000
* Notes: All costs are in Australian dollars Costs are estimates only and may vary due to factors such as changes in the exchange rate,
changes in the costs of suppliers, changes in the costs of acquiring raw materials or other factors that may or may not be anticipated.
Costs are one-off and do not take account of the ongoing costs of annual rotations.
If you have any questions relating to the information contained in this letter, I can be contacted on (02) 8787 1301.
Yours sincerelyAnzpac Services (Australia) Pty Ltd
Geoff BoshellGeneral Manager
38
14th November, 2003
Peter AbelsonApplied Economics Pty LtdLevel 3, 101 Sussex StSYDNEY NSW 2000
Dear Peter,
Re: Costs associated with the introduction of graphic health warnings
Further to the briefing by the Department of Health and Ageing in August and subsequent discussions, we provide the following assessment of costs. Amcor will incur these costs in order to print the proposed changes to consumer health warnings on tobacco packaging.
The printed packaging that Amcor produces for the tobacco industry in Australia comes predominantly from two sites, in Moorabbin Victoria and Botany NSW. The costs detailed will be borne by these two sites.
As directed we have kept costs to the nearest $0.5 million.
Amcor Cartons Moorabbin
1. Capital costAdditional print units, machine modifications and structural changes to the factory and services to accommodate the extra print units. $2,500,000
Additional cylinder bases for the pictorial warnings $500,000
2. Tooling costAs the position and percentage coverage of the pack panels by the Health warnings is altered, we will need to remake the cutting and Embossing formes $500,000
3. Engraving cost
In the first year the complete library of cylinders will need to bere-engraved for the new image. In each year following we need torenew those cylinders involved in the warnings ($500,000 PA) $2,000,000
4. Down time costDown time cost comprised of the additional labour and working capital cost associated with stock building ahead of the engineeringwork. Also the cost of diverting print work for non-tobacco customersto alternate presses. $500,000
Moorabbin Total $6,000,000
39
Amcor Cartons Botany
1. Capital costAdditional print units, machine modifications and structural changes to the factory and services to accommodate the extra print units. $2,000,000
2. Tooling costAs the position and percentage coverage of the pack panels by the Health warnings is altered, we will need to remake the cutting and Embossing formes. Additional cylinder bases for the pictorial warnings $500,000(Tooling cost and cylinder bases are combined for Botany as the overallcost is less than for Moorabbin)
3. Engraving cost
In the first year the complete library of cylinders will need to bere-engraved for the new image. In each year following we need torenew those cylinders involved in the warnings ($50,000 PA) $200,000
4. Down time costDown time cost comprised of the additional labour and working capital cost associated with stock building ahead of the engineeringwork. Also the cost of diverting print work for non-tobacco customersto alternate presses. $500,000
Botany total $3,200,000
With regard to when we would be equipped to print the new warnings, we would be unable to meet the July 2004 time line. The key elements in the time line are as follows.
Stage one would comprise the redesign of all graphics to incorporate the graphic warnings, finalising the engineering plans and the conclusion of commercial negotiations with both the tobacco companies and the print machinery manufacturers. Also included in this stage would be the approval process of the capital needed by the Amcor board of directors. We estimate two to three months. (This is dependent on the preparation and response from our tobacco customers)
Stage two is the manufacture and delivery of the print units by Bobst in Switzerland. This has been confirmed to us at eight months. During this period much of the associated work on tooling, cylinders and some preliminary site works will be conducted.
Stage three is the installation and commissioning of the new equipment estimated at two months.
Finally, will be then required to cycle through the portfolio of brands to be printed with the new graphic warnings. We estimate approx. four months. Hence we would advocate an introduction date of July 2005.
With regard to the number of health warnings that will be in the new set, our preference from a printing layout is for a set of six. Beyond this we will be adding to the costs in accommodating the additional warnings in equal representation.
Additional to the costs above are the increases in the packaging cost to our customers for the added material and complexity.
We trust that this information is of assistance and would be pleased to discuss details should you require.
Yours faithfully,
Mark Gallagher
40
Appendix B:
Measuring the impact of reductions in exposure to tobacco on the burden of disease and injury in Australia
Stephen Begg6, Majid Ezzati7, Alan Lopez1 and Theo Vos1
Aim
To provide interim estimates of the burden of disease and injury (both mortality and Disability-Adjusted Life Years) in Australia for the years 2006, 2011 and 2021 under the following scenarios:
Assuming past trends in mortality continue unchanged into the future (i.e. “business as usual”)
Taking into account reductions in mortality expected through a 1, 3 and 5 per cent reduction in exposure to tobacco.
Background
Mathers and colleagues1 describe two traditions for causal attribution of health outcomes or states: categorical attribution and counterfactual analysis. In categorical attribution, an event, such as death, is attributed to a single cause or group of causes according to a defined set of rules. In counterfactual analysis, the contribution of one or a group of risk factors to disease or mortality (i.e. disease burden) is estimated by comparing the current or future disease burden with the levels that would be expected under some alternative hypothetical scenario (referred to as the counterfactual).
Figure 1 depicts the implications of a counterfactual approach to risk assessment in terms of burden that is attributable to prior exposure to a risk factor, burden that is avoidable with future exposure reduction and burden that is not associated with the risk factor of interest. The dashed arrows represent the path of burden after an exposure reduction at T0. As the time lag between exposure and outcome increases (as is the case with tobacco), the difference between attributable and avoidable burden becomes greater. Policy choices for feasible, plausible, and cost-effective exposure reductions can all be chosen from the range of distributional transitions within this framework2.
Methods
Theoretical minimum and intervention counterfactual exposure distributions
The counterfactual distribution of primary relevance to the aims of this report is the “intervention” counterfactual in which future exposure to tobacco is reduced by X per cent from current levels following the introduction of intervention Y. Our analyses are based on the counterfactual exposure distribution that results in the lowest population risk, however, regardless of the fact that this exposure distribution is unattainable in practice. This has been referred by Murray and Lopez as the theoretical minimum exposure distribution2 and, in the case of tobacco, is no tobacco use in the population.
6 School of Population Health, University of Queensland7 Harvard University
41

Figure 1 Conceptual basis for comparative risk assessment
Burden not attributable to or avoidable with the risk factor of interest
Burden attributable to prior exposure
Burden avoidable with exposure reduction at T 0
Unavoidable
Dise
ase
Burd
en
Time
T0 TxPast Future
0%
25%
50%
75%
100%(Theoreticalminimum)
c
d
a
b
Exposure reductionat T 0
Where:a = disease at T0 attributable to prior exposureb = disease at T0 not attributable to the risk factor (caused by other factors)c = avoidable disease at Tx with a 50% exposure reduction at T0
d = disease at Tx after a 50% reduction in risk factor
By quantifying the burden avoidable with 100 per cent reduction in tobacco use, we are able to quantify the avoidable burden with any lesser reduction in tobacco exposure simply by varying c in the Figure 1. We model intervention Y without explicit reference to an actual level of smoking prevalence now or into the future by using indirect methods for measuring of the accumulated hazards of smoking, as described below. To simplify our analyses, we assume intervention Y has the immediate effect of reducing exposure by X per cent uniformly across all ages in the population.
Smoking impact ratio
The standard approach in epidemiology for estimating the health effects of a risk factor is to calculate the attributable fraction of a disease or injury due to the risk factor as a function of the prevalence of exposure (P) and the relative-risk (RR) compared to the non-exposed group. The basic statistic in such a an “exposure-based” assessment is the attributable fraction (AF), defined as the percentage reduction in disease or death that would occur if exposure to the risk factor was reduced to zero.
42

This exposure-based approach is based on a simple dichotomous exposure variable (yes or no), and zero exposure as the reference level.
Many of the health effects of smoking, however, depend on the exposure history including the age at which smoking began, the number of cigarettes smoked per day, the degree of inhalation, and cigarette characteristics such as tar and nicotine content or filter type. Current smoking prevalence alone, therefore, is an insufficient indicator of accumulated risk from smoking.
Peto, Lopez and colleagues3 were the first to observed that the level of lung cancer mortality compared with never-smokers is an indicator of the “maturity” of the smoking epidemic in a population. From this observation, they developed an indirect method of estimating the accumulated hazard of smoking based on lung-cancer mortality rates. This method determines a smoking impact ratio (SIR), which can be defined as population lung cancer mortality in excess of that of never-smokers, relative to excess lung cancer mortality for a known reference group of smokers.
The attraction of this approach is that it captures the accumulated hazards of smoking by converting the smokers in the study population into equivalents of smokers in the reference population where hazards for other diseases have been measured. Peto and Lopez then use the SIR as equivalent to prevalence along with the appropriately modified relative risks in the classical attributable fraction formula for all causes (j) other than lung cancer to calculate attributable burden as follows:
where Bj is the estimated burden of disease from cause j.
Ezzati and Lopez refine the original SIR definition to account for differences in never-smoker lung cancer mortality rates across populations when estimating the global mortality attributable to smoking4. We use their background-adjusted SIR, which is defined by the following relationship:
where CLC is age-sex-specific lung-cancer mortality rate in the study population,NLC is age-sex-specific lung-cancer mortality rate of never-smokers in the same population as CLC. and SLC * and NLC * are age-sex-specific lung-cancer mortality rates for smokers and never-smokers, respectively, in a reference population.
Following previous work in this area3,5, we used the American Cancer Society Cancer Prevention Study, Phase II (CPS-II) as our reference population. This is a prospective study of smoking and death in more than 1 million Americans aged 30 years and older when they completed a questionnaire in 1982, with the latest published follow-up in 1998. Complete descriptions of the study and analysis have been provided previously6-8. We use CPS-II as our reference population because this is one of the few studies of smoking and cause-specific mortality undertaken when the full effects of the smoking epidemic were apparent, especially for men. Therefore, most (male) current-smokers included in CPS-II had been lifelong cigarette smokers, with a mean consumption of about 20 cigarettes per day3. Further, the estimates of increased risk of mortality among smokers were available for both men and women and for smaller age groups than in other studies.
Hazard estimates
43

Lung-cancer mortality attributable to smoking, by definition, is the difference between lung-cancer mortality rates in the study population and among never-smokers. To estimate mortality attributable to smoking from causes other than lung cancer, a composite population consisting of reference population (ie, CPS-II) smokers and nonsmokers was established so as to give an SIR equal to that of the study population3. This composite population was then used together with cause-specific relative risks from CPSII3 to estimate the smoking-attributable fraction of mortality for each medical cause listed in table 1. Cause-specific estimates of risk reversibility through smoking cessation were also derived from CPSII3.
Table 1 Cause groups for which separate SIRs were estimated
Cause ICD-9Lung cancer 162Upper aerodigestive cancer (mouth, oropharynx, or oesophagus)
140–150
Other cancer 151–161, 163–209Chronic obstructive pulmonary disease 490–492, 495, 496Other respiratory diseases 460–466,480–487, 381–382Cardiovascular diseasesInfectious and parasitic diseases, maternal and perinatal conditions, neuro-psychiatric conditions, liver, congenital anomalies
(001–139, 320–323, 614 except those above), (630-676, 760–779), (290–319, 324–359), (571), (740–759)
Other medical causes (Remainder of 000–799)
We reduced the excess risk attributed to smoking in the CPS-II relative risks by constant correction factors, to avoid overestimation of mortality due to confounding in CPS-II risk estimates (which were initially adjusted for age and sex only) as well as extrapolation to other populations, where exposure to other risk factors could modify the effects of smoking in a non-multiplicative way3. The correction factor used by Peto and colleagues3 was 50% of excess risk. In subsequent studies, the overall effect of confounding from factors such as diet and alcohol has been estimated as substantially less than half of the excess risk for cardiovascular diseases (including evidence of negative confounding for some causes)9-12. In response to criticism about lack of empirical evidence for confounding correction13,14, CPS-II data have been reanalysed with adjustment for potential confounders6,15. In one reanalysis, apart from cerebrovascular disease among men (where the fraction attributable to smoking decreased from 16% to 10%), adjustment for confounding had no or little effect on smoking attributable mortality (the next largest decreases were for lung cancer among men from 91% to 89%, and chronic obstructive pulmonary disease among women from 70% to 68%), or even resulted in a slight increase in risk for some causes15.
In a more detailed analysis, Thun and colleagues6 adjusted for age, race, education, marital status, occupation (“blue collar” worker), and total weekly consumption of citrus fruits and vegetables, in their estimation of the increased risk of mortality from a range of neoplasms, cardiovascular diseases, and respiratory diseases as a result of smoking. The analysis also adjusted for current aspirin use, alcohol consumption, body-mass index, physical activity at work or leisure, and weekly consumption of fatty foods for cardiovascular diseases, and for occupational exposure to asbestos for lung cancer and chronic obstructive pulmonary disease. With the exception of stroke among men, for which the relative risk decreased from 2·9 (95% CI 2·3–3·7) to 2·4 (1·8–3·0) for the 35–64 year age group and from 1·8 (1·6–2·2) to 1·5 (1·2–1·8) for those older than 64 years, excess risks increased, remained unchanged, or decreased by small amounts. Overall, adjustment for confounding reduced the estimates of mortality attributable to smoking in the USA by about 1%6.
Based on this new evidence on the robustness of CPSII relative risks to adjustment for confounding, we used a correction factor of 30% (about equal to the largest reduction in excess risk after adjustment in the reanalysis of CPS-II) to reduce the excess risk for all cause-specific risks other than lung cancer. This choice continues to be conservative to account for residual confounding or potential overestimation from extrapolation across regions. For the category “other medical causes”, where the extent of confounding was unknown, we attributed only half of the excess mortality estimated by CPS-II, as did Peto and colleagues3.
44
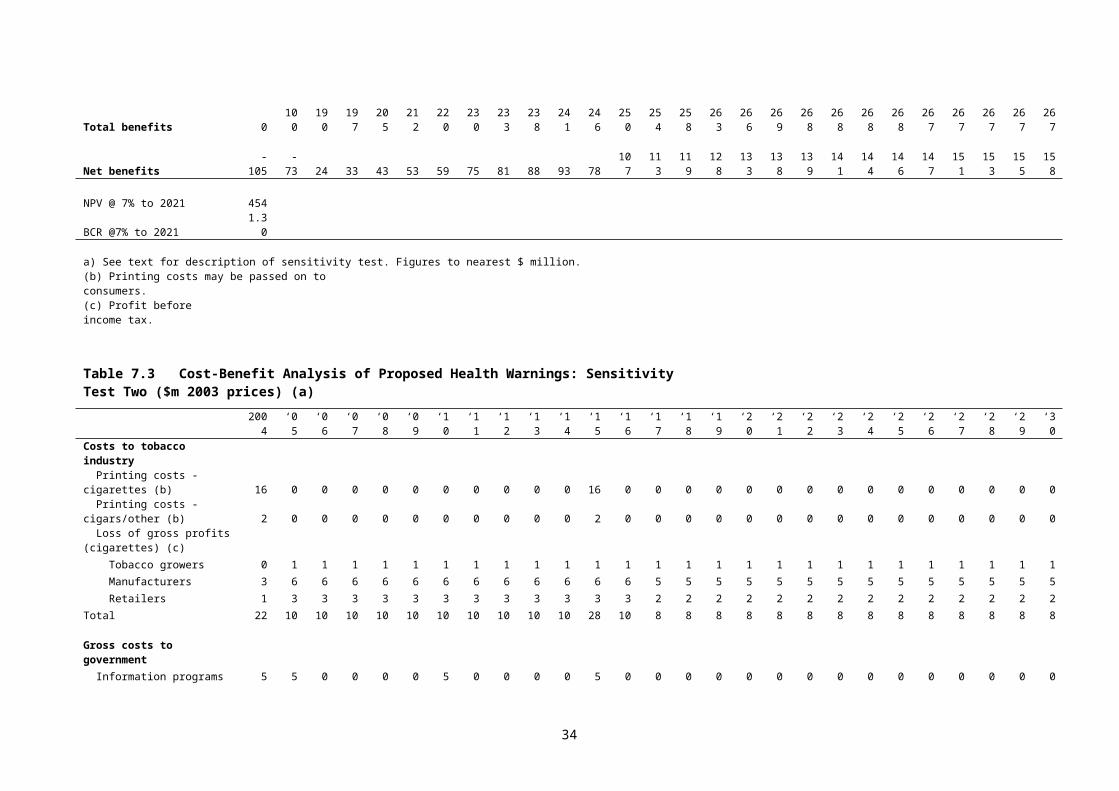
Projected mortality
We estimated all-cause mortality for the years 2006, 2011 and 2021 by extrapolating into the future observed all-cause mortality rates over the period 1979 to 2001 using simple log-linear Poisson regression models and projected population figures (Series C ABS Cat. no. 322203a). We then classified mortality into 51 clinically meaningful conditions, or groups of conditions, and extrapolated the observe trend for each group using the same techniques. Finally, we scaled the projected proportional distribution of cause-specific mortality numbers to the total number of expected deaths. Causal attribution below the level of these 51 groups of conditions was achieved by using detailed cause distributions for 2001.
It is well established that women took up smoking in significant numbers in Australia about twenty years later than men. It is also obvious from lung cancer and COPD mortality rates that the effects of the tobacco epidemic in women are yet to be fully realised. To account for these phenomena, we modelled rates for lung cancer and COPD in women using observed trends in men twenty years in the past using mortality data from 1958.
Projections were validated against estimates developed for the Global Burden of Disease 2000 project16 and were found to follow observed mortality trends up to 2001 more closely than this alternative source.
Projected morbidity
We use the Disability-Adjusted Life Year (DALY) as our measure of total disease burden. The DALY combines measurements of premature mortality and morbidity and its conceptual underpinnings are outlined in detail by Murray and Lopez elsewhere17. Briefly, average life expectancy at age of death determines the stream of life lost, or Years of Life Lost (YLL), for each premature death. The disability arising from disease or injury is measured as the duration spent in a state of ill health. All health states are weighted for severity. The non-fatal component of the DALY is referred to as the Years Lived with Disability (YLD). DALYs are the aggregation of YLL and YLD at the population level and thus reflect the ‘burden of disease’ in a population.
We derive our estimates of YLL by applying life-expectancy figures to the mortality projections described above.
The University of Queensland and the Australian Institute of Health and Welfare are currently working on YLD estimates for Australia in the year 2001 and is due to release preliminary results in the first half of 2004. The YLD estimates in this report, therefore, are based on findings reported by Mathers and colleagues in the Australian burden of disease and injury study for the year 199618,19. For conditions with significant mortality, we estimated future YLD by applying YLD to YLL ratios for Australia in 1996 to our projected cause-specific YLL estimates. For non-fatal conditions, where we had no information on trends, we applied YLD rates for 1996 to projected population figures20.
It is important to note that the original Australian burden of disease and injury study departed from standard DALY methodology in the following key areas:
A cohort life table (a method that takes declining mortality trends into account) for Australia in 1996 was used to determine YLL (compared with the standard life table used in most studies);
YLD estimates were discounted at a rate of 3 per cent, but NOT age-weighted;
YLD estimates incorporated severity weights developed by Dutch researchers21 for many conditions because of their greater detail than the original set developed for the global burden of disease work17, as well as the fact that they focused on many of the most common disabilities found in low-mortality countries, such as Australia
45

YLD estimates were adjusted for the effects of comorbidity between highly prevalent conditions.
The age groups used in our analysis were <1,1–4, 5–9, 10–14… and 85 years and older for mortality and SIR calculations and 0-4, 5-14, 15-24… 75 years and over for YLD and DALY calculations. No deaths before the age of 30 years were attributed to smoking.
Results and discussion
All results relating to the validation of our projections methods are available separately and are not discussed further in this report. shows projected tobacco related deaths and DALYs for the business as usual (BAU) scenario and for a 3 per cent decline in exposure to tobacco. We predict that a 3 per cent decline in exposure to tobacco would result in a 1.7 per cent decline in premature deaths and DALYs in 2006, rising to a 2.6 per cent decline in premature deaths and DALYs in 2021.
Table 2 Forecast tobacco-related deaths and DALYs
Premature Deaths BAU 3% tobacco fall
Difference Nos. %
2006 19,712 19,380 332 1.72011 19.751 19,337 414 2.12021 18,745 18,257 488 2.6
DALYs BAU 3% tobacco fall
Difference Nos. %
2006 242,260 238,116 4114 1.72011 226,587 221,750 4836 2.12021 195,283 190,196 6087 2.6
Table 3 and Table 4 give additional forecasts for premature deaths and DALYs respectively for 2006, 2011 and 2021 with 1, 3 and 5 per cent reductions in exposure to tobacco. These tables show the number of deaths saved with a 1 per cent fall in tobacco exposure is one-third of those with a 3 per cent fall in tobacco exposure, while the number of deaths saved with a 5 per cent fall in tobacco exposure is two-thirds higher than with a 3 per cent fall in tobacco exposure.
Table 3 Further forecasts of tobacco related deaths
BAU Fall in tobacco exposure 1% 3% 5%
2006 19,712 19,601 19,380 19,1602011 19,751 19,613 19,337 18,7452021 18,745 18,582 18,257 17,932
Table 4 Further forecasts of tobacco related DALYs
BAU Fall in tobacco exposure 1% 3% 5%
2006 242,260 240,879 238,116 235,3542011 226,587 224.974 221,750 218,5262021 195,283 193,587 190,196 186,805
46

Figure 2 through Figure 5 describe the above findings in terms of the framework presented earlier in this report (Figure 1). For each of the cause groups identified in Table 1, they depict: (1) mortality avoidable with 100 per cent reduction in exposure to tobacco in 2001, (2) mortality attributable to exposure to tobacco prior to 2001 and (3) mortality that is not related to exposure to tobacco. Also represented by a dotted line is mortality avoidable with 50 per cent reduction in exposure to tobacco in 2001. We chose this figure for illustrative purposes, as it was not possible to make the line visible and have a y axis that terminated at zero with smaller proportions. All rates have been standardised rates to remove the effect of changes in the age structure of the population. Appendix 1 presents additional figures using this framework relating to DALYs. Full results for the four scenarios set out in the aims of this report are presented separately in an excel file.
Figure 2 Tobacco related mortality in males (standardised rates), Australia, 1979 to 2021
Past Future Past Future Past Future
Past Future Past Future Past Future
Past Future Past Future
077
015
017
0
077
027
060
3
075
01,
162
1980 1990 2000 2010 2020 1980 1990 2000 2010 2020 1980 1990 2000 2010 2020
1980 1990 2000 2010 2020 1980 1990 2000 2010 2020 1980 1990 2000 2010 2020
1980 1990 2000 2010 2020 1980 1990 2000 2010 2020
Lung cancer Upper aerodigestive cancers Other cancers
Chronic obstructive pulmonary disease Other respiratory diseases Cardiovascular diseases
Other non-injury causes All causes
Mortality avoidable with 100% reduction in exposure to tobacco in 2001
Mortality attributable to prior exposure to tobacco
Mortality not related to exposure to tobacco
Mortality avoidable with 50% reduction in exposure to tobacco in 2001
Rat
e pe
r 100
,000
Year
Notes: (1) Rates standardised to 2001 (2) Charts have different Y axes
47

Figure 3 Tobacco related mortality in females (standardised rates), Australia, 1979 to 2021
Past Future Past Future Past Future
Past Future Past Future Past Future
Past Future Past Future
027
07
015
5
028
035
055
4
080
093
0
1980 1990 2000 2010 2020 1980 1990 2000 2010 2020 1980 1990 2000 2010 2020
1980 1990 2000 2010 2020 1980 1990 2000 2010 2020 1980 1990 2000 2010 2020
1980 1990 2000 2010 2020 1980 1990 2000 2010 2020
Lung cancer Upper aerodigestive cancers Other cancers
Chronic obstructive pulmonary disease Other respiratory diseases Cardiovascular diseases
Other non-injury causes All causes
Mortality avoidable with 100% reduction in exposure to tobacco in 2001
Mortality attributable to prior exposure to tobacco
Mortality not related to exposure to tobacco
Mortality avoidable with 50% reduction in exposure to tobacco in 2001
Rat
e pe
r 100
,000
Year
Notes: (1) Rates standardised to 2001 (2) Charts have different Y axes
Figure 4 Tobacco related mortality in males (numbers), Australia, 1979 to 2021
Past Future Past Future Past Future
Past Future Past Future Past Future
Past Future Past Future
05,
711
02,
600
020
,951
04,
296
02,
176
029
,506
011
,868
085
,784
1980 1990 2000 2010 2020 1980 1990 2000 2010 2020 1980 1990 2000 2010 2020
1980 1990 2000 2010 2020 1980 1990 2000 2010 2020 1980 1990 2000 2010 2020
1980 1990 2000 2010 2020 1980 1990 2000 2010 2020
Lung cancer Upper aerodigestive cancers Other cancers
Chronic obstructive pulmonary disease Other respiratory diseases Cardiovascular diseases
Other non-injury causes All causes
Mortality avoidable with 100% reduction in exposure to tobacco in 2001
Mortality attributable to prior exposure to tobacco
Mortality not related to exposure to tobacco
Mortality avoidable with 50% reduction in exposure to tobacco in 2001
Num
ber
Year
Notes: (1) Charts have different Y axes
48

Figure 5 Tobacco related mortality in females (numbers), Australia, 1979 to 2021
Past Future Past Future Past Future
Past Future Past Future Past Future
Past Future Past Future
03,
437
087
0
017
,349
02,
458
02,
903
028
,584
011
,969
078
,415
1980 1990 2000 2010 2020 1980 1990 2000 2010 2020 1980 1990 2000 2010 2020
1980 1990 2000 2010 2020 1980 1990 2000 2010 2020 1980 1990 2000 2010 2020
1980 1990 2000 2010 2020 1980 1990 2000 2010 2020
Lung cancer Upper aerodigestive cancers Other cancers
Chronic obstructive pulmonary disease Other respiratory diseases Cardiovascular diseases
Other non-injury causes All causes
Mortality avoidable with 100% reduction in exposure to tobacco in 2001
Mortality attributable to prior exposure to tobacco
Mortality not related to exposure to tobacco
Mortality avoidable with 50% reduction in exposure to tobacco in 2001
Num
ber
Year
Notes: (1) Charts have different Y axes
References
1. Mathers C, Ezzati M, Lopez A, Murray C, Rodgers A. Causal Decomposition of Summary Measures of Population Health. In: Murray C, Salomon J, Mathers C, Lopez A, eds. Summary Measures of Population Health: Concepts, Ethics, Measurement and Applications. Geneva: World Health Organisation, 2002.
2. Murray CJ, Lopez AD. On the comparable quantification of health risks: lessons from the Global Burden of Disease Study. Epidemiology 1999;10(5):594-605.
3. Peto R, Lopez AD, Boreham J, Thun M, Heath C, Jr. Mortality from tobacco in developed countries: indirect estimation from national vital statistics. Lancet 1992;339(8804):1268-78.
4. Ezzati M, Lopez AD. Estimates of global mortality attributable to smoking in 2000. Lancet 2003;362(9387):847-52.
5. Ezzati M, Lopez AD. Measuring the accumulated hazards of smoking: global and regional estimates for 2000. Tob Control 2003;12(1):79-85.
6. Thun MJ, Apicella LF, Henley SJ. Smoking vs other risk factors as the cause of smoking-attributable deaths: confounding in the courtroom. Jama 2000;284(6):706-12.
7. National Cancer Institute. Changes in cigarette-related disease risks and their implications for prevention and control. Smoking and tobacco control monograph no 8. Bethesda: National Cancer Institute, 1997.
8. Garfinkel L. Selection, follow-up, and analysis in the American Cancer Society Prospective Studies. In: Garfinkel L, Ochs O, Mushinkski M, eds. Selection, follow-up, and analysis in prospective studies: a workshop. Bethesda: National Cancer Institute, 1985.
9. Law MR, Morris JK, Wald NJ. Environmental tobacco smoke exposure and ischaemic heart disease: an evaluation of the evidence. Bmj 1997;315(7114):973-80.
49

10. Hirayama T. Life-style and mortality: a large-scale census-based cohort study in Japan. Tokyo: Karger, 1990.
11. Kawachi I, Colditz G, Stampfer M, al. e. Smoking cessation and decreased risks of total mortality, stroke, and coronary heart disease incidence among women: a prospective cohort study. In: Institute NC, ed. Changes in cigarette-related disease risks and their implications for prevention and control. Smoking and tobacco control monograph no 8. Bethesda: National Cancer Institute, 1997.
12. LaCroix AZ, Lang J, Scherr P, et al. Smoking and mortality among older men and women in three communities. N Engl J Med 1991;324(23):1619-25.
13. Lee PN. Mortality from tobacco in developed countries: are indirect estimates reliable? Regul Toxicol Pharmacol 1996;24(1 Pt 1):60-8.
14. Sterling TD, Rosenbaum WL, Weinkam JJ. Risk attribution and tobacco-related deaths. Am J Epidemiol 1993;138(2):128-39.
15. Malarcher AM, Schulman J, Epstein LA, et al. Methodological issues in estimating smoking-attributable mortality in the United States. Am J Epidemiol 2000;152(6):573-84.
16. Girosi F, King G. Demographic Forecasting, 2003.17. Murray C, Lopez A. The Global Burden of Disease: A comprehensive assessment of mortality
and disability from diseases, injuries and risk factors in 1990 and projected to 2016. Cambridge: Harvard University Press, 1996.
18. Mathers C, Vos T, Stevenson C. The burden of disease and injury in Australia. Canberra: AIHW: Australian Institute of Health and Welfare, 1999.
19. Mathers CD, Vos ET, Stevenson CE, Begg SJ. The Australian Burden of Disease Study: measuring the loss of health from diseases, injuries and risk factors. Med J Aust 2000;172(12):592-6.
20. Vos T, Begg S. The Victorian Burden of Disease Study: Morbidity. Melbourne: Public Health Division, Department of Human Services, 1999.
21. Stouthard M, Essink-Bot M, Bonsel G, Barendregt J, Kramers P. Disability weights for diseases in The Netherlands. Rotterdam: Department of Public Health, Erasmus University, 1997.
50

Additional figures using comparative risk assessment framework relating to DALYs
Figure 6 Tobacco related DALYs in males (standardised rates), Australia, 1979 to 2021
Past Future Past Future Past Future
Past Future Past Future Past Future
Past Future Past Future
096
1
022
8
02,
229
01,
187
037
6
07,
449
03,
034
022
,383
1980 1990 2000 2010 2020 1980 1990 2000 2010 2020 1980 1990 2000 2010 2020
1980 1990 2000 2010 2020 1980 1990 2000 2010 2020 1980 1990 2000 2010 2020
1980 1990 2000 2010 2020 1980 1990 2000 2010 2020
Lung cancer Upper aerodigestive cancers Other cancers
Chronic obstructive pulmonary disease Other respiratory diseases Cardiovascular diseases
Other non-injury causes All causes
Mortality avoidable with 100% reduction in exposure to tobacco in 2001
Mortality attributable to prior exposure to tobacco
Mortality not related to exposure to tobacco
Mortality avoidable with 50% reduction in exposure to tobacco in 2001
Rat
e pe
r 100
,000
Year
Notes: (1) Rates standardised to 2001 (2) Charts have different Y axes
Figure 7 Tobacco related DALYs in males (numbers), Australia, 1979 to 2021
Past Future Past Future Past Future
Past Future Past Future Past Future
Past Future Past Future
062
,646
031
,133
022
5,87
1
071
,561
024
,523
041
2,32
4
028
5,24
4
01,
476,
201
1980 1990 2000 2010 2020 1980 1990 2000 2010 2020 1980 1990 2000 2010 2020
1980 1990 2000 2010 2020 1980 1990 2000 2010 2020 1980 1990 2000 2010 2020
1980 1990 2000 2010 2020 1980 1990 2000 2010 2020
Lung cancer Upper aerodigestive cancers Other cancers
Chronic obstructive pulmonary disease Other respiratory diseases Cardiovascular diseases
Other non-injury causes All causes
Mortality avoidable with 100% reduction in exposure to tobacco in 2001
Mortality attributable to prior exposure to tobacco
Mortality not related to exposure to tobacco
Mortality avoidable with 50% reduction in exposure to tobacco in 2001
Num
ber
Year
Notes: (1) Charts have different Y axes
51

Figure 8 Tobacco related DALYs in females (standardised rates), Australia, 1979 to 2021
Past Future Past Future Past Future
Past Future Past Future Past Future
Past Future Past Future
035
2
095
02,
417
048
0
029
0
05,
428
03,
207
018
,141
1980 1990 2000 2010 2020 1980 1990 2000 2010 2020 1980 1990 2000 2010 2020
1980 1990 2000 2010 2020 1980 1990 2000 2010 2020 1980 1990 2000 2010 2020
1980 1990 2000 2010 2020 1980 1990 2000 2010 2020
Lung cancer Upper aerodigestive cancers Other cancers
Chronic obstructive pulmonary disease Other respiratory diseases Cardiovascular diseases
Other non-injury causes All causes
Mortality avoidable with 100% reduction in exposure to tobacco in 2001
Mortality attributable to prior exposure to tobacco
Mortality not related to exposure to tobacco
Mortality avoidable with 50% reduction in exposure to tobacco in 2001
Rat
e pe
r 100
,000
Year
Notes: (1) Rates standardised to 2001 (2) Charts have different Y axes
Figure 9 Tobacco related DALYs in females (numbers), Australia, 1979 to 2021
Past Future Past Future Past Future
Past Future Past Future Past Future
Past Future Past Future
042
,058
010
,307
022
0,38
1
037
,821
025
,510
030
3,54
8
029
0,45
9
01,
489,
863
1980 1990 2000 2010 2020 1980 1990 2000 2010 2020 1980 1990 2000 2010 2020
1980 1990 2000 2010 2020 1980 1990 2000 2010 2020 1980 1990 2000 2010 2020
1980 1990 2000 2010 2020 1980 1990 2000 2010 2020
Lung cancer Upper aerodigestive cancers Other cancers
Chronic obstructive pulmonary disease Other respiratory diseases Cardiovascular diseases
Other non-injury causes All causes
Mortality avoidable with 100% reduction in exposure to tobacco in 2001
Mortality attributable to prior exposure to tobacco
Mortality not related to exposure to tobacco
Mortality avoidable with 50% reduction in exposure to tobacco in 2001
Num
ber
Year
Notes: (1) Charts have different Y axes
52

53


![Azra [broj 794, 16.5.2012]](https://img.pdfslide.net/doc/110x75/5449be8aaf795984188b45c3/azra-broj-794-1652012.jpg)