Embed Size (px)
Citation preview
IZA Workshop: EU Enlargement and the Labor Markets
Berlin, November 30, 2006
POST-ENLARGEMENT MIGRATION AND
LABOUR MARKET IMPACT IN SWEDEN1
Eskil Wadensjö ([email protected])
Swedish Institute for Social Research, Stockholm University, SE-106 91 Stockholm, Sweden
People migrate across borders for different reasons, economic and as well as others.
Independent of the motive for migration, it has economic effects. Migration has economic
effects for the migrants and for the countries of origin and destination. The effects of
international migration are not easy to determine. It means that there is uncertainty regarding
the effects of migration from the accession states both before and after the accession has taken
place. The uncertainty before the accession is related to both the number of immigrants, the
composition of the immigrants and the effects on the country of destination given the size and
composition of the inflow of immigrants. But even when the size and composition of the new
immigration are known, the effects are not easy to establish.
In the first section of this paper we will discuss the type of economic effects an expansion of
immigration may lead to. In the second section the dimension and composition of the actual
migration in the first two years after the enlargement of the European Union is in focus. In the
third section the labour market situation of the immigrants from the accession countries is
analyzed. In the pre-accession debate social (benefit) tourism was a key issue. In the fourth
section the migrants and the public sector and especially the migrants and the welfare system
is discussed. The last section concludes and also indicates some areas for further study.
1. Economic effects of an increased immigration
Immigration has economic effects for the country of origin. An enlargement of immigration
due to an expansion of the European common labour market may have various effects,
positive and negative. The size of these effects depends of course on the size of the increase in
1 For a different version of this text see Chapter 3 and 4 in Doyle, Hughes and Wadensjö (2006).
1
immigration – a small increase in immigration means small effects. The effects also depend
on the composition of the new immigrants and the functioning of the economy they are
arriving to. Here we will discuss the types of effects most highlighted in research and in the
public debate but first say a few words about the different types of international migration.
There are several different types of international migration. Labour migration, refugee
migration and family (re)union are the three most important ones. 2 For Sweden, labour
migration dominated in the post-war period up to the early 1970s. Most of the labour migrants
arrived from the neighbouring Nordic countries, especially Finland, and other European
countries. The labour migrants typically came directly to work, in many cases recruited in
their home countries by Swedish employers. Due to the recession in the early 1970s and in
practice a stop for labour migration from outside the common Nordic labour market (and later
the European common labour market), the labour migration decreased drastically. Since then
refugee migration and family (re)union migration have dominated. Those coming for family
(re)union are in most cases coming to live labour migrants and refugees who have arrived
earlier.
Labour migration has continued on a lower level also during the last decades mainly from the
countries belonging to the Nordic common labour market or the European Union common
labour market. The direction of labour migration is mainly from countries with lower income
and wage levels to countries with higher. The variations over time are large, very sensitive to
variations in the labour market situation in the country of origin and especially the country of
destination. Few migrate to countries that have few job vacancies.
The migration from the accession countries will most likely be dominated by labour migration
and we can therefore expect large variation in size depending on the Swedish labour market
situation.
In the international debate “welfare magnets”3 has been a catchword just like “social (benefit)
tourism” became one in the Swedish debate. It suggests that immigrants at least to some
extent are coming because the country of destination has a highly developed welfare state
with generous compensation for those who are out of work. Some studies have related the
selection of migrants to different countries or parts of a country (states in the United States) to
2 Nilsson (2004) contains a detailed presentation of migration to and from Sweden in the post-war period. 3 Borjas (1999) is the main advocate for this view using data on immigration to different states in the US. Passel and Zimmermann (2001) do not find support for the welfare magnet hypothesis in a study of the settlement pattern of immigrants in the US. Pedersen, Pytlikova and Smith (2004) do not get support for the welfare magnet hypothesis in their study which is based on international migration between a large number of countries.
2
the generosity of the compensation schemes. Other studies have especially studied immigrant
representation in some parts of the welfare system, for example social assistance.
It is important to note that those schemes constitute only a minor part of the total public sector
budget. People living in a country, natives and immigrants, are paying taxes and they are
receiving different forms of income transfers and public consumption like education and
health care. The costs for some forms of public consumption are possible to refer to the
individual using it, the costs for other forms of public consumption are related to the size of
the population (and increase by that as a result of immigration), and finally some costs are
pure public goods that do not vary with changes in the size of the population. The difference
between the change in the taxes and the sum of change of the income transfers and public
consumption due to migration is the net transfer to the public sector from the migrants.
The net transfer from the immigrants to the public sector may be positive or negative. A factor
supporting the presumption of a positive value of the net transfer is that the new immigrants
generally are of active age and that the public sector mainly redistributes from people of
active age to people of passive age (children and young people, and retired people). However,
there are also different forms of transfers within the group of people of active age, mainly
between those who have a job and those who do not have a job or if they have a job are not
working, but are on sick leave, for example.
Studies of the net transfers from immigrants to the public sector in countries like Sweden
show that the net transfers are positive for labour migrants coming from western countries but
negative for refugee immigrants coming from non-western countries.4 The negative transfer
for refugee immigrants is explained by that few of them are integrated into the labour market.
This suggests that if immigrants from the accession countries become integrated in the labour
market, the net transfers will most likely be positive, i.e. going from the immigrants to the
public sector. Empirical studies are necessary to determine the actual outcome. The bottom
line of this discussion is that it is not sufficient to look at one program, for example social
assistance, to determine if the new immigration is a burden for the welfare state. Higher costs
for social assistance for immigrants than for natives may be more than compensated by the
taxes paid by the new migrants if they are working to a large extent.
4 See Wadensjö (1973), Ekberg (1983, 1998, 1999) and Gustafsson and Österberg (2001) for Sweden and Coleman and Wadensjö (1999), Wadensjö (2000, 2000a, 2002), Wadensjö and Orrje (2002) and Wadensjö and Gerdes (2004) for Denmark, and Gott and Johnston (2002) for the UK. Some surveys of studies in the field are found in Wadensjö and Orrje (2002), Leibfritz, O’Brien and Poot (2003), and Chonicki (2004).
3
Another issue much discussed in the public debate is the effect on wages of (an increase in)
immigration. Immigration means generally an increase of the labour force and an increase of
the supply of a production factor can be expected to lead to a decline in the price of that factor,
i.e. to a decline of wages. It is not as simple as that, however. First, an increased supply of
labour may induce new investments which may counteract the expected wage decline.
Secondly, labour is not a homogeneous factor of production. The immigrant work force may
be a complement in the production process to the native work force and not a substitute, so
that an increase in immigration induces an increase in the wages of native workers. This
means that it is not possible to determine the sign and size of the wage effect without
empirical studies. There are now quite a few studies on the wage effects of immigration for
different countries and periods, most of them indicating only small effects. 5 Even if the
effects are small on the average and may go in both directions, the effects may be larger in
areas and occupations with a large inflow of immigrants. It is therefore of interest to study the
occupational and regional distribution of immigrants compared to that of the natives.
Another area of discussion is if immigration influences the size and structure of
unemployment.6 A not uncommon fear is that immigrants may out-compete some natives so
they become unemployed. Such a discussion is generally based on an idea that the number of
jobs is fixed, an idea not based on knowledge of how the economy functions. The
unemployment rate is mainly determined by macroeconomic developments and by the
economic policy. Sweden, as most other countries, has a target range for inflation. If the
inflation tends to be higher than the upper limit of the target range, the National Bank will
increase the interest rate and by that increase the unemployment rate. The unemployment rate
following from such a policy is the unemployment rate that is possible to maintain without
getting an accelerating inflation (NAIRU). If the immigrant unemployment is higher than the
native unemployment rate this could be interpreted as if the immigrants are contributing
relatively more to combat inflation. An argument for a decline in NAIRU as a result of
immigration is that immigrants are more geographically mobile than natives on the labour
market leading to less wage inflation. An argument for an increase of NAIRU as a result of
immigration is that immigrants are less occupationally mobile on the labour market (confined
to fewer occupations) leading to a higher structural unemployment. However, immigration is
5 See Longhi, Nijkamp and Poot (2004) for a meta-study of a large number of studies on wage effects. Borjas (2003) is one of the few who find large effects. 6 Gilpin et al. (2006) is a recent study of much relevance for this study. The main result is that the post-enlargement migration to the UK has not influenced the local unemployment rate.
4
probably not influencing the NAIRU to a great extent. The relatively few empirical studies in
this area indicate that the effects of immigration on unemployment are small.
Immigration may also have other effects for example on prices and also on influencing
exports by forming networks between the country of origin and the country of destination.7
2 The development of immigration to Sweden from the new EU member countries8
The economic effects of the enlargement of the European Union labour market are primarily
dependent on the size of the new migration. Crucial for all predictions of the effects are
predictions of the size of the new immigration. 9 In this section we will present the
development of the number and composition of immigrants from the accession countries
before and after the accession. It will be an incomplete picture for different reasons. One
reason is that not all immigrants in Sweden are registered and more important, that the share
registered may have changed. It is likely that some immigrants who have lived and worked in
Sweden for a period but have not been registered may have registered as a result of the legal
change. We also cannot exclude that immigration from other countries, registered and
unregistered, may have declined as a result of the accession agreement. Employers who
earlier employed immigrants from other countries may have turned to employing immigrants
from the accession countries.
It is also important to study the emigration to the accession states. The emigration to those
states will mainly be return migration of earlier immigrants. The return migration will
increase, given the propensity to re-emigrate, because the immigrant population living in
Sweden is larger. But it may also increase if the deregulation of immigration makes it more
attractive to return, as a result of that it will be possible to immigrate to Sweden again after a
period in the home country. The decision to go back to the home country is easy to change if
it is regretted.
7 See Bandyopadhyay, Coughlin, and Wall (2006) for the effects of networks on export. 8 There are a few follow-up studies of immigration from the accession countries after the enlargement of the European Union. See Dølvik and Eldring (2005) for the migration to the Nordic countries, and Commission of the European Communities (2006) comparing migration from the EU10 and the EU15 to all EU15 countries. Note that the numbers based on residence permits in the latter study are strongly misleading regarding the immigration from EU15 countries to Sweden. Danish and Finnish citizens who constitute the majority of immigrants from other EU15 countries in Sweden do not need a residence permit. 9 The predictions of the size and the effects of migration made before the enlargement of the European Union vary much. See for example Boeri, Hanson and MacCormick (2002), Dustmann et al. (2003), Eriksson (2004), Pedersen, Pytlikova and Smith (2004) and Sinn and Ochel (2003). The study most critical to free migration for citizens of the accession states is Sinn and Ochel (2003). They argue that migration without restriction would lead to a dismantling of the welfare state.
5
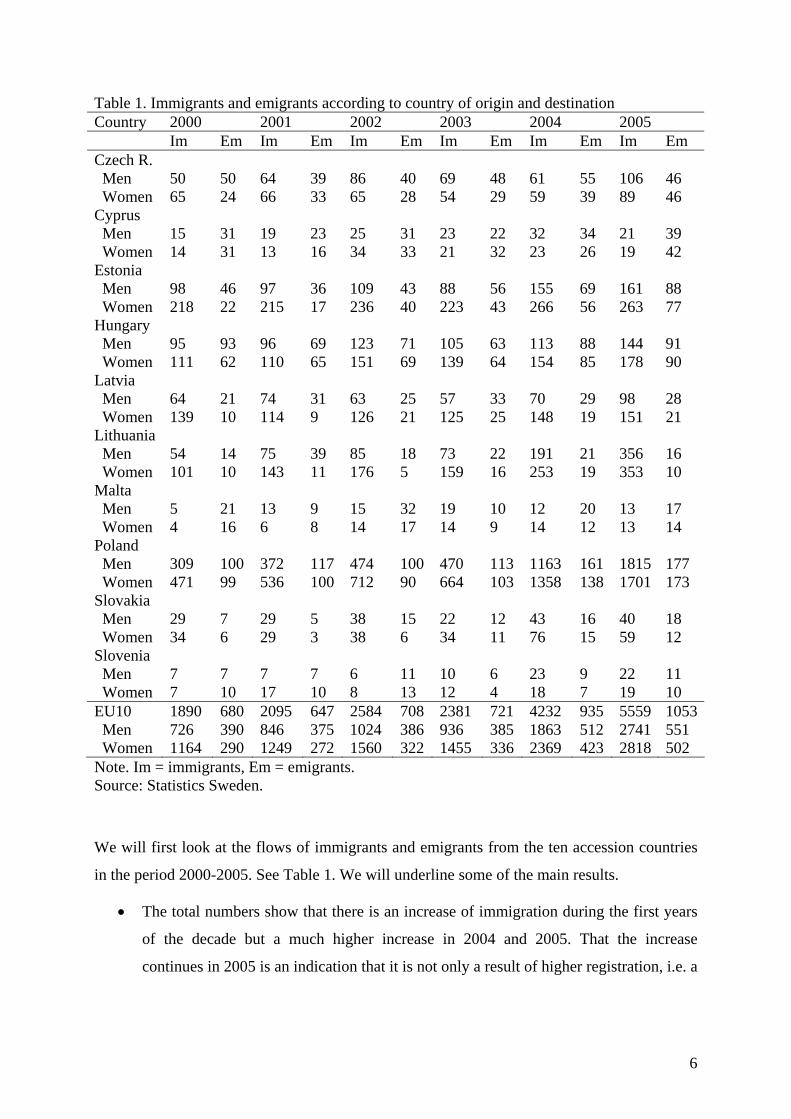
Table 1. Immigrants and emigrants according to country of origin and destination Country 2000 2001 2002 2003 2004 2005 Im Em Im Em Im Em Im Em Im Em Im Em Czech R. Men 50 50 64 39 86 40 69 48 61 55 106 46 Women 65 24 66 33 65 28 54 29 59 39 89 46 Cyprus Men 15 31 19 23 25 31 23 22 32 34 21 39 Women 14 31 13 16 34 33 21 32 23 26 19 42 Estonia Men 98 46 97 36 109 43 88 56 155 69 161 88 Women 218 22 215 17 236 40 223 43 266 56 263 77 Hungary Men 95 93 96 69 123 71 105 63 113 88 144 91 Women 111 62 110 65 151 69 139 64 154 85 178 90 Latvia Men 64 21 74 31 63 25 57 33 70 29 98 28 Women 139 10 114 9 126 21 125 25 148 19 151 21 Lithuania Men 54 14 75 39 85 18 73 22 191 21 356 16 Women 101 10 143 11 176 5 159 16 253 19 353 10 Malta Men 5 21 13 9 15 32 19 10 12 20 13 17 Women 4 16 6 8 14 17 14 9 14 12 13 14 Poland Men 309 100 372 117 474 100 470 113 1163 161 1815 177 Women 471 99 536 100 712 90 664 103 1358 138 1701 173 Slovakia Men 29 7 29 5 38 15 22 12 43 16 40 18 Women 34 6 29 3 38 6 34 11 76 15 59 12 Slovenia Men 7 7 7 7 6 11 10 6 23 9 22 11 Women 7 10 17 10 8 13 12 4 18 7 19 10 EU10 1890 680 2095 647 2584 708 2381 721 4232 935 5559 1053 Men 726 390 846 375 1024 386 936 385 1863 512 2741 551 Women 1164 290 1249 272 1560 322 1455 336 2369 423 2818 502 Note. Im = immigrants, Em = emigrants. Source: Statistics Sweden.
We will first look at the flows of immigrants and emigrants from the ten accession countries
in the period 2000-2005. See Table 1. We will underline some of the main results.
• The total numbers show that there is an increase of immigration during the first years
of the decade but a much higher increase in 2004 and 2005. That the increase
continues in 2005 is an indication that it is not only a result of higher registration, i.e. a
6
registration effect, but a real increase. The immigration from the accession countries is
still only a small part of the total immigration to Sweden however.
• The emigration to the accession countries is also increasing but it is much smaller than
the immigration (Cyprus and Malta are the only exceptions). Net immigration is a
large part of gross immigration.
• Women have constituted the majority of the immigrants from the accession countries
in all years of the period. That at the same time most of the emigrants are men
indicates that male immigrants are returning to a higher extent. The immigration of
men has increased more than the immigration of women in 2004 and 2005, however,
so that almost the same number of men and women came to Sweden from the ten
accession countries in 2005.
• The immigrants to Sweden from the ten accession states are mainly from Poland
which accounts for more than half of immigrants. The relative importance of
immigration from Poland greatly increased in 2004 and 2005. Poland is the largest of
the accession countries and a neighbour to Sweden on the other side of the Baltic
Sea.10 Besides Poland, the immigration is largest from the Baltic states, especially
Lithuania and Estonia.
The immigration has increased considerably from the accession states, especially from Poland,
but it is still small compared to the total immigration and the size of the Swedish labour
market. Why is this so? One explanation may be that there have been few job vacancies
available for newly arrived immigrants. The Swedish unemployment rate is low compared to
that in several other European countries and it is presently declining, but the job growth has
been low and the job vacancies few. Another explanation may be that the propensity to
emigrate has been lower than many expected in the accession states. A interview survey of
migration intentions in the Baltic states carried out a few years before the accession date
shows that the willingness to move abroad was not very high and also that only a few had the
Nordic countries (including Sweden) as the preferred destination.11 A third explanation is that
those migrating have chosen Ireland and the UK instead of Sweden due to easier access to the
10 Poland with a fast growing and changing economy is not only a country of origin for international migration but also a country of destination for especially people coming from some of the successor states to Soviet Union. See Igliska (2005) and also Igliska et al. (2005). A comparison with the migration statistics of other countries for the same migration flows indicates that international migration is probably much under-estimated in Polish statistics. 11 See Brunoskis, Djuve and Haualand (2003).
7
labour market in those countries and not least that English is the language of those two
countries.
3 The new immigrants and the labour market
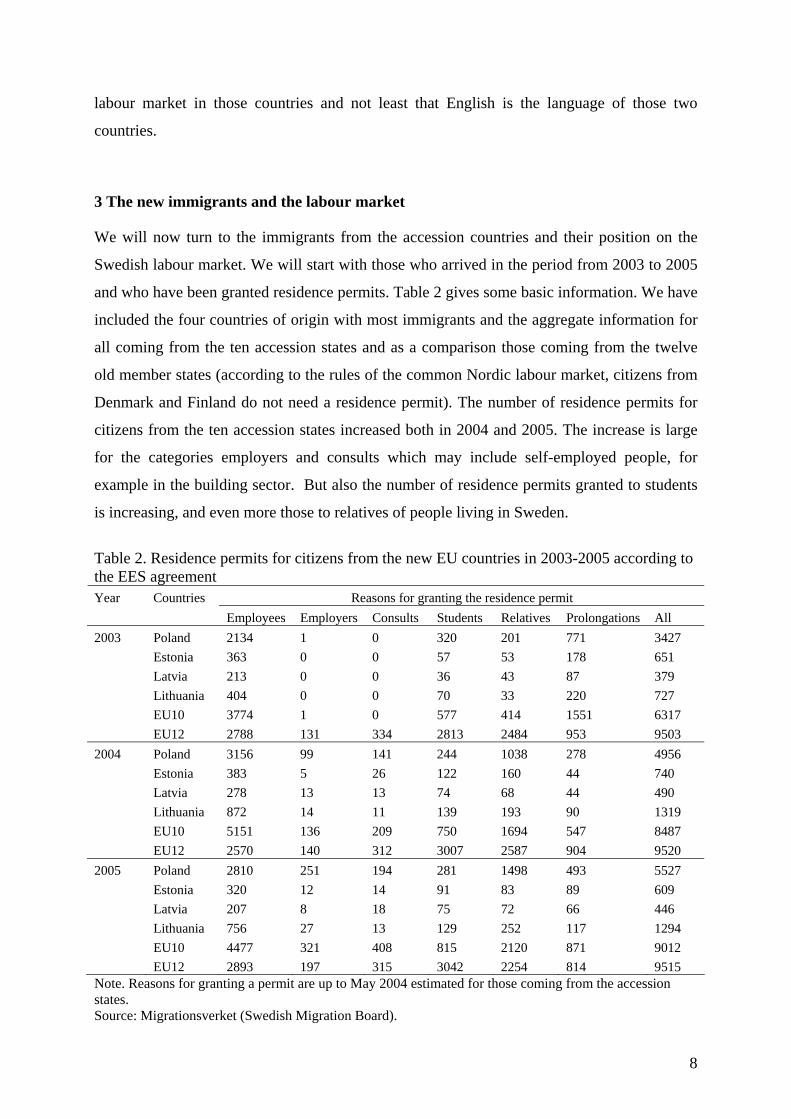
We will now turn to the immigrants from the accession countries and their position on the
Swedish labour market. We will start with those who arrived in the period from 2003 to 2005
and who have been granted residence permits. Table 2 gives some basic information. We have
included the four countries of origin with most immigrants and the aggregate information for
all coming from the ten accession states and as a comparison those coming from the twelve
old member states (according to the rules of the common Nordic labour market, citizens from
Denmark and Finland do not need a residence permit). The number of residence permits for
citizens from the ten accession states increased both in 2004 and 2005. The increase is large
for the categories employers and consults which may include self-employed people, for
example in the building sector. But also the number of residence permits granted to students
is increasing, and even more those to relatives of people living in Sweden.
Table 2. Residence permits for citizens from the new EU countries in 2003-2005 according to the EES agreement
Reasons for granting the residence permit Year Countries Employees Employers Consults Students Relatives Prolongations All
2003 Poland 2134 1 0 320 201 771 3427 Estonia 363 0 0 57 53 178 651 Latvia 213 0 0 36 43 87 379 Lithuania 404 0 0 70 33 220 727 EU10 3774 1 0 577 414 1551 6317 EU12 2788 131 334 2813 2484 953 9503 2004 Poland 3156 99 141 244 1038 278 4956 Estonia 383 5 26 122 160 44 740 Latvia 278 13 13 74 68 44 490 Lithuania 872 14 11 139 193 90 1319 EU10 5151 136 209 750 1694 547 8487 EU12 2570 140 312 3007 2587 904 9520 2005 Poland 2810 251 194 281 1498 493 5527 Estonia 320 12 14 91 83 89 609 Latvia 207 8 18 75 72 66 446 Lithuania 756 27 13 129 252 117 1294 EU10 4477 321 408 815 2120 871 9012 EU12 2893 197 315 3042 2254 814 9515 Note. Reasons for granting a permit are up to May 2004 estimated for those coming from the accession states. Source: Migrationsverket (Swedish Migration Board).
8
The next step is look at the labour market situation of the new migrants. This is however not
easy to do. The statistical data bases with information on the labour market which cover the
period after the accession of the ten member states are surveys, mainly the labour force
surveys, and the samples are not large enough to be of any use for a study of the new migrants.
We have instead used data containing information on all the population living in Sweden. The
latest year for which this data set is available is 2004. This means that we do not have any
information for immigrants arriving in 2005 and 2006. A further problem is that even if the
population included are those who are registered as living in Sweden in the end of the year
(for those coming from the accession states the criterion is that they have a residence permit
and are registered as living in Sweden December 31), the employment information is for
November. It means that the data set is not including information if people are employed or
not for those who have arrived in December (and maybe also in November) of the year
studied, only that they have arrived and are living in Sweden in the end of the year. In practice
we do not have any information on the labour market situation for the majority of those who
have arrived after the enlargement of the EU. What we can do and have done is to look at the
labour market situation for people who were born in one of ten accession countries and were
living in Sweden at the end of 2003 and 2004, respectively.
We will start with the employment rates for those who were born in the ten accession
countries and as a comparison the corresponding information for Sweden. See Table 3.
9
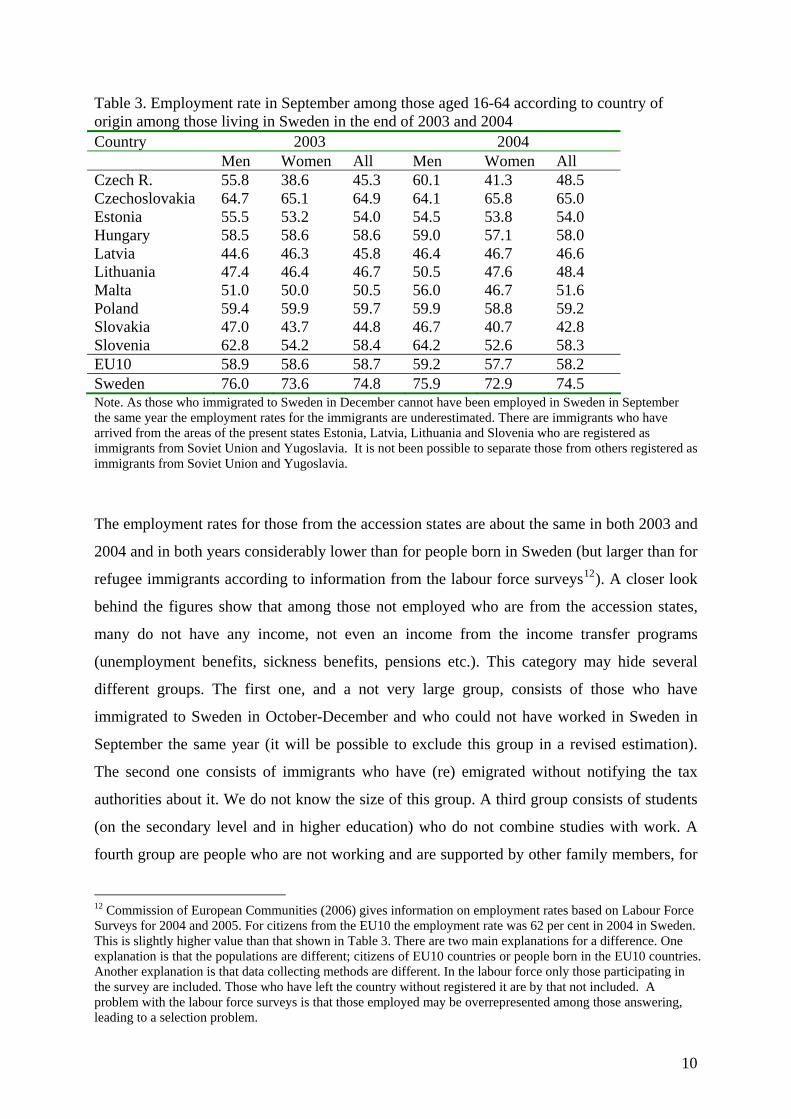
Table 3. Employment rate in September among those aged 16-64 according to country of origin among those living in Sweden in the end of 2003 and 2004 Country 2003 2004 Men Women All Men Women All Czech R. 55.8 38.6 45.3 60.1 41.3 48.5 Czechoslovakia 64.7 65.1 64.9 64.1 65.8 65.0 Estonia 55.5 53.2 54.0 54.5 53.8 54.0 Hungary 58.5 58.6 58.6 59.0 57.1 58.0 Latvia 44.6 46.3 45.8 46.4 46.7 46.6 Lithuania 47.4 46.4 46.7 50.5 47.6 48.4 Malta 51.0 50.0 50.5 56.0 46.7 51.6 Poland 59.4 59.9 59.7 59.9 58.8 59.2 Slovakia 47.0 43.7 44.8 46.7 40.7 42.8 Slovenia 62.8 54.2 58.4 64.2 52.6 58.3 EU10 58.9 58.6 58.7 59.2 57.7 58.2 Sweden 76.0 73.6 74.8 75.9 72.9 74.5 Note. As those who immigrated to Sweden in December cannot have been employed in Sweden in September the same year the employment rates for the immigrants are underestimated. There are immigrants who have arrived from the areas of the present states Estonia, Latvia, Lithuania and Slovenia who are registered as immigrants from Soviet Union and Yugoslavia. It is not been possible to separate those from others registered as immigrants from Soviet Union and Yugoslavia.
The employment rates for those from the accession states are about the same in both 2003 and
2004 and in both years considerably lower than for people born in Sweden (but larger than for
refugee immigrants according to information from the labour force surveys12). A closer look
behind the figures show that among those not employed who are from the accession states,
many do not have any income, not even an income from the income transfer programs
(unemployment benefits, sickness benefits, pensions etc.). This category may hide several
different groups. The first one, and a not very large group, consists of those who have
immigrated to Sweden in October-December and who could not have worked in Sweden in
September the same year (it will be possible to exclude this group in a revised estimation).
The second one consists of immigrants who have (re) emigrated without notifying the tax
authorities about it. We do not know the size of this group. A third group consists of students
(on the secondary level and in higher education) who do not combine studies with work. A
fourth group are people who are not working and are supported by other family members, for
12 Commission of European Communities (2006) gives information on employment rates based on Labour Force Surveys for 2004 and 2005. For citizens from the EU10 the employment rate was 62 per cent in 2004 in Sweden. This is slightly higher value than that shown in Table 3. There are two main explanations for a difference. One explanation is that the populations are different; citizens of EU10 countries or people born in the EU10 countries. Another explanation is that data collecting methods are different. In the labour force only those participating in the survey are included. Those who have left the country without registered it are by that not included. A problem with the labour force surveys is that those employed may be overrepresented among those answering, leading to a selection problem.
10
example housewives. A fifth group consists of people who work in the unregistered part of
the economy (the shadow economy). We do not have any estimates of the size of this group.
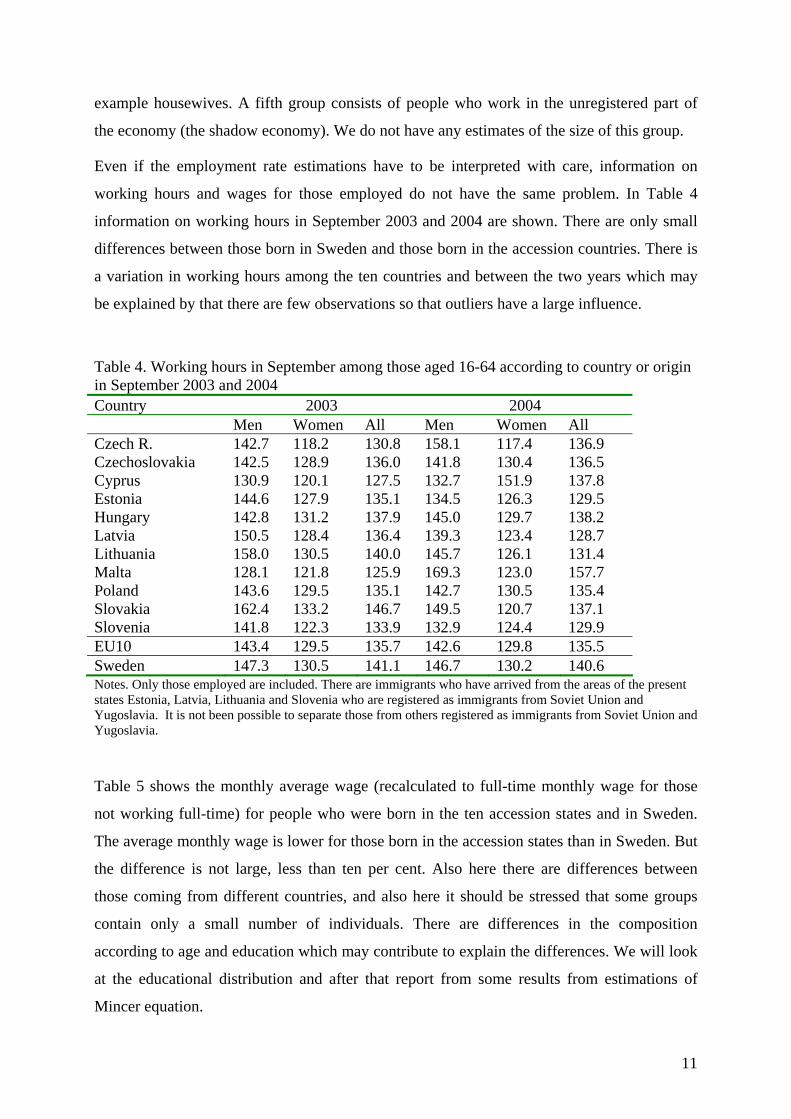
Even if the employment rate estimations have to be interpreted with care, information on
working hours and wages for those employed do not have the same problem. In Table 4
information on working hours in September 2003 and 2004 are shown. There are only small
differences between those born in Sweden and those born in the accession countries. There is
a variation in working hours among the ten countries and between the two years which may
be explained by that there are few observations so that outliers have a large influence.
Table 4. Working hours in September among those aged 16-64 according to country or origin in September 2003 and 2004 Country 2003 2004 Men Women All Men Women All Czech R. 142.7 118.2 130.8 158.1 117.4 136.9 Czechoslovakia 142.5 128.9 136.0 141.8 130.4 136.5 Cyprus 130.9 120.1 127.5 132.7 151.9 137.8 Estonia 144.6 127.9 135.1 134.5 126.3 129.5 Hungary 142.8 131.2 137.9 145.0 129.7 138.2 Latvia 150.5 128.4 136.4 139.3 123.4 128.7 Lithuania 158.0 130.5 140.0 145.7 126.1 131.4 Malta 128.1 121.8 125.9 169.3 123.0 157.7 Poland 143.6 129.5 135.1 142.7 130.5 135.4 Slovakia 162.4 133.2 146.7 149.5 120.7 137.1 Slovenia 141.8 122.3 133.9 132.9 124.4 129.9 EU10 143.4 129.5 135.7 142.6 129.8 135.5 Sweden 147.3 130.5 141.1 146.7 130.2 140.6 Notes. Only those employed are included. There are immigrants who have arrived from the areas of the present states Estonia, Latvia, Lithuania and Slovenia who are registered as immigrants from Soviet Union and Yugoslavia. It is not been possible to separate those from others registered as immigrants from Soviet Union and Yugoslavia.
Table 5 shows the monthly average wage (recalculated to full-time monthly wage for those
not working full-time) for people who were born in the ten accession states and in Sweden.
The average monthly wage is lower for those born in the accession states than in Sweden. But
the difference is not large, less than ten per cent. Also here there are differences between
those coming from different countries, and also here it should be stressed that some groups
contain only a small number of individuals. There are differences in the composition
according to age and education which may contribute to explain the differences. We will look
at the educational distribution and after that report from some results from estimations of
Mincer equation.
11
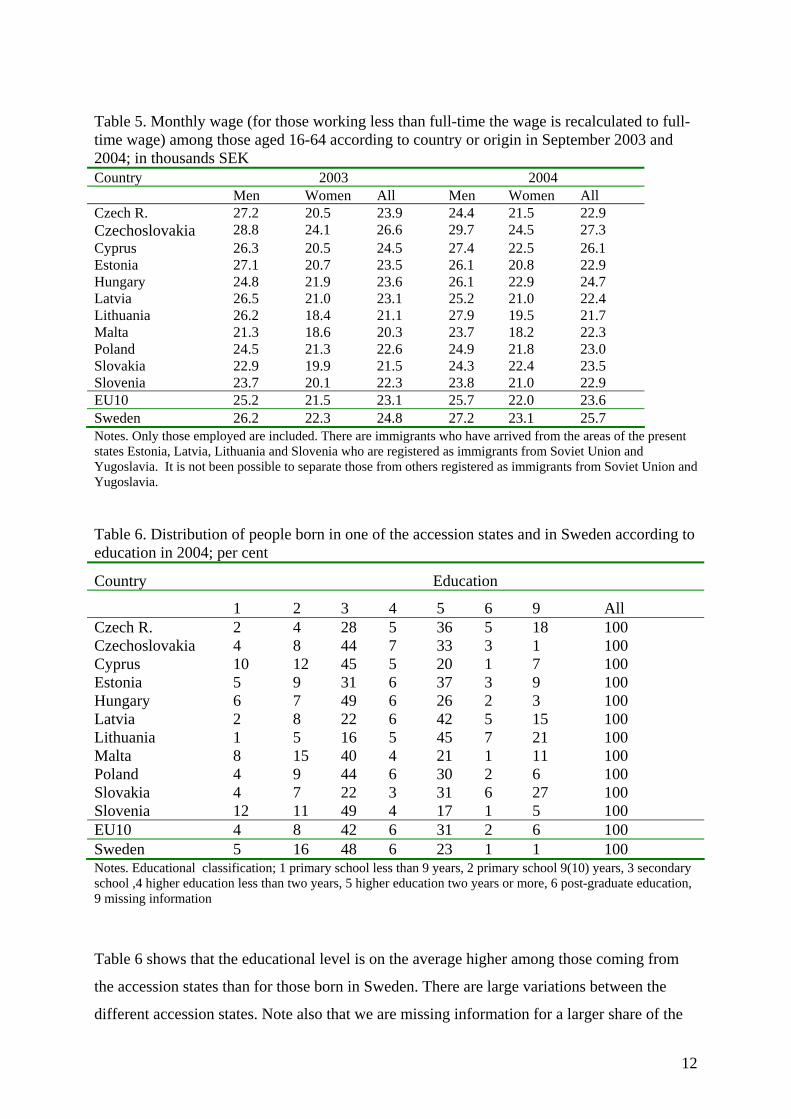
Table 5. Monthly wage (for those working less than full-time the wage is recalculated to full-time wage) among those aged 16-64 according to country or origin in September 2003 and 2004; in thousands SEK Country 2003 2004 Men Women All Men Women All Czech R. 27.2 20.5 23.9 24.4 21.5 22.9 Czechoslovakia 28.8 24.1 26.6 29.7 24.5 27.3 Cyprus 26.3 20.5 24.5 27.4 22.5 26.1 Estonia 27.1 20.7 23.5 26.1 20.8 22.9 Hungary 24.8 21.9 23.6 26.1 22.9 24.7 Latvia 26.5 21.0 23.1 25.2 21.0 22.4 Lithuania 26.2 18.4 21.1 27.9 19.5 21.7 Malta 21.3 18.6 20.3 23.7 18.2 22.3 Poland 24.5 21.3 22.6 24.9 21.8 23.0 Slovakia 22.9 19.9 21.5 24.3 22.4 23.5 Slovenia 23.7 20.1 22.3 23.8 21.0 22.9 EU10 25.2 21.5 23.1 25.7 22.0 23.6 Sweden 26.2 22.3 24.8 27.2 23.1 25.7 Notes. Only those employed are included. There are immigrants who have arrived from the areas of the present states Estonia, Latvia, Lithuania and Slovenia who are registered as immigrants from Soviet Union and Yugoslavia. It is not been possible to separate those from others registered as immigrants from Soviet Union and Yugoslavia.
Table 6. Distribution of people born in one of the accession states and in Sweden according to education in 2004; per cent
Country Education
1 2 3 4 5 6 9 All Czech R. 2 4 28 5 36 5 18 100 Czechoslovakia 4 8 44 7 33 3 1 100 Cyprus 10 12 45 5 20 1 7 100 Estonia 5 9 31 6 37 3 9 100 Hungary 6 7 49 6 26 2 3 100 Latvia 2 8 22 6 42 5 15 100 Lithuania 1 5 16 5 45 7 21 100 Malta 8 15 40 4 21 1 11 100 Poland 4 9 44 6 30 2 6 100 Slovakia 4 7 22 3 31 6 27 100 Slovenia 12 11 49 4 17 1 5 100 EU10 4 8 42 6 31 2 6 100 Sweden 5 16 48 6 23 1 1 100 Notes. Educational classification; 1 primary school less than 9 years, 2 primary school 9(10) years, 3 secondary school ,4 higher education less than two years, 5 higher education two years or more, 6 post-graduate education, 9 missing information
Table 6 shows that the educational level is on the average higher among those coming from
the accession states than for those born in Sweden. There are large variations between the
different accession states. Note also that we are missing information for a larger share of the
12
immigrants than for those born in Sweden. It is mainly for the newly arrived information on
education is missing.
We have made estimations of Mincer equations with the logarithm of the monthly full-time
wage as the dependent variable, and as independent variables age, age squared, woman,
educational levels and either dummy variables for being an immigrant from the different
EU10-countries or a dummy variable for coming from any of them. The result for the
coefficient of the EU10-dummy is a negative value indicating a negative wage premium of
about ten per cent (separate estimations for men and women have also been made, which
indicate a slightly less negative value for immigrant women than for immigrant men). When
dummies for the different countries are included in the estimations, the coefficients of all the
dummies are negative (those born in Sweden is the reference group), but the value of the
coefficient varies. It is lower in absolute terms for immigrants coming from countries from
which many have staid for long periods in Sweden, which could be explained by that
integration take time.
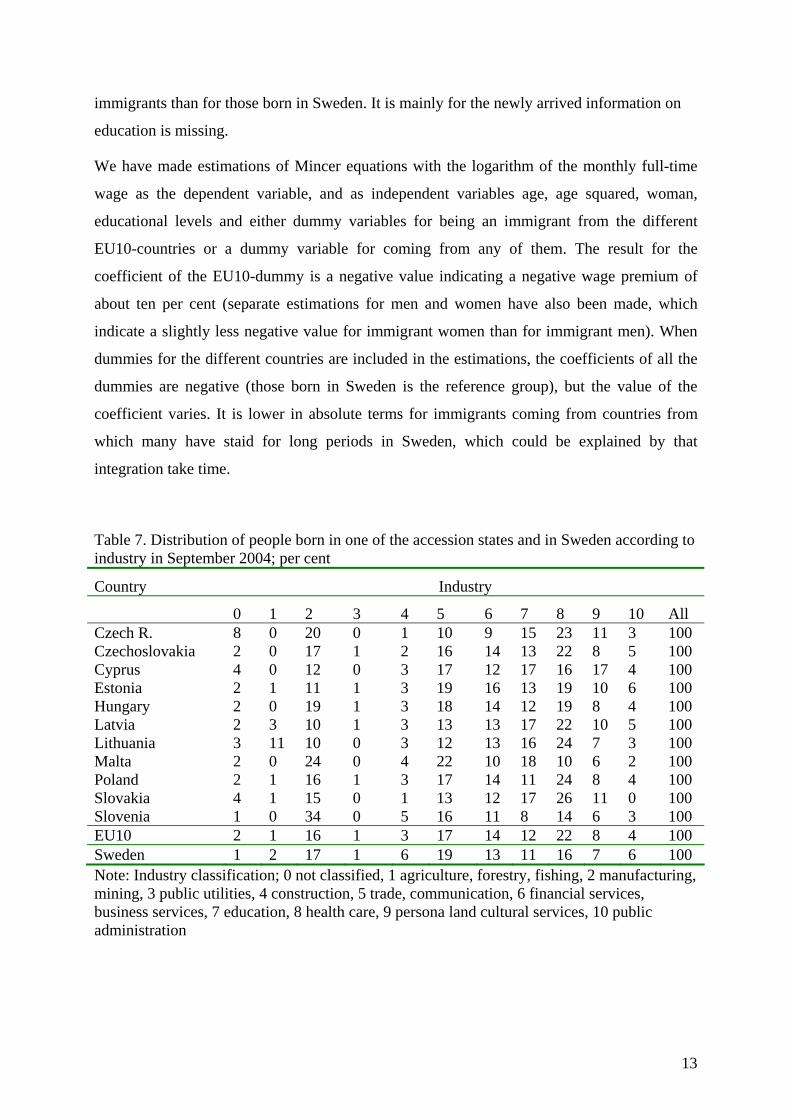
Table 7. Distribution of people born in one of the accession states and in Sweden according to industry in September 2004; per cent
Country Industry
0 1 2 3 4 5 6 7 8 9 10 All Czech R. 8 0 20 0 1 10 9 15 23 11 3 100 Czechoslovakia 2 0 17 1 2 16 14 13 22 8 5 100 Cyprus 4 0 12 0 3 17 12 17 16 17 4 100 Estonia 2 1 11 1 3 19 16 13 19 10 6 100 Hungary 2 0 19 1 3 18 14 12 19 8 4 100 Latvia 2 3 10 1 3 13 13 17 22 10 5 100 Lithuania 3 11 10 0 3 12 13 16 24 7 3 100 Malta 2 0 24 0 4 22 10 18 10 6 2 100 Poland 2 1 16 1 3 17 14 11 24 8 4 100 Slovakia 4 1 15 0 1 13 12 17 26 11 0 100 Slovenia 1 0 34 0 5 16 11 8 14 6 3 100 EU10 2 1 16 1 3 17 14 12 22 8 4 100 Sweden 1 2 17 1 6 19 13 11 16 7 6 100 Note: Industry classification; 0 not classified, 1 agriculture, forestry, fishing, 2 manufacturing, mining, 3 public utilities, 4 construction, 5 trade, communication, 6 financial services, business services, 7 education, 8 health care, 9 persona land cultural services, 10 public administration
13
Table 7 shows the industry distribution for those who were born in EU countries and as a
comparison those who were born in Sweden. The distribution is very much differences. The
main difference is that those coming from EU10 are overrepresented in the health care sector,
a sector characterized of a high demand for labour. Those born in Sweden are overrepresented
in construction and public administration.
We have estimated Mincer equations with the logarithm of the monthly full-time wage as the
dependent variable, and as independent variables age, age squared, female, educational levels
and either dummy variables for being an immigrant from the different EU10-countries or a
dummy variable for coming from any of them (see Table 8). The result for the coefficient of
the EU10-dummy is a negative value indicating a negative wage premium of about ten per
cent (separate estimations for men and women have also been made, which indicate a slightly
less negative value for immigrant women than for immigrant men). When dummies for the
different countries are included in the estimations, the coefficients of all the dummies are
negative (those born in Sweden is the reference group), but the value of the coefficient varies.
It is lower in absolute terms for immigrants coming from countries from which many have
stayed for long periods in Sweden, which could be explained by the fact that integration takes
time.
14
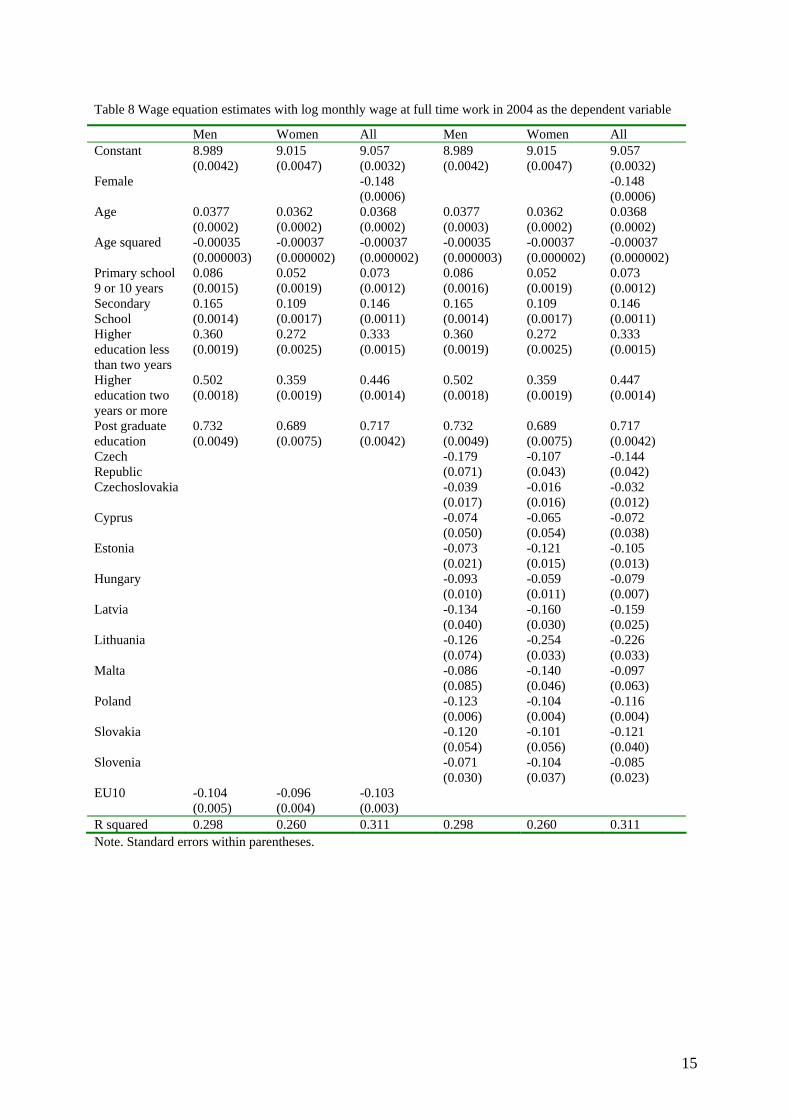
Table 8 Wage equation estimates with log monthly wage at full time work in 2004 as the dependent variable
Men Women All Men Women All Constant 8.989
(0.0042) 9.015 (0.0047)
9.057 (0.0032)
8.989 (0.0042)
9.015 (0.0047)
9.057 (0.0032)
Female -0.148 (0.0006)
-0.148 (0.0006)
Age 0.0377 (0.0002)
0.0362 (0.0002)
0.0368 (0.0002)
0.0377 (0.0003)
0.0362 (0.0002)
0.0368 (0.0002)
Age squared -0.00035 (0.000003)
-0.00037 (0.000002)
-0.00037 (0.000002)
-0.00035 (0.000003)
-0.00037 (0.000002)
-0.00037 (0.000002)
Primary school 9 or 10 years
0.086 (0.0015)
0.052 (0.0019)
0.073 (0.0012)
0.086 (0.0016)
0.052 (0.0019)
0.073 (0.0012)
Secondary School
0.165 (0.0014)
0.109 (0.0017)
0.146 (0.0011)
0.165 (0.0014)
0.109 (0.0017)
0.146 (0.0011)
Higher education less than two years
0.360 (0.0019)
0.272 (0.0025)
0.333 (0.0015)
0.360 (0.0019)
0.272 (0.0025)
0.333 (0.0015)
Higher education two years or more
0.502 (0.0018)
0.359 (0.0019)
0.446 (0.0014)
0.502 (0.0018)
0.359 (0.0019)
0.447 (0.0014)
Post graduate education
0.732 (0.0049)
0.689 (0.0075)
0.717 (0.0042)
0.732 (0.0049)
0.689 (0.0075)
0.717 (0.0042)
Czech Republic
-0.179 (0.071)
-0.107 (0.043)
-0.144 (0.042)
Czechoslovakia -0.039 (0.017)
-0.016 (0.016)
-0.032 (0.012)
Cyprus -0.074 (0.050)
-0.065 (0.054)
-0.072 (0.038)
Estonia -0.073 (0.021)
-0.121 (0.015)
-0.105 (0.013)
Hungary -0.093 (0.010)
-0.059 (0.011)
-0.079 (0.007)
Latvia -0.134 (0.040)
-0.160 (0.030)
-0.159 (0.025)
Lithuania -0.126 (0.074)
-0.254 (0.033)
-0.226 (0.033)
Malta -0.086 (0.085)
-0.140 (0.046)
-0.097 (0.063)
Poland -0.123 (0.006)
-0.104 (0.004)
-0.116 (0.004)
Slovakia -0.120 (0.054)
-0.101 (0.056)
-0.121 (0.040)
Slovenia -0.071 (0.030)
-0.104 (0.037)
-0.085 (0.023)
EU10 -0.104 (0.005)
-0.096 (0.004)
-0.103 (0.003)
R squared 0.298 0.260 0.311 0.298 0.260 0.311 Note. Standard errors within parentheses.
15
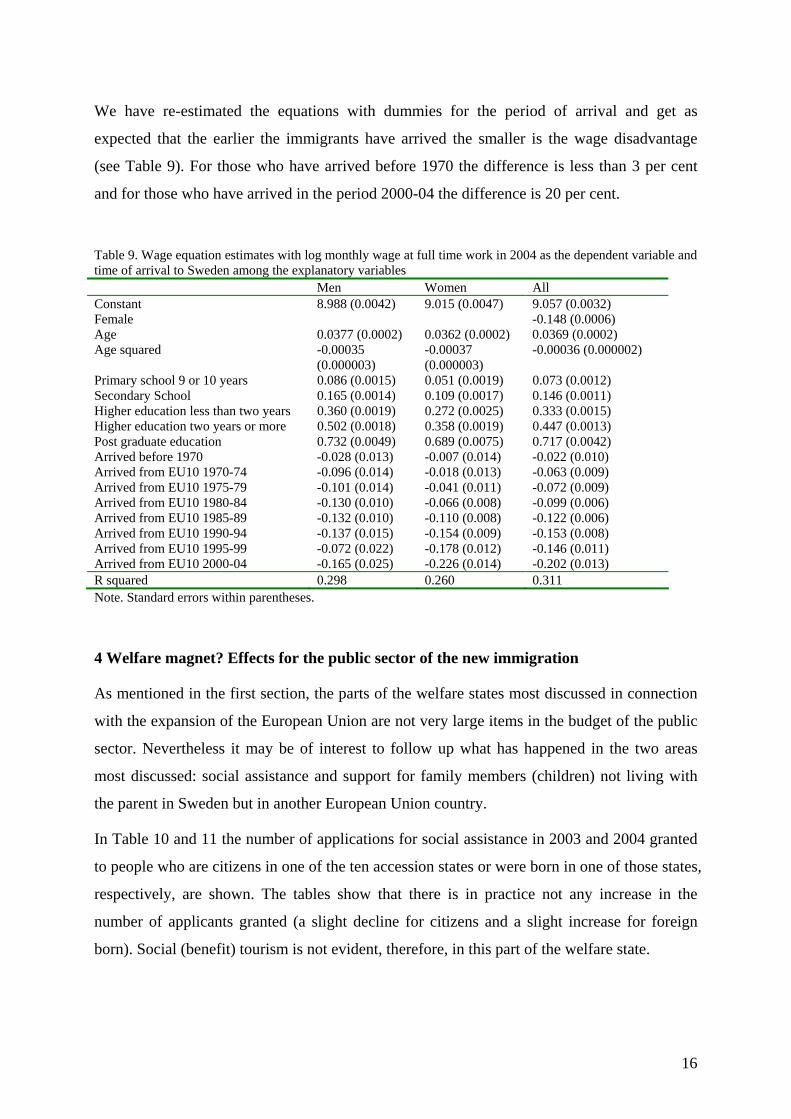
We have re-estimated the equations with dummies for the period of arrival and get as
expected that the earlier the immigrants have arrived the smaller is the wage disadvantage
(see Table 9). For those who have arrived before 1970 the difference is less than 3 per cent
and for those who have arrived in the period 2000-04 the difference is 20 per cent.
Table 9. Wage equation estimates with log monthly wage at full time work in 2004 as the dependent variable and time of arrival to Sweden among the explanatory variables Men Women All Constant 8.988 (0.0042) 9.015 (0.0047) 9.057 (0.0032) Female -0.148 (0.0006) Age 0.0377 (0.0002) 0.0362 (0.0002) 0.0369 (0.0002) Age squared -0.00035
(0.000003) -0.00037 (0.000003)
-0.00036 (0.000002)
Primary school 9 or 10 years 0.086 (0.0015) 0.051 (0.0019) 0.073 (0.0012) Secondary School 0.165 (0.0014) 0.109 (0.0017) 0.146 (0.0011) Higher education less than two years 0.360 (0.0019) 0.272 (0.0025) 0.333 (0.0015) Higher education two years or more 0.502 (0.0018) 0.358 (0.0019) 0.447 (0.0013) Post graduate education 0.732 (0.0049) 0.689 (0.0075) 0.717 (0.0042) Arrived before 1970 -0.028 (0.013) -0.007 (0.014) -0.022 (0.010) Arrived from EU10 1970-74 -0.096 (0.014) -0.018 (0.013) -0.063 (0.009) Arrived from EU10 1975-79 -0.101 (0.014) -0.041 (0.011) -0.072 (0.009) Arrived from EU10 1980-84 -0.130 (0.010) -0.066 (0.008) -0.099 (0.006) Arrived from EU10 1985-89 -0.132 (0.010) -0.110 (0.008) -0.122 (0.006) Arrived from EU10 1990-94 -0.137 (0.015) -0.154 (0.009) -0.153 (0.008) Arrived from EU10 1995-99 -0.072 (0.022) -0.178 (0.012) -0.146 (0.011) Arrived from EU10 2000-04 -0.165 (0.025) -0.226 (0.014) -0.202 (0.013) R squared 0.298 0.260 0.311 Note. Standard errors within parentheses.
4 Welfare magnet? Effects for the public sector of the new immigration
As mentioned in the first section, the parts of the welfare states most discussed in connection
with the expansion of the European Union are not very large items in the budget of the public
sector. Nevertheless it may be of interest to follow up what has happened in the two areas
most discussed: social assistance and support for family members (children) not living with
the parent in Sweden but in another European Union country.
In Table 10 and 11 the number of applications for social assistance in 2003 and 2004 granted
to people who are citizens in one of the ten accession states or were born in one of those states,
respectively, are shown. The tables show that there is in practice not any increase in the
number of applicants granted (a slight decline for citizens and a slight increase for foreign
born). Social (benefit) tourism is not evident, therefore, in this part of the welfare state.
16
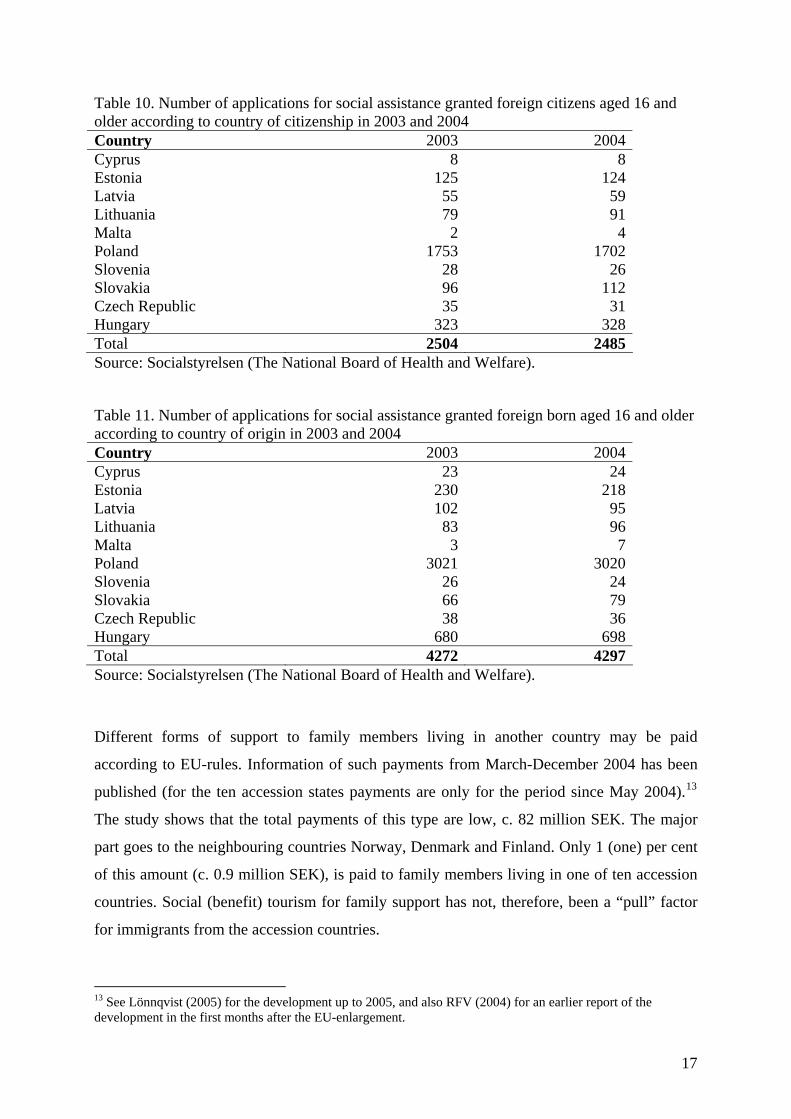
Table 10. Number of applications for social assistance granted foreign citizens aged 16 and older according to country of citizenship in 2003 and 2004 Country 2003 2004 Cyprus 8 8 Estonia 125 124 Latvia 55 59 Lithuania 79 91 Malta 2 4 Poland 1753 1702 Slovenia 28 26 Slovakia 96 112 Czech Republic 35 31 Hungary 323 328 Total 2504 2485 Source: Socialstyrelsen (The National Board of Health and Welfare).
Table 11. Number of applications for social assistance granted foreign born aged 16 and older according to country of origin in 2003 and 2004 Country 2003 2004 Cyprus 23 24 Estonia 230 218 Latvia 102 95 Lithuania 83 96 Malta 3 7 Poland 3021 3020 Slovenia 26 24 Slovakia 66 79 Czech Republic 38 36 Hungary 680 698 Total 4272 4297 Source: Socialstyrelsen (The National Board of Health and Welfare).
Different forms of support to family members living in another country may be paid
according to EU-rules. Information of such payments from March-December 2004 has been
published (for the ten accession states payments are only for the period since May 2004).13
The study shows that the total payments of this type are low, c. 82 million SEK. The major
part goes to the neighbouring countries Norway, Denmark and Finland. Only 1 (one) per cent
of this amount (c. 0.9 million SEK), is paid to family members living in one of ten accession
countries. Social (benefit) tourism for family support has not, therefore, been a “pull” factor
for immigrants from the accession countries.
13 See Lönnqvist (2005) for the development up to 2005, and also RFV (2004) for an earlier report of the development in the first months after the EU-enlargement.
17
5 Conclusions
It is now two years since ten countries became members of the European Union. The rules
implemented regarding immigration from the accession states vary between the 15 earlier
members of the European Union. Three countries Ireland, Sweden and the UK made a choice
not to delay the introduction of free labour mobility. It is of great interest to follow the
development in these three countries.
Two years is very short period for following up what has happened and in practice the period
is even shorter. For some types of data we have information for 2004 and 2005 (but not for
any part of 2006), i.e. for one year and eight months. For other types of data we have
information for only 2004, i.e. for only eight months after the accession, and for the labour
market outcome the information covers an even shorter part of the enlargement period. As it
takes time to react to new circumstances, like new rules regarding migration, we cannot
expect the full effect of the change to have taken place in only a few months or even in two
years. However, we believe that information for this short period may contribute to a better
knowledge of the likely effects of the deregulation of migration from the accession states. We
will here summarize the migration experiences for Sweden of the enlargement of the
European Union.
• The migration has increased from the accession states after the enlargement of the
European Union. It is more than two times larger in 2005 than in 2003. The
immigration of men has increased more than that of women. The immigrants are
mainly coming from the other side of the Baltic Sea – from Poland and the three Baltic
states.
• The number of residence permits granted for citizens in the ten accession states has
also increased. Residence permits may be granted for different reasons. All forms of
residence permit have increased except the prolongation category. The increase is
largest for relatives in absolute terms. In relative terms the increase is largest for
employers and consults.
• The labour market statistics have a production lag which makes it impossible to say
something about the situation of the new immigrants in 2006. The information we
have for immigrants from the accession states living in Sweden in 2003 and 2004 is
that the employment rate is lower than that for people born in Sweden. Part of it (or all
of it) may be explained by lags in the registration of returning migrants. A further
18

study is needed. Among employed immigrants from the accession states the working
hours are shorter and the monthly wages for full-time work is lower compared to those
of people born in Sweden, but the differences are relatively small compared to the
working hours and monthly wages of people born in Sweden.
• There is not any indication that the new immigrants from the accession states are over-
represented in the welfare state schemes which were the focus of the pre-enlargement
debate: social assistance and support to migrant family members living in the home
country.
19
References
Bandyopadhyay, Subhayu, Coughlin, Cletus C. and Wall, Howard, J. (2006), “Ethnic
Networks and U.S. Exports”, IZA DP No. 1998.
Boeri, Tito, Hanson, Gordon and MacCormick, Barry (eds.) (2002), Immigration Policy and
the Welfare System, Oxford University Press, Oxford.
Borjas, George J, (1999), “Immigration and Welfare Magnets,” Journal of Labor Economics,
Vol. 17, no. 4, pp. 607-37.
Borjas, George J. (2003), “The Labor Demand Curve Is Downward Sloping: Reexamining the
Impact of Immigration on the Labor Market”, Quarterly Journal of Economics, November, pp.
1335-1374.
Brunovskis, Anette, Djuve, Anne Britt and Haualand, Hilde Maria (2003), Facing a Baltic
Invasion? Mobility of Baltic labour towards the Nordic countries, Fafo, Oslo.
Chonicki, Xavier (2004), “The Economic Impact of Immigration for the Host Countries”,
Brussels Economic Review, Vol. 47, pp. 9-28.
Coleman, David and Wadensjö, Eskil with contributions by Bent Jensen and Søren Pedersen
(1999), Immigration to Denmark. International and National Perspectives. Aarhus University
Press, Aarhus.
Commission of the European Communities (2006), “Report on the Functioning of the
Transitional Arrangements set out in the 2003 Accession Treaty (period 1 May 2004 – 30
April 2006)”, Communication from the Commission to the Council, The European Parliament,
The European Economic and Social Committee and the Committee of the Regions.
Dølvik, Jon Erik and Eldring, Line (2005), Arbeids- og tjenstemobilitet etter EU-udvidelsen.
Nordiske forskjeller og fellestrekk, TemaNord 2005:566.
Doyle, Nicola, Hughes, Gerald and Wadensjö, Eskil (2006), Freedom of Movement for
Workers from Central and Eastern Europe. Experiences in Ireland and Sweden, SIEPS
2006:5.
Dustmann, Christian, Casanova, Maria, Fertig, Michael, Preston, Ian and Schmidt, Christoph
M (2003), “The impact of EU enlargement on migration flows”, Home Office Online Report
25/03.
20
Ekberg, Jan (1983), Inkomsteffekter av invandring. Acta Wexionensia, Serie 2, Economy &
Politics, Växjö.
Ekberg, Jan (1998), “Hur påverkar invandring inkomster för infödda?” in Torben Bager &
Shahamak Rezaei (eds.), Invandringens økonomiske konsekvenser i Skandinavien, Sydjysk
Universitetsforlag, Esbjerg.
Ekberg, Jan (1999), “Immigration and the public sector: Income effects for the native
population in Sweden”, Journal of Population Economics, Vol. 12, pp. 278-97.
Eriksson, Jonas (2004), “Nettomigrationen från de nya EU-länderna – utvärdering och
prognostisering”, SIEPS, 2004:2u.
Gilpin, Nicola, Henty, Matthew, Lemos, Sara, Portes, Jonathan and Bullen, Chris (2006),
“The impact of free movement of workers from Central and Eastern Europe on the UK labour
market”, Department for Work and Pensions, London, Working Paper No. 29.
Gott, Ceri and Johnston, Karl (2002), ”The migrant population in the UK: fiscal effects”, RDS
Occasional Paper, No 77, Home Office, London.
Gustafsson, Björn and Österberg, Torun (2001), “Immigrants and the public sector budget –
accounting exercises for Sweden”, Journal of Population Economics, Vol. 14, pp. 689-708.
Iglicka, Krystyna (2005), “The Impact of the EU Enlargement on Migratory Movement in
Poland”, Reports & Analyses 12/5, Center for International Relations, Warsaw.
Iglicka, Krystyna, Kazmierkiewicz, Piotr and Weinar, Agniezka (2005), “Poland” in Jan
Niessen, Yongmi Schibel and Cressida Thompson (eds.), Current Immigration Debates in
Europe: A Publication of the European Migration Dialogue, MPG, Brussels.
Leibfritz, Willi, O’Brien, Paul and Dumont Jean-Christophe (2003), ”Effects of Immigration
on Labour Markets and Government Budgets – An Overview”, CESifo Working Paper No.
874.
Longhi, Simonetta, Nijkamp, Peter and Poot, Jacques (2004), “A Meta-Analytic Assessment
of the Effect of Immigration on Wages”, Tinbergen Institute Discussion Paper TI 2004-134/3.
Lönnqvist, Anders (2005), “Utbetalning av familjeförmåner med stöd av EG-lagstiftningen
under 2004”, Försäkringskassan Analyserar 2005:3.
Nilsson, Åke (2004), “Efterkrigstidens invandring och utvandring”, SCB, Demografiska
rapporter 2004:5.
21
Passel, Jeffrey S. and Zimmermann, Wendy (2001), “Are Immigrants Leaving California?
Settlement Patterns of Immigrants in the Late 1990s”, Urban Institute, research report.
Pedersen, Peder, Pytlikova, Mariola and Smith, Nina (2004), “Selection or network effects?
Migration flows into OECD countries 1990-2000”, working paper.
Persson, Ingvar (2005), Konflikten i Vaxholm, Premiss förlag, Stockholm.
RFV (2004), Återrapportering av regeringsuppdrag att redovisa ärenden avseende
familjeförmåner (EU-ärenden), S2003/10128/2F, Dnr 11139/03
Sinn, Hans-Werner and Ochel, Wolfgang (2003), ”Social Union, Convergence and
Migration”, JCMS, vol. 41, pp. 869-896.
Wadensjö, Eskil (1973), Immigration och samhällsekonomi. Studentlitteratur, Lund.
Wadensjö, Eskil (2000), “Immigration, the labour market, and public finances in Denmark,”
Swedish Economic Policy Review Vol. 7, pp. 59-84.
Wadensjö, Eskil (2000a),“Omfördelning via offentlig sektor: en fördjupad analys” in Gunnar
Viby Mogensen & Poul Chr. Matthiessen (eds.), Integration i Danmark omkring
årtusindskiftet, Aarhus University Press, Århus.
Wadensjö, Eskil (2002), “Ekonomiska effekter av invandringen” in Gunnar Viby Mogensen
& Poul Chr. Matthiessen (eds.), Invandrerne og arbejdsmarkedet, Spektrum, København.
Wadensjö, Eskil and Orrje, Helena (2002), Immigration and the Public Sector in Denmark,
Aarhus Universitetsforlag, Århus.
Wadensjö, Eskil and Gerdes, Christer (2004), “Immigrants and the Public Sector in Denmark
and Germany” and “Some Socioeconomic Consequences of Immigration” in Torben Tranæs
& Klaus Zimmerman (eds.), Migrants, Work and the Welfare State, University Press of
Southern Denmark, Odense.
22