Embed Size (px)
Citation preview
Post-£ood¢eld investigations in upland catchments aftermajor£ash£oods:proposal ofamethodologyand illustrationsE. Gaume1 and M. Borga2
1 Laboratoire Central des Ponts et Chaussees, Nantes, France
2 University of Padova, Padova, Italy
Correspondence:
E. Gaume, Laboratoire Central des Ponts et
Chaussees, Division Eau et Environnement, BP
4129–44341 Bouguenais Cedex, Nantes,
France
Tel. 33-(0)240845884
Email: [email protected]
DOI:10.1111/j.1753-318X.2008.00023.x
Key words
Flash floods; discharge estimation;
rainfall–runoff; risk assessment; survey.
Abstract
Post-event survey and investigation is one way to gain experience on natural
hazards. The importance of the systematisation and standardisation of such
investigations and re-analysis is progressively recognised in all the geophysical
sciences as shown by the growing number of scientific papers and programs on the
subject. But how to proceed in the case of a flash floods, what type of data should
be collected for what type of analyses and to explore which particular issues? To
give a first answer to these questions, a methodology for post-flash flood field
investigations has been developed under the EC FLOODsite project and tested
under the EC HYDRATE project. This paper presents shortly the principles of this
methodology and illustrates its application for the study of two major flash floods
that occurred in November 1999 and September 2002 in the South of France.
Introduction
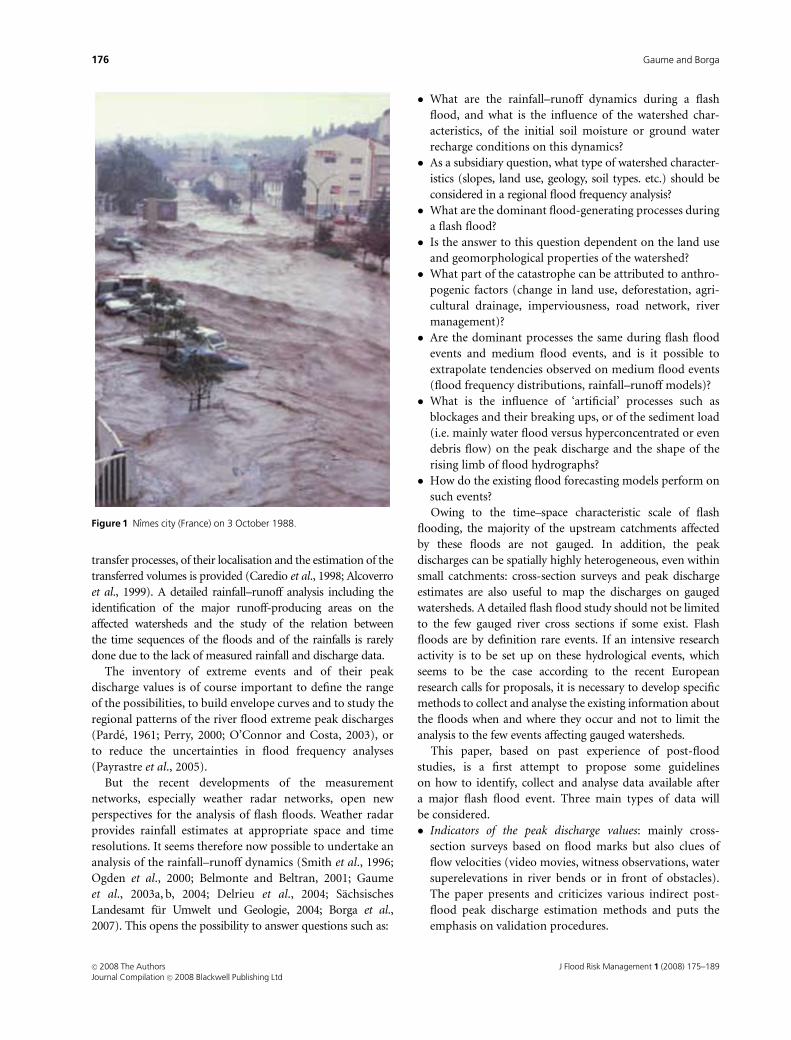
Are field investigations conducted after major flash flood
events really useful and what for? The question formulated
in that manner may appear a little surprising. In fact, flash
floods, sudden floods with high peak discharges produced
by severe thunderstorms that are generally of limited areal
extent (IAHS, 1974), rank as the most destructive process
among weather-related hazards in many parts of the world.
Forgoing studying these extreme events, because no mea-
sured data are directly to hand, or because data that exist are
not considered as sufficiently accurate, or even because it is
time consuming and limiting the hydrological analyses to
moderate events on gauged watersheds, would be focussing
on the trivial while skipping the essential (Figure 1).
Post-flood surveys appear clearly as a necessity to increase
the existing knowledge on such events to provide adapted
methods of analysis and technical solutions for flood preven-
tion and control. The questions are rather how to proceed,
what type of data can and should be collected for what type of
analysis and what questions should be explored.
Past experience show that two main types of post-flood
investigations can be distinguished that differ by their
objectives and context. The first type is generally commis-
sioned by the local or national authorities after a major
catastrophe. The main objective is to answer questions
raised by the public and local stakeholders on the causes of
the floods, the possible human impacts on the flood
magnitude and frequency, but also on the management of
the crisis, the efficiency of the flood mitigation measures and
the solutions to recover from the flood and to limit the
future risks (Huet, 2005). Typical examples are the investiga-
tions conducted after the major 1987 floods in Switzerland
(Bundesamt fur Wasserwirtschaft, 1991) or more recently in
France (Lefrou et al., 2000; Huet et al., 2003). The purposes of
such investigations are well defined and limited to the raised
questions. Scientists are generally involved either to conduct
studies on some specific questions or to take part in scientific
support groups. Research activities may be conducted during
such investigations, but it is then a by-product. The objective
is mainly to draw the lessons of the event at the local scale and
not to increase the overall scientific and technical knowledge.
A second type of post-flood investigations is conducted
more systematically by technical services like the US Geologi-
cal Survey (Bowers, 2001; Juracek et al., 2001; Carter et al.,
2002; Winston and Criss, 2002), the Istituto di Ricerca per la
Protezione Idrogeologica in Italy for instance or by research
institutions (Hemain and Dourlens, 1989; Gilard and Mesnil,
1995). The aim is then to document the extreme events. Most
of the past works have been limited to a description of the
event through the available measured data (rain gauge or river
gauge measurements) and some field observations as cross-
section surveys and corresponding peak discharge estimates
generally for one single selected river reach (Costa, 1987a;
Jarrett, 1987; Gutknecht, 1994; House and Pearthree, 1995;
Rico et al., 2001). Sometimes the description of the sediment
J Flood Risk Management 1 (2008) 175–189 c� 2008 The AuthorsJournal Compilation c� 2008 Blackwell Publishing Ltd
transfer processes, of their localisation and the estimation of the
transferred volumes is provided (Caredio et al., 1998; Alcoverro
et al., 1999). A detailed rainfall–runoff analysis including the
identification of the major runoff-producing areas on the
affected watersheds and the study of the relation between
the time sequences of the floods and of the rainfalls is rarely
done due to the lack of measured rainfall and discharge data.
The inventory of extreme events and of their peak
discharge values is of course important to define the range
of the possibilities, to build envelope curves and to study the
regional patterns of the river flood extreme peak discharges
(Parde, 1961; Perry, 2000; O’Connor and Costa, 2003), or
to reduce the uncertainties in flood frequency analyses
(Payrastre et al., 2005).
But the recent developments of the measurement
networks, especially weather radar networks, open new
perspectives for the analysis of flash floods. Weather radar
provides rainfall estimates at appropriate space and time
resolutions. It seems therefore now possible to undertake an
analysis of the rainfall–runoff dynamics (Smith et al., 1996;
Ogden et al., 2000; Belmonte and Beltran, 2001; Gaume
et al., 2003a, b, 2004; Delrieu et al., 2004; Sachsisches
Landesamt fur Umwelt und Geologie, 2004; Borga et al.,
2007). This opens the possibility to answer questions such as:
� What are the rainfall–runoff dynamics during a flash
flood, and what is the influence of the watershed char-
acteristics, of the initial soil moisture or ground water
recharge conditions on this dynamics?
� As a subsidiary question, what type of watershed character-
istics (slopes, land use, geology, soil types. etc.) should be
considered in a regional flood frequency analysis?
� What are the dominant flood-generating processes during
a flash flood?
� Is the answer to this question dependent on the land use
and geomorphological properties of the watershed?
� What part of the catastrophe can be attributed to anthro-
pogenic factors (change in land use, deforestation, agri-
cultural drainage, imperviousness, road network, river
management)?
� Are the dominant processes the same during flash flood
events and medium flood events, and is it possible to
extrapolate tendencies observed on medium flood events
(flood frequency distributions, rainfall–runoff models)?
� What is the influence of ‘artificial’ processes such as
blockages and their breaking ups, or of the sediment load
(i.e. mainly water flood versus hyperconcentrated or even
debris flow) on the peak discharge and the shape of the
rising limb of flood hydrographs?
� How do the existing flood forecasting models perform on
such events?
Owing to the time–space characteristic scale of flash
flooding, the majority of the upstream catchments affected
by these floods are not gauged. In addition, the peak
discharges can be spatially highly heterogeneous, even within
small catchments: cross-section surveys and peak discharge
estimates are also useful to map the discharges on gauged
watersheds. A detailed flash flood study should not be limited
to the few gauged river cross sections if some exist. Flash
floods are by definition rare events. If an intensive research
activity is to be set up on these hydrological events, which
seems to be the case according to the recent European
research calls for proposals, it is necessary to develop specific
methods to collect and analyse the existing information about
the floods when and where they occur and not to limit the
analysis to the few events affecting gauged watersheds.
This paper, based on past experience of post-flood
studies, is a first attempt to propose some guidelines
on how to identify, collect and analyse data available after
a major flash flood event. Three main types of data will
be considered.
� Indicators of the peak discharge values: mainly cross-
section surveys based on flood marks but also clues of
flow velocities (video movies, witness observations, water
superelevations in river bends or in front of obstacles).
The paper presents and criticizes various indirect post-
flood peak discharge estimation methods and puts the
emphasis on validation procedures.
Figure 1 Nımes city (France) on 3 October 1988.
J Flood Risk Management 1 (2008) 175–189c� 2008 The AuthorsJournal Compilation c� 2008 Blackwell Publishing Ltd
176 Gaume and Borga
� Indicators of the time sequence of the flood: mainly eye-
witness accounts where no stream gauge measurements
are available. Accounts from eyewitnesses are occasionally
cited in flash flood studies; they have seldom been, to our
knowledge, systematically collected and analysed.
� Sediment transfer processes (erosion and deposition on
slopes and in river beds, hyperconcentrated, mud or debris
flow): mainly focus of the post-flood investigation but
also as an indication of the local runoff generation
processes and flow energy and velocity.
Information on socio-economic aspects can also be col-
lected such as geo and time references of accidents, qualitative
description of public behaviour, and effectiveness of warning
broadcasts, nature and extension of the damages caused to
bridges, roads and buildings, but will not be discussed herein.
This paper is based on illustrations of the hydrological
valuations of the collected data. This, we hope, will convince
the readers that the conclusions that can be drawn from post-
flood investigations are worth the time spent to collect and
analyse the data. Our common knowledge on flash floods will
only grow through the multiplication of post-flood field
surveys for two main reasons. The conclusions drawn on one
single event, based on inaccurate and partial data may be
questionable and will be consolidated on the basis of repeated
post-flood analyses. Various case studies are needed to deter-
mine whether the hydrological behaviour described for one
flash flood is a general pattern for the considered region or
type of watershed or is an outcome of spatial and temporal-
specific circumstances (i.e. rainfall pattern, wetness state of the
soils, soil types, geology of the watersheds, etc.).
The paper is structured into two parts: (i) the presenta-
tion of a proposed post-flood investigation methodology
and (ii) illustration of post-flood hydrological analyses. We
hope that the guidelines presented herein will contribute to
the systematization of post-flash flood field investigations.
Principles of a methodology
The proposed methodology is presented in detail in a
research report published within the European research
project FLOODsite (Gaume, 2006). This report can be
downloaded on the Floodsite Web site or directly obtained
from the authors of the present paper.
Table 1 summarizes the proposed procedures for the
collation and the analysis of the field data. We will here
shortly add some additional comments about post-flood
investigations and develop on some specific aspects of peak
Table 1 Steps of the proposed data collation and analysis procedures
Data collation process Data analysis process
Phase 1: Just after the flood Step 1: Peak discharges estimation and mapping
� Collect the data on the rainfall event (rain gauge measurements,
radar images) to locate the affected areas.
� If possible, first reconnaissance visit of the affected areas, pictures
(flood marks, large debris, river bed state) can be taken, but no
survey work can generally be conducted during the crisis time.
Phase 2: A few weeks after the flood
� The cross-section surveys can begin as well as some interviews of
witnesses depending on the local atmosphere.
Phase 3: A few months after the flood
� It is certainly the best period for the survey work especially for the
interviews. The area is fully accessible and the stress has fallen
again. The river beds and marks may have been cleaned out; this
is why the pictures taken in phase 1 or 2 are important.
� Collect additional data useful for the analysis (river gauge
measurements, digital terrain model, soil, land-use, geological
map, soil moisture measurements, satellite or pictures taken by
plane, flood mark inventories, etc.).
� Preparation of the rainfall–runoff simulations to support the
interpretations.
Phase 4: The year after the flood
� Owing to the inaccuracy of the available data, a post-flood
investigation has some similarities with police inquiries. It is a
long-lasting work, requiring cross-checking and possibly returns
to the phase 3.
� Based on the cross sections surveyed, peak discharges and specific
discharges can be estimated at various locations of the considered river
and of its tributaries and reported on a map.
� Test of the spatial consistency of the estimates and comparison with
rainfall data to get a first idea of possible runoff rates.
� A comparison with rainfall, geological, land use maps gives some first
idea of the possible factors affecting the flood magnitude.
Step 2: Rainfall–runoff dynamics
� Where radar quantitative precipitation estimates appear reliable and where
complete or partial flood hydrographs can be retrieved from measured data
or accounts or documents (dated pictures) from the witnesses, they can be
compared with simple rainfall–runoff (RR) simulations to get a better idea
about the RR dynamics, especially about the evolution of runoff rates
during the flood.
Step 3: Comparison with previous floods
� If step 2 could be performed, the same RR simulations can be conducted for
previous large floods that occurred on the same catchment if it is gauged or
on nearby similar gauged catchments.
Step 4: Accompanying processes
� When the runoff is described, accompanying processes such as erosion
intensity on hill slopes, sediment transport or local flow characteristics can
be studied.
J Flood Risk Management 1 (2008) 175–189 c� 2008 The AuthorsJournal Compilation c� 2008 Blackwell Publishing Ltd
177Post-flood field investigations in upland catchments
discharge estimation methods and of the use of sediment
transfer and erosion evidences.
Three important ingredients are needed for an efficient
field survey to be conducted. First, the survey must be well
prepared. This preparation includes organizational aspects
but also the collation and criticism of the available data
(geology, hydrogeology, soils types, measured rainfall rates
and discharges, previous conducted hydrological studies on
the area, etc.) previously to the field work. The field survey
must rely on knowledge of the analysed watersheds
and some initial questions concerning their hydrological
behaviour. Therefore, a field survey campaign can hardly be
conducted immediately after the flood event. Nevertheless,
it is preferable to make a first-round tour of the area just
after the flood and take pictures to locate flood marks that
can rapidly be removed and to have a clear reference state of
the river system since river beds are generally rapidly cleaned
up after a major flood event.
The second important aspect is the standardization of the
type of data collected and of their storage formats and
analysis procedures. This facilitates intercomparisons and
data archiving. Moreover, it is important to store all the raw
data for an a posteriori criticism and discussion of their
interpretation. The exact location of the surveyed cross
sections, or interviews should be clearly indicated, pictures
taken and stored showing the local environment and specific
reference points mentioned by interviewed people or hy-
draulic singularities which could have influenced the water
levels, the surveyed values as well as the details of peak
discharge computations and the accompanying hypotheses
should be included, as the name of the persons who
produced the document. Standard cross-section survey and
interview summary forms have been therefore proposed and
are presented in Appendix A.
Finally, a post-flood field survey can never be an auto-
matic application of a recipe. Each case study has its own
specificities. Like in any inquiry on complex situations, it is
necessary to develop a terrain observation skill for the
selection of the most suited cross sections for peak discharge
estimations and for the detection and the valuation of any
possible clue: flood marks, erosion evidences on hill slopes
or in the river beds, films and pictures, etc. Also discharge
estimation validation, consistency testing and the search for
additional information to confirm the first guesses or
conclusions should be a constant concern in post-event field
surveys. The following two examples illustrate this principle.
Peak discharge estimation approaches
Peak discharges can be estimated in ungauged sites after a
major flood event on the basis of flood marks and surveyed
river cross sections. Without direct current meter measure-
ments, these estimates rely on hydraulic modelling and on
sound engineering judgment. The sources of uncertainties
and errors are numerous: choice of the appropriate surveyed
river reaches that must not have been too much modified by
sediment movements (erosion or deposition) and not
affected by mud or debris flow or blockages, estimate of
water levels or water longitudinal profiles through flood
marks, choice of the roughness coefficient values.
Flood marks for instance may either indicate the water
level in still water areas or the total hydraulic head on
obstacles located in the flow. Flood marks in vegetation on
river banks or in the flood plain where the flow velocity is
reduced should be preferred. Moreover, marks may have
been deposited on vegetation temporarily bent by the flow,
may have slid down a smooth support, or be the result of
water projections. To reduce uncertainties, as many as
possible flood marks should be surveyed in a given cross
section. Concerning the roughness coefficient, tabulated
values (Benson and Dalrymple, 1967) and empirical equa-
tions (Chow, 1959) exist. But they were established in cases
of moderate floods and low-gradient streams and it seems
that the apparent roughness of a stream has to be signifi-
cantly increased for extreme floods to obtain realistic
discharge estimates (Jarrett, 1987; Jarrett, 1990; Gaume
et al., 2004).
For all these reasons, it is necessary to seek for various
sources of information to enable a cross-checking and to
reduce uncertainties and avoid significant errors: select more
than one cross section for each river reach with significantly
different cross-sectional shapes and areas, test the upstream–
downstream consistency of the estimated discharges on a
watershed and also evaluate directly the possible flow velocity
ranges on films and pictures, use sediment transport and
erosion indicators, and test the rainfall–runoff consistency.
Some examples of discharge estimation checking and valida-
tion are presented in the next section.
Field surveys provide cross-sectional wetted areas,
which accuracies depend on the accuracy of the flood
marks. Velocity profiles or average velocities must be
determined to evaluate the corresponding discharge values.
This is mainly where the hydraulic models are needed.
In rivers with shallow slopes – typically 1/1000 or less –
one-dimensional hydraulic models are necessary owing
to the distance over which backwater effects propagate
(see Naulet, 2002, for an illustration): i.e. most generally
the flow is subcritical even during extreme flood events
except in some specific cross sections (Jarrett, 1987). Note
that the definition of the downstream boundary condition is
in this case an additional source of uncertainty. In complex
cross-section shapes, in the surroundings of bridges or in
urban areas, two-dimensional hydraulic models may be
needed to capture the complex pattern of transversal and
longitudinal velocity profiles (see Denlinger et al., 2001, for
an illustration).
J Flood Risk Management 1 (2008) 175–189c� 2008 The AuthorsJournal Compilation c� 2008 Blackwell Publishing Ltd
178 Gaume and Borga
In the case of relatively steep river channels in headwater
catchments affected by flash floods – slopes typically larger
than 0.5% – a uniform flow assumption may provide fair
velocity estimates if compared with one-dimensional hydrau-
lic models, provided that the selected section is sufficiently far
(some hundred metres) upstream or downstream an obstacle
or change of shape or slope of the channel. Moreover, the
cross-sectional shape of these headwater streams is generally
simple: a trapezoidal main channel with floodplain of limited
extent. The flow is basically one-dimensional.
For these reasons, the most commonly used method to
evaluate peak-discharge values after major flash flood events
in headwater catchments is the so-called slope conveyance
method or the slope area method, which is an extension of
the former (Costa, 1987a; Webb and Jarrett, 2002). It is
based on the application of the Manning–Strickler empirical
formula, with an assumption of uniform flow (friction slope
Sf equal to the river bed slope S).
V ¼ Q=A ¼ KR2=3S1=2f ð1Þ
where V is the so-called average velocity (m/s), Q is the
discharge in (m3/s), A is the wetted cross section (m2), R is
the hydraulic radius (R = A/P, with P the wetted perimeter in
m) and K known as the Manning–Strickler roughness
coefficient depending on the river cross-section character-
istics, which generally takes its values between 5 and 100.
The parameter n = 1/K is also often used in the technical and
scientific literature.
In cases where the flow is not confined in the main river
channel but covers also a flood plain, the section has to be
subdivided into a main channel area and a right and left
overbank flow area, and the discharge calculated separately
for each of the subareas (Chow, 1959).
The slope conveyance method has also the great advan-
tage to be rapid and enables the evaluation of a large number
of peak discharge values for a single flood event and hence
the mapping of the flood flows over the area of the affected
watershed and reveal the spatial heterogeneities of the
runoff, which is one of the objectives of post-event surveys
(see illustrations presented in ‘Illustration of some inter-
pretation results’).
Independently on the hydraulic model chosen, it is im-
portant to keep in mind that the data collected are necessarily
incomplete and affected by uncertainties, that some local flow
characteristics (backwater effect, obstacles limiting the flow in
the flood plain, etc.) may be missed out during the field
survey, and that the methods used, especially the Manning–
Strickler formula, are empirical approximations that may not
be extrapolated reliably to the extreme flow conditions
encountered during extreme flash flood events (high velo-
cities, significant sediment concentrations). Therefore, peak
discharge estimates after flash flood events cannot be only
based on a single site and single method approach. It is
absolutely necessary to search for additional information to
check and validate the proposed peak discharge estimates.
The next two sections give some examples of how this
additional information can be evaluated.
Finally, even after a thorough validation, it is the opinion
of the authors that an uncertainty bound of at least 30–50%
should be added to the peak discharges estimated after flash
flood events occurred on headwater catchments. According
to the magnitude of the observed flows during such events
and to the important spatial and temporal gradients, this
large uncertainty does nevertheless not prevent further
analyses (see ‘Illustration of some interpretation results’
and especially Figure 7).
Discharge estimation checking and validation
Among the possible sources of additional information for
discharge estimation checking, pictures and films taken by
eyewitnesses are now often available after major flood
events. On these images, superelevations in front of ob-
stacles located in the flow as trees or piers of bridges may be
visible (Figure 2). This superelevation is linked to the flow
velocity. The application of the Bernoulli formula gives the
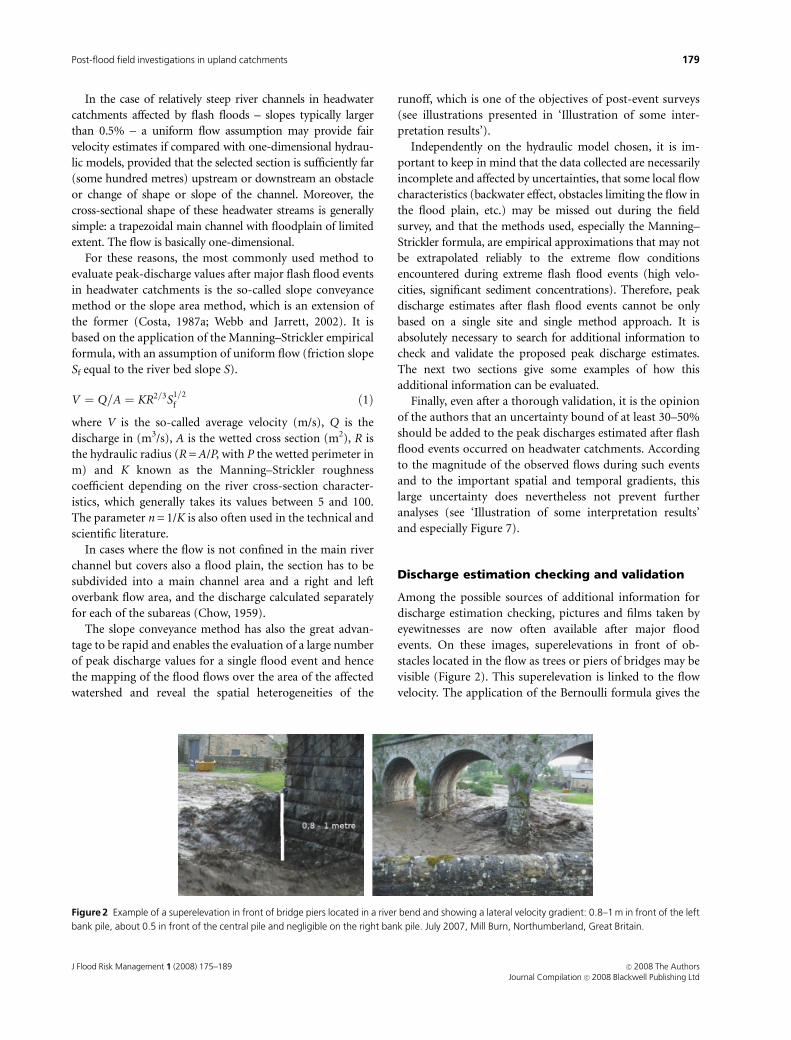
Figure 2 Example of a superelevation in front of bridge piers located in a river bend and showing a lateral velocity gradient: 0.8–1 m in front of the left
bank pile, about 0.5 in front of the central pile and negligible on the right bank pile. July 2007, Mill Burn, Northumberland, Great Britain.
J Flood Risk Management 1 (2008) 175–189 c� 2008 The AuthorsJournal Compilation c� 2008 Blackwell Publishing Ltd
179Post-flood field investigations in upland catchments
range of possible values for the flow velocity in the vicinity
of the obstacles, a value that can be compared with the
estimated average flow velocity Q/A computed for nearby
cross sections.
y1 þV2
1
2g¼ y2 ) V1 ¼
ffiffiffiffiffiffiffiffiffiffiffiffiffiffiffiffiffiffiffiffiffiffi2gðy2 � y1Þ
pð2Þ
With y1 and V1 the water depth and mean velocity in the
area surrounding the obstacle, and y2 the water depth in
front of the obstacle.
This method has the greatest advantage to be nonpara-
metric unlike the Manning–Strickler formula, and the
superelevation is relatively sensitive to the velocity. It makes
it possible to distinguish between moderate velocities,
o 2 m/s and superelevation lower than 20 cm, high veloci-
ties, 3–4 m/s corresponding to superelevations between
40 and 80 cm, and extremely high velocities, more than 1 m
of superelevation. In Figure 2, the superelevation in front of
piers of a bridge can be seen. They indicate that the flow
velocity may have exceeded 4 m/s on the outside bank of the
river bend in front of the bridge and that the average velocity
must have been close to 3 m/s under the bridge, about 50 cm
superelevation in front of the central pile and almost no
velocity on the inside bank of the bend (pictures taken just
after the flood peak).
Image-tracking methods can also be used to assess water
surface velocities and hence discharges on films (Fourquet,
2005). But their application on films taken by eyewitnesses
with a generally moving camera requires a preparation
survey of the filmed river reach and the identification of the
viewpoints of the camera. To our knowledge, this method
has only been applied on controlled cross sections with fixed
cameras for the moment (Creutin et al., 2003).
Likewise, when possible, a consistency test of the esti-
mated peak discharges and of the measured rainfall rates
available on the watersheds upstream of the considered river
cross sections should also be conducted. It can at least reveal
peak discharge overestimations: except if an important dam
breach occurred during the flood event, the comparison of
peak discharges and rainfall intensities should not lead to
runoff rates significantly greater than 1. Two methods can be
used to test this consistency: (i) application of the so-called
‘rational method’ and comparison of the specific peak
discharge (in mm/h) and the event maximum rainfall
intensity over a time period close to the estimated time of
concentration of the considered watershed, (ii) rainfall–run-
off simulation with a constant runoff rate value taken equal
to 1 (see Figures 7 and 8).
Table 2 presents some data produced by the US Geologi-
cal Survey concerning extreme flash floods that occurred in
the United States (taken from Costa, 1987b). In each case,
the application of the rational method reveals that the
estimated discharges are dubious when compared with the
reported measured rainfall intensities. The time of concen-
tration of the Bronco creek is for instance comprised
between 1 and 2 h according to its area. The estimated
discharge value would require an average spatial rainfall
intensity at least twice as high as the maximum reported
point rainfall intensity over 0.75 h. This is of course not
impossible, the watershed may have been affected by much
more intense rainfall not captured by the rain gauge net-
work, but very unlikely. The possible overestimation of the
peak discharge value has been confirmed by other studies for
this specific flood event (House and Pearthree, 1995).
Likewise, the same procedure leads to some doubts
concerning the three other peak discharge estimates. In each
case, the estimated peak discharges require that the majority
of the measured rainfall amount has fallen homogeneously
in space over the watersheds during a reduced duration
corresponding to the time of concentration of the wa-
tershed: 70 mm over 10 min for the Humbolt river tributary,
85 mm over 30 min for the Meyers canyon and 180 mm over
2 h for the Jimmy camp creek. Such rainfall rates are really
exceptional, especially in the conterminous United States
(Costa, 1987a) and particularly if they represent spatial
mean rainfall rates rather than point rainfall intensities.
Sediment transport or erosion evidences
Sediment transport phenomena may be a central topic of a
post-flood field survey. They may also reveal active hydro-
logical processes or local flow characteristics. In river reaches
where clear evidences of bed load sediment transport exist
and the sediment size is homogeneous, it is possible to use
the Shields relation between the characteristics of the flow,
critical shear stress and characteristics (diameter) of the
Table 2 Some examples of maximum peak discharges estimated by the US Geological Survey (Costa, 1987b)
Location Date
Drainage
area (km2)
Discharge
(m3/s)
Unit discharge
(mm/h)
Measured rainfall
intensity
Humbolt river tributary near Rye Patch (Nevada) 31.05.1973 2.2 251 410 127 mm/1 h
Meyers canyon near Mitchell (Oregon) 26.7.1965 32.9 1540 169 102 mm/2 h
Bronco creek near Wikieup (Arizona) 18.01.1971 49.2 2080 152 89 mm/0.75 h
Jimmy camp creek near Fontain (Colorado) 17.06.1965 141 3510 90 203 mm/6 h
Comparison of the unit discharge and of the rainfall intensities.
J Flood Risk Management 1 (2008) 175–189c� 2008 The AuthorsJournal Compilation c� 2008 Blackwell Publishing Ltd
180 Gaume and Borga
particles of the river, to assess the possible range of a critical
flow velocity that can have led to the displacement of these
particles. Of course, there is a risk of underestimation
because the river bed deposits visible after the flood event
may not be representative of the flood peak, but may have
been deposited during the decreasing limb of the flood.
Moreover, this approach is highly uncertain. It must not be
used to deliver a first guess of peak discharge value in a river
reach but as one possible approach to check discharge values
estimated otherwise.
It is admitted that significant bed load is induced when
the Shields parameter exceeds 0.047 [Eqn (3)].
t� ¼ gwRSf
ðgs � gwÞd> 0:047 ð3Þ
with d the diameter of the particles and ðgw � gsÞ=gw the
ratio between the volumetric weights of the water and the
solid particles, generally close to 1.6 for mineral particles.
Combining Eqn (3) and the Manning–Strickler formula
Eqn (1) with the hypothesis that the river bed and banks’
roughness is determined by the size of the particles, i.e. the
river bed is flat, with K = 21/d1/6 (Degoutte, 2006), leads to
the empirical Eqn (4).
V ¼ 5:8R1=6d1=3 ð4Þ
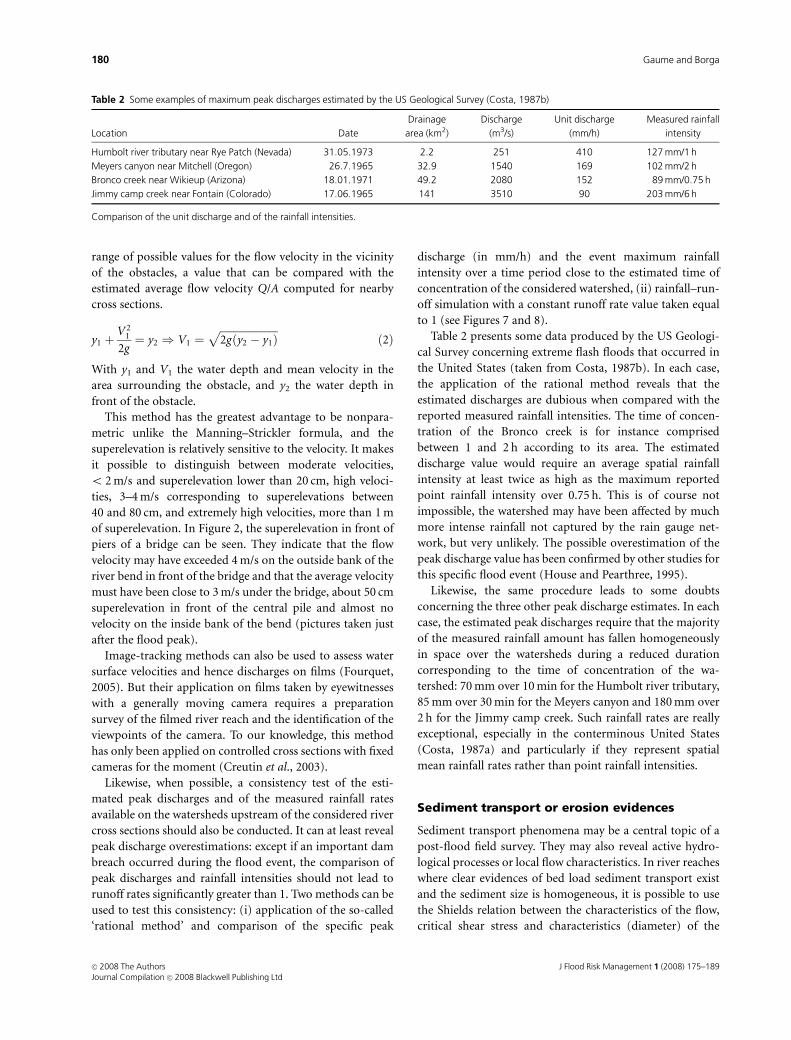
In the example presented in Figure 3, the river bed
material has undoubtedly been deposited during the flood
event. The river gravel diameters are relatively homoge-
neous, sign that no bigger particles were transported during
the flood. The water depth during the peak of the flood was
approximately equal to 2.5 m according to the flood marks
(R = 1.25 m). The diameter of the river bed material is
comprised between 10 and 20 cm, which leads to a flow
velocity estimation using Eqn (4) of 3–3.5 m/s, consistent
with the slope conveyance estimation.
Moreover, erosion processes on hill slopes may reveal
active hydrological processes and particularly the saturation
of the soil necessary to induce slope failures and subsurface
flows. As an example, the analysis of the data collected
during the recent post-flood investigation conducted after
the September 2007 flood on the Selscica Sora river in
Slovenia has revealed low runoff rates and conversely high
infiltration rates into the soils of the watershed as well as a
rapid release of a significant part of these infiltrated volumes
after the storm, sign of an efficient drainage of the hill
slopes. Such a hydrological response is surprising for a
mountainous watershed with steep slopes, shallow soils and
a bed rock mostly composed of schist stones.
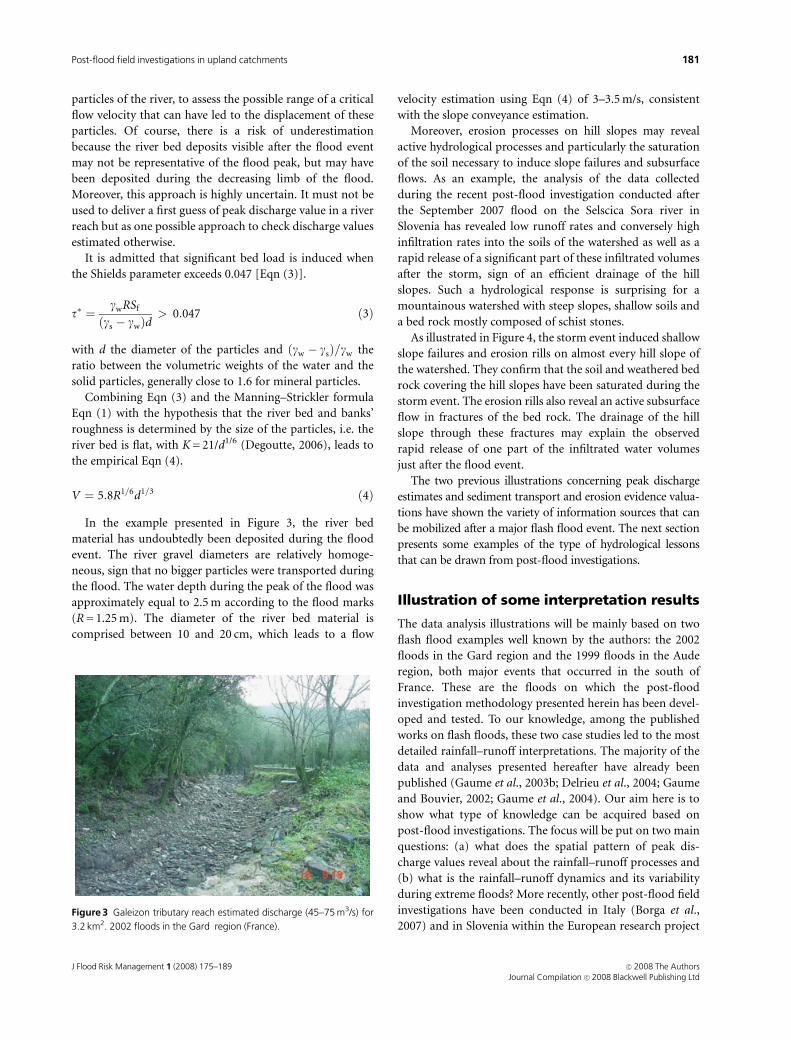
As illustrated in Figure 4, the storm event induced shallow
slope failures and erosion rills on almost every hill slope of
the watershed. They confirm that the soil and weathered bed
rock covering the hill slopes have been saturated during the
storm event. The erosion rills also reveal an active subsurface
flow in fractures of the bed rock. The drainage of the hill
slope through these fractures may explain the observed
rapid release of one part of the infiltrated water volumes
just after the flood event.
The two previous illustrations concerning peak discharge
estimates and sediment transport and erosion evidence valua-
tions have shown the variety of information sources that can
be mobilized after a major flash flood event. The next section
presents some examples of the type of hydrological lessons
that can be drawn from post-flood investigations.
Illustration of some interpretation results
The data analysis illustrations will be mainly based on two
flash flood examples well known by the authors: the 2002
floods in the Gard region and the 1999 floods in the Aude
region, both major events that occurred in the south of
France. These are the floods on which the post-flood
investigation methodology presented herein has been devel-
oped and tested. To our knowledge, among the published
works on flash floods, these two case studies led to the most
detailed rainfall–runoff interpretations. The majority of the
data and analyses presented hereafter have already been
published (Gaume et al., 2003b; Delrieu et al., 2004; Gaume
and Bouvier, 2002; Gaume et al., 2004). Our aim here is to
show what type of knowledge can be acquired based on
post-flood investigations. The focus will be put on two main
questions: (a) what does the spatial pattern of peak dis-
charge values reveal about the rainfall–runoff processes and
(b) what is the rainfall–runoff dynamics and its variability
during extreme floods? More recently, other post-flood field
investigations have been conducted in Italy (Borga et al.,
2007) and in Slovenia within the European research projectFigure 3 Galeizon tributary reach estimated discharge (45–75 m3/s) for
3.2 km2. 2002 floods in the Gard region (France).
J Flood Risk Management 1 (2008) 175–189 c� 2008 The AuthorsJournal Compilation c� 2008 Blackwell Publishing Ltd
181Post-flood field investigations in upland catchments
HYDRATE. These two case studies will be referred to in the
conclusions of this paper. They reveal significantly different
reactions of south Alpine watersheds to extreme rainfall events.
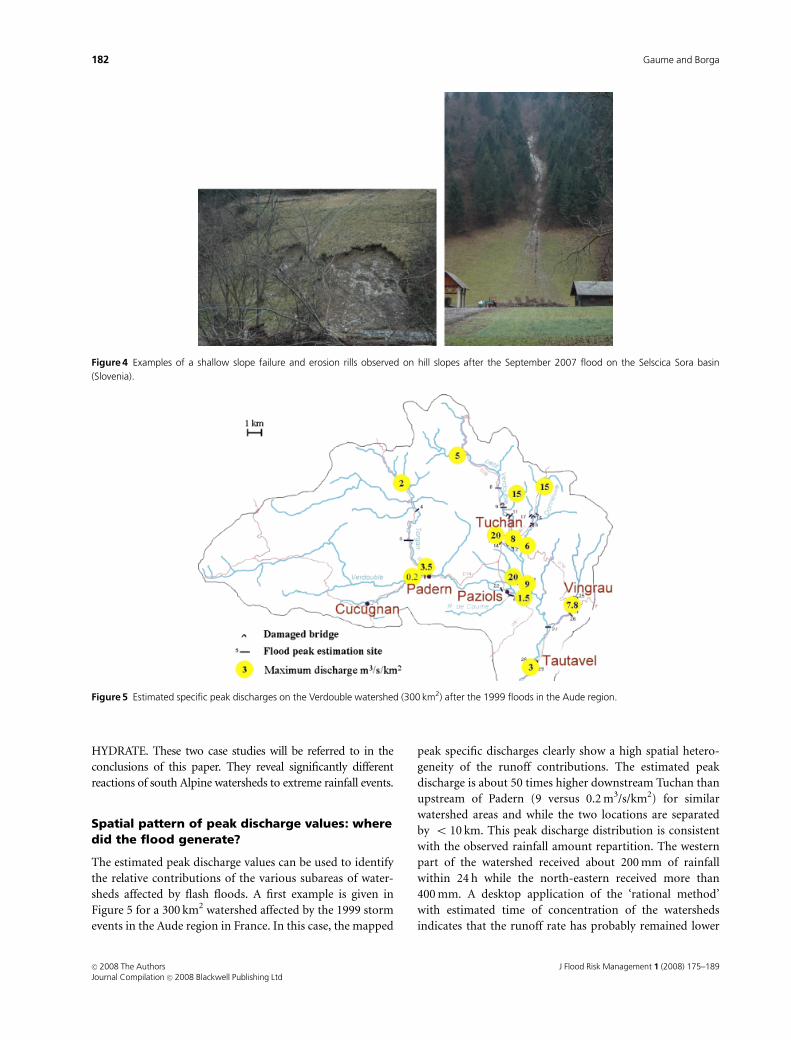
Spatial pattern of peak discharge values: wheredid the flood generate?
The estimated peak discharge values can be used to identify
the relative contributions of the various subareas of water-
sheds affected by flash floods. A first example is given in
Figure 5 for a 300 km2 watershed affected by the 1999 storm
events in the Aude region in France. In this case, the mapped
peak specific discharges clearly show a high spatial hetero-
geneity of the runoff contributions. The estimated peak
discharge is about 50 times higher downstream Tuchan than
upstream of Padern (9 versus 0.2 m3/s/km2) for similar
watershed areas and while the two locations are separated
by o 10 km. This peak discharge distribution is consistent
with the observed rainfall amount repartition. The western
part of the watershed received about 200 mm of rainfall
within 24 h while the north-eastern received more than
400 mm. A desktop application of the ‘rational method’
with estimated time of concentration of the watersheds
indicates that the runoff rate has probably remained lower
Figure 4 Examples of a shallow slope failure and erosion rills observed on hill slopes after the September 2007 flood on the Selscica Sora basin
(Slovenia).
Figure 5 Estimated specific peak discharges on the Verdouble watershed (300 km2) after the 1999 floods in the Aude region.
J Flood Risk Management 1 (2008) 175–189c� 2008 The AuthorsJournal Compilation c� 2008 Blackwell Publishing Ltd
182 Gaume and Borga
than 10% upstream of Padern and must have been close to
100% around Tuchan to explain the estimated discharges.
The observed high spatial heterogeneity of the peak dis-
charges reveals the nonlinearity of the rainfall–runoff reac-
tion of these watersheds, linked, as we will be able to see in
the next section, to the high initial infiltration and storage
capacities of their soils and subsoils.
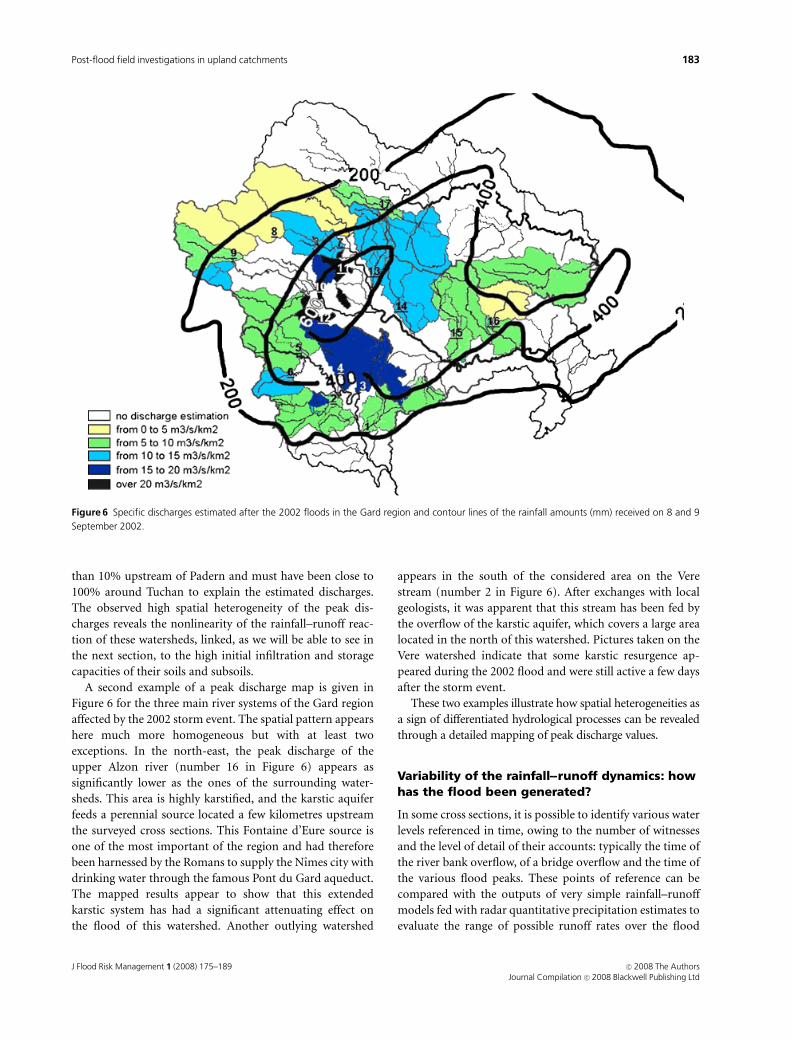
A second example of a peak discharge map is given in
Figure 6 for the three main river systems of the Gard region
affected by the 2002 storm event. The spatial pattern appears
here much more homogeneous but with at least two
exceptions. In the north-east, the peak discharge of the
upper Alzon river (number 16 in Figure 6) appears as
significantly lower as the ones of the surrounding water-
sheds. This area is highly karstified, and the karstic aquifer
feeds a perennial source located a few kilometres upstream
the surveyed cross sections. This Fontaine d’Eure source is
one of the most important of the region and had therefore
been harnessed by the Romans to supply the Nımes city with
drinking water through the famous Pont du Gard aqueduct.
The mapped results appear to show that this extended
karstic system has had a significant attenuating effect on
the flood of this watershed. Another outlying watershed
appears in the south of the considered area on the Vere
stream (number 2 in Figure 6). After exchanges with local
geologists, it was apparent that this stream has been fed by
the overflow of the karstic aquifer, which covers a large area
located in the north of this watershed. Pictures taken on the
Vere watershed indicate that some karstic resurgence ap-
peared during the 2002 flood and were still active a few days
after the storm event.
These two examples illustrate how spatial heterogeneities as
a sign of differentiated hydrological processes can be revealed
through a detailed mapping of peak discharge values.
Variability of the rainfall--runoff dynamics: howhas the flood been generated?
In some cross sections, it is possible to identify various water
levels referenced in time, owing to the number of witnesses
and the level of detail of their accounts: typically the time of
the river bank overflow, of a bridge overflow and the time of
the various flood peaks. These points of reference can be
compared with the outputs of very simple rainfall–runoff
models fed with radar quantitative precipitation estimates to
evaluate the range of possible runoff rates over the flood
Figure 6 Specific discharges estimated after the 2002 floods in the Gard region and contour lines of the rainfall amounts (mm) received on 8 and 9
September 2002.
J Flood Risk Management 1 (2008) 175–189 c� 2008 The AuthorsJournal Compilation c� 2008 Blackwell Publishing Ltd
183Post-flood field investigations in upland catchments
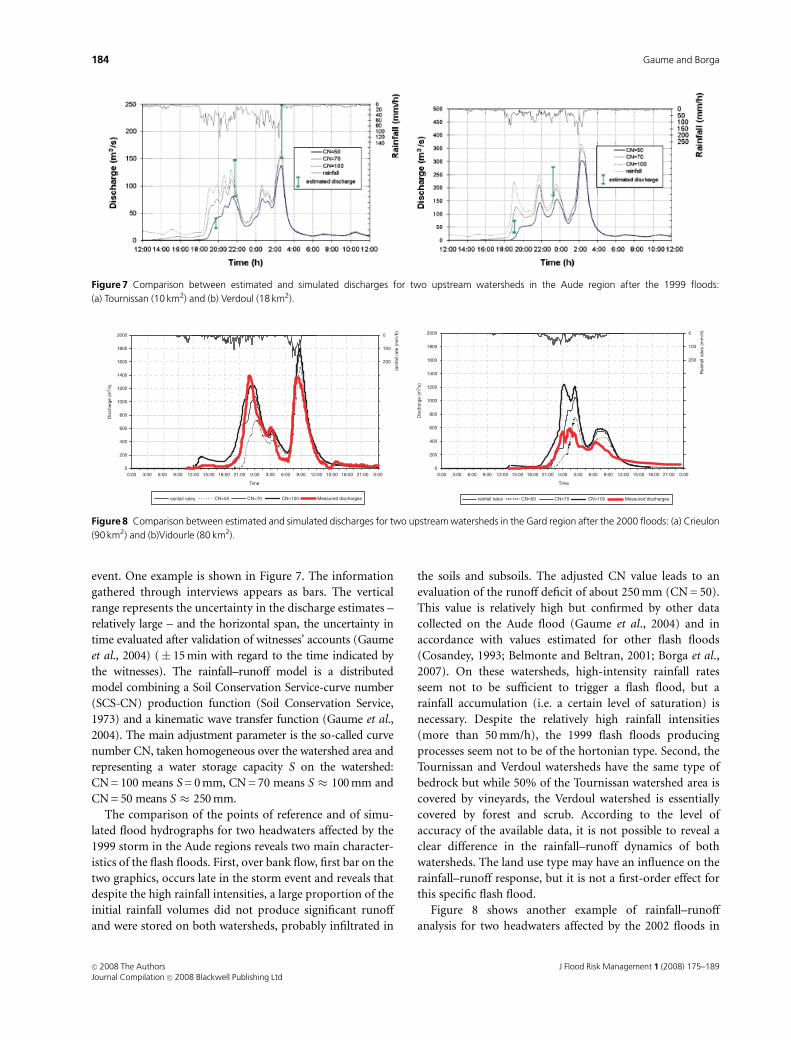
event. One example is shown in Figure 7. The information
gathered through interviews appears as bars. The vertical
range represents the uncertainty in the discharge estimates –
relatively large – and the horizontal span, the uncertainty in
time evaluated after validation of witnesses’ accounts (Gaume
et al., 2004) (� 15 min with regard to the time indicated by
the witnesses). The rainfall–runoff model is a distributed
model combining a Soil Conservation Service-curve number
(SCS-CN) production function (Soil Conservation Service,
1973) and a kinematic wave transfer function (Gaume et al.,
2004). The main adjustment parameter is the so-called curve
number CN, taken homogeneous over the watershed area and
representing a water storage capacity S on the watershed:
CN = 100 means S = 0 mm, CN = 70 means S � 100 mm and
CN = 50 means S � 250 mm.
The comparison of the points of reference and of simu-
lated flood hydrographs for two headwaters affected by the
1999 storm in the Aude regions reveals two main character-
istics of the flash floods. First, over bank flow, first bar on the
two graphics, occurs late in the storm event and reveals that
despite the high rainfall intensities, a large proportion of the
initial rainfall volumes did not produce significant runoff
and were stored on both watersheds, probably infiltrated in
the soils and subsoils. The adjusted CN value leads to an
evaluation of the runoff deficit of about 250 mm (CN = 50).
This value is relatively high but confirmed by other data
collected on the Aude flood (Gaume et al., 2004) and in
accordance with values estimated for other flash floods
(Cosandey, 1993; Belmonte and Beltran, 2001; Borga et al.,
2007). On these watersheds, high-intensity rainfall rates
seem not to be sufficient to trigger a flash flood, but a
rainfall accumulation (i.e. a certain level of saturation) is
necessary. Despite the relatively high rainfall intensities
(more than 50 mm/h), the 1999 flash floods producing
processes seem not to be of the hortonian type. Second, the
Tournissan and Verdoul watersheds have the same type of
bedrock but while 50% of the Tournissan watershed area is
covered by vineyards, the Verdoul watershed is essentially
covered by forest and scrub. According to the level of
accuracy of the available data, it is not possible to reveal a
clear difference in the rainfall–runoff dynamics of both
watersheds. The land use type may have an influence on the
rainfall–runoff response, but it is not a first-order effect for
this specific flash flood.
Figure 8 shows another example of rainfall–runoff
analysis for two headwaters affected by the 2002 floods in
Figure 7 Comparison between estimated and simulated discharges for two upstream watersheds in the Aude region after the 1999 floods:
(a) Tournissan (10 km2) and (b) Verdoul (18 km2).
Figure 8 Comparison between estimated and simulated discharges for two upstream watersheds in the Gard region after the 2000 floods: (a) Crieulon
(90 km2) and (b)Vidourle (80 km2).
J Flood Risk Management 1 (2008) 175–189c� 2008 The AuthorsJournal Compilation c� 2008 Blackwell Publishing Ltd
184 Gaume and Borga
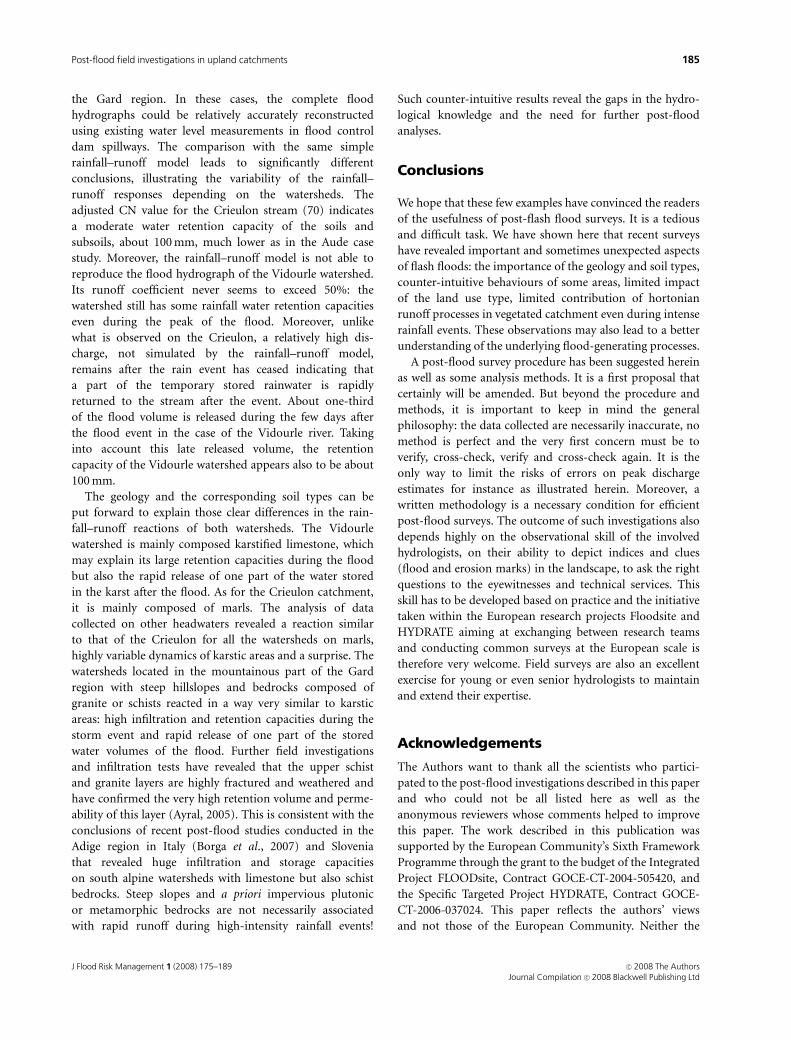
the Gard region. In these cases, the complete flood
hydrographs could be relatively accurately reconstructed
using existing water level measurements in flood control
dam spillways. The comparison with the same simple
rainfall–runoff model leads to significantly different
conclusions, illustrating the variability of the rainfall–
runoff responses depending on the watersheds. The
adjusted CN value for the Crieulon stream (70) indicates
a moderate water retention capacity of the soils and
subsoils, about 100 mm, much lower as in the Aude case
study. Moreover, the rainfall–runoff model is not able to
reproduce the flood hydrograph of the Vidourle watershed.
Its runoff coefficient never seems to exceed 50%: the
watershed still has some rainfall water retention capacities
even during the peak of the flood. Moreover, unlike
what is observed on the Crieulon, a relatively high dis-
charge, not simulated by the rainfall–runoff model,
remains after the rain event has ceased indicating that
a part of the temporary stored rainwater is rapidly
returned to the stream after the event. About one-third
of the flood volume is released during the few days after
the flood event in the case of the Vidourle river. Taking
into account this late released volume, the retention
capacity of the Vidourle watershed appears also to be about
100 mm.
The geology and the corresponding soil types can be
put forward to explain those clear differences in the rain-
fall–runoff reactions of both watersheds. The Vidourle
watershed is mainly composed karstified limestone, which
may explain its large retention capacities during the flood
but also the rapid release of one part of the water stored
in the karst after the flood. As for the Crieulon catchment,
it is mainly composed of marls. The analysis of data
collected on other headwaters revealed a reaction similar
to that of the Crieulon for all the watersheds on marls,
highly variable dynamics of karstic areas and a surprise. The
watersheds located in the mountainous part of the Gard
region with steep hillslopes and bedrocks composed of
granite or schists reacted in a way very similar to karstic
areas: high infiltration and retention capacities during the
storm event and rapid release of one part of the stored
water volumes of the flood. Further field investigations
and infiltration tests have revealed that the upper schist
and granite layers are highly fractured and weathered and
have confirmed the very high retention volume and perme-
ability of this layer (Ayral, 2005). This is consistent with the
conclusions of recent post-flood studies conducted in the
Adige region in Italy (Borga et al., 2007) and Slovenia
that revealed huge infiltration and storage capacities
on south alpine watersheds with limestone but also schist
bedrocks. Steep slopes and a priori impervious plutonic
or metamorphic bedrocks are not necessarily associated
with rapid runoff during high-intensity rainfall events!
Such counter-intuitive results reveal the gaps in the hydro-
logical knowledge and the need for further post-flood
analyses.
Conclusions
We hope that these few examples have convinced the readers
of the usefulness of post-flash flood surveys. It is a tedious
and difficult task. We have shown here that recent surveys
have revealed important and sometimes unexpected aspects
of flash floods: the importance of the geology and soil types,
counter-intuitive behaviours of some areas, limited impact
of the land use type, limited contribution of hortonian
runoff processes in vegetated catchment even during intense
rainfall events. These observations may also lead to a better
understanding of the underlying flood-generating processes.
A post-flood survey procedure has been suggested herein
as well as some analysis methods. It is a first proposal that
certainly will be amended. But beyond the procedure and
methods, it is important to keep in mind the general
philosophy: the data collected are necessarily inaccurate, no
method is perfect and the very first concern must be to
verify, cross-check, verify and cross-check again. It is the
only way to limit the risks of errors on peak discharge
estimates for instance as illustrated herein. Moreover, a
written methodology is a necessary condition for efficient
post-flood surveys. The outcome of such investigations also
depends highly on the observational skill of the involved
hydrologists, on their ability to depict indices and clues
(flood and erosion marks) in the landscape, to ask the right
questions to the eyewitnesses and technical services. This
skill has to be developed based on practice and the initiative
taken within the European research projects Floodsite and
HYDRATE aiming at exchanging between research teams
and conducting common surveys at the European scale is
therefore very welcome. Field surveys are also an excellent
exercise for young or even senior hydrologists to maintain
and extend their expertise.
Acknowledgements
The Authors want to thank all the scientists who partici-
pated to the post-flood investigations described in this paper
and who could not be all listed here as well as the
anonymous reviewers whose comments helped to improve
this paper. The work described in this publication was
supported by the European Community’s Sixth Framework
Programme through the grant to the budget of the Integrated
Project FLOODsite, Contract GOCE-CT-2004-505420, and
the Specific Targeted Project HYDRATE, Contract GOCE-
CT-2006-037024. This paper reflects the authors’ views
and not those of the European Community. Neither the
J Flood Risk Management 1 (2008) 175–189 c� 2008 The AuthorsJournal Compilation c� 2008 Blackwell Publishing Ltd
185Post-flood field investigations in upland catchments
European Community nor any member of the FLOODsite
and HYDRATE Consortium is liable for any use of the
information in this paper.
References
Alcoverro J., Corominas J. & Gomez M. The barranco de Aras
flood of 7 August 1996 (Biescas, Central Pyrenees, Spain). Eng
Geol 1999, 51, 237–255.
Ayral P.-A. Contribution a la spatialisation du modele
operationnel de prevision des crues eclair ALHTAlR –
Approches spatiale et experimentale – Application au bassin
versant du Gardon d’Anduze (Gard – France), PhD, Universite
d’Aix-Marseille I, France, 2005.
Belmonte A.C. & Beltran F.S. Flood events in Mediterranean
ephemeral streams (ramblas) in Valencia region, Spain. Catena
2001, 45, 229–249.
Benson M.A. & Dalrymple T. General field and office procedures
for indirect discharge measurements. U.S. Geological
Survey, Techniques of Water Resources Investigations, Book 3,
Chapter A-1, 1967.
Borga M., Boscolo P., Zanon F. & Sangati M.
Hydrometeorological analysis of the August 29, 2003 flash
flood in the eastern Italian Alps. J HydroMeteorol 2007, 8, (5),
1049–1067.
Bowers J.C. Floods in Cuyama valley, California, February 1998,
U.S. geological survey Fact sheet FS-162-01, 2001.
Bundesamt fur Wasserwirtschaft. Ursachenanalyse der
Hochwasser 1987, Ergebnisse der Untersuchungen,
Bundesamt fur Wasserwirtschaft, Mitteilung des
Landeshydrologie und – geologie Nr.14, Bern, Switzerland,
1991.
Caredio F., D’Amato Avanzi G., Puccinelli A., Trivellini A.,
Venetutelli M. & Verani M. La catastrofe idrogeologica del
19/6/1996 in Versilia e Garfagnana (Toscana, Italia): aspetti
geomorfologici e valutazioni idrauliche. Alba 1998, 2, 75–88.
Carter J.M., Williamson J.E. & Teller R.W. The 1972 Black Hills-
Rapid City flood revisited, U.S. geological survey Fact sheet
FS-037-02, 2002.
Chow V.T. Open-channel hydraulics. New York, USA: McGraw-
Hill Book Company, 1959.
Cosandey C. La crue du 22 septembre 1992 sur le Mont Lozere.
Rev Geomorphol Dynam 1993, 2, 49–56.
Costa J.E. Hydraulics and basin morphometry of the largest flash-
floods in the conterminous United States. J Hydrol 1987a, 93,
313–338.
Costa J.E. A comparison of the largest rainfall–runoff floods in
the United States with those of the poeple’s Republic of China
and the world. J Hydrol 1987b, 96, 101–115.
Creutin J.D., Muste M., Bradley A.A., Kim S.C. & Kruger A. River
gauging using PIV techniques: a proof of concept experiment
on the Iowa River. J Hydrol 2003, 227, 182–194. doi:10.1016/
S0022-1694(03)00081-7.
Degoutte G. Diagnostic, amenagement et gestion des rivieres.
Hydraulique et morphologie fluviale. Editions Tec & Doc,
Lavoisier, Paris. 2006.
Delrieu G., Ducrocq V., Gaume E., Nicol J., Payrastre O., Yates E.,
Andrieu H., Ayral P.-A., Bouvier C., Creutin J.-D., Livet M.,
Anquetin S., Lang M., Neppel L., Obled C., Parent-du-Chatelet
J., Saulnier G.-M., Walpersdorf A. & Wobrock W. The
catastrophic flash-flood event of 8–9 September 2002 in the
Gard region, France: a first case study for the Cevennes-
Vivarais Mediterranean Hydro-meteorological Observatory.
J Hydrometeorol 2004, 6, 34–52.
Denlinger R.P., O’Connel D.R.H. & House K.P. Robust
determination of stage and discharge: an example from an
extreme flood on the Verde River, Arizona, in Ancient floods
modern hazard. In: P.K. House, R.H. Webb, V.R. Baker & D.R.
Levish, eds. Water science and application, Vol. 5, Washington
DC, USA: American Geophysical Union, 2001, 127–146.
Fourquet G. Developpement d’un systeme hydrometrique par
analyse d’images numeriques. Evaluation d’une annee de
fonctionnement continu sur l’Isere a Saint Martin d’Heres.
PhD Thesis, INPG, Grenoble, France, 2005.
Gaume E. Post flash-flood investigations, methodological note.
FLOODsite report T23-06-02. Available from http://
www.floodsite.net/html/publications2.asp?documentType=1,
2006.
Gaume E. & Bouvier Ch. Analyse hydro-pluviometrique des crues
du Gard et du Vidourle des 8 et 9 Septembre 2002. La Houille
Blanche, 6, 99–106.
Gaume E., Ayral P.-A., Bouvier C., Creutin J.-D., Delrieu G., Livet
M. & Payrastre O. Hydrological analysis of the Gard river
(France) extraordinary flood, 8 and 9 September 2002.
Proceedings of the 5th EGS Plinius Conference, Ajaccio,
France, Editrice, 2003a.
Gaume E., Livet M., Desbordes M. & Villeneuve J.-P.
Hydrological analysis of the Avene river (France)
extraordinary flood, 6 and 7 October 1997. Phys Chem Earth
2003b, 28, (6–7), 263–267.
Gaume E., Livet M., Desbordes M. & Villeneuve J.-P. Hydrologic
analysis of the Aude, France, flash-flood 12 and 13 November
1999. J Hydrol 2004, 286, 135–154.
Gilard O. & Mesnil J.-J. La crue de Vaison-la-Romaine du 22
Septembre 1992. Inform Tech CEMAGREF 1995, 95, 1–8.
Gutknecht D. Extremhochwasser in kleinen Einzugsgebieten.
Osterreichische Wasser Abfallwirtschaft 1994, 46, (3/4), 50–57.
Hemain J.-C. & Dourlens C. A propos des inondations
catastrophiques de Nımes. La Houille Blanche 1989, 6,
421–433.
House P.K. & Pearthree P.A. A geomorphologic and hydrologic
evaluation of an extraordinary flood discharge estimate:
Bronco Creek, Arizona. Water Resour Res 1995, 31, (12),
3059–3073.
Huet Ph. La methodologie des retours d’experiences apres les
accidents naturels, premiere tentative de codification, Rapport de
l’inspection generale de l’environnement. Paris, France:
Ministere de l’ecologie et du developpement durable, 2005.
J Flood Risk Management 1 (2008) 175–189c� 2008 The AuthorsJournal Compilation c� 2008 Blackwell Publishing Ltd
186 Gaume and Borga
Huet Ph., Martin X., Prime J.-L., Foin P., Laurain C. & Cannard
Ph. Retour d’experience des crues de septembre 2002 dans les
departements du Gard, de l’Herault, du Vaucluse, des Bouches-
du-Rhone, de l’Ardeche et de la Drome, rapport de l’inspection
generale de l’environnement. Paris, France: Ministere de
l’ecologie et du developpement durable, 2003.
International Association for Hydrological Sciences. Flash-floods,
Proceedings of the Paris Symposium, September 1974,
Publication No. 112. Wallingford, UK: IAHS-UNESCO-WMO,
1974.
Jarrett R.D. Errors in slope-area computations of peak discharges
in mountain streams. J Hydrol 1987, 96, 53–67.
Jarrett R.D. Hydrologic and hydraulic research in mountain
rivers. Water Resour Bull 1990, 26, (3), 419–429.
Juracek K.E., Perry Ch.A. & Putnam J.E. The 1951 floods in
Kansas revisited, U.S. geological survey Fact sheet FS-041-01,
2001.
Lefrou C., Martin X., Labarthe J.-P., Varret J., Maziere B.,
Tordjeman R. & Feunteun R. Les crues des 12, 13 et 14 novembre
1999 dans les departements de l’Aude, de l’Herault, des Pyrenees-
Orientales et du Tarn, rapport de l’inspection generale de
l’environnement. Paris, France: Ministere de l’ecologie et
du developpement durable, 2000.
Naulet R. Utilisation de l’information des crues historiques pour
une meilleure predetermination du risque d’inondation.
Application au bassin de l’Ardeche a Vallon Pont-d’Arc
et St-Martin d’Ardeche, These de l’Universite Joseph Fourier,
Grenoble, France, 2002.
O’Connor J.E. & Costa J.E. Large floods in the United States:
where they happen and why. U.S. geological survey circular
1245, 2003.
Ogden F.L, Sharif H.O., Senarath S.U.S., Smith J.A., Baeck M.L.
& Richardson J.R. Hydrologic analysis of the Fort Collins,
Colorado flash-flood of 1997. J Hydrol 2000, 228, 82–100.
Parde M. Sur la puissance des crues en diverses parties du monde.
Zaragoza, Spain: Geographica, 1961.
Payrastre O., Gaume E. & Andrieu H. Use of historical data to
assess the occurrence of floods in small watersheds in the
French Mediterranean area. Adv Geosci 2005, 2, 313–320.
Perry Ch.A. Significant floods in the United States during the
20th century – USGS measures a century of floods, USGS Fact
sheet FS-024-00, 2000.
Rico M., Benito G. & Barnolas A. Combined paleoflood and
rainfall–runoff assessment of mountain floods (Spanish
Pyrenees). J Hydrol 2001, 245, 59–72.
Sachsisches Landesamt fur Umwelt und Geologie. Hochwasser
August 2002 in den Osterzgebirsflussen, Ereignisanalyse.
Technical report, Dresden, Germany, 2004.
Smith J.A., Baeck M.L., Steiner M. & Miller A.J. Catastrophic
rainfall from an upslope thunderstorm in the central
Appalachians: the Rapidan storm of June 27, 1995. Water
Resour Res 1996, 32, (10), 3099–3113.
Soil Conservation Service. A method for estimating volume and
rate of runoff in small watersheds. Technical paper 149,
Washington, 1973.
Webb R.H. & Jarrett R.D. One-dimensional estimation
techniques for discharges of paleoflood and historical floods.
In: P.K. House, R.H. Webb, V.R. Baker & D.R. Levish, eds.
Ancient floods modern hazards: principles and application of
paleoflood hydrology, water science and application, Vol. 5,
Washington DC, USA: American Geophysical Union, 2002.
Winston W.E. & Criss R.E. Geochemical variations during flash-
flooding, Meramec River basin, May 2000. J hydrol 2002, 265,
149–163.
J Flood Risk Management 1 (2008) 175–189 c� 2008 The AuthorsJournal Compilation c� 2008 Blackwell Publishing Ltd
187Post-flood field investigations in upland catchments
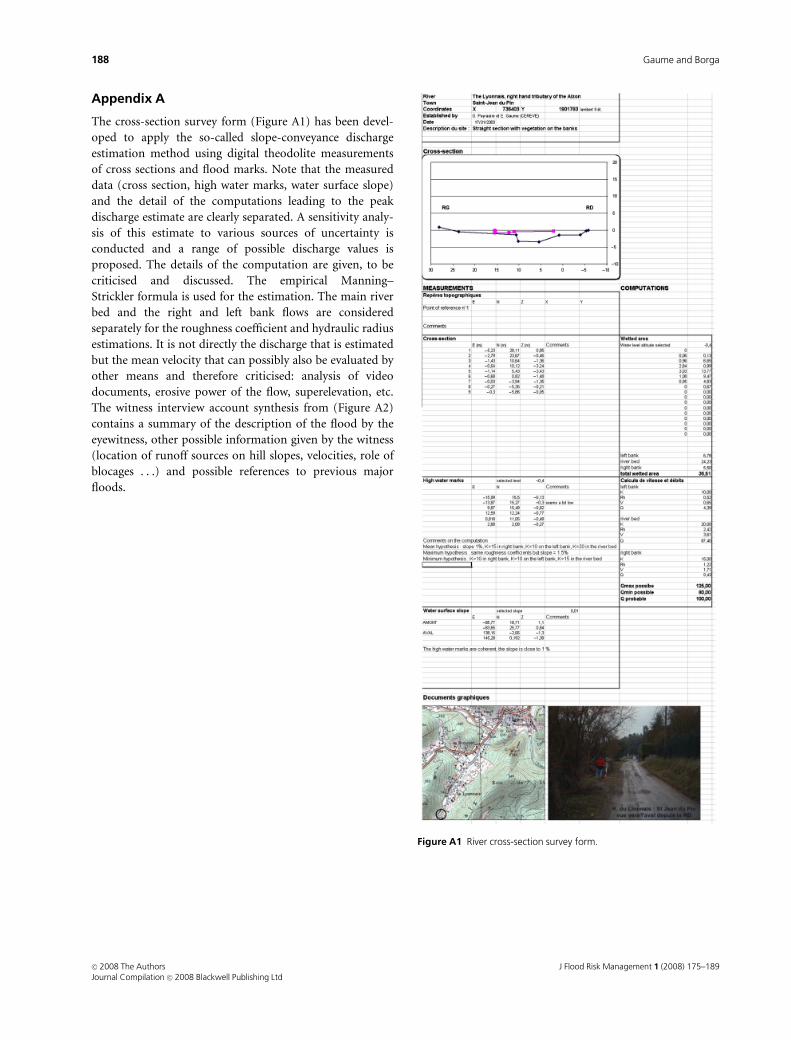
Appendix A
The cross-section survey form (Figure A1) has been devel-
oped to apply the so-called slope-conveyance discharge
estimation method using digital theodolite measurements
of cross sections and flood marks. Note that the measured
data (cross section, high water marks, water surface slope)
and the detail of the computations leading to the peak
discharge estimate are clearly separated. A sensitivity analy-
sis of this estimate to various sources of uncertainty is
conducted and a range of possible discharge values is
proposed. The details of the computation are given, to be
criticised and discussed. The empirical Manning–
Strickler formula is used for the estimation. The main river
bed and the right and left bank flows are considered
separately for the roughness coefficient and hydraulic radius
estimations. It is not directly the discharge that is estimated
but the mean velocity that can possibly also be evaluated by
other means and therefore criticised: analysis of video
documents, erosive power of the flow, superelevation, etc.
The witness interview account synthesis from (Figure A2)
contains a summary of the description of the flood by the
eyewitness, other possible information given by the witness
(location of runoff sources on hill slopes, velocities, role of
blocages . . .) and possible references to previous major
floods.
Figure A1 River cross-section survey form.
J Flood Risk Management 1 (2008) 175–189c� 2008 The AuthorsJournal Compilation c� 2008 Blackwell Publishing Ltd
188 Gaume and Borga
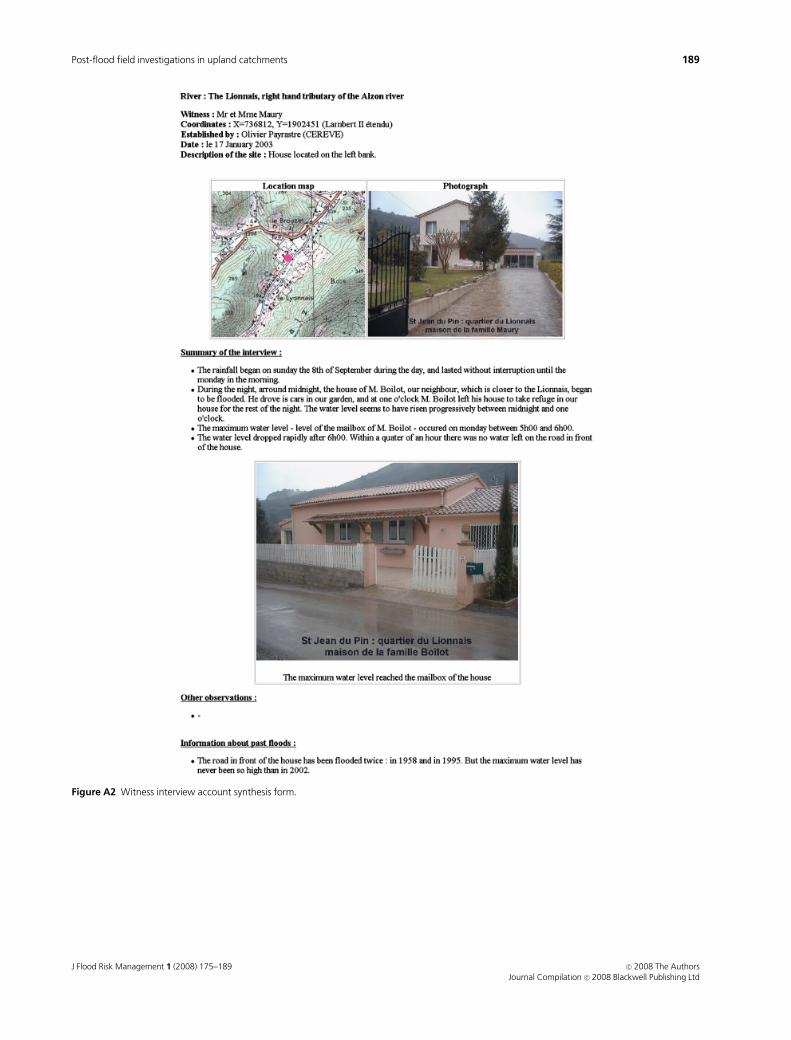
Figure A2 Witness interview account synthesis form.
J Flood Risk Management 1 (2008) 175–189 c� 2008 The AuthorsJournal Compilation c� 2008 Blackwell Publishing Ltd
189Post-flood field investigations in upland catchments