Embed Size (px)
Citation preview
Post-Harvest Losses of Rice in Nigeria and their Ecological Footprint
Pulished by:

3
Table of Contents
TABLE OF CONTENTS . . . . . . . . . . . . . . . . . . . . . . . . . . . . . . . . . . . . . . . . . . . . . . . . . . . . . . . . . . . . . . . . . . . . . . . . . . . . . . . . . . . . . . . . . . . . . . . . . . . . . . . . . . . . . . . . . . . . . . . . . . . . . . . . . . . . . . . . 3
LIST OF FIGURES . . . . . . . . . . . . . . . . . . . . . . . . . . . . . . . . . . . . . . . . . . . . . . . . . . . . . . . . . . . . . . . . . . . . . . . . . . . . . . . . . . . . . . . . . . . . . . . . . . . . . . . . . . . . . . . . . . . . . . . . . . . . . . . . . . . . . . . . . . . . . . . 5
LIST OF TABLES . . . . . . . . . . . . . . . . . . . . . . . . . . . . . . . . . . . . . . . . . . . . . . . . . . . . . . . . . . . . . . . . . . . . . . . . . . . . . . . . . . . . . . . . . . . . . . . . . . . . . . . . . . . . . . . . . . . . . . . . . . . . . . . . . . . . . . . . . . . . . . . . . 6
ACRONYMS . . . . . . . . . . . . . . . . . . . . . . . . . . . . . . . . . . . . . . . . . . . . . . . . . . . . . . . . . . . . . . . . . . . . . . . . . . . . . . . . . . . . . . . . . . . . . . . . . . . . . . . . . . . . . . . . . . . . . . . . . . . . . . . . . . . . . . . . . . . . . . . . . . . . . . . 7
ABSTRACT . . . . . . . . . . . . . . . . . . . . . . . . . . . . . . . . . . . . . . . . . . . . . . . . . . . . . . . . . . . . . . . . . . . . . . . . . . . . . . . . . . . . . . . . . . . . . . . . . . . . . . . . . . . . . . . . . . . . . . . . . . . . . . . . . . . . . . . . . . . . . . . . . . . . . . 8
EXECUTIVE SUMMARY . . . . . . . . . . . . . . . . . . . . . . . . . . . . . . . . . . . . . . . . . . . . . . . . . . . . . . . . . . . . . . . . . . . . . . . . . . . . . . . . . . . . . . . . . . . . . . . . . . . . . . . . . . . . . . . . . . . . . . . . . . . . . . . . . . . . . 9
1 INTRODUCTION . . . . . . . . . . . . . . . . . . . . . . . . . . . . . . . . . . . . . . . . . . . . . . . . . . . . . . . . . . . . . . . . . . . . . . . . . . . . . . . . . . . . . . . . . . . . . . . . . . . . . . . . . . . . . . . . . . . . . . . . . . . . . . . . . . . 12
1 .1 Background . . . . . . . . . . . . . . . . . . . . . . . . . . . . . . . . . . . . . . . . . . . . . . . . . . . . . . . . . . . . . . . . . . . . . . . . . . . . . . . . . . . . . . . . . . . . . . . . . . . . . . . . . . . . . . . . . . . . . . . . . . . . . . . . . . . . . . . 12
1 .2 Study Objectives . . . . . . . . . . . . . . . . . . . . . . . . . . . . . . . . . . . . . . . . . . . . . . . . . . . . . . . . . . . . . . . . . . . . . . . . . . . . . . . . . . . . . . . . . . . . . . . . . . . . . . . . . . . . . . . . . . . . . . . . . . . . . . . 12
1 .3 Study Area . . . . . . . . . . . . . . . . . . . . . . . . . . . . . . . . . . . . . . . . . . . . . . . . . . . . . . . . . . . . . . . . . . . . . . . . . . . . . . . . . . . . . . . . . . . . . . . . . . . . . . . . . . . . . . . . . . . . . . . . . . . . . . . . . . . . . . . . 13
2 METHODS . . . . . . . . . . . . . . . . . . . . . . . . . . . . . . . . . . . . . . . . . . . . . . . . . . . . . . . . . . . . . . . . . . . . . . . . . . . . . . . . . . . . . . . . . . . . . . . . . . . . . . . . . . . . . . . . . . . . . . . . . . . . . . . . . . . . . . . . . . . . . . . . 15
2 .1 Definition of Food Losses . . . . . . . . . . . . . . . . . . . . . . . . . . . . . . . . . . . . . . . . . . . . . . . . . . . . . . . . . . . . . . . . . . . . . . . . . . . . . . . . . . . . . . . . . . . . . . . . . . . . . . . . . . . . . . . . 15
2 .2 Data Collection on Food Losses . . . . . . . . . . . . . . . . . . . . . . . . . . . . . . . . . . . . . . . . . . . . . . . . . . . . . . . . . . . . . . . . . . . . . . . . . . . . . . . . . . . . . . . . . . . . . . . . . . . . . . . . 15
2.2.1 Sampling . . . . . . . . . . . . . . . . . . . . . . . . . . . . . . . . . . . . . . . . . . . . . . . . . . . . . . . . . . . . . . . . . . . . . . . . . . . . . . . . . . . . . . . . . . . . . . . . . . . . . . . . . . . . . . . . . . . . . . . . . . . . . . . 15
2.2.2 Measurement . . . . . . . . . . . . . . . . . . . . . . . . . . . . . . . . . . . . . . . . . . . . . . . . . . . . . . . . . . . . . . . . . . . . . . . . . . . . . . . . . . . . . . . . . . . . . . . . . . . . . . . . . . . . . . . . . . . . . . . . . 15
2 .3 Environmental Footprint . . . . . . . . . . . . . . . . . . . . . . . . . . . . . . . . . . . . . . . . . . . . . . . . . . . . . . . . . . . . . . . . . . . . . . . . . . . . . . . . . . . . . . . . . . . . . . . . . . . . . . . . . . . . . . . . . . 17
2.3.1 Life Cycle Assessment (LCA) . . . . . . . . . . . . . . . . . . . . . . . . . . . . . . . . . . . . . . . . . . . . . . . . . . . . . . . . . . . . . . . . . . . . . . . . . . . . . . . . . . . . . . . . . . . . . . . . . . . . 17
2.3.2 Selection of Impact Assessment Categories . . . . . . . . . . . . . . . . . . . . . . . . . . . . . . . . . . . . . . . . . . . . . . . . . . . . . . . . . . . . . . . . . . . . . . . . . . . . 17
2.3.3 Data Collection and Treatment . . . . . . . . . . . . . . . . . . . . . . . . . . . . . . . . . . . . . . . . . . . . . . . . . . . . . . . . . . . . . . . . . . . . . . . . . . . . . . . . . . . . . . . . . . . . . . . . 18
2.3.4 By-product Allocation . . . . . . . . . . . . . . . . . . . . . . . . . . . . . . . . . . . . . . . . . . . . . . . . . . . . . . . . . . . . . . . . . . . . . . . . . . . . . . . . . . . . . . . . . . . . . . . . . . . . . . . . . . . . . 18
3 DESCRIPTION OF THE RICE VALUE CHAIN . . . . . . . . . . . . . . . . . . . . . . . . . . . . . . . . . . . . . . . . . . . . . . . . . . . . . . . . . . . . . . . . . . . . . . . . . . . . . . . . . . . . . . . . . 20
3 .1 Production . . . . . . . . . . . . . . . . . . . . . . . . . . . . . . . . . . . . . . . . . . . . . . . . . . . . . . . . . . . . . . . . . . . . . . . . . . . . . . . . . . . . . . . . . . . . . . . . . . . . . . . . . . . . . . . . . . . . . . . . . . . . . . . . . . . . . . . 20
3.1.1 Processing . . . . . . . . . . . . . . . . . . . . . . . . . . . . . . . . . . . . . . . . . . . . . . . . . . . . . . . . . . . . . . . . . . . . . . . . . . . . . . . . . . . . . . . . . . . . . . . . . . . . . . . . . . . . . . . . . . . . . . . . . . . . . . 22
3.1.2 Transport, Storage, Marketing . . . . . . . . . . . . . . . . . . . . . . . . . . . . . . . . . . . . . . . . . . . . . . . . . . . . . . . . . . . . . . . . . . . . . . . . . . . . . . . . . . . . . . . . . . . . . . . . 23
4
POST-HARVEST LOSSES OF RICE IN NIGERIA AND THEIR ECOLOGICAL FOOTPRINT
4 RESULTS . . . . . . . . . . . . . . . . . . . . . . . . . . . . . . . . . . . . . . . . . . . . . . . . . . . . . . . . . . . . . . . . . . . . . . . . . . . . . . . . . . . . . . . . . . . . . . . . . . . . . . . . . . . . . . . . . . . . . . . . . . . . . . . . . . . . . . . . . . . . . . . . . 24
4 .1 Quantitative and Economic Losses . . . . . . . . . . . . . . . . . . . . . . . . . . . . . . . . . . . . . . . . . . . . . . . . . . . . . . . . . . . . . . . . . . . . . . . . . . . . . . . . . . . . . . . . . . . . . . . . . 24
4 .2 Environmental Impact of the Final Product . . . . . . . . . . . . . . . . . . . . . . . . . . . . . . . . . . . . . . . . . . . . . . . . . . . . . . . . . . . . . . . . . . . . . . . . . . . . . . . . . . . 27
4 .3 Environmental Impact of Final Product – Value based . . . . . . . . . . . . . . . . . . . . . . . . . . . . . . . . . . . . . . . . . . . . . . . . . . . . . . . . . . . . . . . . . . . . 30
4 .4 Environmental Impact of Total Losses . . . . . . . . . . . . . . . . . . . . . . . . . . . . . . . . . . . . . . . . . . . . . . . . . . . . . . . . . . . . . . . . . . . . . . . . . . . . . . . . . . . . . . . . . . . 31
5 RECOMMENDATIONS – OPTIONS FOR REDUCING FOOD LOSSES AND THEIR ENVIRONMENTAL FOOTPRINT . . . . . . . . . . . . . . . . . . . . . . . . . . . . . . . . . . . . . . . . . . . . . . . . . . . . . . . . . . . . . . . . . . . . . . . . . . . . . . . . . . . . . . . . . . . . . . . . . . . . . . . . . . . . 33
5 .1 Future Best Scenario – Potential Reduction of Environmental Impacts
after the CARI Intervention . . . . . . . . . . . . . . . . . . . . . . . . . . . . . . . . . . . . . . . . . . . . . . . . . . . . . . . . . . . . . . . . . . . . . . . . . . . . . . . . . . . . . . . . . . . . . . . . . . . . . . . . . . . . 33
5 .2 The Reduction Potential of Using Improved Stoves for Parboiling . . . . . . . . . . . . . . . . . . . . . . . . . . . . . . . . . . . . . . . . . . . . . . . . . . 35
5 .3 Comparison of Environmental Impact of Domestic Rice Supply in Nigeria and Imports
(Screening Assessment) . . . . . . . . . . . . . . . . . . . . . . . . . . . . . . . . . . . . . . . . . . . . . . . . . . . . . . . . . . . . . . . . . . . . . . . . . . . . . . . . . . . . . . . . . . . . . . . . . . . . . . . . . . . . . . . . . . 36
6 ENVIRONMENTAL FOOTPRINT OF FOOD LOSSES IN NIGERIA – PUTTING IT INTO PERSPECTIVE . . . . . . . . . . . . . . . . . . . . . . . . . . . . . . . . . . . . . . . . . . . . . . . . . . . . . . . . . . . . . . . . . . . . . . . . . . . . . . . . . . . . . . . . . . . . . . . . . . . . . . . . . . 39
7 REFERENCES . . . . . . . . . . . . . . . . . . . . . . . . . . . . . . . . . . . . . . . . . . . . . . . . . . . . . . . . . . . . . . . . . . . . . . . . . . . . . . . . . . . . . . . . . . . . . . . . . . . . . . . . . . . . . . . . . . . . . . . . . . . . . . . . . . . . . . . . . . 42
APPENDIX A: DESCRIPTION OF IMPACT CATEGORIES . . . . . . . . . . . . . . . . . . . . . . . . . . . . . . . . . . . . . . . . . . . . . . . . . . . . . . . . . . . . . . . . . . . . . . . . . . . . . . 45
Global Warming Potential (GWP) . . . . . . . . . . . . . . . . . . . . . . . . . . . . . . . . . . . . . . . . . . . . . . . . . . . . . . . . . . . . . . . . . . . . . . . . . . . . . . . . . . . . . . . . . . . . . . . . . . . . . . . . . . . . 45
Water Footprint . . . . . . . . . . . . . . . . . . . . . . . . . . . . . . . . . . . . . . . . . . . . . . . . . . . . . . . . . . . . . . . . . . . . . . . . . . . . . . . . . . . . . . . . . . . . . . . . . . . . . . . . . . . . . . . . . . . . . . . . . . . . . . . . . . . . . 45
Assessment of Environmental Impacts – Water Footprinting . . . . . . . . . . . . . . . . . . . . . . . . . . . . . . . . . . . . . . . . . . . . . . . . . . . . . . . . . . . . . . . . . . 46
The Water Stress Footprint (caused by consumptive use) . . . . . . . . . . . . . . . . . . . . . . . . . . . . . . . . . . . . . . . . . . . . . . . . . . . . . . . . . . . . . . . . . . . . . . . . 46
Biodiversity . . . . . . . . . . . . . . . . . . . . . . . . . . . . . . . . . . . . . . . . . . . . . . . . . . . . . . . . . . . . . . . . . . . . . . . . . . . . . . . . . . . . . . . . . . . . . . . . . . . . . . . . . . . . . . . . . . . . . . . . . . . . . . . . . . . . . . . . . . . 47
APPENDIX B: QUALITATIVE ASSESSMENT OF IMPACT ON BIODIVERSITY . . . . . . . . . . . . . . . . . . . . . . . . . . . . . . . . . . . . . . . . . . . . . . . 48
Biodiversity in the Food Supply Chain . . . . . . . . . . . . . . . . . . . . . . . . . . . . . . . . . . . . . . . . . . . . . . . . . . . . . . . . . . . . . . . . . . . . . . . . . . . . . . . . . . . . . . . . . . . . . . . . . . . . . 48
Impact of Food Production on Biodiversity within an LCA . . . . . . . . . . . . . . . . . . . . . . . . . . . . . . . . . . . . . . . . . . . . . . . . . . . . . . . . . . . . . . . . . . . . . . 48
Lande Use Change as an Indicator for Impact on Biodiversity . . . . . . . . . . . . . . . . . . . . . . . . . . . . . . . . . . . . . . . . . . . . . . . . . . . . . . . . . . . . . . . . . 49
Conclusion – Impact on Biodiversity . . . . . . . . . . . . . . . . . . . . . . . . . . . . . . . . . . . . . . . . . . . . . . . . . . . . . . . . . . . . . . . . . . . . . . . . . . . . . . . . . . . . . . . . . . . . . . . . . . . . . . . 50
5
LIST of fIgureS
List of Figuresfigure 1: Synopsis of reported damage and loss occurring within various market channels . . . . . . . . . . . . . . . . . . . . . . . . . . . . 10
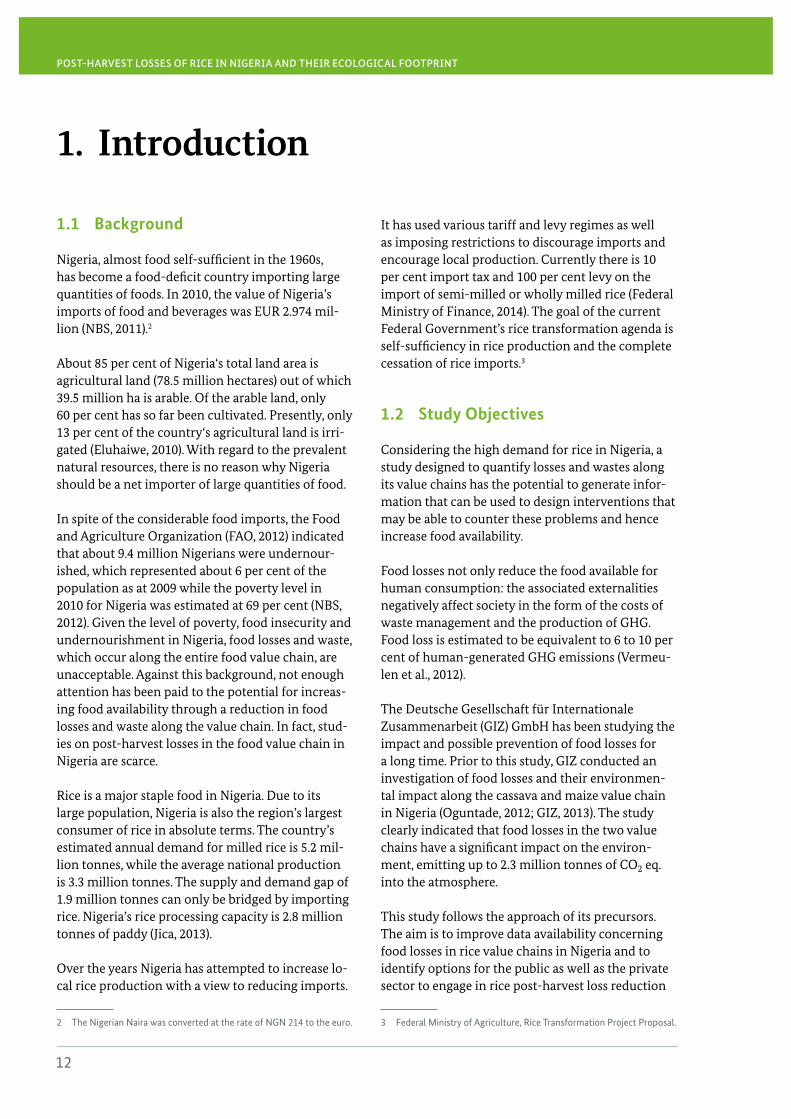
figure 2: rice paddy production and imports of milled rice in Nigeria . . . . . . . . . . . . . . . . . . . . . . . . . . . . . . . . . . . . . . . . . . . . . . . . . . . . . . . . . . . 13
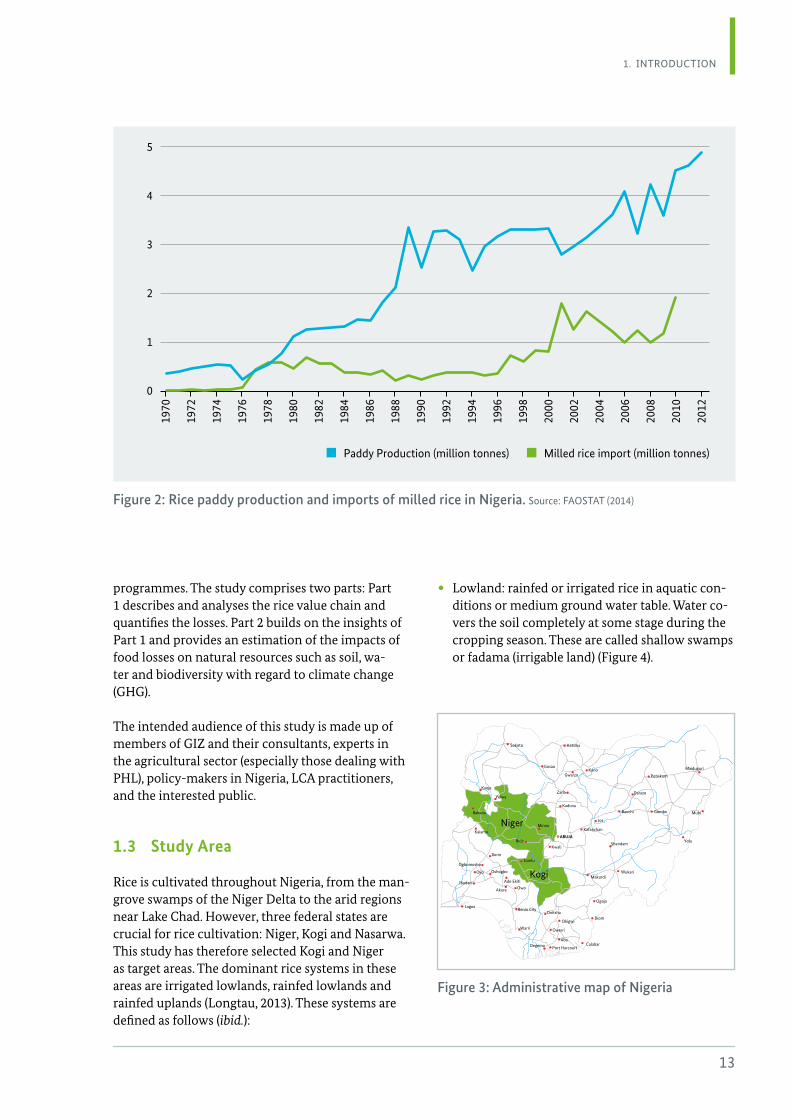
figure 3: Administrative map of Nigeria . . . . . . . . . . . . . . . . . . . . . . . . . . . . . . . . . . . . . . . . . . . . . . . . . . . . . . . . . . . . . . . . . . . . . . . . . . . . . . . . . . . . . . . . . . . . . . . . . . . . . . . 13
figure 4: rainfed low land rice cultivation system . . . . . . . . . . . . . . . . . . . . . . . . . . . . . . . . . . . . . . . . . . . . . . . . . . . . . . . . . . . . . . . . . . . . . . . . . . . . . . . . . . . . . . . . 14
figure 5: Traditional measures oyomoyo, Adamu . . . . . . . . . . . . . . . . . . . . . . . . . . . . . . . . . . . . . . . . . . . . . . . . . . . . . . . . . . . . . . . . . . . . . . . . . . . . . . . . . . . . . . . . . 16
figure 6: Principles of the LCA scheme . . . . . . . . . . . . . . . . . . . . . . . . . . . . . . . . . . . . . . . . . . . . . . . . . . . . . . . . . . . . . . . . . . . . . . . . . . . . . . . . . . . . . . . . . . . . . . . . . . . . . . . . 17
figure 7: rice husk and bran deposited as waste behind the mill processing sites (Kogi State) . . . . . . . . . . . . . . . . . . . . . . . 18
figure 8: rice value chain map . . . . . . . . . . . . . . . . . . . . . . . . . . . . . . . . . . . . . . . . . . . . . . . . . . . . . . . . . . . . . . . . . . . . . . . . . . . . . . . . . . . . . . . . . . . . . . . . . . . . . . . . . . . . . . . . . . . . 20
figure 9: rice threshing . . . . . . . . . . . . . . . . . . . . . . . . . . . . . . . . . . . . . . . . . . . . . . . . . . . . . . . . . . . . . . . . . . . . . . . . . . . . . . . . . . . . . . . . . . . . . . . . . . . . . . . . . . . . . . . . . . . . . . . . . . . . . . 21
figure 10: rice harvest by sickle . . . . . . . . . . . . . . . . . . . . . . . . . . . . . . . . . . . . . . . . . . . . . . . . . . . . . . . . . . . . . . . . . . . . . . . . . . . . . . . . . . . . . . . . . . . . . . . . . . . . . . . . . . . . . . . . . . . . 21
figure 11: Traditional parboiling . . . . . . . . . . . . . . . . . . . . . . . . . . . . . . . . . . . . . . . . . . . . . . . . . . . . . . . . . . . . . . . . . . . . . . . . . . . . . . . . . . . . . . . . . . . . . . . . . . . . . . . . . . . . . . . . . . . . 23
figure 12: Drying rice after parboiling . . . . . . . . . . . . . . . . . . . . . . . . . . . . . . . . . . . . . . . . . . . . . . . . . . . . . . . . . . . . . . . . . . . . . . . . . . . . . . . . . . . . . . . . . . . . . . . . . . . . . . . . . . . 23
figure 13: Community rice mill . . . . . . . . . . . . . . . . . . . . . . . . . . . . . . . . . . . . . . . . . . . . . . . . . . . . . . . . . . . . . . . . . . . . . . . . . . . . . . . . . . . . . . . . . . . . . . . . . . . . . . . . . . . . . . . . . . . . . 23
figure 14: Contribution of various life cycle phases to the gWP of 1 tonne of rice . . . . . . . . . . . . . . . . . . . . . . . . . . . . . . . . . . . . . . . . . . 27
figure 15: Contribution of various life cycle phases to total freshwater use of 1 tonne of rice . . . . . . . . . . . . . . . . . . . . . . . . . . 28
figure 16: Contribution of different life cycle phases to water stress footprint of 1 tonne of rice . . . . . . . . . . . . . . . . . . . . . 29
figure 17: Contribution of different life cycle phases to land use of 1 tonne of rice . . . . . . . . . . . . . . . . . . . . . . . . . . . . . . . . . . . . . . . . . 30
figure 18: gWP of rice worth 100 NgN . . . . . . . . . . . . . . . . . . . . . . . . . . . . . . . . . . . . . . . . . . . . . . . . . . . . . . . . . . . . . . . . . . . . . . . . . . . . . . . . . . . . . . . . . . . . . . . . . . . . . . . . . 30
figure 19: Water stress footprint of rice worth 100 NgN . . . . . . . . . . . . . . . . . . . . . . . . . . . . . . . . . . . . . . . . . . . . . . . . . . . . . . . . . . . . . . . . . . . . . . . . . . . . . . . . 31
figure 20: Land occupation of rice worth 100 NgN . . . . . . . . . . . . . . . . . . . . . . . . . . . . . . . . . . . . . . . . . . . . . . . . . . . . . . . . . . . . . . . . . . . . . . . . . . . . . . . . . . . . . . . . 31
figure 21: gWP of PHL of rice in Nigeria . . . . . . . . . . . . . . . . . . . . . . . . . . . . . . . . . . . . . . . . . . . . . . . . . . . . . . . . . . . . . . . . . . . . . . . . . . . . . . . . . . . . . . . . . . . . . . . . . . . . . . . 32
figure 22: Water stress footprint of PHL of rice in Nigeria . . . . . . . . . . . . . . . . . . . . . . . . . . . . . . . . . . . . . . . . . . . . . . . . . . . . . . . . . . . . . . . . . . . . . . . . . . . . . . 32
figure 23: Land use of PHL of rice in Nigeria . . . . . . . . . . . . . . . . . . . . . . . . . . . . . . . . . . . . . . . . . . . . . . . . . . . . . . . . . . . . . . . . . . . . . . . . . . . . . . . . . . . . . . . . . . . . . . . . . 32
figure 24: Contribution of different life cycle phases to gWP of 1 tonne of rice, comparison of ‘Niger Industrial’ and ‘future Best’ scenario . . . . . . . . . . . . . . . . . . . . . . . . . . . . . . . . . . . . . . . . . . . . . . . . . . . . . . . . . . . . . . . . . . . . . . . . . . . . . . . 34
figure 25: Water stress footprint of 1 tonne of rice, comparison of ‘Niger Industrial’ and ‘future Best’ scenario . . . . . . . . . . . . . . . . . . . . . . . . . . . . . . . . . . . . . . . . . . . . . . . . . . . . . . . . . . . . . . . . . . . . . . . . . . . . . . . . . . . . . . . . . . . . . . . . . . . . . . . . . . . . . 35
figure 26: Land use of 1 tonne of rice, comparison of ‘Niger Industrial’ and ‘future Best’ scenario . . . . . . . . . . . . . . . . . . . 35
figure 27: Potential reduction in gWP of 1 tonne of rice by using improved stoves for parboiling . . . . . . . . . . . . . . . . . . . 36
figure 28: Comparison of gWP of domestic rice supply in Nigeria and imports . . . . . . . . . . . . . . . . . . . . . . . . . . . . . . . . . . . . . . . . . . . . . . . 37
figure 29: Comparison of water stress footprint of domestic rice supply in Nigeria and imports . . . . . . . . . . . . . . . . . . . . . . 37
figure 30: Comparison of land occupation of domestic rice supply in Nigeria and imports . . . . . . . . . . . . . . . . . . . . . . . . . . . . . . 38
figure 31: greenhouse effect . . . . . . . . . . . . . . . . . . . . . . . . . . . . . . . . . . . . . . . . . . . . . . . . . . . . . . . . . . . . . . . . . . . . . . . . . . . . . . . . . . . . . . . . . . . . . . . . . . . . . . . . . . . . . . . . . . . . . . . . . 45
figure 32: Developments in the size of forest area in Nigeria . . . . . . . . . . . . . . . . . . . . . . . . . . . . . . . . . . . . . . . . . . . . . . . . . . . . . . . . . . . . . . . . . . . . . . . . . . 49
figure 33: Area cultivated with rice in Nigeria . . . . . . . . . . . . . . . . . . . . . . . . . . . . . . . . . . . . . . . . . . . . . . . . . . . . . . . . . . . . . . . . . . . . . . . . . . . . . . . . . . . . . . . . . . . . . . . . 49
6
POST-HARVEST LOSSES OF RICE IN NIGERIA AND THEIR ECOLOGICAL FOOTPRINT
List of Tables
Table 1: Description of key variables in rice production (Mean Values) in Kogi and Niger States . . . . . . . . . . . . . . . . . . . . . 14
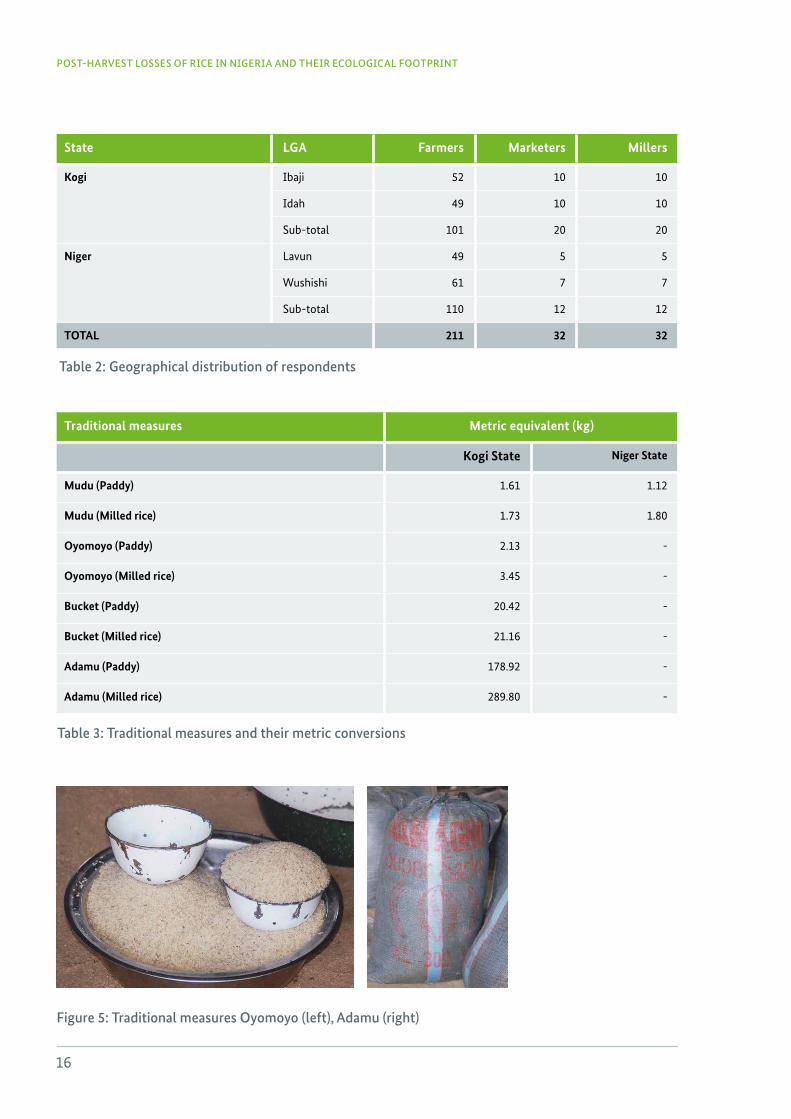
Table 2: geographical distribution of respondents . . . . . . . . . . . . . . . . . . . . . . . . . . . . . . . . . . . . . . . . . . . . . . . . . . . . . . . . . . . . . . . . . . . . . . . . . . . . . . . . . . . . . . . 16
Table 3: Traditional measures and their metric conversions . . . . . . . . . . . . . . . . . . . . . . . . . . . . . . . . . . . . . . . . . . . . . . . . . . . . . . . . . . . . . . . . . . . . . . . . . . 16
Table 4: Life cycle impact assessment categories & indicators . . . . . . . . . . . . . . . . . . . . . . . . . . . . . . . . . . . . . . . . . . . . . . . . . . . . . . . . . . . . . . . . . . . . . . 19
Table 5: overview of data sources . . . . . . . . . . . . . . . . . . . . . . . . . . . . . . . . . . . . . . . . . . . . . . . . . . . . . . . . . . . . . . . . . . . . . . . . . . . . . . . . . . . . . . . . . . . . . . . . . . . . . . . . . . . . . . . 19
Table 6: Information gathered from farmers processing their rice paddy in Kogi and Niger States . . . . . . . . . . . . . . . . . 22
Table 7: outputs per tonne of paddy in traditional and integrated rice mills . . . . . . . . . . . . . . . . . . . . . . . . . . . . . . . . . . . . . . . . . . . . . . . . . 24
Table 8: Quantification of post-harvest loss of paddy and milled rice for Nigeria (farmers and millers) . . . . . . . . . . . . . . . . . . . . . . . . . . . . . . . . . . . . . . . . . . . . . . . . . . . . . . . . . . . . . . . . . . . . . . . . . . . . . . . . . . . . . . . . . . . . . . . . . . . . . . . . . . . . . . . . . . . . . . 25
Table 9: Milled rice equivalents of PHL for Nigeria . . . . . . . . . . . . . . . . . . . . . . . . . . . . . . . . . . . . . . . . . . . . . . . . . . . . . . . . . . . . . . . . . . . . . . . . . . . . . . . . . . . . . . . 26
Table 10: Summary of rice post-harvest loss quantification . . . . . . . . . . . . . . . . . . . . . . . . . . . . . . . . . . . . . . . . . . . . . . . . . . . . . . . . . . . . . . . . . . . . . . . . . . . . 26
Table 11: Summary of environmental impact of rice PHL in Nigeria (Production quantities of fAoSTAT, only traditional value chain considered) . . . . . . . . . . . . . . . . . . . . . . . . . . . . . . . . . . . 32
7
ACroNyMS
BMZ german federal Ministry for economic Cooperation and Development
CArI Competitive African rice Initiative
Co2 eq. Carbon dioxide equivalents (see Appendix 1 for explanation)
€/eur euro
fAo food and Agriculture organization of the united Nations
gaBi 6 Software system for life cycle engineering, developed by Pe INTerNATIoNAL
gHg greenhouse gases
gIZ Deutsche gesellschaft für Internationale Zusammenarbeit gmbH
gWP global warming potential
ha Hectare
ibid. ibidem – in the same place
kg Kilogramme
km Kilometre
LCA Life Cycle Assessment
LCIA Life Cycle Impact Assessment
LgA Local governments Areas
l Litre
NgN Nigerian Naira
uNeP united Nations environment Programme
Pe Pe INTerNATIoNAL Ag
PHL Post-harvest losses
SeTAC Society for environmental Toxicology and Chemistry
WSI Water Stress Index
Currency exchange rate: EUR 1 = NGN 214 (August 2014)
Acronyms
8
POST-HARVEST LOSSES OF RICE IN NIGERIA AND THEIR ECOLOGICAL FOOTPRINT
from cultivation to distribution (cradle-to-shelf approach). The final product considered in this study is parboiled white rice. The following environmen-tal impact categories are assessed: global warming potential, water stress footprint and land occupation. The impacts on biodiversity are assessed in a qualita-tive manner.
The post-harvest losses of rice along the complete value chain account for emissions of around 0.65 million tonnes of CO2 eq. into the atmosphere. Consequently, halving the losses along the value chain would result in a reduction of 0.4 per cent of all greenhouse gas (GHG) emissions in Nigeria. The cultivation phase is the key contributor to global warming along the rice value chain, specifically the methane emission caused by anaerobic decompo-sition of organic material in flooded paddy fields. The yields from 19 per cent of the area cultivated with rice are wasted due to post-harvest losses. Even though it was found that water does not appear as an environmental hotspot in the rice value chain, the results are a clear indicator that the environmental impact caused by food losses is significant. A reduc-tion in food losses will therefore lead to strong envi-ronmental benefits on various levels and in various impact areas.
The issue of food loss is a crucial factor in securing the stable production required to combat hunger and raise incomes. Food security is a priority area of German development policy. Therefore, the German Federal Ministry for Economic Cooperation and Development (BMZ) has launched the special unit ‘One World – No Hunger’ in order to intensify its dedication to alleviating hunger and malnutrition. This study, commissioned by the Deutsche Gesellschaft für Internationale Zusammenarbeit (GIZ) GmbH on behalf of BMZ, contributes to these efforts.
Nigeria is currently the largest rice producer in West Africa. Due to its large population, the country is also the region’s largest consumer of rice in absolute terms. Its estimated annual demand for milled rice is 5.2 million tonnes, while the average national production is 3.3 million tonnes. The supply and demand gap of 1.9 million tonnes can be bridged only by importing rice. Nigeria’s rice processing capacity is 2.8 million tonnes of paddy (Jica, 2013). In spite of these sizeable food imports, the Food and Agriculture Organization (FAO, 2014) states that in 2012 about 9.4 million Nigerians or about 6 per cent of the population were undernourished and the poverty level in 2010 was estimated at 69 per cent (NBS, 2012). Given this level of poverty, food insecu-rity and undernourishment in Nigeria, food losses and waste, which occur along the entire food value chain, are unacceptable.
Food losses not only have effects on a social and eco-nomic scale, but also represent a waste of resources used in production such as land, water, energy and other inputs. This study considers the multifaceted impacts of food losses and thus has a twofold objec-tive. First, it offers a sound analysis of the losses oc-curring along the rice value chain in Nigeria. Second, it highlights and assesses the consequential environ-mental impacts of the rice value chain activities.
The study is mainly based on primary data from field surveys analysing the production, processing and trading of rice in Kogi and Niger States: two states in which the Competitive African Rice Initiative (CARI) is supporting public and private sector parties along the value chain. The production chain in these two regions is typical for Nigeria and therefore repre-sentative of the entire country. The results of the two regions serve as a learning example for the rice sector in other states. The final results show an esti-mated post-harvest loss of 24.9 per cent, resulting in a substantial loss of revenue for farmers.
A Life Cycle Assessment (LCA) was used to evaluate the environmental impacts along the value chain of rice in Nigeria. The LCA is a standardised scientific method for the systematic analysis of environ-mental impacts. It covers all the processing steps
Abstract
exeCuTIVe SuMMAry
9
Executive Summary
Globally an estimated 1.3 billion metric tonnes of food are lost or wasted every year; 30 per cent of the total food produced, varying among regions and crops (FAO, 2011). Significant reductions in food loss and waste would increase the amount of food available for human consumption and enhance global food security. Moreover, yields lost at farmer level constitute a loss of income and contribute to rural poverty. The issue of food losses is therefore of crucial importance in the efforts to combat hun-ger, raise incomes and improve food security in the world’s poorest countries.
Food losses do not merely reduce the food available for human consumption: the associated externalities negatively affect society in the form of the costs of waste management, the production of greenhouse gases (GHG), and the loss of scarce resources used in their production (Vermeulen et al., 2012 ), as well as health risks. There are therefore additional incen-tives for society to aim to reduce food losses.
Food losses also mean that resources used in produc-tion including for instance land, water, energy and other inputs such as fertilisers are effectively wasted. These environmental impacts of food losses along the value chain form part of the focus of this study.
Nigeria is currently the largest rice producer in West Africa. Due to its large population, the coun-try is also the region’s largest consumer of rice in absolute terms. Its estimated annual demand for milled rice is 5.2 million tonnes, while the average national production is 3.3 million tonnes. The supply and demand gap of 1.9 million tonnes can only be bridged by importing rice. Nigeria’s rice processing capacity is 2.8 million tonnes of paddy (Jica, 2013). In spite of these sizeable food imports, the Food and Agriculture Organization (FAO, 2014) states that in 2012 about 9.4 million Nigerians or about 6 per cent of the population were undernourished and the pov-erty level in 2010 was estimated at 69 per cent (NBS, 2012). Given this level of poverty, food insecurity and undernourishment in Nigeria, food losses and waste, which occur along the entire food value chain, are unacceptable.
Food losses not only have effects on a social and eco-nomic scale, but also represent a waste of resources used in production such as land, water, energy and other inputs. This study considers the multifaceted impacts of food losses and thus has a twofold objec-tive. First, it serves as a sound analysis of the losses occurring along the rice value chain in Nigeria. Second, it highlights and assesses the consequential environmental impacts of the rice value chain activi-ties.
The study is mainly based on primary data from field surveys analysing the production, processing and trade of rice in Kogi and Niger State: two states in which the Competitive African Rice Initiative (CARI) is supporting public and private sector parties along the value chain. The production chain in these two regions is typical for Nigeria and therefore repre-sentative of the entire country. The results of the two regions serve as a lesson learned for the rice sector in other states. The final results show an estimated post-harvest loss of 24.9 per cent, resulting in a sub-stantial loss of revenue for farmers.
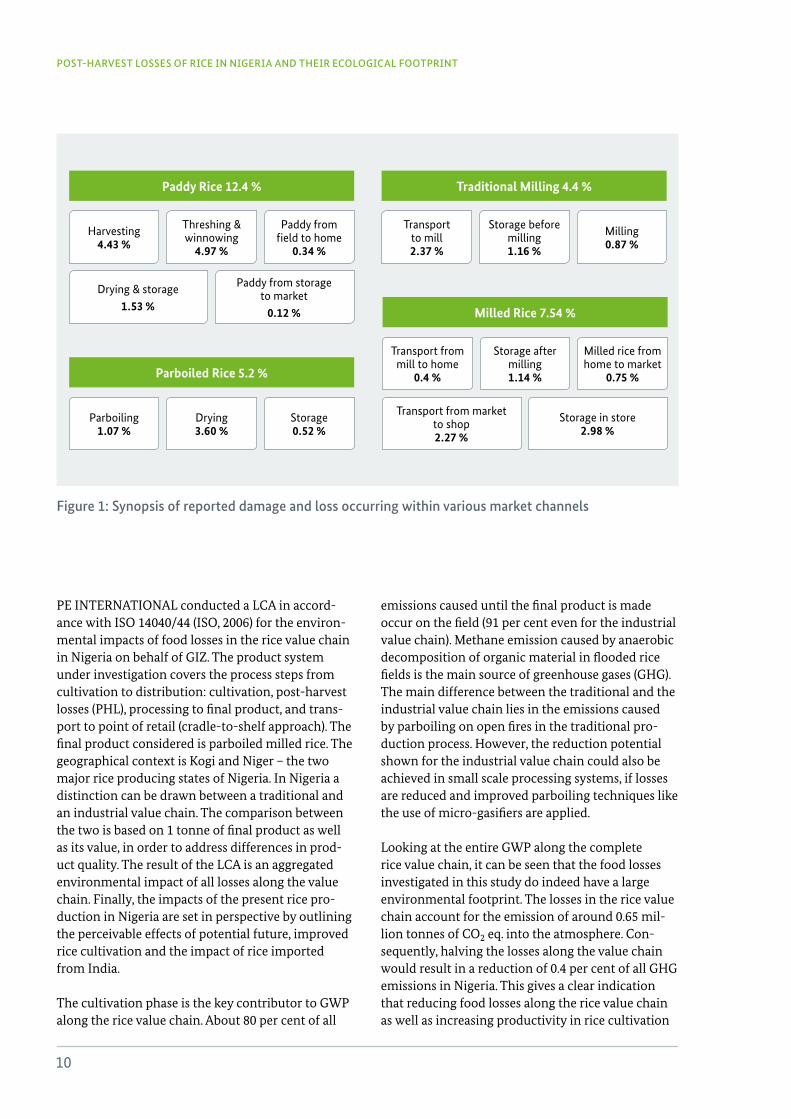
The data on losses in the value chain shown below in Figure 1 describes the damages and losses reported at each stage of the chain (farmers, processors, marketers). The percentages are based on various produce quantities and are therefore not part of an overall percentage. However, they do reveal signifi-cant hotspots and challenges in terms of post-har-vest losses. Harvesting and parboiling are the main hotspots followed by losses occurring during milling. The retail level also contributes to losses.
A Life Cycle Assessment (LCA) was used to evaluate the environmental impacts along the value chain of rice in Nigeria. The LCA is a standardised scientific method for the systematic analysis of environmental impacts. It covers all the processing steps from culti-vation to distribution (cradle-to-shelf approach). The final product considered in this study is parboiled white rice. The following environmental impact categories were assessed: global warming potential (GWP), water stress footprint and land occupation. The impacts on biodiversity were assessed in a quali-tative manner.
10
POST-HARVEST LOSSES OF RICE IN NIGERIA AND THEIR ECOLOGICAL FOOTPRINT
PE INTERNATIONAL conducted a LCA in accord-ance with ISO 14040/44 (ISO, 2006) for the environ-mental impacts of food losses in the rice value chain in Nigeria on behalf of GIZ. The product system under investigation covers the process steps from cultivation to distribution: cultivation, post-harvest losses (PHL), processing to final product, and trans-port to point of retail (cradle-to-shelf approach). The final product considered is parboiled milled rice. The geographical context is Kogi and Niger – the two major rice producing states of Nigeria. In Nigeria a distinction can be drawn between a traditional and an industrial value chain. The comparison between the two is based on 1 tonne of final product as well as its value, in order to address differences in prod-uct quality. The result of the LCA is an aggregated environmental impact of all losses along the value chain. Finally, the impacts of the present rice pro-duction in Nigeria are set in perspective by outlining the perceivable effects of potential future, improved rice cultivation and the impact of rice imported from India.
The cultivation phase is the key contributor to GWP along the rice value chain. About 80 per cent of all
emissions caused until the final product is made occur on the field (91 per cent even for the industrial value chain). Methane emission caused by anaerobic decomposition of organic material in flooded rice fields is the main source of greenhouse gases (GHG). The main difference between the traditional and the industrial value chain lies in the emissions caused by parboiling on open fires in the traditional pro-duction process. However, the reduction potential shown for the industrial value chain could also be achieved in small scale processing systems, if losses are reduced and improved parboiling techniques like the use of micro-gasifiers are applied.
Looking at the entire GWP along the complete rice value chain, it can be seen that the food losses investigated in this study do indeed have a large environmental footprint. The losses in the rice value chain account for the emission of around 0.65 mil-lion tonnes of CO2 eq. into the atmosphere. Con-sequently, halving the losses along the value chain would result in a reduction of 0.4 per cent of all GHG emissions in Nigeria. This gives a clear indication that reducing food losses along the rice value chain as well as increasing productivity in rice cultivation
Paddy Rice 12 .4 %
Parboiled Rice 5 .2 %
Milled Rice 7 .54 %
Traditional Milling 4 .4 %
Harvesting 4 .43 %
Parboiling 1 .07 %
Transport from mill to home
0 .4 %
Transport to mill 2 .37 %
Drying & storage1 .53 %
Transport from market to shop 2 .27 %
Paddy from storage to market
0 .12 %
Storage in store 2 .98 %
Paddy from field to home
0 .34 %
Storage 0 .52 %
Milled rice from home to market
0 .75 %
Milling 0 .87 %
Threshing & winnowing
4 .97 %
Drying 3 .60 %
Storage after milling 1 .14 %
Storage before milling 1 .16 %
Figure 1: Synopsis of reported damage and loss occurring within various market channels
exeCuTIVe SuMMAry
(as intended by the CARI1 initiative) could contribute significantly to a reduction in GHG emissions on a national level. This conclusion is further strength-ened by the fact that the rice currently imported from India is very likely to have a much larger GWP than rice domestically produced in Nigeria.
Even though it was found that water does not appear as an environmental hotspot in the rice value chain, the results are a clear indicator that the environ-mental impact caused by food losses is significant. A reduction in food losses will therefore lead to strong environmental benefits on various levels and in vari-ous impact areas.
Rice is still mainly rainfed in the regions under investigation, and because these regions are charac-terised by a low water stress index (WSI), water use itself does not appear as an environmental hotspot in the rice value chain. On the contrary, when the water stress footprint of rice in Nigeria is compared to the water stress footprint of rice from India, the statement about the advantage of locally produced rice can only be repeated.
The yields from 19 per cent of the area cultivated with rice are wasted due to post-harvest losses.
The impact of production systems with regard to biodiversity is difficult to quantify. Nevertheless, it can be stated that a direct link to biodiversity can be made from each impact category assessed in this report. Taking biodiversity into consideration can therefore only further add to the preventable envi-ronmental burden of food losses.
The results presented in this study constitute a major step forward in terms of gaining more insight into the dynamics of food losses and their environmental
1 The goal of the Competitive African rice Initiative (CArI) is to significantly improve the livelihoods of rice farmers in selected countries in Africa by increasing the competitiveness of domestic rice supply to meet increasing regional demand. CArI will be implemen-ted in ghana, Burkina faso, Tanzania and Nigeria with the aim of reaching 90,000 African male and female rice producers. The direct beneficiaries of this project are male and female (at least 30 per cent) smallholder rice farmers with a daily income below uSD 2. The project will aim to work with rice processors and traders as value chain anchors who provide the much needed ‘pull’ to stimulate more production of rice by smallholder farmers. The secondary beneficiari-es are rural service providers, e.g. agro-dealers, suppliers and operators of agricultural machinery and rice millers improving their sourcing capacity of quality paddy. The difference CArI will make is to ensure that rice millers are the anchor to link consumers and service providers in the rice value chain and where rice farmers and rice millers meet as agribusiness partners.
impact in Nigeria and potentially in Africa as a con-tinent. However, further investigation, validation of the numbers generated so far and further details are needed to make more reliable quantitative claims. Nevertheless, the results are a clear indicator that the total environmental impact of all losses combined is significant, even when set in the perspective of re-source use in Nigeria as a whole. A reduction of food losses in the agricultural sector will therefore lead to considerable environmental benefits on various levels and in various impact areas.
All measures to reduce losses along the value chain will in consequence also lessen the environmental impact of the final product, because fewer resources are needed and wasted to produce 1 tonne of final product. Additionally, the scenario analyses con-ducted in Chapter 5 give a clear indication of the options to reduce the environmental impact of the rice value chain in Nigeria. Increases in the produc-tivity of rice cultivation, using improved stoves for traditional parboiling and substituting imported rice from India with domestic production could lead to a significant decrease in GHG emissions. Additional possible reduction strategies during cultivation to limit methane emissions include:
• The early incorporation of rice straw into the pad-dy soil during the fallow period or no incorpora-tion at all (the decomposition of organic biomass while the field is flooded is the source of methane emissions).
• The application of ammonium sulphate fertiliser can also reduce the CH4 emissions to a certain extent (Dannemann, 2009).
• Alternate drying and wetting periods, or multiple aeration periods, are also effective in the reduc-tion of GWP (see also IPCC, 2006).
Looking at the mere figures a reduction of food losses is only one measure to reduce the ecological footprint of rice production and measures cutting methane emissions are far more potent in address-ing the overall environmental impact. However, along with improving environmental performance, investing in getting more of the final product in bet-ter quality to the consumer is vital to ensure a higher food and nutrition security.
11
12
1. Introduction
1 .1 Background
Nigeria, almost food self-sufficient in the 1960s, has become a food-deficit country importing large quantities of foods. In 2010, the value of Nigeria’s imports of food and beverages was EUR 2.974 mil-lion (NBS, 2011).2
About 85 per cent of Nigeria‘s total land area is agricultural land (78.5 million hectares) out of which 39.5 million ha is arable. Of the arable land, only 60 per cent has so far been cultivated. Presently, only 13 per cent of the country‘s agricultural land is irri-gated (Eluhaiwe, 2010). With regard to the prevalent natural resources, there is no reason why Nigeria should be a net importer of large quantities of food.
In spite of the considerable food imports, the Food and Agriculture Organization (FAO, 2012) indicated that about 9.4 million Nigerians were undernour-ished, which represented about 6 per cent of the population as at 2009 while the poverty level in 2010 for Nigeria was estimated at 69 per cent (NBS, 2012). Given the level of poverty, food insecurity and undernourishment in Nigeria, food losses and waste, which occur along the entire food value chain, are unacceptable. Against this background, not enough attention has been paid to the potential for increas-ing food availability through a reduction in food losses and waste along the value chain. In fact, stud-ies on post-harvest losses in the food value chain in Nigeria are scarce.
Rice is a major staple food in Nigeria. Due to its large population, Nigeria is also the region’s largest consumer of rice in absolute terms. The country’s estimated annual demand for milled rice is 5.2 mil-lion tonnes, while the average national production is 3.3 million tonnes. The supply and demand gap of 1.9 million tonnes can only be bridged by importing rice. Nigeria’s rice processing capacity is 2.8 million tonnes of paddy (Jica, 2013).
Over the years Nigeria has attempted to increase lo-cal rice production with a view to reducing imports.
2 The Nigerian Naira was converted at the rate of NgN 214 to the euro.
It has used various tariff and levy regimes as well as imposing restrictions to discourage imports and encourage local production. Currently there is 10 per cent import tax and 100 per cent levy on the import of semi-milled or wholly milled rice (Federal Ministry of Finance, 2014). The goal of the current Federal Government’s rice transformation agenda is self-sufficiency in rice production and the complete cessation of rice imports.3
1 .2 Study Objectives
Considering the high demand for rice in Nigeria, a study designed to quantify losses and wastes along its value chains has the potential to generate infor-mation that can be used to design interventions that may be able to counter these problems and hence increase food availability.
Food losses not only reduce the food available for human consumption: the associated externalities negatively affect society in the form of the costs of waste management and the production of GHG. Food loss is estimated to be equivalent to 6 to 10 per cent of human-generated GHG emissions (Vermeu-len et al., 2012).
The Deutsche Gesellschaft für Internationale Zusammenarbeit (GIZ) GmbH has been studying the impact and possible prevention of food losses for a long time. Prior to this study, GIZ conducted an investigation of food losses and their environmen-tal impact along the cassava and maize value chain in Nigeria (Oguntade, 2012; GIZ, 2013). The study clearly indicated that food losses in the two value chains have a significant impact on the environ-ment, emitting up to 2.3 million tonnes of CO2 eq. into the atmosphere.
This study follows the approach of its precursors. The aim is to improve data availability concerning food losses in rice value chains in Nigeria and to identify options for the public as well as the private sector to engage in rice post-harvest loss reduction
3 federal Ministry of Agriculture, rice Transformation Project Proposal.
POST-HARVEST LOSSES OF RICE IN NIGERIA AND THEIR ECOLOGICAL FOOTPRINT
13
1. INTroDuCTIoN
programmes. The study comprises two parts: Part 1 describes and analyses the rice value chain and quantifies the losses. Part 2 builds on the insights of Part 1 and provides an estimation of the impacts of food losses on natural resources such as soil, wa-ter and biodiversity with regard to climate change (GHG).
The intended audience of this study is made up of members of GIZ and their consultants, experts in the agricultural sector (especially those dealing with PHL), policy-makers in Nigeria, LCA practitioners, and the interested public.
1 .3 Study Area
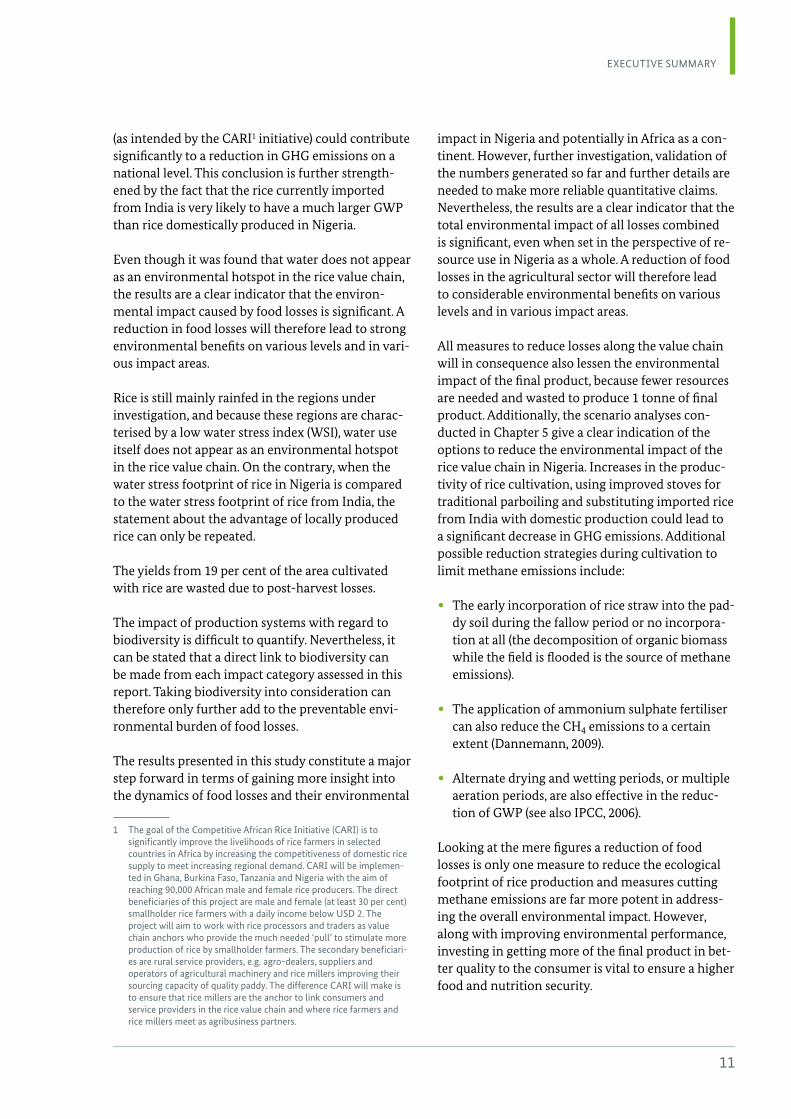
Rice is cultivated throughout Nigeria, from the man-grove swamps of the Niger Delta to the arid regions near Lake Chad. However, three federal states are crucial for rice cultivation: Niger, Kogi and Nasarwa. This study has therefore selected Kogi and Niger as target areas. The dominant rice systems in these areas are irrigated lowlands, rainfed lowlands and rainfed uplands (Longtau, 2013). These systems are defined as follows (ibid.):
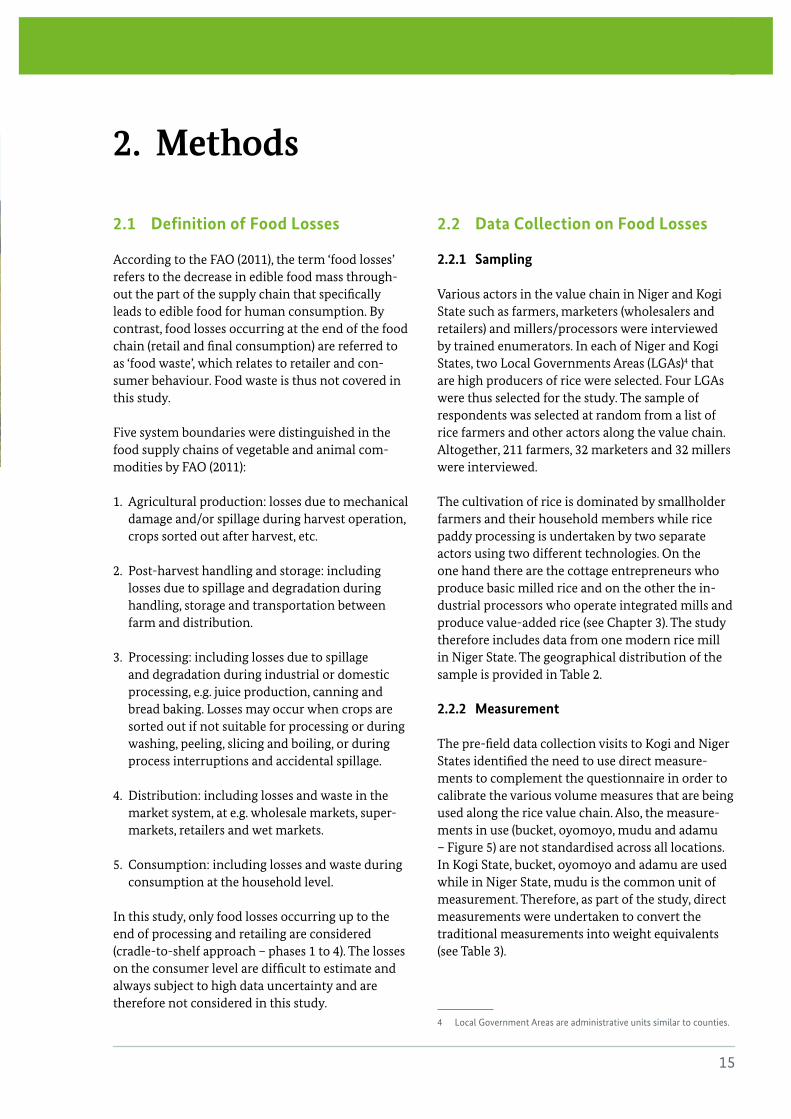
• Lowland: rainfed or irrigated rice in aquatic con-ditions or medium ground water table. Water co-vers the soil completely at some stage during the cropping season. These are called shallow swamps or fadama (irrigable land) (Figure 4).
Milled rice import (million tonnes)Paddy Production (million tonnes)
5
4
3
2
1
0
1970
1972
1974
1976
1978
1980
1982
1984
1986
1988
1990
1992
1994
1996
1998
2000
2002
2004
2006
2008
2010
2012
Yola
Owerri
Minna
Kogi
NigerABUJA
Makurdi
Jos
Gombe
Calabar
Yelwa
Owo
Kaoje
Wukari
Warri
Shendam
Potiskum
Okigwi
Ogoja
Mubi
Kwali
Kaiama Kafanchan
Isanlu
Ikom
Gwarzo
Degema
Darazo
Bida
Babana
Sokoto
Port Harcourt
Oshogbo
Maiduguri
Katsina
Kano
Kaduna
Ilorin
Ibadan
Gusau
Benin City
Bauchi
Akure
Ado Ekiti
Zaria
Oyo
Onitsha
Ogbomosho
Aba
Lagos
Figure 3: Administrative map of Nigeria
Figure 2: Rice paddy production and imports of milled rice in Nigeria. Source: fAoSTAT (2014)
14
POST-HARVEST LOSSES OF RICE IN NIGERIA AND THEIR ECOLOGICAL FOOTPRINT
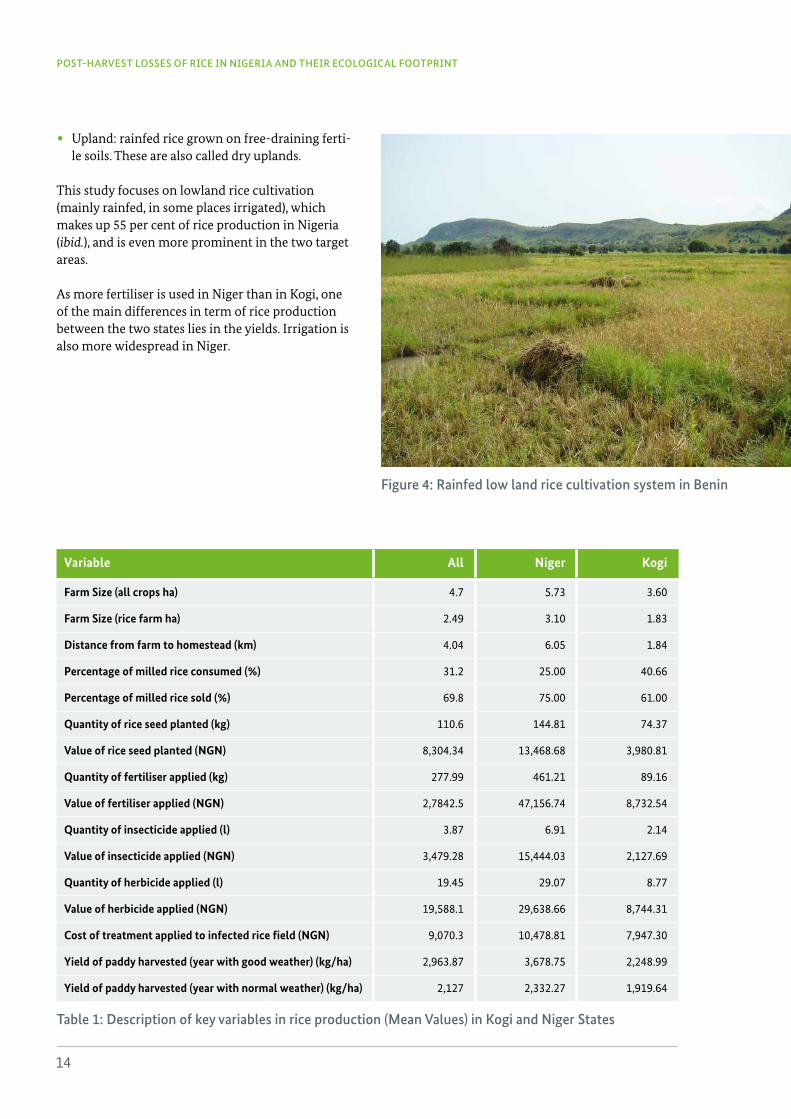
• Upland: rainfed rice grown on free-draining ferti-le soils. These are also called dry uplands.
This study focuses on lowland rice cultivation (mainly rainfed, in some places irrigated), which makes up 55 per cent of rice production in Nigeria (ibid.), and is even more prominent in the two target areas.
As more fertiliser is used in Niger than in Kogi, one of the main differences in term of rice production between the two states lies in the yields. Irrigation is also more widespread in Niger.
Variable All Niger Kogi
Farm Size (all crops ha) 4.7 5.73 3.60
Farm Size (rice farm ha) 2.49 3.10 1.83
Distance from farm to homestead (km) 4.04 6.05 1.84
Percentage of milled rice consumed (%) 31.2 25.00 40.66
Percentage of milled rice sold (%) 69.8 75.00 61.00
Quantity of rice seed planted (kg) 110.6 144.81 74.37
Value of rice seed planted (NGN) 8,304.34 13,468.68 3,980.81
Quantity of fertiliser applied (kg) 277.99 461.21 89.16
Value of fertiliser applied (NGN) 2,7842.5 47,156.74 8,732.54
Quantity of insecticide applied (l) 3.87 6.91 2.14
Value of insecticide applied (NGN) 3,479.28 15,444.03 2,127.69
Quantity of herbicide applied (l) 19.45 29.07 8.77
Value of herbicide applied (NGN) 19,588.1 29,638.66 8,744.31
Cost of treatment applied to infected rice field (NGN) 9,070.3 10,478.81 7,947.30
Yield of paddy harvested (year with good weather) (kg/ha) 2,963.87 3,678.75 2,248.99
Yield of paddy harvested (year with normal weather) (kg/ha) 2,127 2,332.27 1,919.64
Table 1: Description of key variables in rice production (Mean Values) in Kogi and Niger States
Figure 4: Rainfed low land rice cultivation system in Benin
15
2. MeTHoDS
2. Methods
2 .1 Definition of Food Losses
According to the FAO (2011), the term ‘food losses’ refers to the decrease in edible food mass through-out the part of the supply chain that specifically leads to edible food for human consumption. By contrast, food losses occurring at the end of the food chain (retail and final consumption) are referred to as ‘food waste’, which relates to retailer and con-sumer behaviour. Food waste is thus not covered in this study.
Five system boundaries were distinguished in the food supply chains of vegetable and animal com-modities by FAO (2011):
1. Agricultural production: losses due to mechanical damage and/or spillage during harvest operation, crops sorted out after harvest, etc.
2. Post-harvest handling and storage: including losses due to spillage and degradation during handling, storage and transportation between farm and distribution.
3. Processing: including losses due to spillage and degradation during industrial or domestic processing, e.g. juice production, canning and bread baking. Losses may occur when crops are sorted out if not suitable for processing or during washing, peeling, slicing and boiling, or during process interruptions and accidental spillage.
4. Distribution: including losses and waste in the market system, at e.g. wholesale markets, super-markets, retailers and wet markets.
5. Consumption: including losses and waste during consumption at the household level.
In this study, only food losses occurring up to the end of processing and retailing are considered (cradle-to-shelf approach – phases 1 to 4). The losses on the consumer level are difficult to estimate and always subject to high data uncertainty and are therefore not considered in this study.
2 .2 Data Collection on Food Losses
2 .2 .1 Sampling
Various actors in the value chain in Niger and Kogi State such as farmers, marketers (wholesalers and retailers) and millers/processors were interviewed by trained enumerators. In each of Niger and Kogi States, two Local Governments Areas (LGAs)4 that are high producers of rice were selected. Four LGAs were thus selected for the study. The sample of respondents was selected at random from a list of rice farmers and other actors along the value chain. Altogether, 211 farmers, 32 marketers and 32 millers were interviewed.
The cultivation of rice is dominated by smallholder farmers and their household members while rice paddy processing is undertaken by two separate actors using two different technologies. On the one hand there are the cottage entrepreneurs who produce basic milled rice and on the other the in-dustrial processors who operate integrated mills and produce value-added rice (see Chapter 3). The study therefore includes data from one modern rice mill in Niger State. The geographical distribution of the sample is provided in Table 2.
2 .2 .2 Measurement
The pre-field data collection visits to Kogi and Niger States identified the need to use direct measure-ments to complement the questionnaire in order to calibrate the various volume measures that are being used along the rice value chain. Also, the measure-ments in use (bucket, oyomoyo, mudu and adamu – Figure 5) are not standardised across all locations. In Kogi State, bucket, oyomoyo and adamu are used while in Niger State, mudu is the common unit of measurement. Therefore, as part of the study, direct measurements were undertaken to convert the traditional measurements into weight equivalents (see Table 3).
4 Local government Areas are administrative units similar to counties.
16
POST-HARVEST LOSSES OF RICE IN NIGERIA AND THEIR ECOLOGICAL FOOTPRINT
Traditional measures Metric equivalent (kg)
Kogi State Niger State
Mudu (Paddy) 1.61 1.12
Mudu (Milled rice) 1.73 1.80
Oyomoyo (Paddy) 2.13 -
Oyomoyo (Milled rice) 3.45 -
Bucket (Paddy) 20.42 -
Bucket (Milled rice) 21.16 -
Adamu (Paddy) 178.92 -
Adamu (Milled rice) 289.80 -
Table 3: Traditional measures and their metric conversions
State LGA Farmers Marketers Millers
Kogi Ibaji 52 10 10
Idah 49 10 10
Sub-total 101 20 20
Niger Lavun 49 5 5
Wushishi 61 7 7
Sub-total 110 12 12
TOTAL 211 32 32
Table 2: Geographical distribution of respondents
Figure 5: Traditional measures Oyomoyo (left), Adamu (right)
17
2. MeTHoDS
2 .3 Environmental Footprint
2 .3 .1 Life Cycle Assessment (LCA)
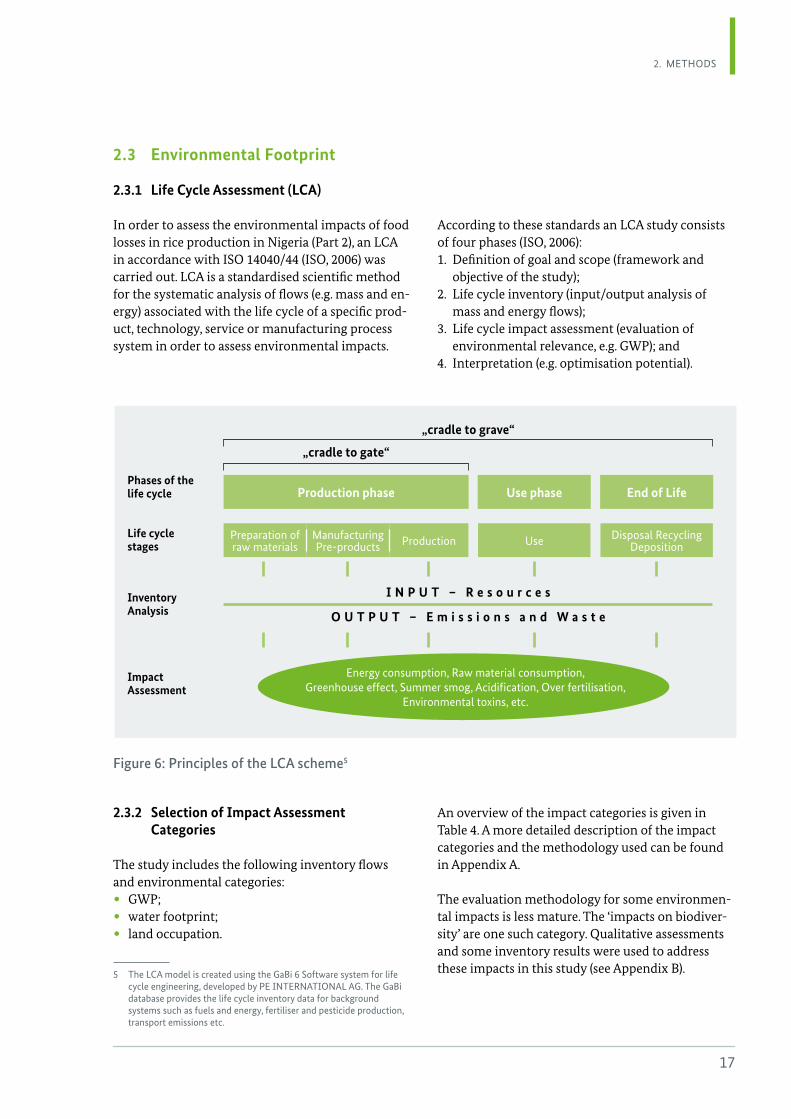
In order to assess the environmental impacts of food losses in rice production in Nigeria (Part 2), an LCA in accordance with ISO 14040/44 (ISO, 2006) was carried out. LCA is a standardised scientific method for the systematic analysis of flows (e.g. mass and en-ergy) associated with the life cycle of a specific prod-uct, technology, service or manufacturing process system in order to assess environmental impacts.
According to these standards an LCA study consists of four phases (ISO, 2006): 1. Definition of goal and scope (framework and
objective of the study); 2. Life cycle inventory (input/output analysis of
mass and energy flows); 3. Life cycle impact assessment (evaluation of
environmental relevance, e.g. GWP); and 4. Interpretation (e.g. optimisation potential).
Production phase
Preparation of raw materials
Manufacturing Pre-products Production use Disposal recycling
Deposition
Use phase End of Life Phases of the life cycle
Life cycle stages
Inventory Analysis
Impact Assessment
I N P U T – R e s o u r c e s
O U T P U T – E m i s s i o n s a n d W a s t e
energy consumption, raw material consumption, greenhouse effect, Summer smog, Acidification, over fertilisation,
environmental toxins, etc.
„cradle to gate“
„cradle to grave“
Figure 6: Principles of the LCA scheme5
2 .3 .2 Selection of Impact Assessment Categories
The study includes the following inventory flows and environmental categories:
• GWP; • water footprint; • land occupation.
5 The LCA model is created using the gaBi 6 Software system for life cycle engineering, developed by Pe INTerNATIoNAL Ag. The gaBi database provides the life cycle inventory data for background systems such as fuels and energy, fertiliser and pesticide production, transport emissions etc.
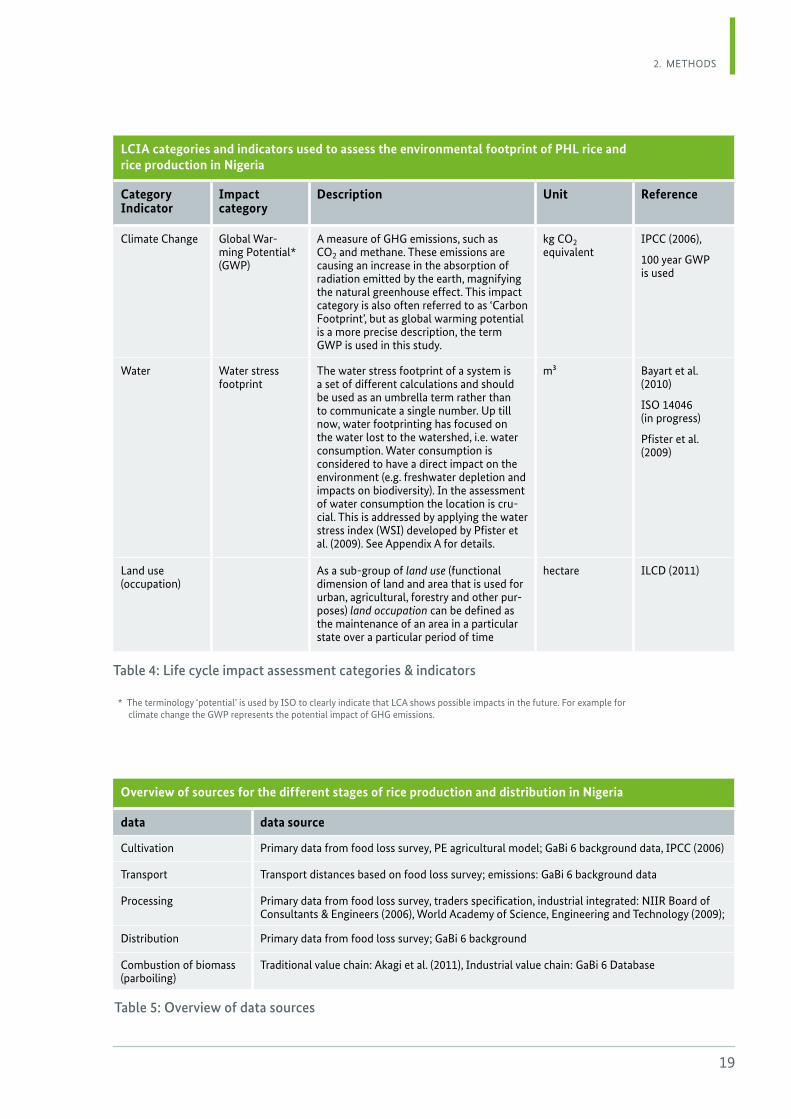
An overview of the impact categories is given in Table 4. A more detailed description of the impact categories and the methodology used can be found in Appendix A.
The evaluation methodology for some environmen-tal impacts is less mature. The ‘impacts on biodiver-sity’ are one such category. Qualitative assessments and some inventory results were used to address these impacts in this study (see Appendix B).
18
POST-HARVEST LOSSES OF RICE IN NIGERIA AND THEIR ECOLOGICAL FOOTPRINT
2 .3 .3 Data Collection and Treatment
The primary and secondary data collected were added to GaBi 6 background data. Table 5 provides an overview of the main production steps and the data sources.
The modelling was based on the following assump-tions:
• Cultivation: Methane emissions were modelled according to IPCC (2006). The assumed system according to the IPCC classification is a rainfed water regime, drought-prone, non-flooded pre-season > 180 days;
• The irrigation water requirement is modelled based on data from Pfister et al. (2009). The values for expected irrigation water consumption for rice in Nigeria given by Pfister et al. (ibid.) were weighted with the share of farmers that use irriga-tion (3 per cent in Kogi, 24 per cent in Niger State);
• Traditional parboiling: emissions for the combus-tion of biomass in open fires are modelled accor-ding to Akagi et al. (2011), the amount of biomass burned is estimated based on Bakari et al. (2010);
• Losses are assumed to be either used as animal feed or to be simply discarded as organic waste, so that they leave the system burden-free and, no further treatment or burden is assumed;
• The assumptions made with regard to by-pro-ducts are described in the following chapter.
2 .3 .4 By-product Allocation
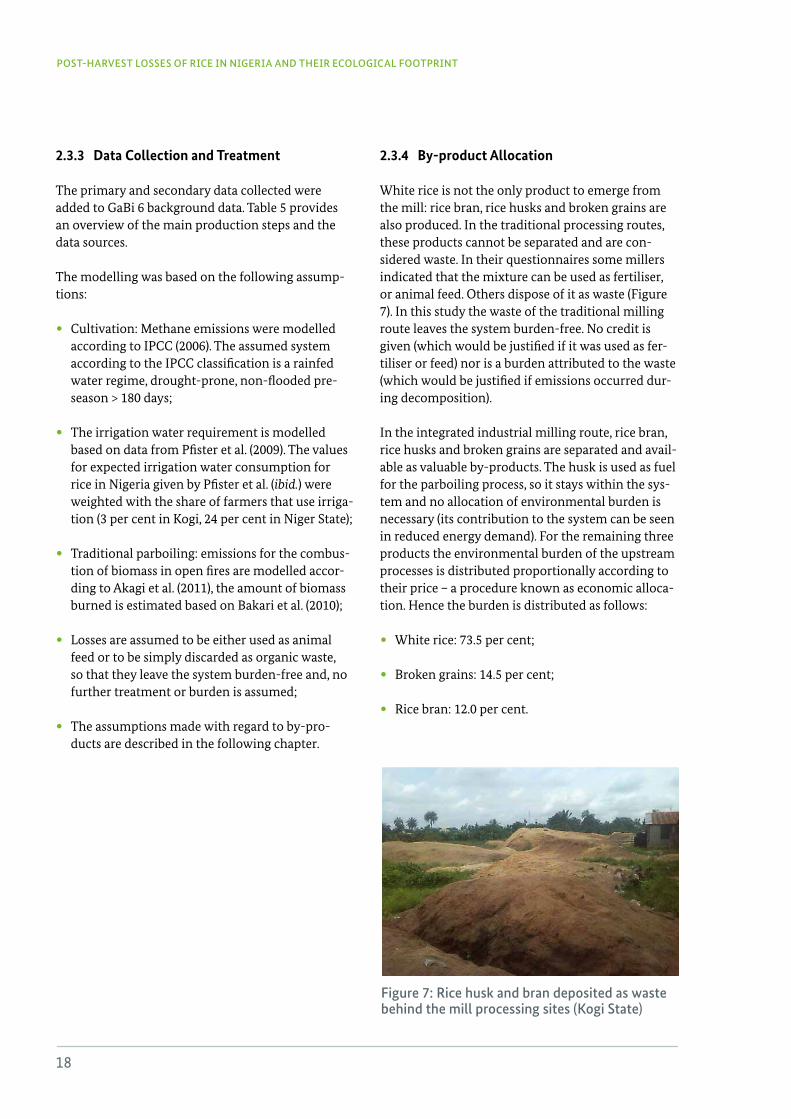
White rice is not the only product to emerge from the mill: rice bran, rice husks and broken grains are also produced. In the traditional processing routes, these products cannot be separated and are con-sidered waste. In their questionnaires some millers indicated that the mixture can be used as fertiliser, or animal feed. Others dispose of it as waste (Figure 7). In this study the waste of the traditional milling route leaves the system burden-free. No credit is given (which would be justified if it was used as fer-tiliser or feed) nor is a burden attributed to the waste (which would be justified if emissions occurred dur-ing decomposition).
In the integrated industrial milling route, rice bran, rice husks and broken grains are separated and avail-able as valuable by-products. The husk is used as fuel for the parboiling process, so it stays within the sys-tem and no allocation of environmental burden is necessary (its contribution to the system can be seen in reduced energy demand). For the remaining three products the environmental burden of the upstream processes is distributed proportionally according to their price – a procedure known as economic alloca-tion. Hence the burden is distributed as follows:
• White rice: 73.5 per cent;
• Broken grains: 14.5 per cent;
• Rice bran: 12.0 per cent.
Figure 7: Rice husk and bran deposited as waste behind the mill processing sites (Kogi State)
19
2. MeTHoDS
Overview of sources for the different stages of rice production and distribution in Nigeria
data data source
Cultivation Primary data from food loss survey, Pe agricultural model; gaBi 6 background data, IPCC (2006)
Transport Transport distances based on food loss survey; emissions: gaBi 6 background data
Processing Primary data from food loss survey, traders specification, industrial integrated: NIIr Board of Consultants & engineers (2006), World Academy of Science, engineering and Technology (2009);
Distribution Primary data from food loss survey; gaBi 6 background
Combustion of biomass (parboiling)
Traditional value chain: Akagi et al. (2011), Industrial value chain: gaBi 6 Database
Table 5: Overview of data sources
LCIA categories and indicators used to assess the environmental footprint of PHL rice and rice production in Nigeria
Category Indicator
Impact category
Description Unit Reference
Climate Change global War-ming Potential* (gWP)
A measure of gHg emissions, such as Co2 and methane. These emissions are causing an increase in the absorption of radiation emitted by the earth, magnifying the natural greenhouse effect. This impact category is also often referred to as ‘Carbon footprint’, but as global warming potential is a more precise description, the term gWP is used in this study.
kg Co2 equivalent
IPCC (2006),
100 year gWP is used
Water Water stress footprint
The water stress footprint of a system is a set of different calculations and should be used as an umbrella term rather than to communicate a single number. up till now, water footprinting has focused on the water lost to the watershed, i.e. water consumption. Water consumption is considered to have a direct impact on the environment (e.g. freshwater depletion and impacts on biodiversity). In the assessment of water consumption the location is cru-cial. This is addressed by applying the water stress index (WSI) developed by Pfister et al. (2009). See Appendix A for details.
m³ Bayart et al. (2010)
ISo 14046 (in progress)
Pfister et al. (2009)
Land use (occupation)
As a sub-group of land use (functional dimension of land and area that is used for urban, agricultural, forestry and other pur-poses) land occupation can be defined as the maintenance of an area in a particular state over a particular period of time
hectare ILCD (2011)
Table 4: Life cycle impact assessment categories & indicators
* The terminology ‘potential’ is used by ISo to clearly indicate that LCA shows possible impacts in the future. for example for climate change the gWP represents the potential impact of gHg emissions.
20
3. Description of the Rice Value Chain
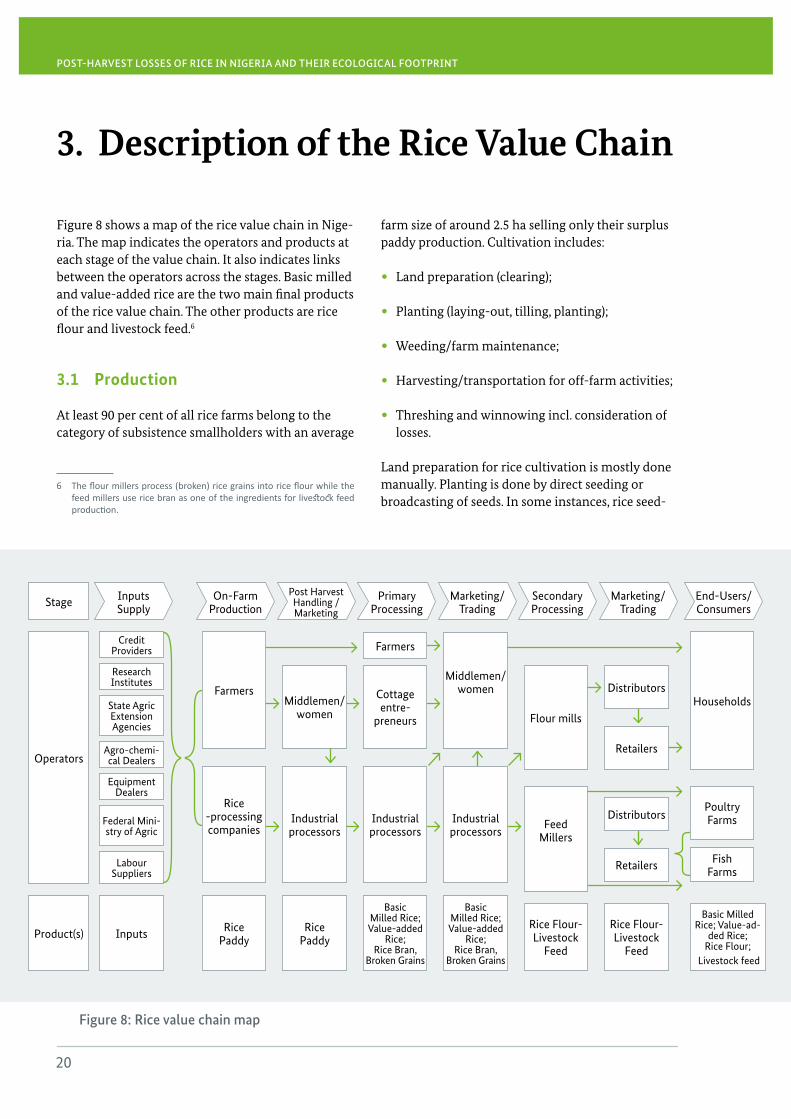
Figure 8 shows a map of the rice value chain in Nige-ria. The map indicates the operators and products at each stage of the value chain. It also indicates links between the operators across the stages. Basic milled and value-added rice are the two main final products of the rice value chain. The other products are rice flour and livestock feed.6
3 .1 Production
At least 90 per cent of all rice farms belong to the category of subsistence smallholders with an average
6 The flour millers process (broken) rice grains into rice flour while the feed millers use rice bran as one of the ingredients for livestock feed production.
farm size of around 2.5 ha selling only their surplus paddy production. Cultivation includes:
• Land preparation (clearing);
• Planting (laying-out, tilling, planting);
• Weeding/farm maintenance;
• Harvesting/transportation for off-farm activities;
• Threshing and winnowing incl. consideration of losses.
Land preparation for rice cultivation is mostly done manually. Planting is done by direct seeding or broadcasting of seeds. In some instances, rice seed-
POST-HARVEST LOSSES OF RICE IN NIGERIA AND THEIR ECOLOGICAL FOOTPRINT
Stage
Product(s)
operators
Inputs
Credit Providers
research Institutes
State Agric extension Agencies
Agro-chemi-cal Dealers
equipment Dealers
federal Mini-stry of Agric
Labour Suppliers
Inputs Supply
on-farm Production
end-users/ Consumers
rice Paddy
farmers
rice -processing companies
Basic Milled rice; Value-ad-
ded rice; rice flour;
Livestock feed
Households
Poultry farms
Post Harvest Handling / Marketing
rice Paddy
Middlemen/women
Industrial processors
Marketing/ Trading
rice flour-Livestock
feed
farmers
Primary Processing
Basic Milled rice; Value-added
rice; rice Bran,
Broken grains
Cottage entre-
preneurs
Industrial processors
Marketing/ Trading
Basic Milled rice; Value-added
rice; rice Bran,
Broken grains
Middlemen/women
Industrial processors
Distributors
retailers
Distributors
retailers
Secondary Processing
rice flour-Livestock
feed
flour mills
feed Millers
fish farms
Figure 8: Rice value chain map
21
3. DeSCrIPTIoN of THe rICe VALue CHAIN
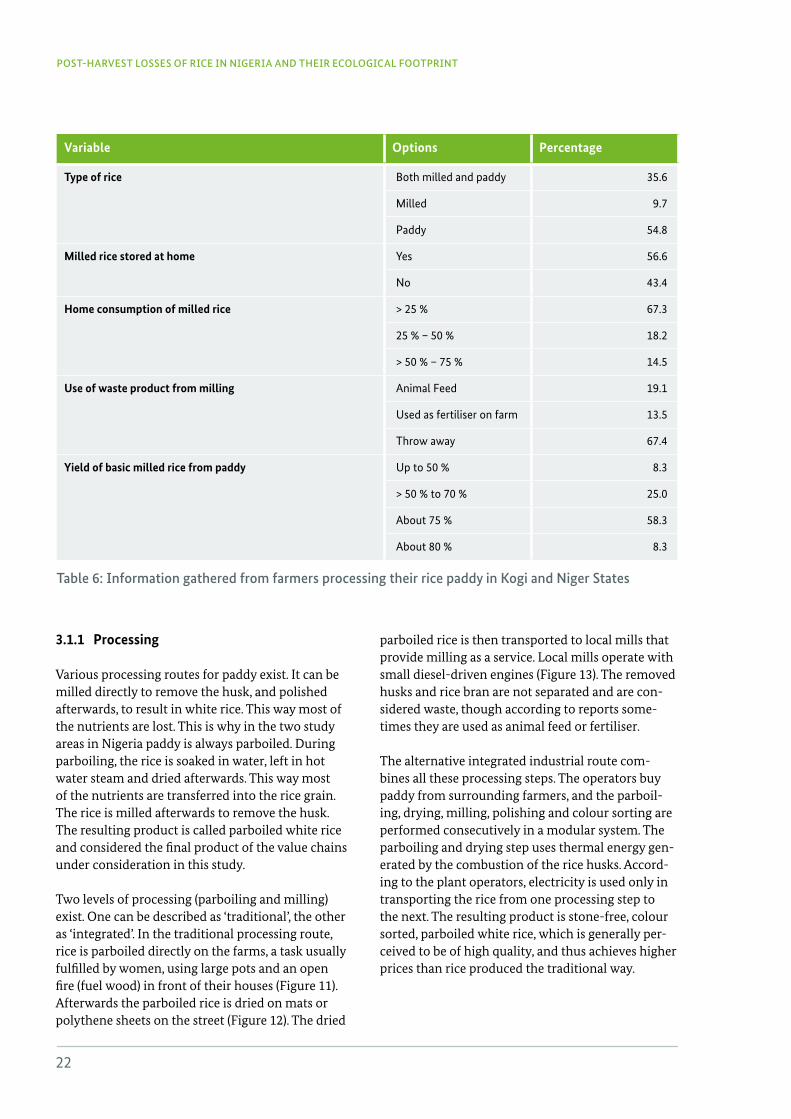
lings are raised in nurseries and then transplanted. Most of the rice cultivation is rainfed, but there are a few locations in Niger and Kogi States where ir-rigation is practised.7 In Kogi and Niger States, rice is mostly cultivated in the flood plains. Production cycles are thus dependent on the flooding cycles.
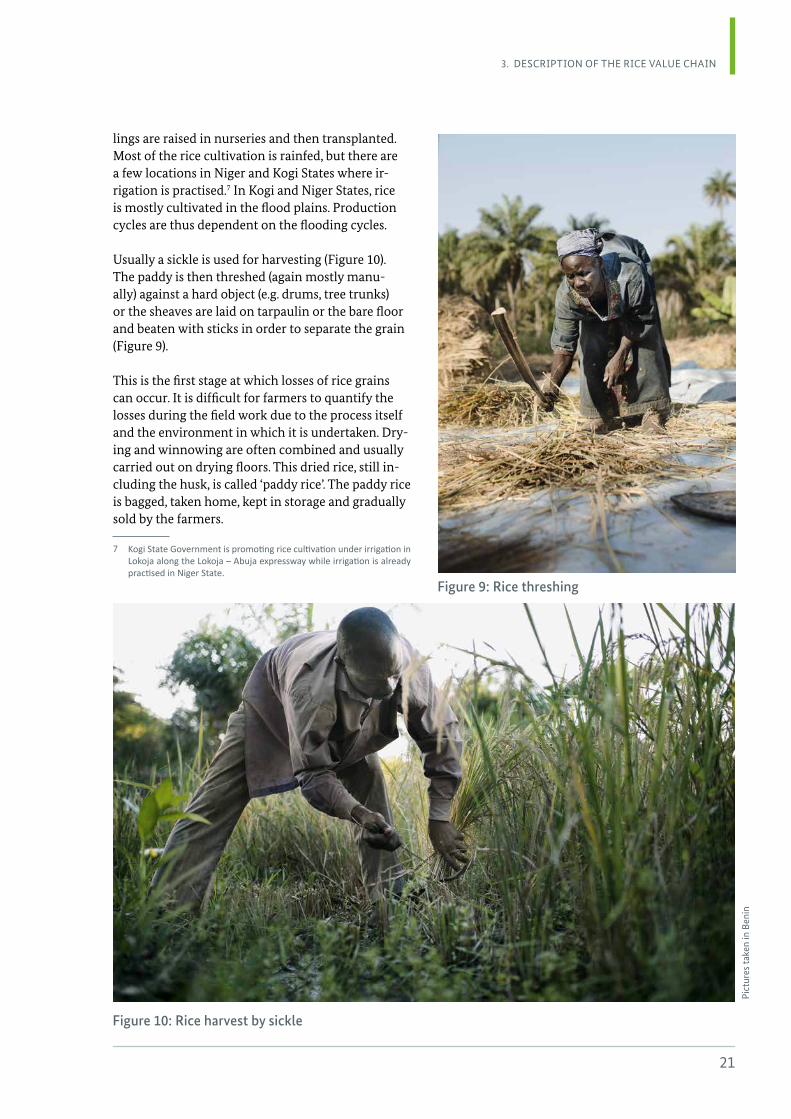
Usually a sickle is used for harvesting (Figure 10). The paddy is then threshed (again mostly manu-ally) against a hard object (e.g. drums, tree trunks) or the sheaves are laid on tarpaulin or the bare floor and beaten with sticks in order to separate the grain (Figure 9).
This is the first stage at which losses of rice grains can occur. It is difficult for farmers to quantify the losses during the field work due to the process itself and the environment in which it is undertaken. Dry-ing and winnowing are often combined and usually carried out on drying floors. This dried rice, still in-cluding the husk, is called ‘paddy rice’. The paddy rice is bagged, taken home, kept in storage and gradually sold by the farmers.
7 Kogi State Government is promoting rice cultivation under irrigation in Lokoja along the Lokoja – Abuja expressway while irrigation is already practised in Niger State.
Figure 10: Rice harvest by sickle
Pic
ture
s ta
ken
in B
enin
Figure 9: Rice threshing
22
POST-HARVEST LOSSES OF RICE IN NIGERIA AND THEIR ECOLOGICAL FOOTPRINT
3 .1 .1 Processing
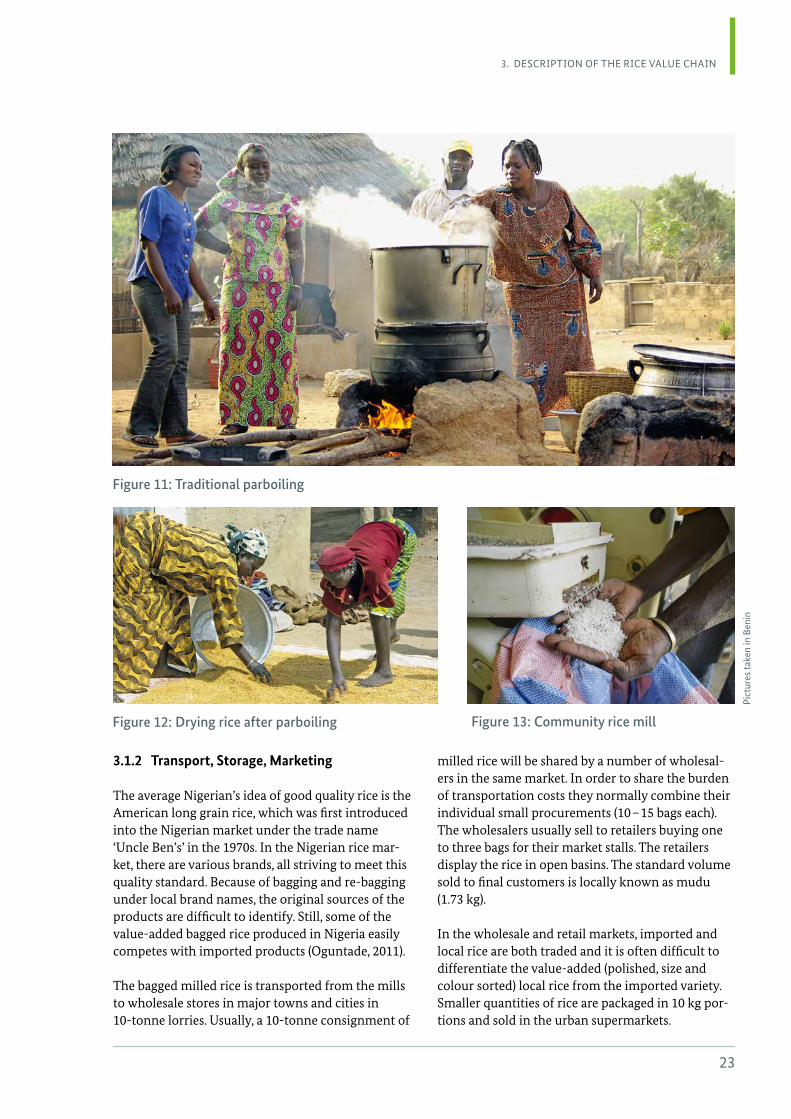
Various processing routes for paddy exist. It can be milled directly to remove the husk, and polished afterwards, to result in white rice. This way most of the nutrients are lost. This is why in the two study areas in Nigeria paddy is always parboiled. During parboiling, the rice is soaked in water, left in hot water steam and dried afterwards. This way most of the nutrients are transferred into the rice grain. The rice is milled afterwards to remove the husk. The resulting product is called parboiled white rice and considered the final product of the value chains under consideration in this study.
Two levels of processing (parboiling and milling) exist. One can be described as ‘traditional’, the other as ‘integrated’. In the traditional processing route, rice is parboiled directly on the farms, a task usually fulfilled by women, using large pots and an open fire (fuel wood) in front of their houses (Figure 11). Afterwards the parboiled rice is dried on mats or polythene sheets on the street (Figure 12). The dried
parboiled rice is then transported to local mills that provide milling as a service. Local mills operate with small diesel-driven engines (Figure 13). The removed husks and rice bran are not separated and are con-sidered waste, though according to reports some-times they are used as animal feed or fertiliser.
The alternative integrated industrial route com-bines all these processing steps. The operators buy paddy from surrounding farmers, and the parboil-ing, drying, milling, polishing and colour sorting are performed consecutively in a modular system. The parboiling and drying step uses thermal energy gen-erated by the combustion of the rice husks. Accord-ing to the plant operators, electricity is used only in transporting the rice from one processing step to the next. The resulting product is stone-free, colour sorted, parboiled white rice, which is generally per-ceived to be of high quality, and thus achieves higher prices than rice produced the traditional way.
Variable Options Percentage
Type of rice Both milled and paddy 35.6
Milled 9.7
Paddy 54.8
Milled rice stored at home yes 56.6
No 43.4
Home consumption of milled rice > 25 % 67.3
25 % – 50 % 18.2
> 50 % – 75 % 14.5
Use of waste product from milling Animal feed 19.1
used as fertiliser on farm 13.5
Throw away 67.4
Yield of basic milled rice from paddy up to 50 % 8.3
> 50 % to 70 % 25.0
About 75 % 58.3
About 80 % 8.3
Table 6: Information gathered from farmers processing their rice paddy in Kogi and Niger States
23
3. DeSCrIPTIoN of THe rICe VALue CHAIN
Figure 12: Drying rice after parboiling Figure 13: Community rice mill
Figure 11: Traditional parboiling
3 .1 .2 Transport, Storage, Marketing
The average Nigerian’s idea of good quality rice is the American long grain rice, which was first introduced into the Nigerian market under the trade name ‘Uncle Ben’s’ in the 1970s. In the Nigerian rice mar-ket, there are various brands, all striving to meet this quality standard. Because of bagging and re-bagging under local brand names, the original sources of the products are difficult to identify. Still, some of the value-added bagged rice produced in Nigeria easily competes with imported products (Oguntade, 2011).
The bagged milled rice is transported from the mills to wholesale stores in major towns and cities in 10-tonne lorries. Usually, a 10-tonne consignment of
milled rice will be shared by a number of wholesal-ers in the same market. In order to share the burden of transportation costs they normally combine their individual small procurements (10 – 15 bags each). The wholesalers usually sell to retailers buying one to three bags for their market stalls. The retailers display the rice in open basins. The standard volume sold to final customers is locally known as mudu (1.73 kg).
In the wholesale and retail markets, imported and local rice are both traded and it is often difficult to differentiate the value-added (polished, size and colour sorted) local rice from the imported variety. Smaller quantities of rice are packaged in 10 kg por-tions and sold in the urban supermarkets.
Pic
ture
s ta
ken
in B
enin
24
POST-HARVEST LOSSES OF RICE IN NIGERIA AND THEIR ECOLOGICAL FOOTPRINT
4. Results
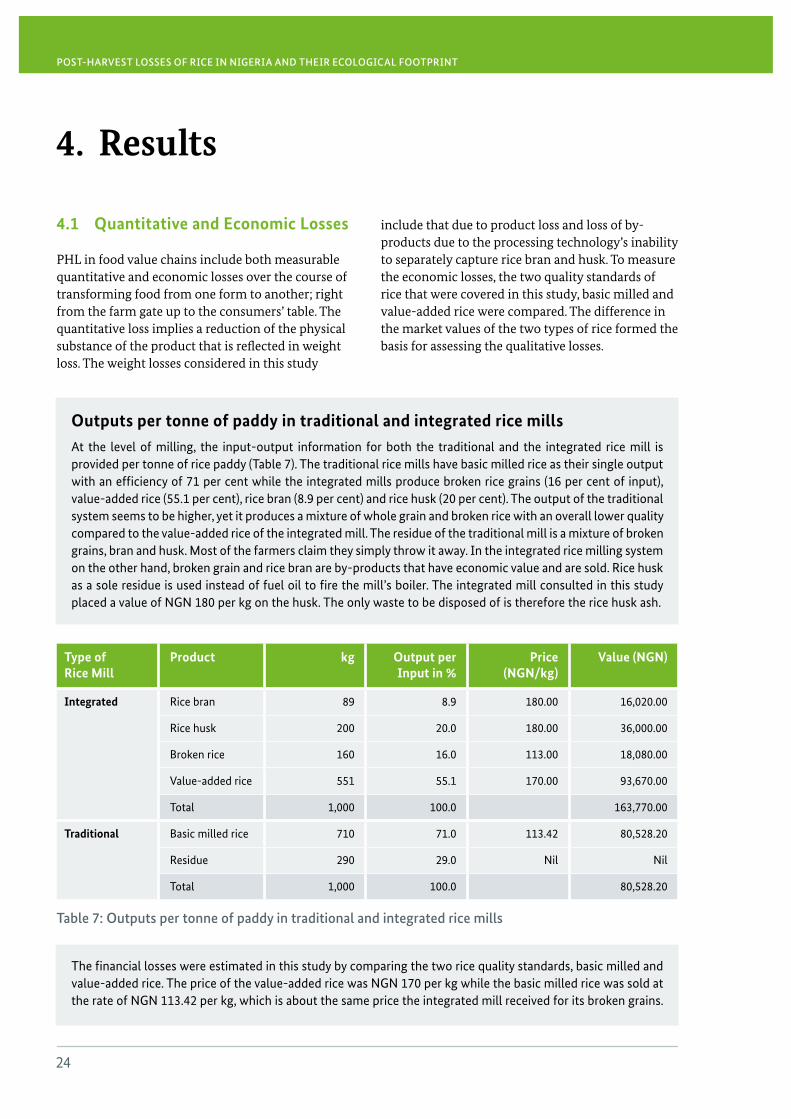
4 .1 Quantitative and Economic Losses
PHL in food value chains include both measurable quantitative and economic losses over the course of transforming food from one form to another; right from the farm gate up to the consumers’ table. The quantitative loss implies a reduction of the physical substance of the product that is reflected in weight loss. The weight losses considered in this study
include that due to product loss and loss of by-products due to the processing technology’s inability to separately capture rice bran and husk. To measure the economic losses, the two quality standards of rice that were covered in this study, basic milled and value-added rice were compared. The difference in the market values of the two types of rice formed the basis for assessing the qualitative losses.
POST-HARVEST LOSSES OF RICE IN NIGERIA AND THEIR ECOLOGICAL FOOTPRINT
Type of Rice Mill
Product kg Output per Input in %
Price (NGN/kg)
Value (NGN)
Integrated rice bran 89 8.9 180.00 16,020.00
rice husk 200 20.0 180.00 36,000.00
Broken rice 160 16.0 113.00 18,080.00
Value-added rice 551 55.1 170.00 93,670.00
Total 1,000 100.0 163,770.00
Traditional Basic milled rice 710 71.0 113.42 80,528.20
residue 290 29.0 Nil Nil
Total 1,000 100.0 80,528.20
Table 7: Outputs per tonne of paddy in traditional and integrated rice mills
Outputs per tonne of paddy in traditional and integrated rice mills At the level of milling, the input-output information for both the traditional and the integrated rice mill is provided per tonne of rice paddy (Table 7). The traditional rice mills have basic milled rice as their single output with an efficiency of 71 per cent while the integrated mills produce broken rice grains (16 per cent of input), value-added rice (55.1 per cent), rice bran (8.9 per cent) and rice husk (20 per cent). The output of the traditional system seems to be higher, yet it produces a mixture of whole grain and broken rice with an overall lower quality compared to the value-added rice of the integrated mill. The residue of the traditional mill is a mixture of broken grains, bran and husk. Most of the farmers claim they simply throw it away. In the integrated rice milling system on the other hand, broken grain and rice bran are by-products that have economic value and are sold. rice husk as a sole residue is used instead of fuel oil to fire the mill’s boiler. The integrated mill consulted in this study placed a value of NgN 180 per kg on the husk. The only waste to be disposed of is therefore the rice husk ash.
The financial losses were estimated in this study by comparing the two rice quality standards, basic milled and value-added rice. The price of the value-added rice was NgN 170 per kg while the basic milled rice was sold at the rate of NgN 113.42 per kg, which is about the same price the integrated mill received for its broken grains.
25
4. reSuLTS
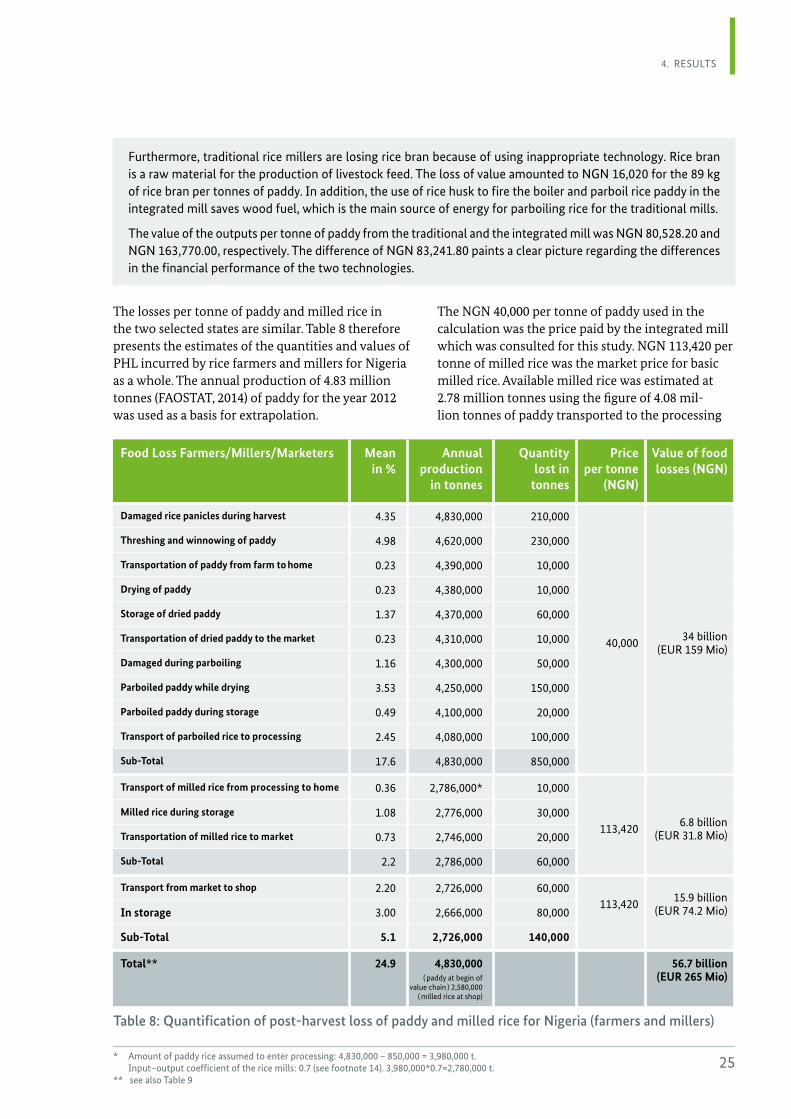
The losses per tonne of paddy and milled rice in the two selected states are similar. Table 8 therefore presents the estimates of the quantities and values of PHL incurred by rice farmers and millers for Nigeria as a whole. The annual production of 4.83 million tonnes (FAOSTAT, 2014) of paddy for the year 2012 was used as a basis for extrapolation.
The NGN 40,000 per tonne of paddy used in the calculation was the price paid by the integrated mill which was consulted for this study. NGN 113,420 per tonne of milled rice was the market price for basic milled rice. Available milled rice was estimated at 2.78 million tonnes using the figure of 4.08 mil-lion tonnes of paddy transported to the processing
Food Loss Farmers/Millers/Marketers Mean in %
Annual production
in tonnes
Quantity lost in
tonnes
Price per tonne
(NGN)
Value of food losses (NGN)
Damaged rice panicles during harvest 4.35 4,830,000 210,000
40,000 34 billion (eur 159 Mio)
Threshing and winnowing of paddy 4.98 4,620,000 230,000
Transportation of paddy from farm to home 0.23 4,390,000 10,000
Drying of paddy 0.23 4,380,000 10,000
Storage of dried paddy 1.37 4,370,000 60,000
Transportation of dried paddy to the market 0.23 4,310,000 10,000
Damaged during parboiling 1.16 4,300,000 50,000
Parboiled paddy while drying 3.53 4,250,000 150,000
Parboiled paddy during storage 0.49 4,100,000 20,000
Transport of parboiled rice to processing 2.45 4,080,000 100,000
Sub-Total 17.6 4,830,000 850,000
Transport of milled rice from processing to home 0.36 2,786,000* 10,000
113,420 6.8 billion (eur 31.8 Mio)
Milled rice during storage 1.08 2,776,000 30,000
Transportation of milled rice to market 0.73 2,746,000 20,000
Sub-Total 2.2 2,786,000 60,000
Transport from market to shop 2.20 2,726,000 60,000113,420 15.9 billion
(eur 74.2 Mio)In storage 3.00 2,666,000 80,000
Sub-Total 5 .1 2,726,000 140,000
Total** 24 .9 4,830,000( paddy at begin of
value chain ) 2,580,000( milled rice at shop)
56 .7 billion (EUR 265 Mio)
Table 8: Quantification of post-harvest loss of paddy and milled rice for Nigeria (farmers and millers)
furthermore, traditional rice millers are losing rice bran because of using inappropriate technology. rice bran is a raw material for the production of livestock feed. The loss of value amounted to NgN 16,020 for the 89 kg of rice bran per tonnes of paddy. In addition, the use of rice husk to fire the boiler and parboil rice paddy in the integrated mill saves wood fuel, which is the main source of energy for parboiling rice for the traditional mills.
The value of the outputs per tonne of paddy from the traditional and the integrated mill was NgN 80,528.20 and NgN 163,770.00, respectively. The difference of NgN 83,241.80 paints a clear picture regarding the differences in the financial performance of the two technologies.
* Amount of paddy rice assumed to enter processing: 4,830,000 – 850,000 = 3,980,000 t. Input–output coefficient of the rice mills: 0.7 (see footnote 14). 3,980,000*0.7=2,780,000 t.
** see also Table 9
26
POST-HARVEST LOSSES OF RICE IN NIGERIA AND THEIR ECOLOGICAL FOOTPRINT
centres and the input–output coefficient of the rice mills (0.70).8
The estimates in Table 8 indicate that a total of 0.85 million tonnes of paddy valued at NGN 34 billion would have been lost by the time processing of paddy into milled rice was completed. In addition, 0.06 million tonnes of milled rice worth NGN 6.8 billion would be lost during transportation and stor-age before the rice got into the hands of marketers (wholesalers and retailers). This adds up to a net loss of NGN 40.8 billion.
The food losses in the course of performing the marketing functions are estimated in Table 8. The value of food loss at the marketing stage was NGN 15.9 billion.
This collated information shows that the hotspots for losses are harvesting, threshing, parboiling and milling. In order to better understand the losses along the value chain in relation to a basis quantity,
8 for every 1000 kg of paddy milled, the traditional mills obtained 710 kg of basic milled rice while the integrated mill obtained 160 kg of broken rice and 551 kg of value-added rice, i.e. 711 kg of rice.
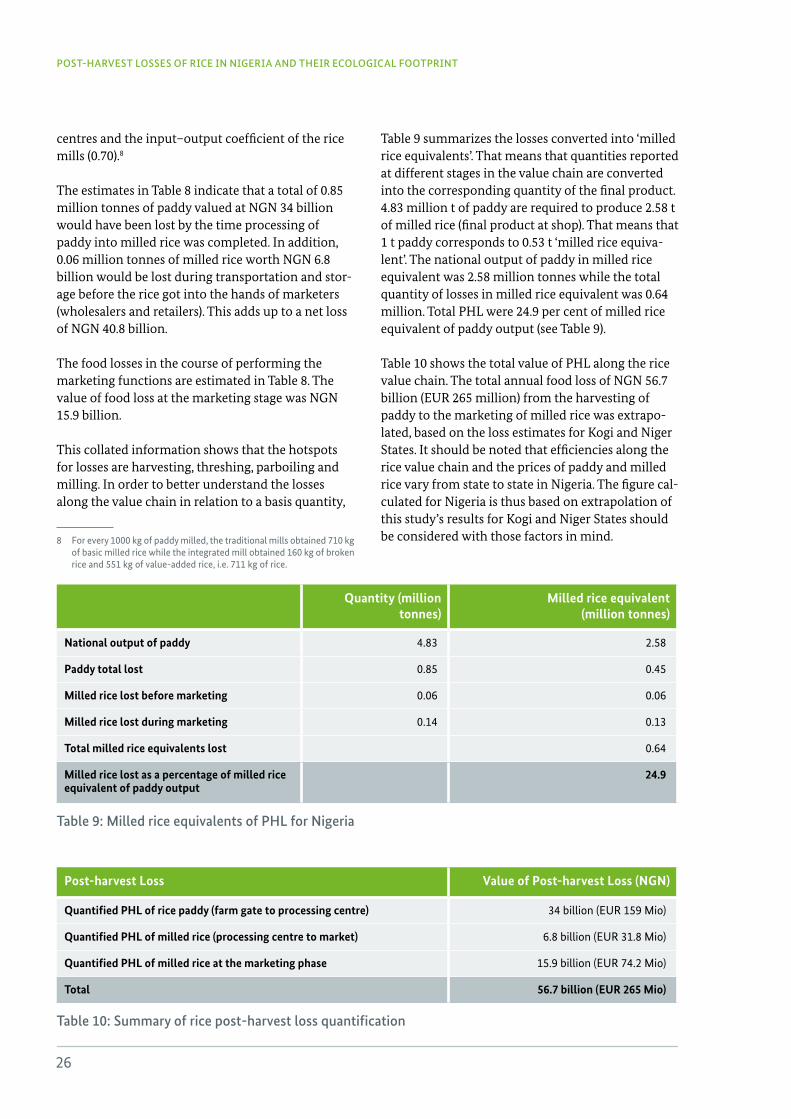
Table 9 summarizes the losses converted into ‘milled rice equivalents’. That means that quantities reported at different stages in the value chain are converted into the corresponding quantity of the final product. 4.83 million t of paddy are required to produce 2.58 t of milled rice (final product at shop). That means that 1 t paddy corresponds to 0.53 t ‘milled rice equiva-lent’. The national output of paddy in milled rice equivalent was 2.58 million tonnes while the total quantity of losses in milled rice equivalent was 0.64 million. Total PHL were 24.9 per cent of milled rice equivalent of paddy output (see Table 9).
Table 10 shows the total value of PHL along the rice value chain. The total annual food loss of NGN 56.7 billion (EUR 265 million) from the harvesting of paddy to the marketing of milled rice was extrapo-lated, based on the loss estimates for Kogi and Niger States. It should be noted that efficiencies along the rice value chain and the prices of paddy and milled rice vary from state to state in Nigeria. The figure cal-culated for Nigeria is thus based on extrapolation of this study’s results for Kogi and Niger States should be considered with those factors in mind.
Quantity (million tonnes)
Milled rice equivalent(million tonnes)
National output of paddy 4.83 2.58
Paddy total lost 0.85 0.45
Milled rice lost before marketing 0.06 0.06
Milled rice lost during marketing 0.14 0.13
Total milled rice equivalents lost 0.64
Milled rice lost as a percentage of milled rice equivalent of paddy output
24 .9
Table 9: Milled rice equivalents of PHL for Nigeria
Post-harvest Loss Value of Post-harvest Loss (NGN)
Quantified PHL of rice paddy (farm gate to processing centre) 34 billion (eur 159 Mio)
Quantified PHL of milled rice (processing centre to market) 6.8 billion (eur 31.8 Mio)
Quantified PHL of milled rice at the marketing phase 15.9 billion (eur 74.2 Mio)
Total 56 .7 billion (EUR 265 Mio)
Table 10: Summary of rice post-harvest loss quantification
27
4. reSuLTS
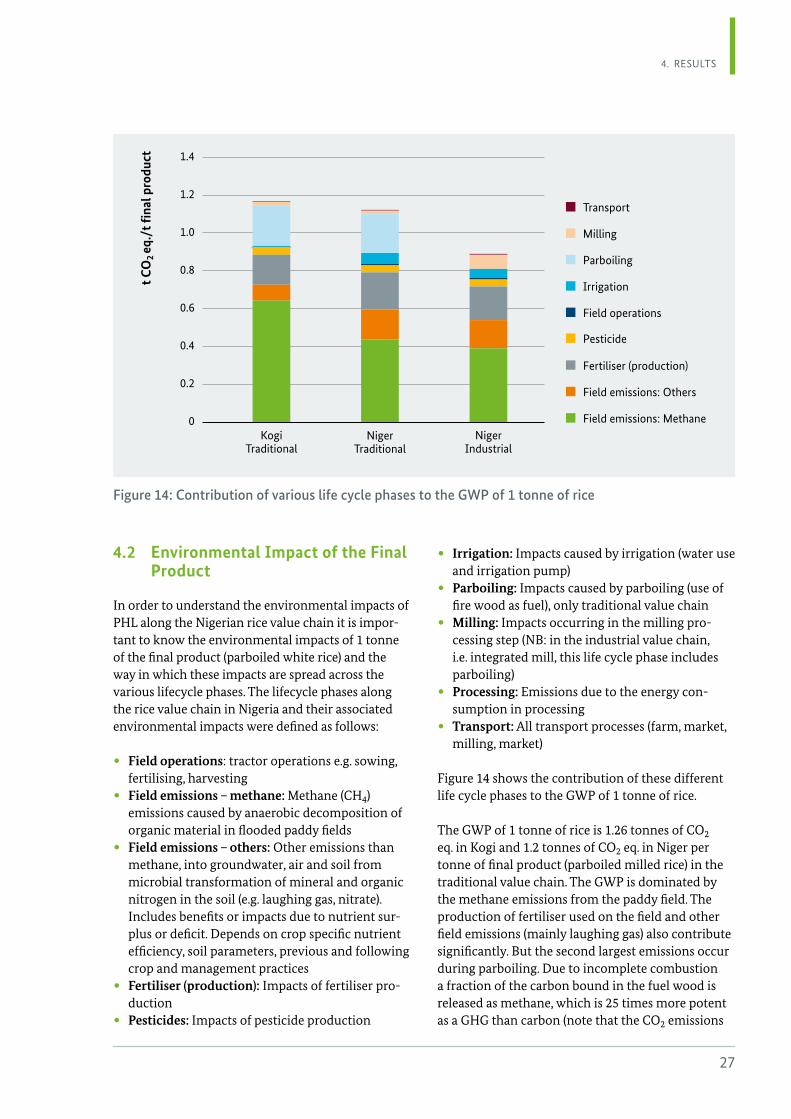
4 .2 Environmental Impact of the Final Product
In order to understand the environmental impacts of PHL along the Nigerian rice value chain it is impor-tant to know the environmental impacts of 1 tonne of the final product (parboiled white rice) and the way in which these impacts are spread across the various lifecycle phases. The lifecycle phases along the rice value chain in Nigeria and their associated environmental impacts were defined as follows:
• Field operations: tractor operations e.g. sowing, fertilising, harvesting
• Field emissions – methane: Methane (CH4) emissions caused by anaerobic decomposition of organic material in flooded paddy fields
• Field emissions – others: Other emissions than methane, into groundwater, air and soil from microbial transformation of mineral and organic nitrogen in the soil (e.g. laughing gas, nitrate). Includes benefits or impacts due to nutrient sur-plus or deficit. Depends on crop specific nutrient efficiency, soil parameters, previous and following crop and management practices
• Fertiliser (production): Impacts of fertiliser pro-duction
• Pesticides: Impacts of pesticide production
• Irrigation: Impacts caused by irrigation (water use and irrigation pump)
• Parboiling: Impacts caused by parboiling (use of fire wood as fuel), only traditional value chain
• Milling: Impacts occurring in the milling pro-cessing step (NB: in the industrial value chain, i.e. integrated mill, this life cycle phase includes parboiling)
• Processing: Emissions due to the energy con-sumption in processing
• Transport: All transport processes (farm, market, milling, market)
Figure 14 shows the contribution of these different life cycle phases to the GWP of 1 tonne of rice.
The GWP of 1 tonne of rice is 1.26 tonnes of CO2 eq. in Kogi and 1.2 tonnes of CO2 eq. in Niger per tonne of final product (parboiled milled rice) in the traditional value chain. The GWP is dominated by the methane emissions from the paddy field. The production of fertiliser used on the field and other field emissions (mainly laughing gas) also contribute significantly. But the second largest emissions occur during parboiling. Due to incomplete combustion a fraction of the carbon bound in the fuel wood is released as methane, which is 25 times more potent as a GHG than carbon (note that the CO2 emissions
1.4
1.2
1.0
0.8
0.6
0.4
0.2
0
Transport
Milling
Parboiling
Irrigation
field operations
Pesticide
fertiliser (production)
field emissions: others
field emissions: MethaneKogi
Traditional Niger
TraditionalNiger
Industrial
t CO
2 eq
./t fi
nal p
rodu
ct
Figure 14: Contribution of various life cycle phases to the GWP of 1 tonne of rice
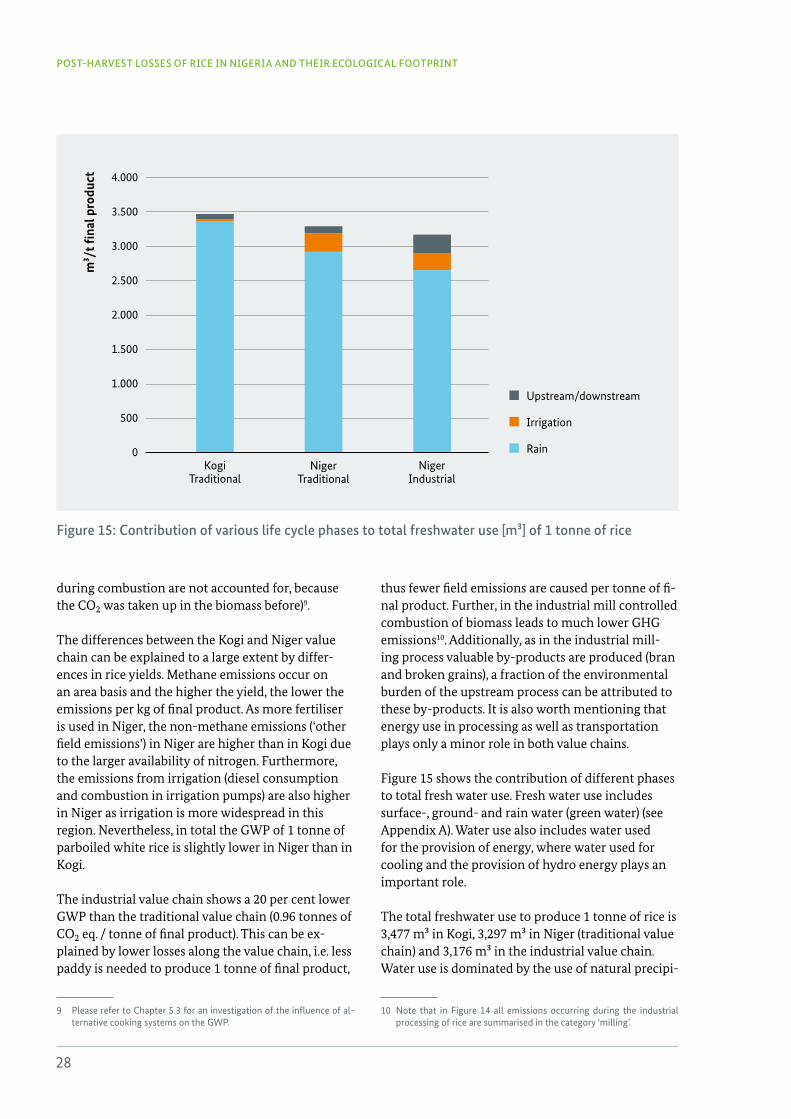
28
POST-HARVEST LOSSES OF RICE IN NIGERIA AND THEIR ECOLOGICAL FOOTPRINT
during combustion are not accounted for, because the CO2 was taken up in the biomass before)9.
The differences between the Kogi and Niger value chain can be explained to a large extent by differ-ences in rice yields. Methane emissions occur on an area basis and the higher the yield, the lower the emissions per kg of final product. As more fertiliser is used in Niger, the non-methane emissions (‘other field emissions’) in Niger are higher than in Kogi due to the larger availability of nitrogen. Furthermore, the emissions from irrigation (diesel consumption and combustion in irrigation pumps) are also higher in Niger as irrigation is more widespread in this region. Nevertheless, in total the GWP of 1 tonne of parboiled white rice is slightly lower in Niger than in Kogi.
The industrial value chain shows a 20 per cent lower GWP than the traditional value chain (0.96 tonnes of CO2 eq. / tonne of final product). This can be ex-plained by lower losses along the value chain, i.e. less paddy is needed to produce 1 tonne of final product,
9 Please refer to Chapter 5.3 for an investigation of the influence of al-ternative cooking systems on the gWP.
thus fewer field emissions are caused per tonne of fi-nal product. Further, in the industrial mill controlled combustion of biomass leads to much lower GHG emissions10. Additionally, as in the industrial mill-ing process valuable by-products are produced (bran and broken grains), a fraction of the environmental burden of the upstream process can be attributed to these by-products. It is also worth mentioning that energy use in processing as well as transportation plays only a minor role in both value chains.
Figure 15 shows the contribution of different phases to total fresh water use. Fresh water use includes surface-, ground- and rain water (green water) (see Appendix A). Water use also includes water used for the provision of energy, where water used for cooling and the provision of hydro energy plays an important role.
The total freshwater use to produce 1 tonne of rice is 3,477 m³ in Kogi, 3,297 m³ in Niger (traditional value chain) and 3,176 m³ in the industrial value chain. Water use is dominated by the use of natural precipi-
10 Note that in figure 14 all emissions occurring during the industrial processing of rice are summarised in the category ‘milling’.
upstream/downstream
Irrigation
rainKogi
Traditional Niger
TraditionalNiger
Industrial
m³/
t fina
l pro
duct
Figure 15: Contribution of various life cycle phases to total freshwater use [m³] of 1 tonne of rice
4.000
3.500
3.000
2.500
2.000
1.500
1.000
500
0
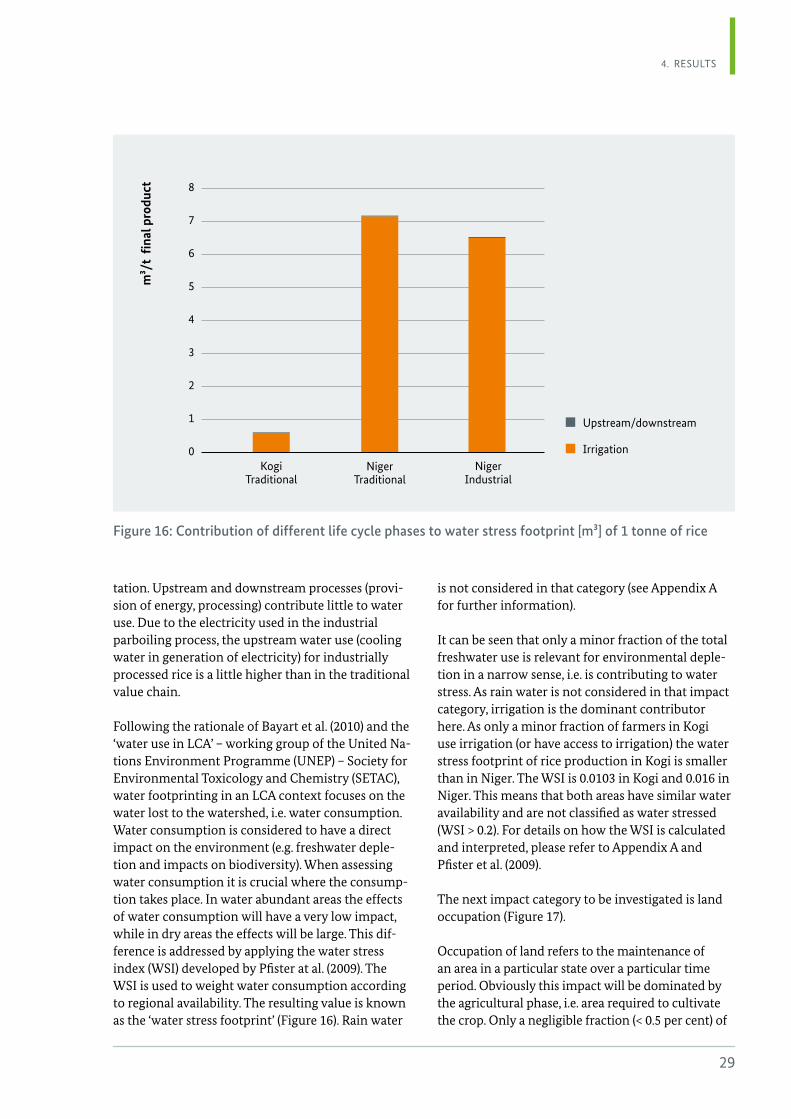
29
4. reSuLTS
tation. Upstream and downstream processes (provi-sion of energy, processing) contribute little to water use. Due to the electricity used in the industrial parboiling process, the upstream water use (cooling water in generation of electricity) for industrially processed rice is a little higher than in the traditional value chain.
Following the rationale of Bayart et al. (2010) and the ‘water use in LCA’ – working group of the United Na-tions Environment Programme (UNEP) – Society for Environmental Toxicology and Chemistry (SETAC), water footprinting in an LCA context focuses on the water lost to the watershed, i.e. water consumption. Water consumption is considered to have a direct impact on the environment (e.g. freshwater deple-tion and impacts on biodiversity). When assessing water consumption it is crucial where the consump-tion takes place. In water abundant areas the effects of water consumption will have a very low impact, while in dry areas the effects will be large. This dif-ference is addressed by applying the water stress index (WSI) developed by Pfister at al. (2009). The WSI is used to weight water consumption according to regional availability. The resulting value is known as the ‘water stress footprint’ (Figure 16). Rain water
is not considered in that category (see Appendix A for further information).
It can be seen that only a minor fraction of the total freshwater use is relevant for environmental deple-tion in a narrow sense, i.e. is contributing to water stress. As rain water is not considered in that impact category, irrigation is the dominant contributor here. As only a minor fraction of farmers in Kogi use irrigation (or have access to irrigation) the water stress footprint of rice production in Kogi is smaller than in Niger. The WSI is 0.0103 in Kogi and 0.016 in Niger. This means that both areas have similar water availability and are not classified as water stressed (WSI > 0.2). For details on how the WSI is calculated and interpreted, please refer to Appendix A and Pfister et al. (2009).
The next impact category to be investigated is land occupation (Figure 17).
Occupation of land refers to the maintenance of an area in a particular state over a particular time period. Obviously this impact will be dominated by the agricultural phase, i.e. area required to cultivate the crop. Only a negligible fraction (< 0.5 per cent) of
Figure 16: Contribution of different life cycle phases to water stress footprint [m³] of 1 tonne of rice
8
7
6
5
4
3
2
1
0
upstream/downstream
IrrigationKogi
Traditional Niger
TraditionalNiger
Industrial
m³/
t fi
nal p
rodu
ct
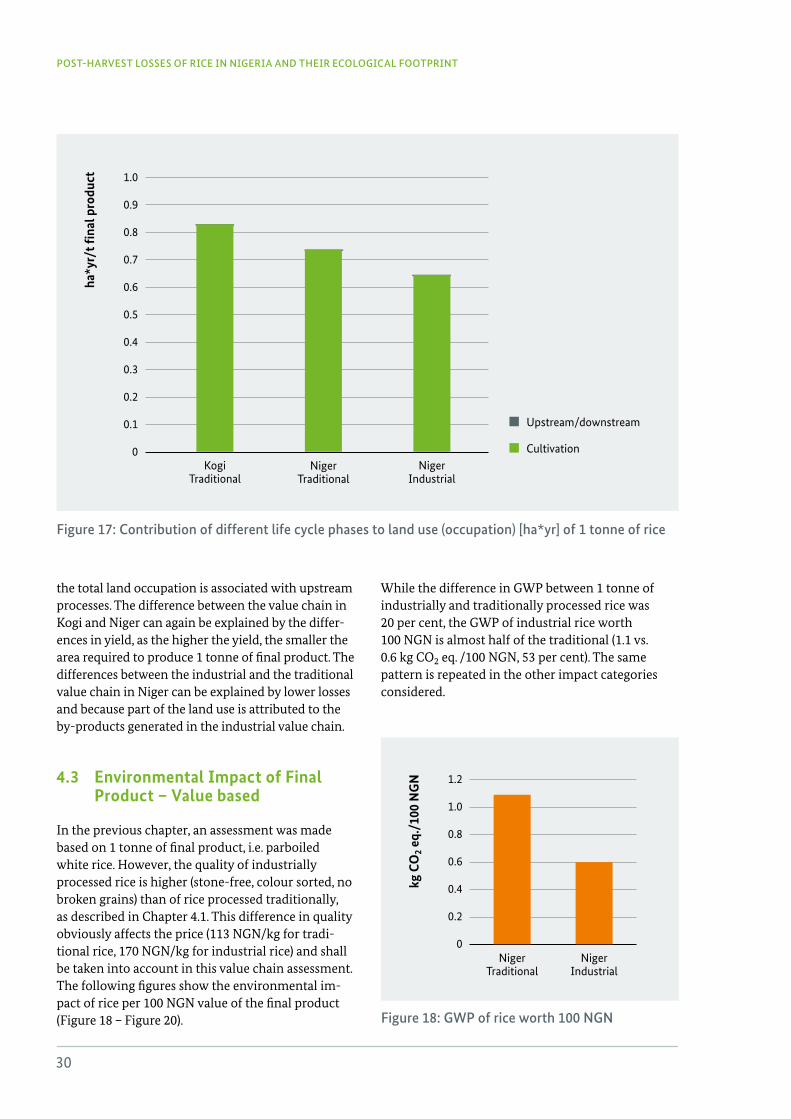
30
POST-HARVEST LOSSES OF RICE IN NIGERIA AND THEIR ECOLOGICAL FOOTPRINT
the total land occupation is associated with upstream processes. The difference between the value chain in Kogi and Niger can again be explained by the differ-ences in yield, as the higher the yield, the smaller the area required to produce 1 tonne of final product. The differences between the industrial and the traditional value chain in Niger can be explained by lower losses and because part of the land use is attributed to the by-products generated in the industrial value chain.
4 .3 Environmental Impact of Final Product – Value based
In the previous chapter, an assessment was made based on 1 tonne of final product, i.e. parboiled white rice. However, the quality of industrially processed rice is higher (stone-free, colour sorted, no broken grains) than of rice processed traditionally, as described in Chapter 4.1. This difference in quality obviously affects the price (113 NGN/kg for tradi-tional rice, 170 NGN/kg for industrial rice) and shall be taken into account in this value chain assessment. The following figures show the environmental im-pact of rice per 100 NGN value of the final product (Figure 18 – Figure 20).
While the difference in GWP between 1 tonne of industrially and traditionally processed rice was 20 per cent, the GWP of industrial rice worth 100 NGN is almost half of the traditional (1.1 vs. 0.6 kg CO2 eq. /100 NGN, 53 per cent). The same pattern is repeated in the other impact categories considered.
upstream/downstream
CultivationKogi
Traditional Niger
TraditionalNiger
Industrial
ha*y
r/t fi
nal p
rodu
ct
Figure 17: Contribution of different life cycle phases to land use (occupation) [ha*yr] of 1 tonne of rice
kg C
O2 e
q ./1
00 N
GN
Figure 18: GWP of rice worth 100 NGN
Niger Traditional
Niger Industrial
1.2
1.0
0.8
0.6
0.4
0.2
0
1.0
0.9
0.8
0.7
0.6
0.5
0.4
0.3
0.2
0.1
0
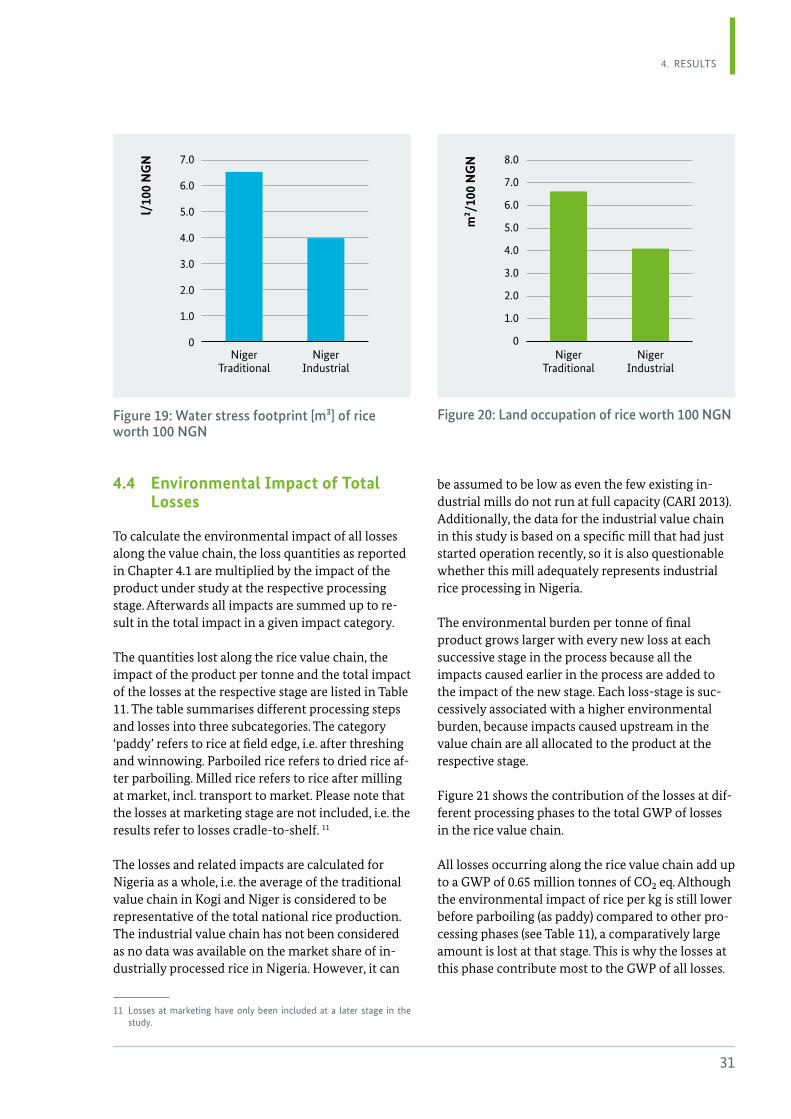
31
4. reSuLTS
4 .4 Environmental Impact of Total Losses
To calculate the environmental impact of all losses along the value chain, the loss quantities as reported in Chapter 4.1 are multiplied by the impact of the product under study at the respective processing stage. Afterwards all impacts are summed up to re-sult in the total impact in a given impact category.
The quantities lost along the rice value chain, the impact of the product per tonne and the total impact of the losses at the respective stage are listed in Table 11. The table summarises different processing steps and losses into three subcategories. The category ‘paddy’ refers to rice at field edge, i.e. after threshing and winnowing. Parboiled rice refers to dried rice af-ter parboiling. Milled rice refers to rice after milling at market, incl. transport to market. Please note that the losses at marketing stage are not included, i.e. the results refer to losses cradle-to-shelf. 11
The losses and related impacts are calculated for Nigeria as a whole, i.e. the average of the traditional value chain in Kogi and Niger is considered to be representative of the total national rice production. The industrial value chain has not been considered as no data was available on the market share of in-dustrially processed rice in Nigeria. However, it can
11 Losses at marketing have only been included at a later stage in the study.
be assumed to be low as even the few existing in-dustrial mills do not run at full capacity (CARI 2013). Additionally, the data for the industrial value chain in this study is based on a specific mill that had just started operation recently, so it is also questionable whether this mill adequately represents industrial rice processing in Nigeria.
The environmental burden per tonne of final product grows larger with every new loss at each successive stage in the process because all the impacts caused earlier in the process are added to the impact of the new stage. Each loss-stage is suc-cessively associated with a higher environmental burden, because impacts caused upstream in the value chain are all allocated to the product at the respective stage.
Figure 21 shows the contribution of the losses at dif-ferent processing phases to the total GWP of losses in the rice value chain.
All losses occurring along the rice value chain add up to a GWP of 0.65 million tonnes of CO2 eq. Although the environmental impact of rice per kg is still lower before parboiling (as paddy) compared to other pro-cessing phases (see Table 11), a comparatively large amount is lost at that stage. This is why the losses at this phase contribute most to the GWP of all losses.
l/10
0 N
GN
Figure 19: Water stress footprint [m³] of rice worth 100 NGN
Niger Traditional
Niger Industrial
7.0
6.0
5.0
4.0
3.0
2.0
1.0
0
m²/
100
NG
N
Figure 20: Land occupation of rice worth 100 NGN
Niger Traditional
Niger Industrial
8.0
7.0
6.0
5.0
4.0
3.0
2.0
1.0
0
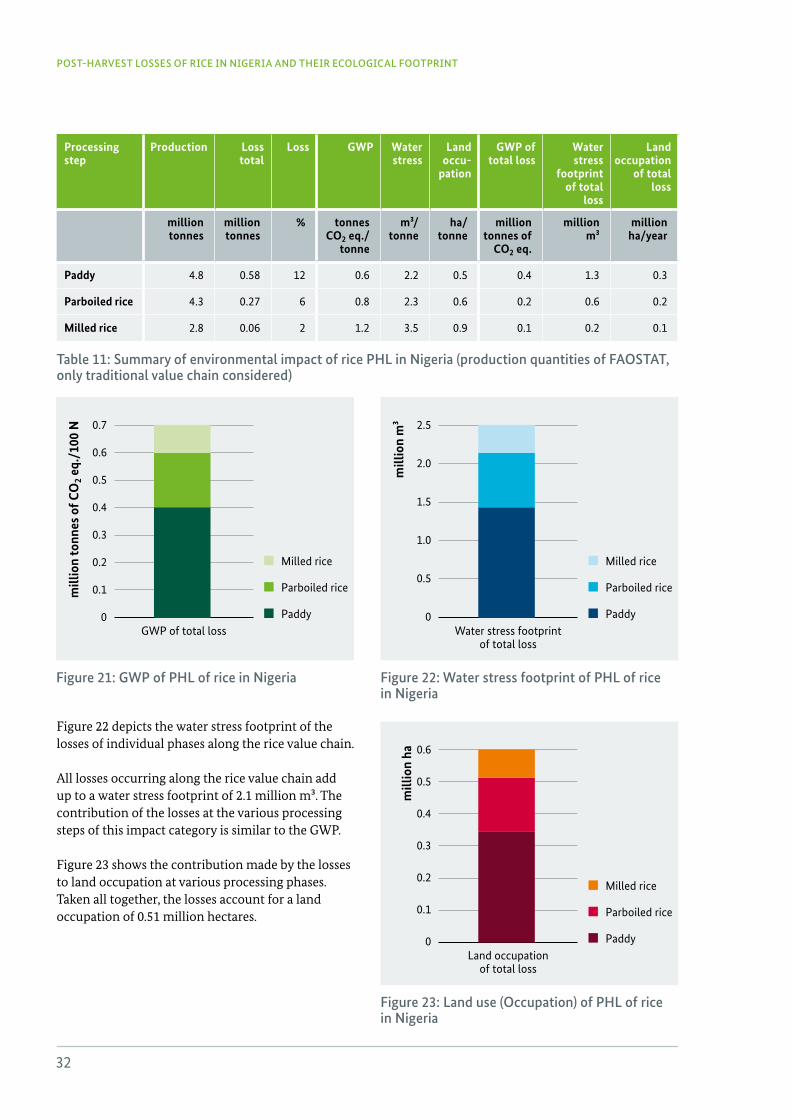
32
POST-HARVEST LOSSES OF RICE IN NIGERIA AND THEIR ECOLOGICAL FOOTPRINT
Figure 22 depicts the water stress footprint of the losses of individual phases along the rice value chain.
All losses occurring along the rice value chain add up to a water stress footprint of 2.1 million m³. The contribution of the losses at the various processing steps of this impact category is similar to the GWP.
Figure 23 shows the contribution made by the losses to land occupation at various processing phases. Taken all together, the losses account for a land occupation of 0.51 million hectares.
Processing step
Production Loss total
Loss GWP Water stress
Land occu-
pation
GWP of total loss
Water stress
footprint of total
loss
Land occupation
of total loss
million tonnes
million tonnes
% tonnes CO2 eq ./
tonne
m³/tonne
ha/tonne
million tonnes of
CO2 eq .
million m³
million ha/year
Paddy 4.8 0.58 12 0.6 2.2 0.5 0.4 1.3 0.3
Parboiled rice 4.3 0.27 6 0.8 2.3 0.6 0.2 0.6 0.2
Milled rice 2.8 0.06 2 1.2 3.5 0.9 0.1 0.2 0.1
Table 11: Summary of environmental impact of rice PHL in Nigeria (production quantities of FAOSTAT, only traditional value chain considered)
mill
ion
ha
Figure 23: Land use (Occupation) of PHL of rice in Nigeria
Milled rice
Parboiled rice
PaddyLand occupation
of total loss
0.6
0.5
0.4
0.3
0.2
0.1
0
mill
ion
m³
Figure 22: Water stress footprint of PHL of rice in Nigeria
Milled rice
Parboiled rice
PaddyWater stress footprint
of total loss
2.5
2.0
1.5
1.0
0.5
0
mill
ion
tonn
es o
f CO
2 eq .
/100
N
Figure 21: GWP of PHL of rice in Nigeria
Milled rice
Parboiled rice
PaddygWP of total loss
0.7
0.6
0.5
0.4
0.3
0.2
0.1
0
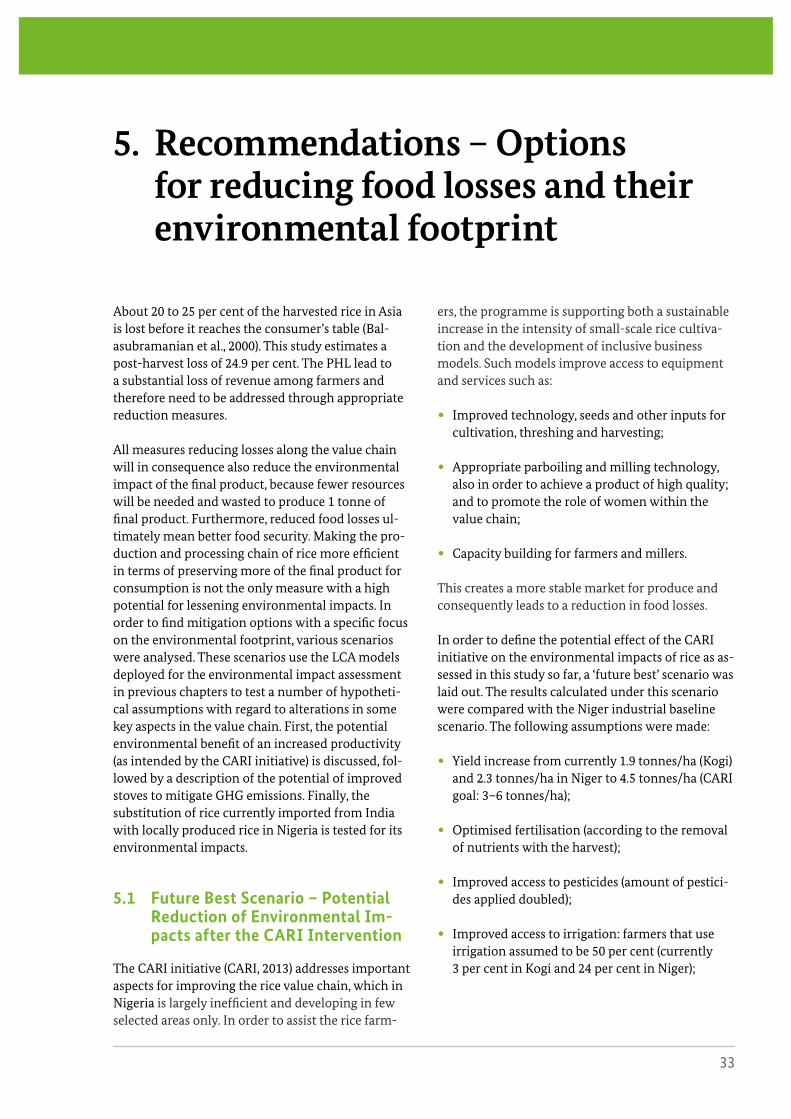
33
5. Recommendations – Options for reducing food losses and their environmental footprint
About 20 to 25 per cent of the harvested rice in Asia is lost before it reaches the consumer’s table (Bal-asubramanian et al., 2000). This study estimates a post-harvest loss of 24.9 per cent. The PHL lead to a substantial loss of revenue among farmers and therefore need to be addressed through appropriate reduction measures.
All measures reducing losses along the value chain will in consequence also reduce the environmental impact of the final product, because fewer resources will be needed and wasted to produce 1 tonne of final product. Furthermore, reduced food losses ul-timately mean better food security. Making the pro-duction and processing chain of rice more efficient in terms of preserving more of the final product for consumption is not the only measure with a high potential for lessening environmental impacts. In order to find mitigation options with a specific focus on the environmental footprint, various scenarios were analysed. These scenarios use the LCA models deployed for the environmental impact assessment in previous chapters to test a number of hypotheti-cal assumptions with regard to alterations in some key aspects in the value chain. First, the potential environmental benefit of an increased productivity (as intended by the CARI initiative) is discussed, fol-lowed by a description of the potential of improved stoves to mitigate GHG emissions. Finally, the substitution of rice currently imported from India with locally produced rice in Nigeria is tested for its environmental impacts.
5 .1 Future Best Scenario – Potential Reduction of Environmental Im-pacts after the CARI Intervention
The CARI initiative (CARI, 2013) addresses important aspects for improving the rice value chain, which in Nigeria is largely inefficient and developing in few selected areas only. In order to assist the rice farm-
ers, the programme is supporting both a sustainable increase in the intensity of small-scale rice cultiva-tion and the development of inclusive business models. Such models improve access to equipment and services such as:
• Improved technology, seeds and other inputs for cultivation, threshing and harvesting;
• Appropriate parboiling and milling technology, also in order to achieve a product of high quality; and to promote the role of women within the value chain;
• Capacity building for farmers and millers.
This creates a more stable market for produce and consequently leads to a reduction in food losses.
In order to define the potential effect of the CARI initiative on the environmental impacts of rice as as-sessed in this study so far, a ‘future best’ scenario was laid out. The results calculated under this scenario were compared with the Niger industrial baseline scenario. The following assumptions were made:
• Yield increase from currently 1.9 tonnes/ha (Kogi) and 2.3 tonnes/ha in Niger to 4.5 tonnes/ha (CARI goal: 3–6 tonnes/ha);
• Optimised fertilisation (according to the removal of nutrients with the harvest);
• Improved access to pesticides (amount of pestici-des applied doubled);
• Improved access to irrigation: farmers that use irrigation assumed to be 50 per cent (currently 3 per cent in Kogi and 24 per cent in Niger);
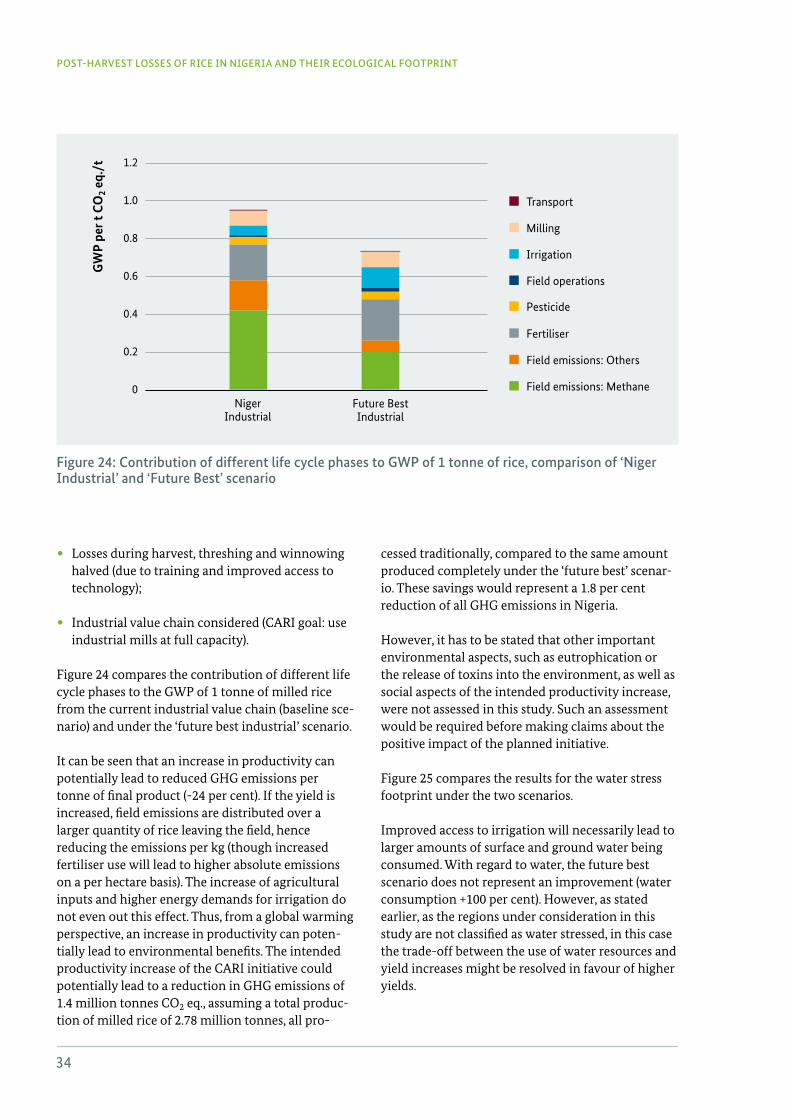
34
POST-HARVEST LOSSES OF RICE IN NIGERIA AND THEIR ECOLOGICAL FOOTPRINT
• Losses during harvest, threshing and winnowing halved (due to training and improved access to technology);
• Industrial value chain considered (CARI goal: use industrial mills at full capacity).
Figure 24 compares the contribution of different life cycle phases to the GWP of 1 tonne of milled rice from the current industrial value chain (baseline sce-nario) and under the ‘future best industrial’ scenario.
It can be seen that an increase in productivity can potentially lead to reduced GHG emissions per tonne of final product (-24 per cent). If the yield is increased, field emissions are distributed over a larger quantity of rice leaving the field, hence reducing the emissions per kg (though increased fertiliser use will lead to higher absolute emissions on a per hectare basis). The increase of agricultural inputs and higher energy demands for irrigation do not even out this effect. Thus, from a global warming perspective, an increase in productivity can poten-tially lead to environmental benefits. The intended productivity increase of the CARI initiative could potentially lead to a reduction in GHG emissions of 1.4 million tonnes CO2 eq., assuming a total produc-tion of milled rice of 2.78 million tonnes, all pro-
cessed traditionally, compared to the same amount produced completely under the ‘future best’ scenar-io. These savings would represent a 1.8 per cent reduction of all GHG emissions in Nigeria.
However, it has to be stated that other important environmental aspects, such as eutrophication or the release of toxins into the environment, as well as social aspects of the intended productivity increase, were not assessed in this study. Such an assessment would be required before making claims about the positive impact of the planned initiative.
Figure 25 compares the results for the water stress footprint under the two scenarios.
Improved access to irrigation will necessarily lead to larger amounts of surface and ground water being consumed. With regard to water, the future best scenario does not represent an improvement (water consumption +100 per cent). However, as stated earlier, as the regions under consideration in this study are not classified as water stressed, in this case the trade-off between the use of water resources and yield increases might be resolved in favour of higher yields.
Transport
Milling
Irrigation
field operations
Pesticide
fertiliser
field emissions: others
field emissions: MethaneNiger
Industrial future Best Industrial
GW
P pe
r t C
O2 e
q ./t
Figure 24: Contribution of different life cycle phases to GWP of 1 tonne of rice, comparison of ‘Niger Industrial’ and ‘Future Best’ scenario
1.2
1.0
0.8
0.6
0.4
0.2
0
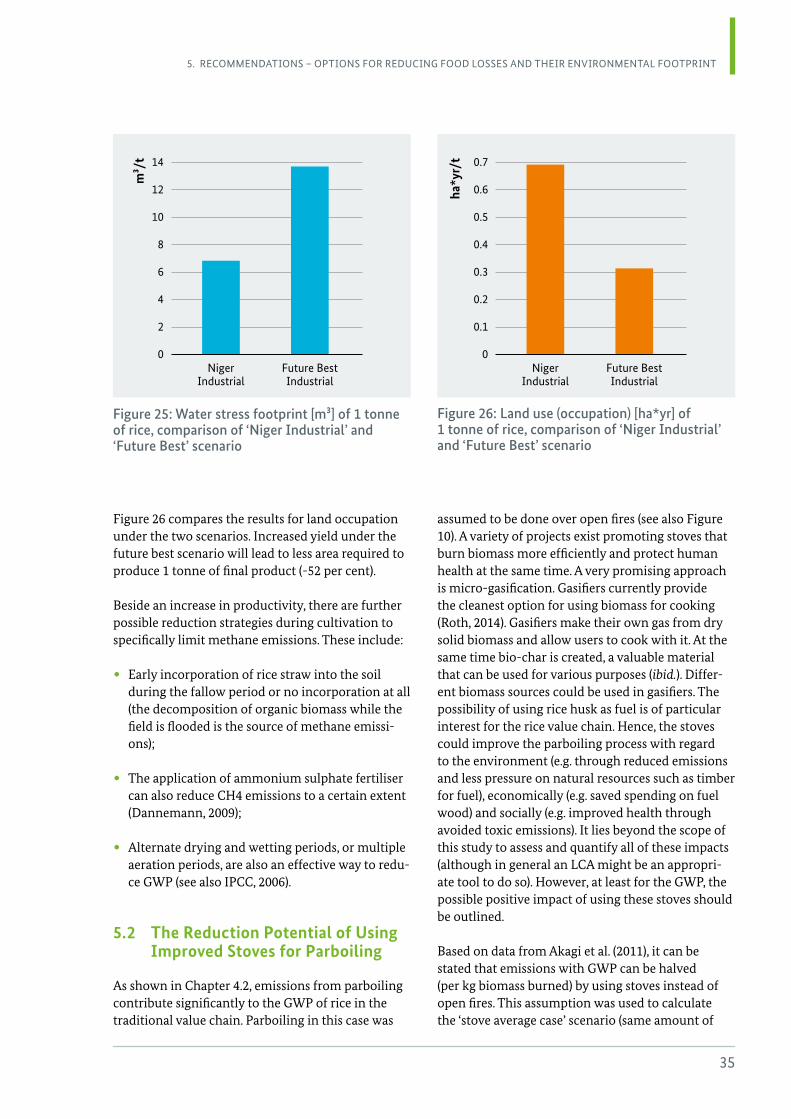
35
5. reCoMMeNDATIoNS – oPTIoNS for reDuCINg fooD LoSSeS AND THeIr eNVIroNMeNTAL fooTPrINT
Figure 26 compares the results for land occupation under the two scenarios. Increased yield under the future best scenario will lead to less area required to produce 1 tonne of final product (-52 per cent).
Beside an increase in productivity, there are further possible reduction strategies during cultivation to specifically limit methane emissions. These include:
• Early incorporation of rice straw into the soil during the fallow period or no incorporation at all (the decomposition of organic biomass while the field is flooded is the source of methane emissi-ons);
• The application of ammonium sulphate fertiliser can also reduce CH4 emissions to a certain extent (Dannemann, 2009);
• Alternate drying and wetting periods, or multiple aeration periods, are also an effective way to redu-ce GWP (see also IPCC, 2006).
5 .2 The Reduction Potential of Using Improved Stoves for Parboiling
As shown in Chapter 4.2, emissions from parboiling contribute significantly to the GWP of rice in the traditional value chain. Parboiling in this case was
assumed to be done over open fires (see also Figure 10). A variety of projects exist promoting stoves that burn biomass more efficiently and protect human health at the same time. A very promising approach is micro-gasification. Gasifiers currently provide the cleanest option for using biomass for cooking (Roth, 2014). Gasifiers make their own gas from dry solid biomass and allow users to cook with it. At the same time bio-char is created, a valuable material that can be used for various purposes (ibid.). Differ-ent biomass sources could be used in gasifiers. The possibility of using rice husk as fuel is of particular interest for the rice value chain. Hence, the stoves could improve the parboiling process with regard to the environment (e.g. through reduced emissions and less pressure on natural resources such as timber for fuel), economically (e.g. saved spending on fuel wood) and socially (e.g. improved health through avoided toxic emissions). It lies beyond the scope of this study to assess and quantify all of these impacts (although in general an LCA might be an appropri-ate tool to do so). However, at least for the GWP, the possible positive impact of using these stoves should be outlined.
Based on data from Akagi et al. (2011), it can be stated that emissions with GWP can be halved (per kg biomass burned) by using stoves instead of open fires. This assumption was used to calculate the ‘stove average case’ scenario (same amount of
Figure 26: Land use (occupation) [ha*yr] of 1 tonne of rice, comparison of ‘Niger Industrial’ and ‘Future Best’ scenario
Figure 25: Water stress footprint [m³] of 1 tonne of rice, comparison of ‘Niger Industrial’ and ‘Future Best’ scenario
m³/
t
Niger Industrial
future Best Industrial
14
12
10
8
6
4
2
0Niger
Industrialfuture Best Industrial
0.7
0.6
0.5
0.4
0.3
0.2
0.1
0
ha*y
r/t
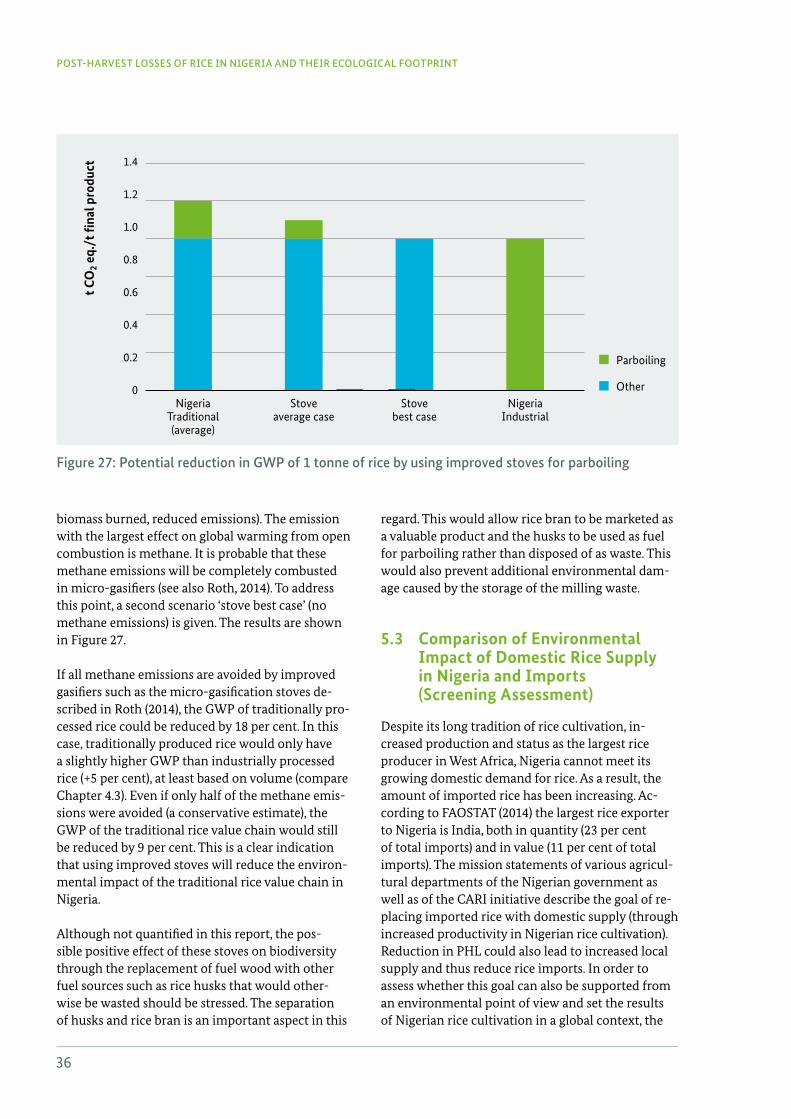
36
POST-HARVEST LOSSES OF RICE IN NIGERIA AND THEIR ECOLOGICAL FOOTPRINT
biomass burned, reduced emissions). The emission with the largest effect on global warming from open combustion is methane. It is probable that these methane emissions will be completely combusted in micro-gasifiers (see also Roth, 2014). To address this point, a second scenario ‘stove best case’ (no methane emissions) is given. The results are shown in Figure 27.
If all methane emissions are avoided by improved gasifiers such as the micro-gasification stoves de-scribed in Roth (2014), the GWP of traditionally pro-cessed rice could be reduced by 18 per cent. In this case, traditionally produced rice would only have a slightly higher GWP than industrially processed rice (+5 per cent), at least based on volume (compare Chapter 4.3). Even if only half of the methane emis-sions were avoided (a conservative estimate), the GWP of the traditional rice value chain would still be reduced by 9 per cent. This is a clear indication that using improved stoves will reduce the environ-mental impact of the traditional rice value chain in Nigeria.
Although not quantified in this report, the pos-sible positive effect of these stoves on biodiversity through the replacement of fuel wood with other fuel sources such as rice husks that would other-wise be wasted should be stressed. The separation of husks and rice bran is an important aspect in this
regard. This would allow rice bran to be marketed as a valuable product and the husks to be used as fuel for parboiling rather than disposed of as waste. This would also prevent additional environmental dam-age caused by the storage of the milling waste.
5 .3 Comparison of Environmental Impact of Domestic Rice Supply in Nigeria and Imports (Screening Assessment)
Despite its long tradition of rice cultivation, in-creased production and status as the largest rice producer in West Africa, Nigeria cannot meet its growing domestic demand for rice. As a result, the amount of imported rice has been increasing. Ac-cording to FAOSTAT (2014) the largest rice exporter to Nigeria is India, both in quantity (23 per cent of total imports) and in value (11 per cent of total imports). The mission statements of various agricul-tural departments of the Nigerian government as well as of the CARI initiative describe the goal of re-placing imported rice with domestic supply (through increased productivity in Nigerian rice cultivation). Reduction in PHL could also lead to increased local supply and thus reduce rice imports. In order to assess whether this goal can also be supported from an environmental point of view and set the results of Nigerian rice cultivation in a global context, the
Parboiling
otherNigeria
Traditional (average)
Stove average case
Stove best case
Nigeria Industrial
t CO
2 eq .
/t fi
nal p
rodu
ct
Figure 27: Potential reduction in GWP of 1 tonne of rice by using improved stoves for parboiling
1.4
1.2
1.0
0.8
0.6
0.4
0.2
0
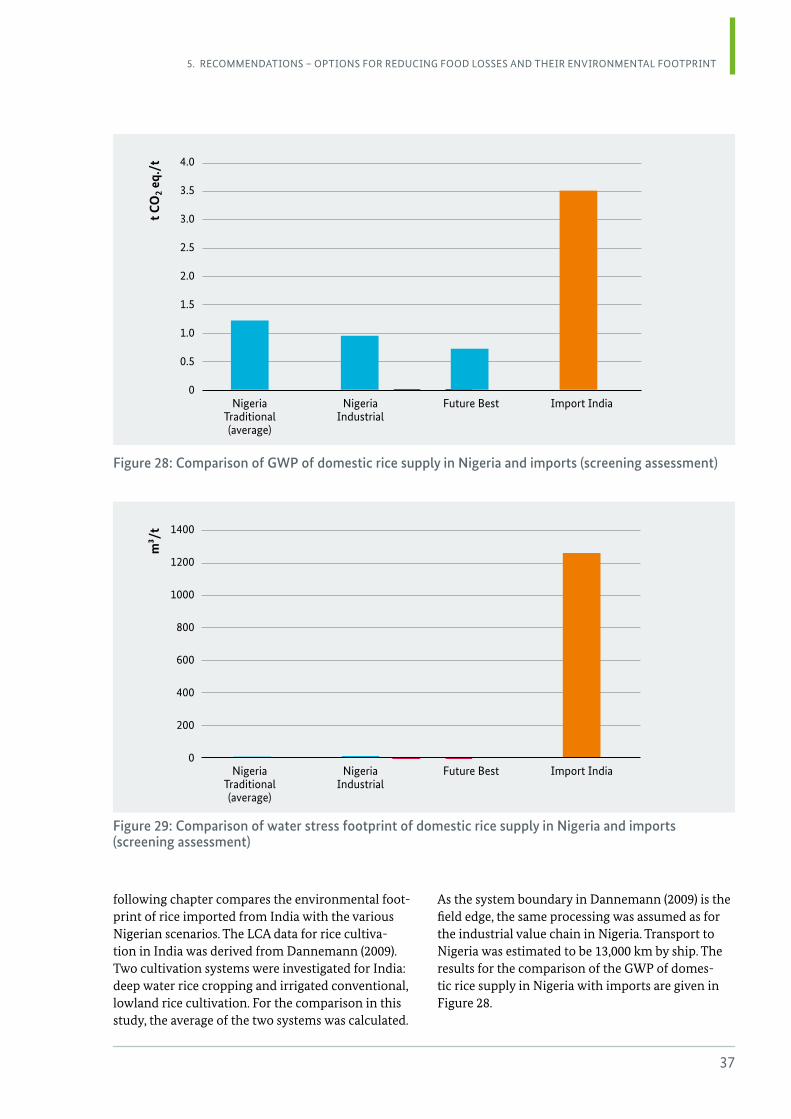
37
5. reCoMMeNDATIoNS – oPTIoNS for reDuCINg fooD LoSSeS AND THeIr eNVIroNMeNTAL fooTPrINT
following chapter compares the environmental foot-print of rice imported from India with the various Nigerian scenarios. The LCA data for rice cultiva-tion in India was derived from Dannemann (2009). Two cultivation systems were investigated for India: deep water rice cropping and irrigated conventional, lowland rice cultivation. For the comparison in this study, the average of the two systems was calculated.
As the system boundary in Dannemann (2009) is the field edge, the same processing was assumed as for the industrial value chain in Nigeria. Transport to Nigeria was estimated to be 13,000 km by ship. The results for the comparison of the GWP of domes-tic rice supply in Nigeria with imports are given in Figure 28.
Nigeria Traditional (average)
Nigeria Industrial
future Best Import India
t CO
2 eq .
/t
Figure 28: Comparison of GWP of domestic rice supply in Nigeria and imports (screening assessment)
4.0
3.5
3.0
2.5
2.0
1.5
1.0
0.5
0
Figure 29: Comparison of water stress footprint of domestic rice supply in Nigeria and imports (screening assessment)
m³/
t 1400
1200
1000
800
600
400
200
0Nigeria
Traditional (average)
Nigeria Industrial
future Best Import India
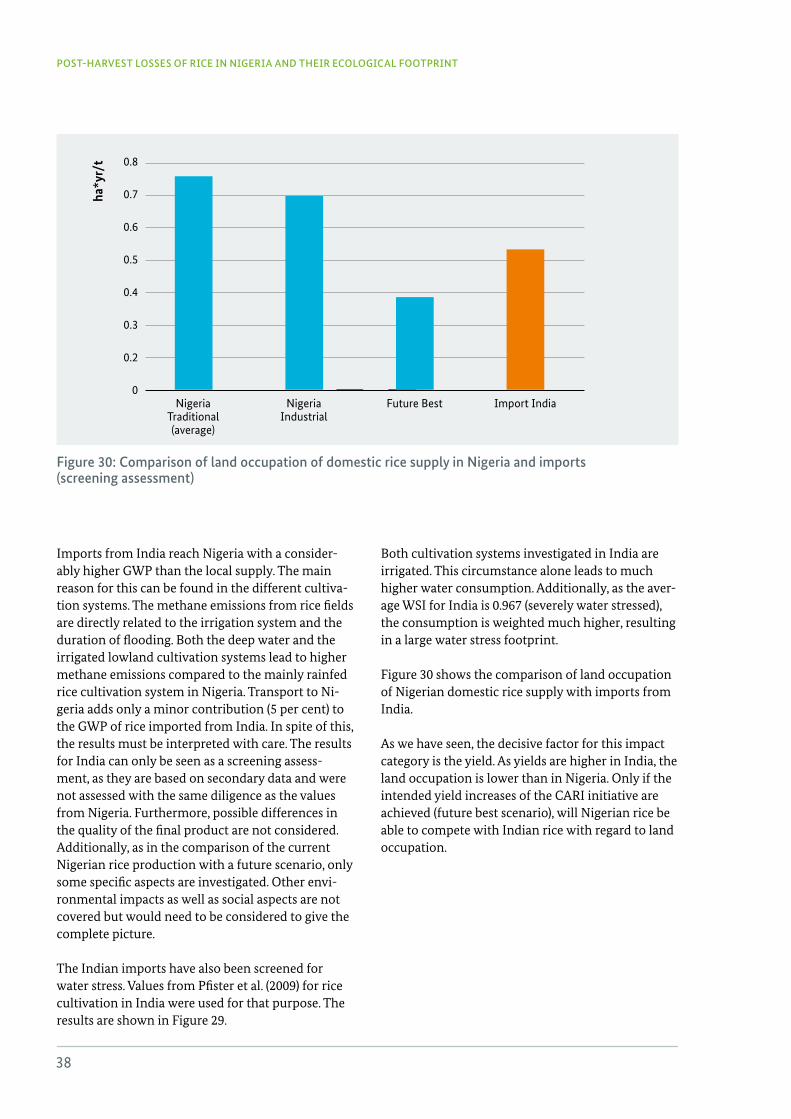
38
POST-HARVEST LOSSES OF RICE IN NIGERIA AND THEIR ECOLOGICAL FOOTPRINT
Nigeria Traditional (average)
Nigeria Industrial
future Best Import India
ha*y
r/t
Figure 30: Comparison of land occupation of domestic rice supply in Nigeria and imports (screening assessment)
0.8
0.7
0.6
0.5
0.4
0.3
0.2
0
Imports from India reach Nigeria with a consider-ably higher GWP than the local supply. The main reason for this can be found in the different cultiva-tion systems. The methane emissions from rice fields are directly related to the irrigation system and the duration of flooding. Both the deep water and the irrigated lowland cultivation systems lead to higher methane emissions compared to the mainly rainfed rice cultivation system in Nigeria. Transport to Ni-geria adds only a minor contribution (5 per cent) to the GWP of rice imported from India. In spite of this, the results must be interpreted with care. The results for India can only be seen as a screening assess-ment, as they are based on secondary data and were not assessed with the same diligence as the values from Nigeria. Furthermore, possible differences in the quality of the final product are not considered. Additionally, as in the comparison of the current Nigerian rice production with a future scenario, only some specific aspects are investigated. Other envi-ronmental impacts as well as social aspects are not covered but would need to be considered to give the complete picture.
The Indian imports have also been screened for water stress. Values from Pfister et al. (2009) for rice cultivation in India were used for that purpose. The results are shown in Figure 29.
Both cultivation systems investigated in India are irrigated. This circumstance alone leads to much higher water consumption. Additionally, as the aver-age WSI for India is 0.967 (severely water stressed), the consumption is weighted much higher, resulting in a large water stress footprint.
Figure 30 shows the comparison of land occupation of Nigerian domestic rice supply with imports from India.
As we have seen, the decisive factor for this impact category is the yield. As yields are higher in India, the land occupation is lower than in Nigeria. Only if the intended yield increases of the CARI initiative are achieved (future best scenario), will Nigerian rice be able to compete with Indian rice with regard to land occupation.
39
6. eNVIroNMeNTAL fooTPrINT of fooD LoSSeS IN NIgerIA – PuTTINg IT INTo PerSPeCTIVe
6. Environmental Footprint of Food Losses in Nigeria – Putting it into Perspective
The role of rice cultivation emissions should be put into a global perspective. Due to the methane emis-sions that occur while the rice fields are flooded, rice in general has a higher GWP than other staple crops such as maize, wheat or potatoes (on a kg or kcal ba-sis). Rice cultivation alone contributes to 1.5 per cent of global GHG emissions: about the same as that of all air transportation (WRI, 2009). This is already a clear indication that combating food losses in rice value chains can have a large beneficial impact with regard to global warming. Given that rice is the staple crop contributing most towards human nutri-tion, the importance of addressing food losses in the rice value chain becomes even clearer.
The cultivation phase is the main contributor to GWP along the rice value chain. 80 per cent of all emissions caused until the final product is made occur on the field (even 91 per cent for the industrial value chain). That means that even losses occur-ring at an early stage in the value chain have a large environmental impact. This also means that tackling the large losses occurring at this stage (harvest losses 4.4 per cent, losses during threshing and winnowing 5 per cent) can contribute significantly towards an environmental benefit as well as improving to social and economic aspects.
The main difference between the traditional and the industrial value chain lies in the emissions from parboiling. In addition, the losses are lower in the industrial processing chain because all steps are done directly one after the other in a closed system and the quality of the resulting product is higher. However, improvements could be achieved in small scale processing value chains, if losses are reduced, improved parboiling techniques like micro-gasifiers are used, and processing steps that improve quality (e.g. de-stoning) are applied, which are also available on a smaller scale.
Looking at the GWP of the complete rice value chain, it can be seen that the food losses investigated in this study do indeed have a large environmental footprint. The GHG emissions into the atmosphere from losses in the rice value chain amount to around 0.65 million tonnes of CO2 eq. per year. According to the World Bank (2013), the per capita emissions in Nigeria are 0.5 tonnes of CO2 eq. per person and year. That would mean that the food losses in the rice value chain equal the emissions of more than one million Nigerians. Or, put differently, the emis-sions of around 430,000 cars in one year (7 litres of gasoline per km, 10,000 km per year). That also means that if it were possible to halve losses along the value chain, this would have the same effect as taking 215,000 cars off the roads for one year (with regard to GHG emissions). Building on data from the World Bank (2013), this would mean a reduction of 0.4 per cent of all GHG emissions in Nigeria. Al-though national GHG inventories have to be inter-preted with care (with regard to system boundaries and assumptions), this means that reducing food losses along the rice value chain as well as increas-ing productivity in rice cultivation will contribute significantly to reducing GHG emissions in Nigeria. This conclusion is strengthened when considering that the rice currently imported from India is very likely to have much larger GWP than rice domesti-cally produced in Nigeria.
Another environmental aspect considered in this study is water. Putting water use into perspective is complex. At the moment there is an ongoing debate in the LCA community on how to relate water con-sumption to human health, environmental health or resource depletion. The cause-effect chains are highly complex and very hard to express in numbers. Thus, no direct connection to these endpoints can be given in this report. To put the order of magnitude into perspective, we may use UNESCO’s figure of 50 litres of water or 19 m3 per person and day re-quired to ensure their basic needs for drinking, cook-
40
POST-HARVEST LOSSES OF RICE IN NIGERIA AND THEIR ECOLOGICAL FOOTPRINT
ing and cleaning (WWAP, 2009). The losses along the rice value chain account for a water stress footprint of 2.1 million m³ (the term refers to water that is lost for further uses). That means that the amount of water wasted with the losses could have poten-tially served around 110,000 people. Nevertheless, as rice cultivation is still mainly rainfed in the regions under investigation, and because these regions are characterised by a low WSI (Pfister et al., 2009), water does not appear as an environmental hotspot in the rice value chain in Nigeria. On the contrary, when the water stress footprint of rice in Nigeria is compared to the equivalent from India, the observa-tion about the advantage of locally produced rice is further confirmed.
Land occupation is easier to set into perspective. In Nigeria around 2.7 million hectares are planted with rice in 2012 (FAOSTAT, 2014). The land required to grow the rice lost along the value chain amounts to 0.5 million ha. That means that land occupation through losses accounts for 19 per cent of cultivated area. Given the large variation between different years and possible discrepancies between area culti-vated, yield, losses and production quantity within the values reported in FAOSTAT (2014) and in this study, the value corresponds neatly to the reported losses (20 per cent across the entire value chain).
The previous study on the environmental footprint of PHL in the cassava and maize value chain revealed that PHL in these value chains emit around 2.3 mil-lion tonnes of CO2 eq. into the atmosphere and cause the deprivation of 2.8 million m³ of water12. The land occupied to produce the amount of rice lost along the value chain amounts to 1.7 million ha, i.e. losses account for 21 per cent of the area cultivated with maize and cassava. The production quantities in Ni-geria of maize and cassava are still much higher than that of rice. Therefore, it comes as no surprise that the aggregated impacts of the PHL of these products are higher than for rice. Nevertheless, the environ-mental impacts of PHL of rice are within the same order of magnitude for some environmental impact categories.
12 Note that water deprivation was used in the previous study (gIZ, 2013). Due to the latest developments in methodology, the water stress footprint is used in this study, where water deprivation is divided by the global water stress index (see Annex A). The water stress footprint of the previous study would be 4.6 million m³.
Reducing food losses is an important measure in order to lessen the environmental impact along the rice value chain in Nigeria, but unlike other meas-ures it is also vital for an improved food security in Nigeria.

41
42
POST-HARVEST LOSSES OF RICE IN NIGERIA AND THEIR ECOLOGICAL FOOTPRINT
7. References
AKAgI eT AL 2011 Akagi, S.K., yokelson, r.J., Wiedinmyer, C., Alvarado, M.J., reid, J.S., Karl, T., Crounse, J.D., Wenn-berg, P.o. (2011): emission factors for open and domestic biomass burning for use in atmospheric models. Atmos. Chem. Phys., 11, 4039–4072. retrieved from urL: www.atmos-chem-phys.net/11/4039/2011/ doi:10.5194/acp-11-4039-2011
BAKArI eT AL. 2010 Bakari, M., Ngadi, M., Kok, r., raghavan, V., Diagne, A. (2010): energy analysis for small- and me-dium-scale rural rice parboiling in sub-Saharan Africa, Second Africa rice Congress, Bamako, Mali, 22–26 March 2010: Innovation and Partnerships to realize Africa’s rice Potential
BALASuBrAMANIAN eT AL. 2000
Balasubramanian, V., Bell, M. and Sombilla, M. (2000): yield, Profit, and Knowledge gaps in rice farming: Causes and Development of Mitigation Measures in Bridging the rice yield gap in the Asia-Pacific region. retrieved from urL: http://www.fao.org/docrep/003/x6905e/x6905e0f.htm (accessed 20-03-2014)
BAyArT eT AL. 2010 Bayart, J.B.; Bulle, C.; Koehler, A.; Margni, M.; Pfister, S.; Vince, f.; Deschenes, L. (2010): A framework for assessing off-stream freshwater use in LCA, Int J Life Cycle Assess 15, 439–453
BouLAy eT AL. 2013 Boulay, A.-M., Hoekstra, A.y. and Vionnet, S. (2013): Complementarities of Water-focused Life Cycle Assessment and Water footprint Assessment, environmental Science & Technology 47(21) pp. 11926-11927
CArI 2013 Technoserve/gIZ, Brüning, K., Boysen, u., Ayeni, J., Agamah, S.e. (2013): Competitive African rice Initiative (CArI), Country Document Nigeria
CurrAN eT AL. 2011
Curran, M., de Baan, L., Schryver, A.M.D., van Zelm, r., Hellweg, S., Koellner, T., Sonnemann, g., Hui-jbregts, A.J. (2011): Toward Meaningful end Points of Biodiversity in Life Cycle Assessment, environ-mental Science & Technology, Vol. 45, 70-79
DANNeNMANN 2009 Dannenmann, B. (2009): An evaluation of the environmental impacts of rice production using life cycle assessments; Master thesis, university of HohenheimAgricultural engineering in the Tropics and Subtropics
eLuHAIWe 2010 eluhaiwe, P.N. (2010): economic and financial review, Vol. 48, Number 4, CentralBank of Nigeria
eNVIfooD 2012 european food Sustainable Consumption & Production round Table: envifood Protocol – environ-mental Assessment of food and Drink Protocol. Draft Version 0.1 (November 2012)
fAo 2011 gustavsson, J., Cederberg, C., Sonesson, u. (2011): global food losses and food waste; extent, causes and prevention, Study conducted for the International Congress SAVe fooD! at Interpack 2011 Düsseldorf, germany. retrieved from urL: http://www.fao.org/docrep/014/mb060e/mb060e.pdf
fAo 2012 food Wastage footprint – Interim report fAo NrDD. retrieved from urL: http://www.fao.org/fileadmin/templates/nr/sustainability_pathways/docs/factsheet_fooD-WASTAge.pdf
POST-HARVEST LOSSES OF RICE IN NIGERIA AND THEIR ECOLOGICAL FOOTPRINT
43
7. refereNCeS
fAo 2012 food security data and definitions. retrieved from urL: http://www.fao.org/economic/ess/ess-fs/fs-data/ess-fadata/en/ (accessed 13/08/2012)
fAoSTAT 2014 fAo (2014): fAoSTAT database, food and Agriculture organization, rome, Italy, urL: http://fa-ostat.fao.org
feDerAL MINISTry of fINANCe 2014
federal Ministry of finance, Nigeria Customs Service, CeT Tariff. retrieved from urL: https://www.customs.gov.ng/hscode/resulthscode.php?HSCoDe=rice&TyPe=BoTH&MoDe=ANy&Submit2=Search (accessed 08/04/2014)
gABI 6 gaBi 6 Ssoftware-System and Database for Life Cycle engineering. Pe INTerNATIoNAL Ag, Copy-right, TM. Stuttgart, echterdingen 1992-2013
gIZ 2013 Thylmann, D., Druzhinina, e., Deimling, S., Pe INTerNATIoNAL Ag (2013): The ecological foot-print of Cassava and Maize Post-Harvest-Losses in Nigeria – A Life Cycle Assessment, Published by Deutsche gesellschaft für Internationale Zusammenarbeit (gIZ) gmbH on behalf of german federal Ministry for economic Cooperation and Development (BMZ); Division rural Development, Agricul-ture and food Security
HoeKSTrA eT AL. 2009
Hoekstra, A.y., Chapagain, A.K., Aldaya, M.M., Mekonnen, M.M. (2009): Water footprint Manual. State of the Art 2009; Water footprint Network: enschede, The Netherlands
ILCD 2011 european Commission-Joint research Centre – Institute for environment and Sustainability: International reference Life Cycle Data System (ILCD) Handbook- recommendations for Life Cycle Impact Assessment in the european context. first edition November 2011. eur 24571 eN. Luxem-bourg. Publications office of the european union; 2011
IPCC 2006 Intergovernmental Panel on Climate Change (2006): guidelines for National greenhouse gas Inven-tories. retrieved from urL: http://www.ipcc-nggip.iges.or.jp/ (accessed January 2013)
ISo 2006 ISo (2006): International Standard, ISo 14040, environmental management – life cycle assessment – principles and framework, 2006. geneva: International Standard organization
JICA 2013 Status of NrDS Implementation in Nigeria, Presentation at the fifth general Meeting ofCArD, 5-6 february 2013, Dakar, Senegal
LoNgTAu 2013 Longtau, S.r. (2013): Multi-agency partnerships in West African agriculture: a review and description of rice production systems in Nigeria, ecosystems Development organisation,
NBS 2011 National Bureau of Statistics (2011): Annual Abstract of Statistics
NBS 2012 The Nigeria Poverty Profile 2010 report of the National Bureau of StatisticsHarmonized Nigeria Living Standard Survey (HNLSS)
oguNTADe 2011 oguntade, A.e. (2011). Assessment of protection and comparative advantage in riceprocessing in Nigeria. African Journal of food, Agriculture, Nutrition and Development, Vol. 11, Number 2. retrieved from urL: http://www.ajfand.net/Volume11/No2/oguntade4400.pdf
oguNTADe 2012 reducing food Losses to Improve food Security: An Analysis of rice and rice Value Chains in Nige-ria, report delivered to the gIZ 2012
44
POST-HARVEST LOSSES OF RICE IN NIGERIA AND THEIR ECOLOGICAL FOOTPRINT
PfISTer eT AL. 2009 Pfister, S.; Koehler, A.; Hellweg, S. (2009): Assessing the environmental impact of freshwater con-sumption in LCA. environ Sci Technol 43(11), 4098–4104
roTH 2014 roth, C., Volkmer, H. (editor) (2014): Micro-gasification: cooking with gas from dry biomass, Pub-lished by the Deutsche gesellschaft für Internationale Zusammenarbeit (gIZ) gmbH, Programme ‘Poverty-oriented Basic energy Services (HerA)’
SrINoPHAKuN eT AL. 2000
Srinophakun, T., Suriyapraphadilok, u., Tia, S. (2000): Water-Wastewater Management of Tapioca rice Manufacturing using optimization Technique, ScienceAsia 26 (2000) : 57-67
uN, 1992 united Nations, 1992, Convention on Biological Diversity. urL: http://www.cbd.int/doc/legal/cbd-en.pdf
uNeP, 2005 united Nations environment Programme, 2005, Millennium ecosystem Assessment, urL: http://www.unep.org/maweb/documents/document.48.aspx.pdf
VerMeuLeN eT AL. 2012
Vermeulen, S.J., Aggarwal, P.K., Ainslie, A., Angelone, C., Campbell, B.M., Challinor, A.J., Hansen, J.W., Ingram, J.S.I., Jarvis, A., Kristjanson, P., Lau, C., Nelson, g.C., Thornton, P.K., Wollenberg, e. (2012): options for support to agriculture and food security under climate change. environmental Science and Policy 15: 136–144
WATer fooTPrINT 2014
urL: http://www.waterfootprint.org
WorLD BANK 2013 Co2 emissions (metric tonnes per capita); Carbon Dioxide Information Analysis Center, environmen-tal Sciences Division, oak ridge National Laboratory, Tennessee, united States; retrieved from urL: http://data.worldbank.org/indicator/eN.ATM.Co2e.PC (January 2013)
WrI 2009 World greenhouse gas emissions: 2005, updated version; Navigating the Numbers: greenhouse gas Data and International Climate Policy, WrI, Washington. retrieved from urL: http://www.wri.org/publication/navigating-numbers (02.05.14):
WWAP 2009 World Water Assessment Programme (2009): The united Nations World Water Development report 3: Water in a Changing World, uNeSCo, Paris and earthscan London
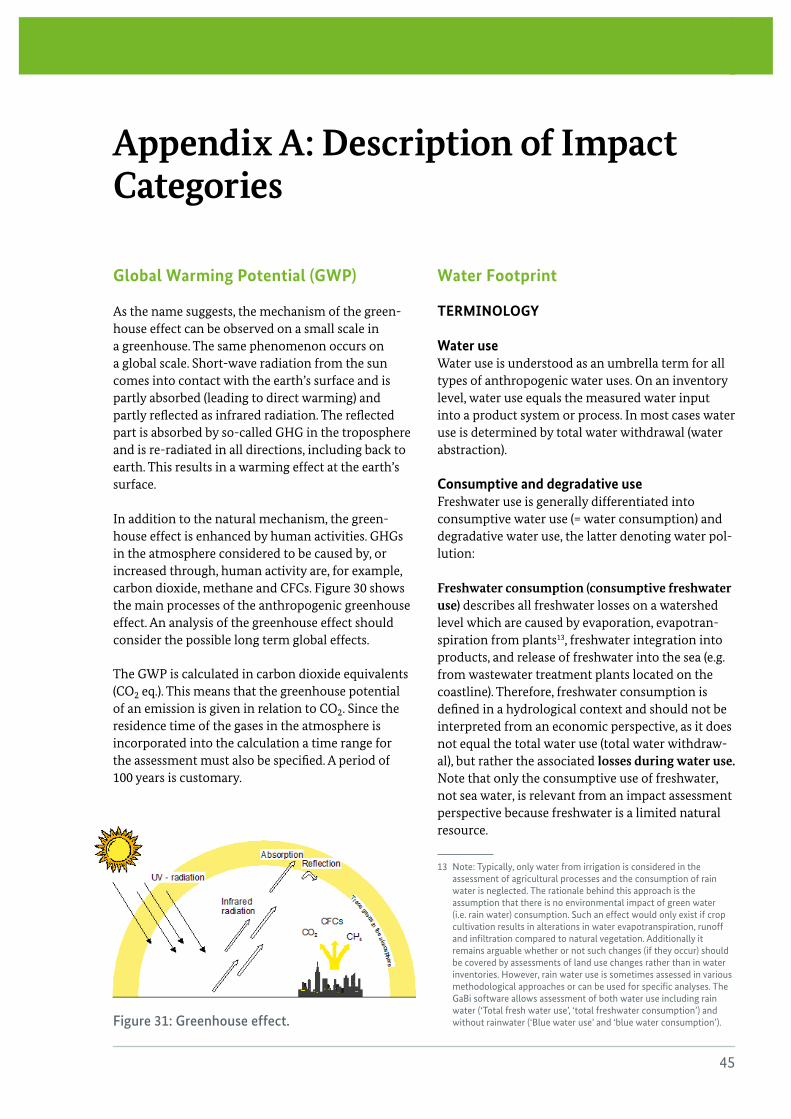
45
APPeNDIx A: DeSCrIPTIoN of IMPACT CATegorIeS
Appendix A: Description of Impact Categories
Global Warming Potential (GWP)
As the name suggests, the mechanism of the green-house effect can be observed on a small scale in a greenhouse. The same phenomenon occurs on a global scale. Short-wave radiation from the sun comes into contact with the earth’s surface and is partly absorbed (leading to direct warming) and partly reflected as infrared radiation. The reflected part is absorbed by so-called GHG in the troposphere and is re-radiated in all directions, including back to earth. This results in a warming effect at the earth’s surface.
In addition to the natural mechanism, the green-house effect is enhanced by human activities. GHGs in the atmosphere considered to be caused by, or increased through, human activity are, for example, carbon dioxide, methane and CFCs. Figure 30 shows the main processes of the anthropogenic greenhouse effect. An analysis of the greenhouse effect should consider the possible long term global effects.
Water Footprint
TERMINOLOGY
Water useWater use is understood as an umbrella term for all types of anthropogenic water uses. On an inventory level, water use equals the measured water input into a product system or process. In most cases water use is determined by total water withdrawal (water abstraction).
Consumptive and degradative useFreshwater use is generally differentiated into consumptive water use (= water consumption) and degradative water use, the latter denoting water pol-lution:
Freshwater consumption (consumptive freshwater use) describes all freshwater losses on a watershed level which are caused by evaporation, evapotran-spiration from plants13, freshwater integration into products, and release of freshwater into the sea (e.g. from wastewater treatment plants located on the coastline). Therefore, freshwater consumption is defined in a hydrological context and should not be interpreted from an economic perspective, as it does not equal the total water use (total water withdraw-al), but rather the associated losses during water use. Note that only the consumptive use of freshwater, not sea water, is relevant from an impact assessment perspective because freshwater is a limited natural resource.
13 Note: Typically, only water from irrigation is considered in the assessment of agricultural processes and the consumption of rain water is neglected. The rationale behind this approach is the assumption that there is no environmental impact of green water (i.e. rain water) consumption. Such an effect would only exist if crop cultivation results in alterations in water evapotranspiration, runoff and infiltration compared to natural vegetation. Additionally it remains arguable whether or not such changes (if they occur) should be covered by assessments of land use changes rather than in water inventories. However, rain water use is sometimes assessed in various methodological approaches or can be used for specific analyses. The gaBi software allows assessment of both water use including rain water (‘Total fresh water use’, ‘total freshwater consumption’) and without rainwater (‘Blue water use’ and ‘blue water consumption’).Figure 31: Greenhouse effect.
The GWP is calculated in carbon dioxide equivalents (CO2 eq.). This means that the greenhouse potential of an emission is given in relation to CO2. Since the residence time of the gases in the atmosphere is incorporated into the calculation a time range for the assessment must also be specified. A period of 100 years is customary.
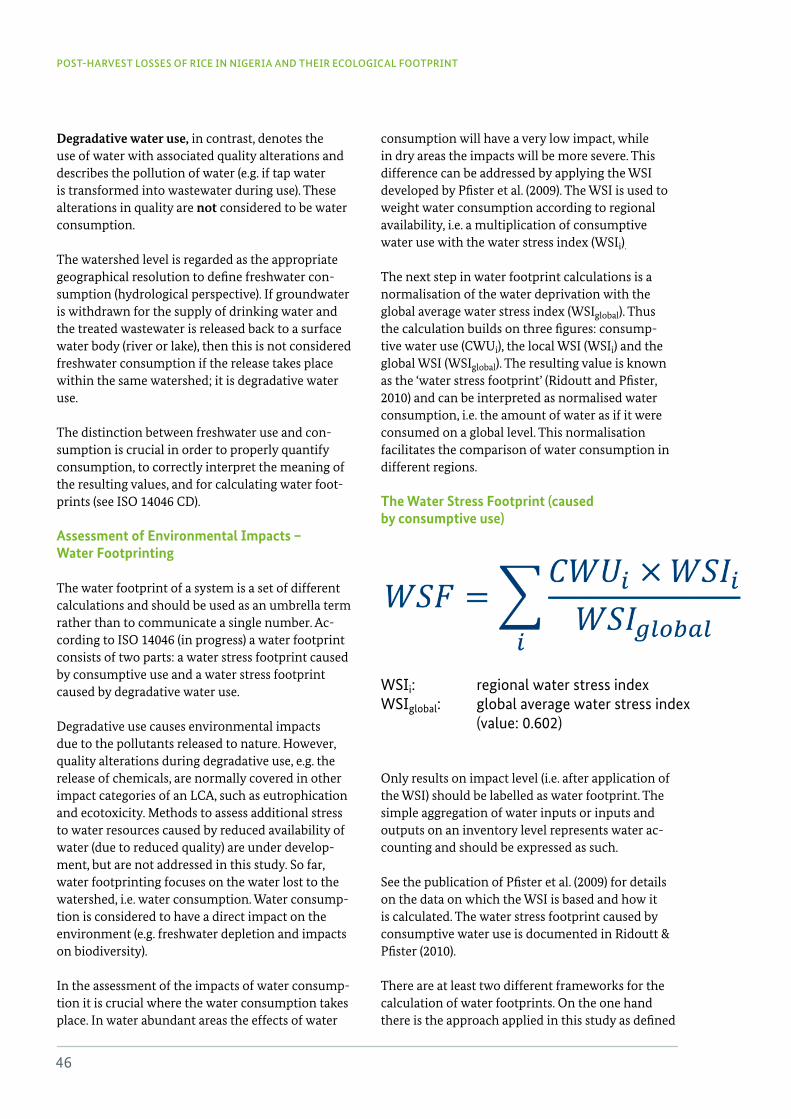
46
POST-HARVEST LOSSES OF RICE IN NIGERIA AND THEIR ECOLOGICAL FOOTPRINT
Degradative water use, in contrast, denotes the use of water with associated quality alterations and describes the pollution of water (e.g. if tap water is transformed into wastewater during use). These alterations in quality are not considered to be water consumption.
The watershed level is regarded as the appropriate geographical resolution to define freshwater con-sumption (hydrological perspective). If groundwater is withdrawn for the supply of drinking water and the treated wastewater is released back to a surface water body (river or lake), then this is not considered freshwater consumption if the release takes place within the same watershed; it is degradative water use.
The distinction between freshwater use and con-sumption is crucial in order to properly quantify consumption, to correctly interpret the meaning of the resulting values, and for calculating water foot-prints (see ISO 14046 CD).
Assessment of Environmental Impacts – Water Footprinting
The water footprint of a system is a set of different calculations and should be used as an umbrella term rather than to communicate a single number. Ac-cording to ISO 14046 (in progress) a water footprint consists of two parts: a water stress footprint caused by consumptive use and a water stress footprint caused by degradative water use.
Degradative use causes environmental impacts due to the pollutants released to nature. However, quality alterations during degradative use, e.g. the release of chemicals, are normally covered in other impact categories of an LCA, such as eutrophication and ecotoxicity. Methods to assess additional stress to water resources caused by reduced availability of water (due to reduced quality) are under develop-ment, but are not addressed in this study. So far, water footprinting focuses on the water lost to the watershed, i.e. water consumption. Water consump-tion is considered to have a direct impact on the environment (e.g. freshwater depletion and impacts on biodiversity).
In the assessment of the impacts of water consump-tion it is crucial where the water consumption takes place. In water abundant areas the effects of water
consumption will have a very low impact, while in dry areas the impacts will be more severe. This difference can be addressed by applying the WSI developed by Pfister et al. (2009). The WSI is used to weight water consumption according to regional availability, i.e. a multiplication of consumptive water use with the water stress index (WSIi).
The next step in water footprint calculations is a normalisation of the water deprivation with the global average water stress index (WSIglobal). Thus the calculation builds on three figures: consump-tive water use (CWUi), the local WSI (WSIi) and the global WSI (WSIglobal). The resulting value is known as the ‘water stress footprint’ (Ridoutt and Pfister, 2010) and can be interpreted as normalised water consumption, i.e. the amount of water as if it were consumed on a global level. This normalisation facilitates the comparison of water consumption in different regions.
The Water Stress Footprint (caused by consumptive use)
Only results on impact level (i.e. after application of the WSI) should be labelled as water footprint. The simple aggregation of water inputs or inputs and outputs on an inventory level represents water ac-counting and should be expressed as such.
See the publication of Pfister et al. (2009) for details on the data on which the WSI is based and how it is calculated. The water stress footprint caused by consumptive water use is documented in Ridoutt & Pfister (2010).
There are at least two different frameworks for the calculation of water footprints. On the one hand there is the approach applied in this study as defined
WSIi: regional water stress indexWSIglobal: global average water stress index (value: 0.602)
47
APPeNDIx A: DeSCrIPTIoN of IMPACT CATegorIeS
by the ISO, and on the other the water footprint as described by the Water Footprint Network (2014). Al-though the approaches differ they can also comple-ment one another (Boulay et al., 2013).
Biodiversity
In the United Nation’s Convention on Biological Diversity, the term ‘biodiversity’ is defined as ‘the variability among living organisms from all sources including, inter alia, terrestrial, marine and other aquatic ecosystems and the ecological complexes of which they are part; this includes diversity within species, between species and of ecosystems’. The Millennium Ecosystem Assessment, a study com-missioned by the United Nations Environmental Programme, emphasises the importance of conserv-ing biodiversity in order to ensure an environmental balance and human well-being. It identifies terres-trial and aquatic habitat change, invasive species, overexploitation of wild populations, pollution and climate change as the most important direct drivers of biodiversity loss. Methods on how to assess im-pacts on biodiversity within an LCA framework are still under development (please refer to Appendix B for further information).
48
POST-HARVEST LOSSES OF RICE IN NIGERIA AND THEIR ECOLOGICAL FOOTPRINT
Appendix B: Qualitative assessment of impact on biodiversity
This chapter is based on the qualitative assessment of the impacts of PHL of maize and cassava in Nige-ria on biodiversity (GIZ, 2013). Some specific aspects of the rice value chain are considered.
Biodiversity in the Food Supply Chain
Food production and the consumption of raw materials rely on living natural systems. The im-pacts of agriculture on biodiversity vary according to the production system, but all cultivation prac-tices intervene in the ecosystems, e.g. by converting forests into agricultural cropland, by using water, by increasing soil erosion and by emitting GHGs. At the same time the capability of many ecosystems to cope with these changes is diminishing (UNEP, 2005). Food loss is linked to biodiversity, because even if a certain amount of food is not used or consumed, its production affects the biodiversity of ecosystems without directly benefiting human society.
Impact of Food Production on Biodiversity within an LCA
For environmental impacts such as those on bio-diversity and land use the evaluation methodology in LCA is not yet fully developed. The assessment of these impacts is ‘recommended, but to be applied with caution’ (ILCD, 2011). Various approaches have been put forward. Curran et al. (2011) for instance suggest using existing LCA impact categories to as-sess the impact on biodiversity. According to Curran et al. (2011), the connection of LCA midpoint impact categories to biodiversity loss are as follows:
• Land use change – The UNEP (2005) states that in the past years, the increase in food demand has led to an intensification of cultivation systems. Both, the expansion of production areas and the production of biofuels has led to the conversion of natural or close-to-natural land use types into
managed ones. This conversion of natural habitat to human use has been the main driver of biodi-versity loss over the past decades.
• Water use – water polluted through anthropoge-nic activities not only reduces regional resource availability but also affects the functioning and diversity of water-dependent terrestrial and fresh-water ecosystems.
• Climate change – Changing temperature, preci-pitation, and seasonality are expected to cause the extinctions of a large number of species over the next century. These changes in climatic condition are in turn exacerbated by anthropogenic GHG emissions.
• Acidification and eutrophication – These issues lead to a disruption of the natural nutrient balan-ce, altering the habitat condition and the species composition in ecosystems, and are therefore responsible for a loss of biodiversity.
• Ecotoxicity – This refers to the potential of bio-logical, chemical and physical stressors to affect ecosystems. Stressors can occur in the natural environment or can be introduced to ecosystems through human activity. Their concentration can reach levels high enough to alter the natural biochemistry, physiology, behaviour and inter-actions of the living organisms that comprise an ecosystem. The use of chemicals in farming has the potential to cause ecotoxicological effects by reaching organisms through the pathways of air, water and soil.
This study covers two of the impact areas mentioned by Curran et al. (2011), water use and climate change. Before discussing the results with regard to their impact on biodiversity, the following section offers a brief outlook on ‘land use change’ – to be added as indicator for the impact on biodiversity.
POST-HARVEST LOSSES OF RICE IN NIGERIA AND THEIR ECOLOGICAL FOOTPRINT
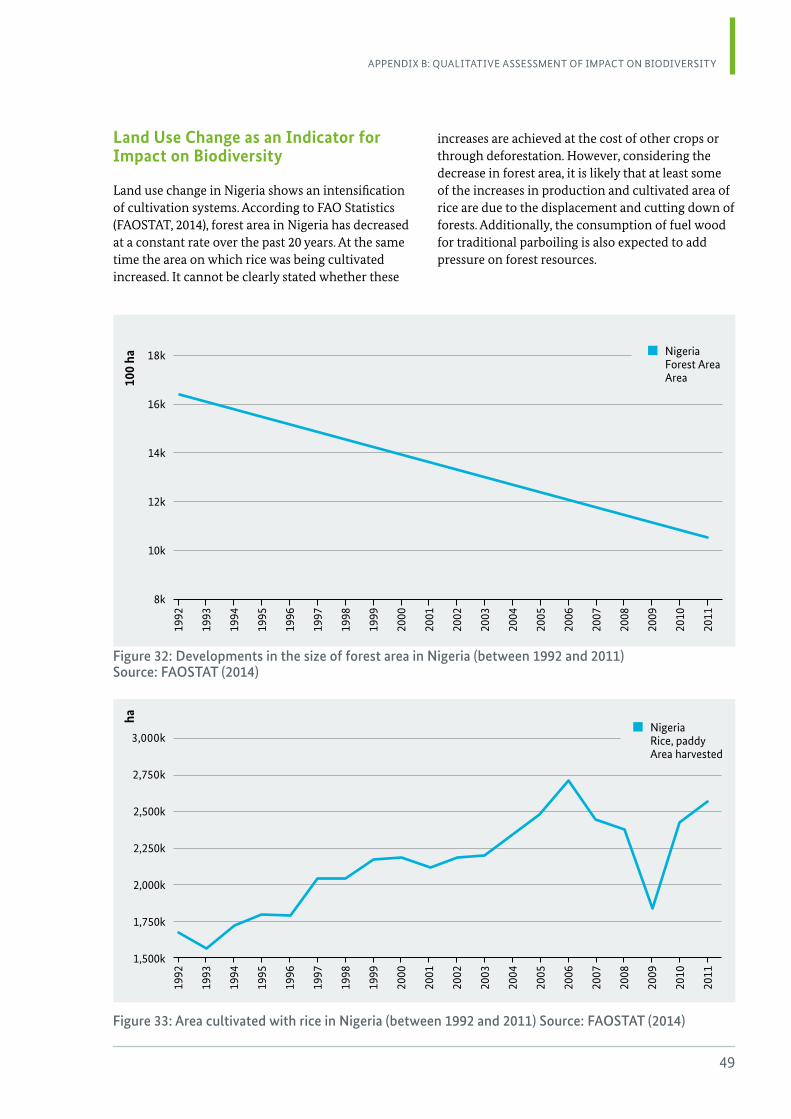
49
APPeNDIx B: QuALITATIVe ASSeSSMeNT of IMPACT oN BIoDIVerSITy
Land Use Change as an Indicator for Impact on Biodiversity
Land use change in Nigeria shows an intensification of cultivation systems. According to FAO Statistics (FAOSTAT, 2014), forest area in Nigeria has decreased at a constant rate over the past 20 years. At the same time the area on which rice was being cultivated increased. It cannot be clearly stated whether these
increases are achieved at the cost of other crops or through deforestation. However, considering the decrease in forest area, it is likely that at least some of the increases in production and cultivated area of rice are due to the displacement and cutting down of forests. Additionally, the consumption of fuel wood for traditional parboiling is also expected to add pressure on forest resources.
Figure 32: Developments in the size of forest area in Nigeria (between 1992 and 2011) Source: FAOSTAT (2014)
18k
16k
14k
12k
10k
8k
1992
1993
1994
1995
1996
1997
1998
1999
2000
2001
2002
2003
2004
2005
2006
2007
2008
2009
2010
2011
100
ha
Nigeria forest Area Area
Figure 33: Area cultivated with rice in Nigeria (between 1992 and 2011) Source: FAOSTAT (2014)
3,000k
2,750k
2,500k
2,250k
2,000k
1,750k
1,500k
1992
1993
1994
1995
1996
1997
1998
1999
2000
2001
2002
2003
2004
2005
2006
2007
2008
2009
2010
2011
ha
Nigeria rice, paddy Area harvested
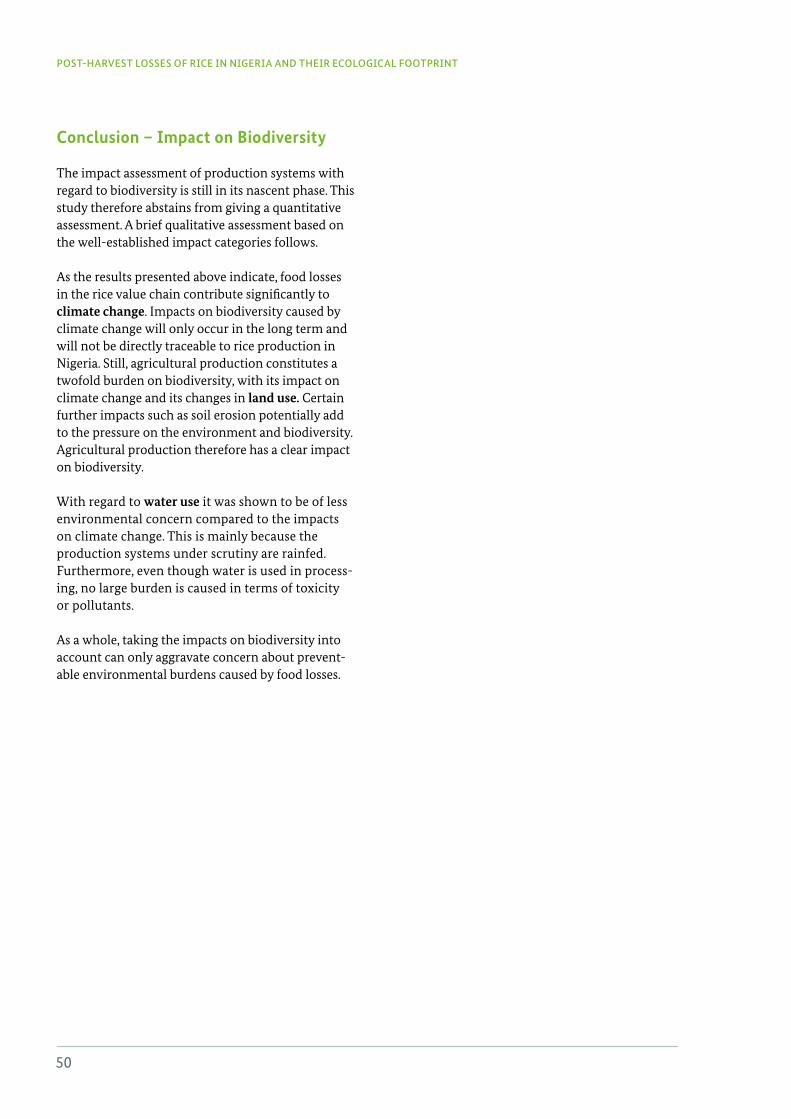
50
POST-HARVEST LOSSES OF RICE IN NIGERIA AND THEIR ECOLOGICAL FOOTPRINT
Conclusion – Impact on Biodiversity
The impact assessment of production systems with regard to biodiversity is still in its nascent phase. This study therefore abstains from giving a quantitative assessment. A brief qualitative assessment based on the well-established impact categories follows.
As the results presented above indicate, food losses in the rice value chain contribute significantly to climate change. Impacts on biodiversity caused by climate change will only occur in the long term and will not be directly traceable to rice production in Nigeria. Still, agricultural production constitutes a twofold burden on biodiversity, with its impact on climate change and its changes in land use. Certain further impacts such as soil erosion potentially add to the pressure on the environment and biodiversity. Agricultural production therefore has a clear impact on biodiversity.
With regard to water use it was shown to be of less environmental concern compared to the impacts on climate change. This is mainly because the production systems under scrutiny are rainfed. Furthermore, even though water is used in process-ing, no large burden is caused in terms of toxicity or pollutants.
As a whole, taking the impacts on biodiversity into account can only aggravate concern about prevent-able environmental burdens caused by food losses.

Published by Deutsche gesellschaft für Internationale Zusammenarbeit (gIZ) gmbH
registered offices Bonn und eschborn, germany
Sector project Sustainable Agriculture Sector project Sustainable Agriculture friedrich-ebert-Allee 40 Dag-Hammarskjöld-Weg 1-5 53113 Bonn 65760 eschborn germany germany Tel. +49 (0) 228 44 60 – 0 Tel. +49 (0) 6196 79 – 0 fax +49 (0) 228 44 60 – 1766 fax +49 (0) 6196 79 – 1115
[email protected] www.giz.de/nachhaltige-landwirtschaft
In cooperation with german food Partnership (gfP)/Competitive African rice Initiative (CArI)
Authors Dr Adegboyega eyitayo oguntade, Department of Agricultural & resource economics, federal university of Technology, Akure, Nigeria Daniel Thylmann, Dr Sabine Deimling, Pe INTerNATIoNAL Ag, Leinfelden-echterdingen, germany
editors Sigrid giencke, Agricultural Marketing Consultant, Hamburg, germany Tanja Pickardt, Lena Michler
Design and layout MediaCompany – Agentur für Kommunikation, germany
Printed by druckriegel gmbH, frankfurt, germany Printed on fSC-certified paper
Photo credits front page © gIZ/ursula Meissner; p. 14, 23 (figure 4, 10) © gIZ/Horst oebel; p. 16 (figure 5) © Adegboyega oguntade; p. 18 (figure 7) © Pe/gIZ; p. 21, 23 (figure 9, 11, 12) © gIZ/ollivier girard.
As at December 2014
gIZ is responsible for the content of this publication.
on behalf of german federal Ministry for economic Cooperation and Development (BMZ); Special unit “one World – No Hunger”
Addresses of the BMZ offices BMZ Bonn BMZ Berlin Dahlmannstraße 4 Stresemannstraße 94 53113 Bonn 10963 Berlin germany germany Tel. +49 (0) 228 99 0535 – 0 Tel. +49 (0) 30 18 535 – 0 fax +49 (0) 228 99 535 – 3500 fax +49 (0) 30 18 535 – 2501
[email protected] www.bmz.de