Embed Size (px)
Citation preview
1
Post-Hurricane Responses of Rare Plant Species and Vegetation of Pine Rocklands in the Lower Florida
Keys
Keith A. Bradley and Sonali Saha March 5, 2009
Prepared by: The Institute for Regional Conservation
22601 S.W. 152 Avenue; Miami, Florida 33170 George D. Gann, Executive Director
Submitted to: U.S. Fish and Wildlife Service
National Key Deer Refuge 28950 Watson Blvd.
Big Pine Key, FL 33043
2
INTRODUCTION
Three plant taxa which occur in pine rockland habitat on Big Pine Key, Florida are being
considered by the U.S. Fish and Wildlife Service (hereafter “Service”) as candidates for listing as
Endangered or Threatened under the U.S. Endangered Species Act. Wedge sandmat
(Chamaesyce deltoidea subsp. serpyllum; Chamaesyce deltoidea from now onwards) is endemic
to Big Pine Key. Big Pine Partridge Pea (Chamaecrista lineata var. keyensis; Chamaecrista
lineata from now onwards) is endemic to the lower Florida Keys and Sand flax (Linum
arenicola; L. arenicola from now onwards) is known from Miami-Dade County and the lower
Florida Keys. Long-term ecological changes on the island associated with fire suppression, land
clearing, sea level rise, changes in hydrology, fluxes in Key Deer densities, and invasion of
exotic pest plants may have had, and will continue to have, impacts on the population sizes of
these three taxa.
In 2005, Bradley conducted a systematic sampling on Big Pine Key to determine the
population sizes of each of these three candidate plant taxa on the island. Midway through the
field sampling, Hurricane Wilma passed Big Pine Key. The October 24, 2005 storm generated a
tidal surge which inundated much of Big Pine Key with salt water. In some places this water
impounded and sat for days. As a result, much of the vegetation in the pine rockland vegetation
was damaged. Estimates of the population sizes pre- and post-Wilma were calculated for
Chamaesyce deltoidea and Chamaecrista lineata. Each declined in the months following the
storm, by 41.2% and 48.0% respectively. No population estimate for L. arenicola could be
generated because of its rarity. In addition to population size and distribution for each species,
data were also collected on pine rockland vegetation throughout Big Pine Key. These data were
used to determine habitat preferences for each of the target plant species.
The present study was conducted to assess the impacts of Hurricane Wilma on each of
the three target plant species and pine rockland vegetation two-years after the hurricane. As an
additional goal, the study was expanded to all islands with pine rockland vegetation in the lower
Florida Keys. This expansion added Cudjoe Key, Little Pine Key, No Name Key, and Sugarloaf
Key. This expansion was included to attempt to find target plant species on those islands and to
quantify vegetation structure on each island. In addition, a new goal for the new study was to
3
include data on fire history in analyses to determine fire effects on target species and vegetation.
Specifically the present study addresses the following objectives:
1. Monitor changes in population size of the three candidate taxa two years after the
hurricane on Big Pine Key, and estimate their current population sizes. Monitor the
population sizes of candidate taxa and rare plants in the other islands of the lower keys.
2. Estimate the population size of Croton linearis, a larval food plant for two candidate
butterfly species.
3. Document the effects of the hurricane on species composition of pine rocklands
vegetation structure including pine cover, hardwood cover and palm cover.
4. Determine the effects of time since fire and fire frequency on rare plant populations and
on vegetation parameters such as species richness, percent cover of pine, hardwood and
pine rockland understory.
5. Examine the effects of fire on hurricane recovery of rare species and species richness.
6. Document the effects of the hurricane on abundance and distribution of plant exotics.
7. Describe the optimal elevation requirements for candidate taxa.
STUDY AREA
Five islands in the Florida Keys contain pine rocklands: Big Pine Key, Cudjoe Key, Little
Pine Key, No Name Key, and Sugarloaf Key. Big Pine Key, covering approximately 2,400 ha, is
the largest of the islands in the Lower Florida Keys, and contains the largest area of pine
rockland. Folk (1991) estimated that pine rockland in 1955 covered 1,049 ha, about 44% of the
island. There were no 1955 estimates of pine rockland area on the other islands, but each
historically contained much smaller amounts of the habitat than Big Pine Key.
Pine rocklands in the Florida Keys occur on Miami oolitic limestone, overlaying Key
Largo Limestone. The limestone has few soil deposits and plants grow from the few fissures that
do exist and hold soil, or from shallow deposits of sand. Plants are often in a clumped
distribution surrounded by large areas of bare open rock that do not support plant growth.
4
Following permanent human settlement which started in the middle 1800s (Simpson
1982), much pine rockland area was lost due to land clearing. In addition to land clearing for
homes and business, a complex of roads were built through the pine rocklands which destroyed
and fragmented the habitat. Additional pine rockland has probably been lost due to sea level
rise. On Upper Sugarloaf Key, Ross et al. (1994) found that approximately 58 ha of pine
rockland had been lost in the last century due to sea level rise. Similar effects have probably
occurred on all of the pine islands. Not only has sea level rise probably been a factor in
increasing salinities and forcing habitat succession, but canals and mosquito ditches through pine
rocklands have also increased inland salinities and have probably caused habitat changes
(Langevin et al. 1998).
Pine rocklands are a fire subclimax ecosystem. They require periodic fires to prevent
succession to a hardwood dominated ecosystem. Fires kill woody plant species, maintain habitat
for herbs and grasses, remove the duff layer, and recycle nutrients. Historical fire periodicity on
Big Pine Key is estimated to have been from 3-7 years (Snyder et al. 1990) to 10-20 years
(Carlson et al. 1993). Natural fires were historically started by lightning (Bergh and Wisby
1996). Following human settlement the fire regime on Big Pine Key has changed (Carlson et al.
1993; Bergh and Wisby 1996). Fires were believed to have been set by hunters to enhance
habitat for Key Deer from the 1840s to about 1950. Hunter’s fires were probably set in the
winter rather than early summer, possibly at a higher frequency than would have occurred
naturally. Around 1950, fire suppression became the standard and natural or accidental fires
were extinguished. In recent years there have been new attempts at reintroduction of fire, but
they have had limited success (Bergh and Wisby 1996).
Pine rockland now covers approximately 582 ha of the Big Pine Key, 55.5% of the
historical estimate by Folk (1991). There are 405 ha in the northern pinelands and 177 ha in the
southern pinelands. Pine rockland on Cudjoe Key covers 72 ha, Little Pine 53 ha, No Name 56
ha, and Sugarloaf 38 ha. Most of the pine rockland on each island is preserved within the
National Key Deer Refuge and properties owned by the Nature Conservancy, the State of
Florida, and Monroe County. On Big Pine Key about 478 ha are protected, 82% of the pine
rocklands on the island. The northern and southern pine rockland areas differ in amount of
protection and habitat quality. The northern areas are less dissected by roads and have burned
5
more frequently than those in the south. The southern pinelands have been extensively
fragmented by road construction. They have burned less frequently and have denser
palm/hardwood understories and deeper duff accumulations.
STUDY TAXA
Bradley (2006) described the distribution and estimated population sizes of focal species
in 2005 before Hurricane Wilma’s impact. The focal species, because they are candidates for
federal listing, are Chamaecrista lineata var. keyensis, Chamaesyce deltoidea (Engelm. ex
Chapm.) Small subsp. serpyllum (Small) D.G. Burch and Linum arenicola (Small)
H.J.P.Winkler. Additional rare taxa that were sampled include Argythamnia blodgettii,
Caesalpinia pauciflora, Catesbaea parviflora, Chamaesyce garberi, Dodonaea elaeagnoides,
Evolvulus grisebachii, Hypoxis wrightii, Pisonia rotundata, and Strumpfia maritima. In the
United States, E. grisebachii is only found on Big Pine Key. In addition, density of Croton
linearis was estimated from 2007-2008 the census as the species is a larval host plant for two
endemic butterfly species.
METHODS
Following methods described by Bradley (2006), a GIS coverage of all publicly owned
pine rockland habitat on Big Pine Key was created. This coverage was generated by intersecting
the parcels database from the Monroe County Property Appraiser with a habitat map of Big Pine
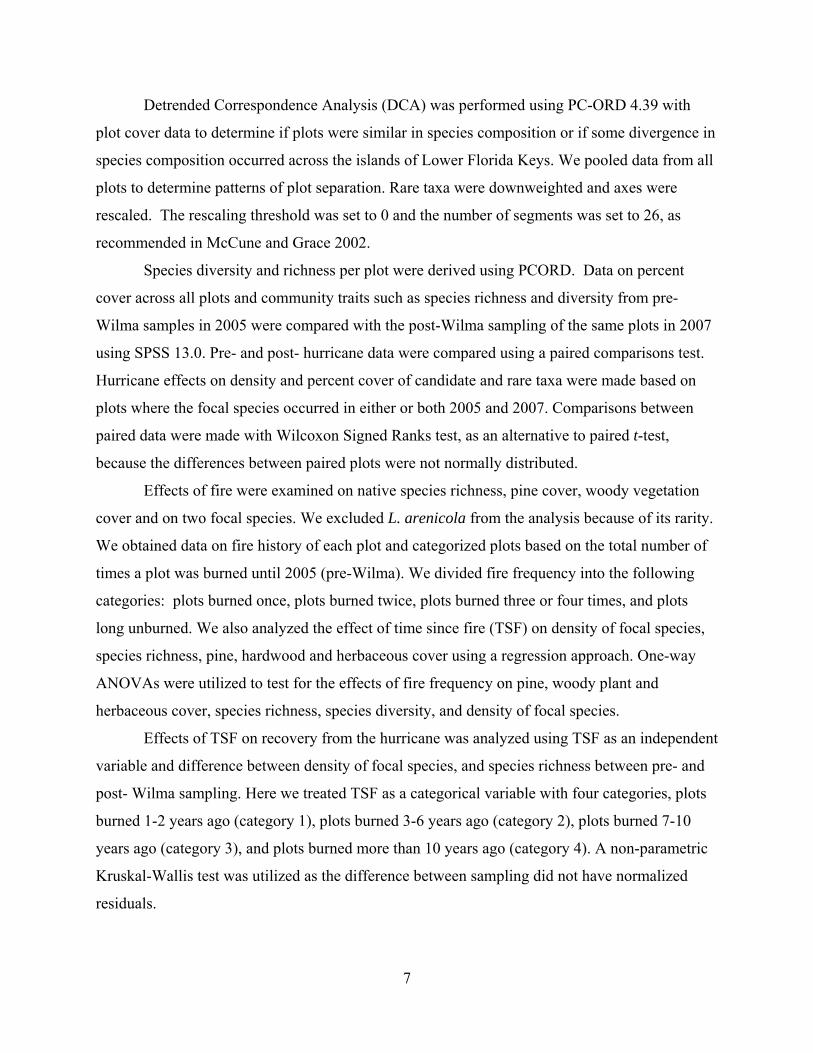
Key created by the US Army Corps of Engineers. A total of 123 sample locations were selected
and five 2.5 m radius plots were sampled at each location (Figure 1). They were not
permanently marked. A single plot was placed at the sample point, and four additional 2.5 m
radius plots were established 10 m from the point at each of the four cardinal directions. In each
circular plot the total numbers of individuals of each of the three study taxa were counted.
Individuals of other rare plant taxa were also counted. In addition, the vegetative coverage of
every plant taxon in each plot was estimated using a standardized coverage scale (<1%, 1-5%, 6-
25% 26-50%, 51-75%, 76-100%) (Daubenmire 1959).
Following the 2005 sampling where 541 plots of 2.5 m radius were sampled (297 plots
before Wilma, 244 plots after Wilma), we continued the monitoring of plots in 2007-2008 for

6
counts of study taxa, cover of each plant taxon, and percent cover of woody vegetation,
herbaceous vegetation, graminoid vegetation, and bare ground. The sampling began in October
2007 and ended a year later in October 2008 (hereafter we refer to it as 2007 sampling)(. The
sampling regime allowed us to assess the effects of Hurricane Wilma on vegetation structure and
composition two years after the hurricane had struck Florida. Plots were navigated to with a
Thales Mobile Mapper at an accuracy of <1 m. In 2007, the study was expanded to additional
islands and 80 plots (388 subplots) were added (Figure 1). In summary, a total of 929, 2.5 m
radius plots were sampled at 195 locations representing an area of 1.81 ha. Different subsets of
these data were used to answer different sets of questions.
In addition, we modified our methods to obtain realistic population density estimates of
L. arenicola. Sampling in 2005 showed L. arenicola to be extremely rare. In a sample of 541-
2.5 m radius plots, it was found in only 7 plots. Because of this low frequency, a reliable
population estimate could not be calculated. In the present study we used Adaptive Cluster
Sampling to estimate the total number of plants on Big Pine Key, following methods detailed by
Philippi (2005). L. arenicola is confined to Pine Rockland ecosystem and has a clumped
distribution. A combination of life-history parameters resulting in rarity and clumped
distribution of L. arenicola populations warranted the use of adaptive sampling in lieu of random
sampling which assumes that the probability of finding a plant is random in a given habitat.
Cluster sampling uses elements of random sampling but also leads to exhaustive sampling in the
neighborhood of the area in which a plant is encountered. While walking to sampling plots
described in the previous section, we walked approximately 17,000 m. The reliable detection
distance for L. arenicola was estimated to be approximately 3 m on each side of the observer.
STATISTICAL METHODS
SPSS 13.0 was used to generate descriptive statistics, compare means between two
sample groups, and analyze correlations. We only used data collected in 2005 and 2007 from
plots that were first sampled before the hurricane hit the island of Big Pine Key in 2005. To
determine total population sizes of each study taxa, 95% confidence intervals were calculated.
To compare mean densities of each study taxon in the northern and southern pine rocklands, and
before and after Hurricane Wilma, we used t-tests on log-transformed densities.
7
Detrended Correspondence Analysis (DCA) was performed using PC-ORD 4.39 with
plot cover data to determine if plots were similar in species composition or if some divergence in
species composition occurred across the islands of Lower Florida Keys. We pooled data from all
plots to determine patterns of plot separation. Rare taxa were downweighted and axes were
rescaled. The rescaling threshold was set to 0 and the number of segments was set to 26, as
recommended in McCune and Grace 2002.
Species diversity and richness per plot were derived using PCORD. Data on percent
cover across all plots and community traits such as species richness and diversity from pre-
Wilma samples in 2005 were compared with the post-Wilma sampling of the same plots in 2007
using SPSS 13.0. Pre- and post- hurricane data were compared using a paired comparisons test.
Hurricane effects on density and percent cover of candidate and rare taxa were made based on
plots where the focal species occurred in either or both 2005 and 2007. Comparisons between
paired data were made with Wilcoxon Signed Ranks test, as an alternative to paired t-test,
because the differences between paired plots were not normally distributed.
Effects of fire were examined on native species richness, pine cover, woody vegetation
cover and on two focal species. We excluded L. arenicola from the analysis because of its rarity.
We obtained data on fire history of each plot and categorized plots based on the total number of
times a plot was burned until 2005 (pre-Wilma). We divided fire frequency into the following
categories: plots burned once, plots burned twice, plots burned three or four times, and plots
long unburned. We also analyzed the effect of time since fire (TSF) on density of focal species,
species richness, pine, hardwood and herbaceous cover using a regression approach. One-way
ANOVAs were utilized to test for the effects of fire frequency on pine, woody plant and
herbaceous cover, species richness, species diversity, and density of focal species.
Effects of TSF on recovery from the hurricane was analyzed using TSF as an independent
variable and difference between density of focal species, and species richness between pre- and
post- Wilma sampling. Here we treated TSF as a categorical variable with four categories, plots
burned 1-2 years ago (category 1), plots burned 3-6 years ago (category 2), plots burned 7-10
years ago (category 3), and plots burned more than 10 years ago (category 4). A non-parametric
Kruskal-Wallis test was utilized as the difference between sampling did not have normalized
residuals.
8
Figure 1: Publicly owned pine rockland and location of sample locations on Big Pine Key, Florida.
9
RESULTS
OBJECTIVES 1 & 2. Monitor changes in population size of the three candidate taxa two
years after Hurricane Wilma, and estimate their total population sizes and estimate the
population size of Croton linearis, a larval food plant for two candidate butterfly species.
A total of 297 plots were sampled before Hurricane Wilma in 2005. Of those 297 plots,
285 plots were resampled in 2007. All analyses from Big Pine Key are based on the results
derived from these plots because comparisons between pre and post Wilma plots can be done on
exactly the same plots which were sampled both before and after the hurricane. Each of the four
study taxa were recorded in the plots. C. lineata var. keyensis was the most abundant species
while L. arenicola was the rarest (Table 1).
Chamaecrista lineata
Chamaecrista lineata was wide ranging on Big Pine Key where it was found in plots
nearly throughout the study area. It was recorded more frequently in the northern than the
southern pine rocklands in both 2005 and 2007. In 2005 it was recorded in 62 and 36% of all
plots in northern and southern pine rocklands respectively, while in 2007 it occurred in 26 and
2% of all plots respectively. The trend in population decline was observed for both the northern
and southern populations alike. In comparison to 1,540 plants in 297 plots in 2005, a total of 584
plants in 285 plots occurred in 2007. The mean density of Chamaecrista lineata was 5.18 plants
plot-1 in 2005 and 2.04 plants plot-1 in 2007 (Table 2).
As in 2005, the density of Chamaecrista lineata was significantly higher in northern than
the southern pine rocklands. In 2005, the pre-Wilma plots had a mean density of 5.31 ± 1.76
plants plot-1 in northern and 2.35 ± 1.25 plants plot-1 in southern plots (t-test assuming unequal
variances; t120= 2.81 P < 0.05) while in 2007 it declined to means of 2.87± 0.73 and 0.86 ± 0.47
in northern and southern pine rocklands respectively (t159= 2.03 P = 0.04).
Chamaesyce deltoidea subsp. serpyllum
The density of Chamaesyce deltoidea was lower in 2007 than in 2005. Populations in
southern pine rocklands collapsed after Hurricane Wilma. Frequency of occurrence in northern
10
and southern pine rocklands was 10 and 9% respectively in 2005, while in 2007 it was 7 and 0%
respectively. A total of 686 and 568 plants in 297 and 285 plots were found in 2007 and 2005
respectively. The overall density of Chamaesyce deltoidea was 2.30 plants plot-1 in 2005 and
1.99 plants plot-1 in 2007 (Table 2).
In 2005, the pre-Wilma plots had a mean density of 2.46 ± 0.65 plants plot-1 in northern
and 0.96 ± 0.25 plants plot-1 in southern plots with a significantly higher density in the north (t-
test assuming unequal variances; t246= 2.41 P < 0.05). In 2007 it declined to a mean of 2.11 ±
0.66 plants plot-1 and 0.93 ± 0.57 plants plot-1 in the northern and southern pine rocklands
respectively, but densities were still significantly greater in the north (t239= 2.03 P < 0.05).
Linum arenicola
Linum arenicola was found to be extremely rare. In 2005 in the northern pinelands it was
found in 10 of 245 plots (4.1% frequency) while in southern pinelands it occurred in one out of
52 plots. In 2007 it occurred in four out of 228 northern plots (2% frequency), while no plants
were recorded in the southern pinelands.
Given the rarity of this species we used adaptive cluster sampling to estimate the
population size in pine rocklands on Big Pine Key. In lieu of the traditional methods of
calculating mean densities we estimated the mean and total number of plants for the entire pine
rockland habitat by deriving the probability of finding a plant given that a total of 67 m2 area out
of 104,052 m2 sampled contained a L. arenicola plant in it.
We used the Horvitz-Thompson estimator (Philippi 2005) to find the total and mean
number of plants which is:
Where “N” is the total area of interest for which the population size is to be estimated, “v” is the
total number of neighborhoods or networks in which the plant occurs, “i” is the sampling unit, or
a plot in this case, and “ai” is the probability of inclusion, or sampling a plot that harbors L.
arenicola. Based on this analysis a total of 2,676 plants were estimated to occur in the pine
rockland habitats of the Big Pine Key, with the estimated mean density (± 1 SE) of plants being
3 ± 0.002 ha-1.
11
Croton linearis
Population estimates of Croton linearis are of interest because it is the sole larval host
plant for Bartram's scrub-hairstreak (Strymon acis) and Florida leafwing (Anaea troglodyta
floridalis) butterflies in South Florida. Croton linearis is also a nectar plant for the baracoa
skipper (Polites baracoa), Bartram's scrub-hairstreak, Florida duskywing (Ephyriades brunneus)
and other butterflies. Croton linearis was found in a total of 52 plots before the hurricane and in
57 plots after the hurricane with the mean density of 0.78 ± .02 plants plot-1 in the northern
pineland and 1.24 ± 0.06 plants plot-1 in the southern pineland (Table 2).
Estimates of total population size
Estimates of total population sizes were lower in 2007 than in 2005 for Chamaecrista
lineata and Chamaesyce deltoidea (Table 2). While the total and mean population density of L.
arenicola was greater in 2005 than 2007, its small sample size constrained any extrapolation.
Because the density of Croton linearis was recorded only in 2007, no estimates were made for
2005.
Rare plant taxa in the other islands of Lower Florida Keys
None of the candidate taxa were recorded in the plots on other islands of the Lower Keys,
although Chamaecrista lineata plants were observed on Cudjoe Key. A total of 64 Chamaesyce
garberi plants with the mean density of 0.16 ± 0.02 plants plot-1 were observed in five plots on
No Name Key and one plot on Little Pine Key. Twenty-nine plants with mean density of 0.07 ±
0.01 plants plot-1 of Caesalpinia pauciflora were counted on five plots of Cudjoe Key out of 388
plots sampled in total on the other islands of Lower Keys.
Low abundances of candidate taxa from the study plots in other islands of the Lower
Florida Keys compared to the plots in Big Pine Key may be attributed to a prevalence of high
tree cover in the Lower Keys. Species composition in the plots from the Lower Keys was
different from the pine rocklands of Big Pine Key. Pine rocklands of the Lower Keys were
dominated by woody taxa and had lower pine cover compared to plots in Big Pine Key. Figure 2
is a graphical representation of the DCA results. Plots were distributed along a gradient of
hardwood cover, represented by DCA axis I, while DCA Axis II was correlated with a gradient
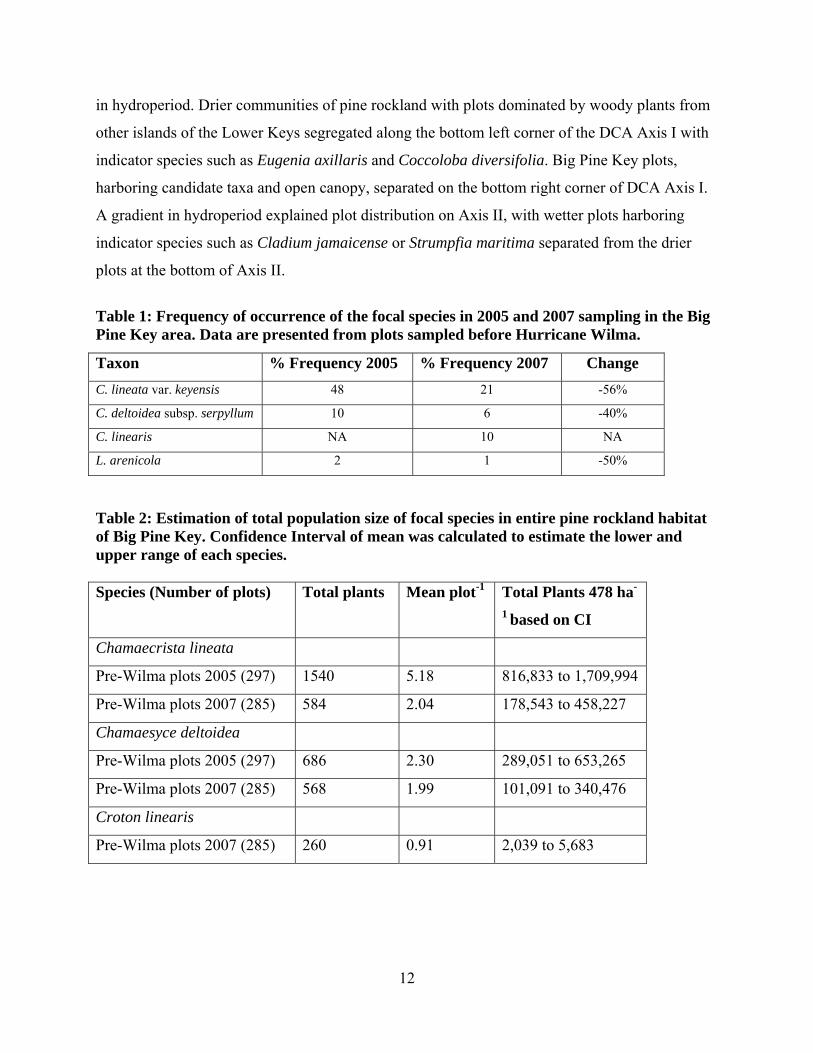
12
in hydroperiod. Drier communities of pine rockland with plots dominated by woody plants from
other islands of the Lower Keys segregated along the bottom left corner of the DCA Axis I with
indicator species such as Eugenia axillaris and Coccoloba diversifolia. Big Pine Key plots,
harboring candidate taxa and open canopy, separated on the bottom right corner of DCA Axis I.
A gradient in hydroperiod explained plot distribution on Axis II, with wetter plots harboring
indicator species such as Cladium jamaicense or Strumpfia maritima separated from the drier
plots at the bottom of Axis II.
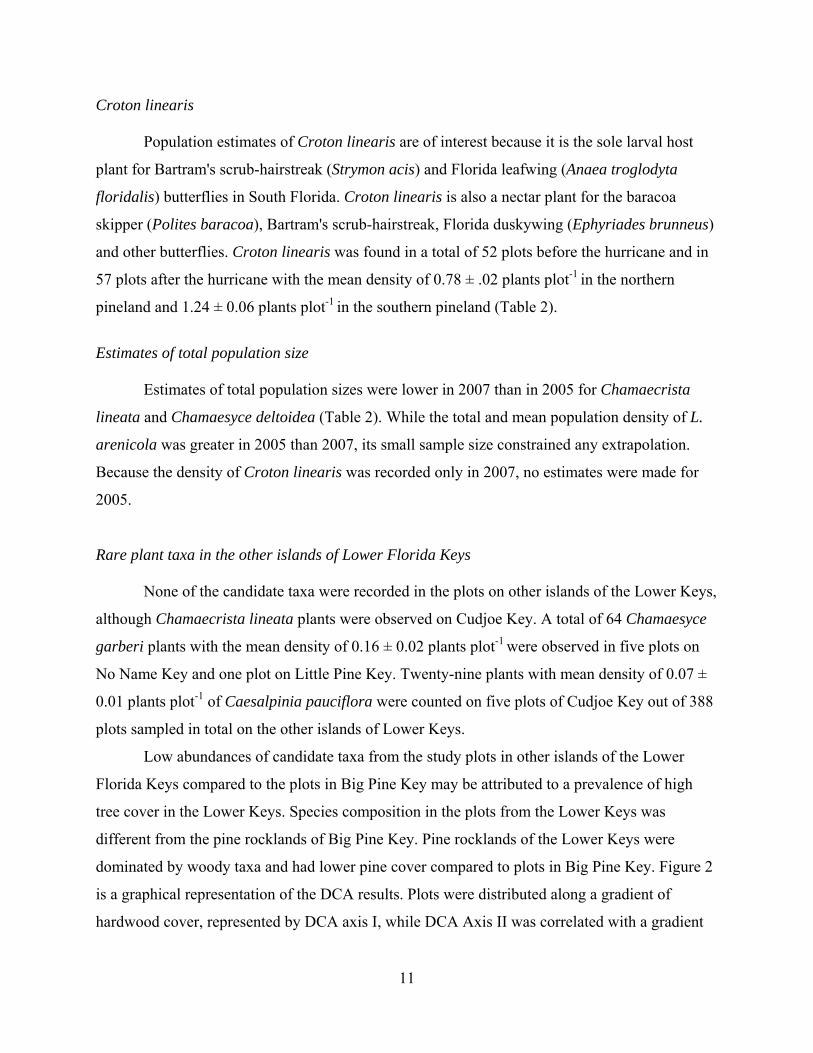
Table 1: Frequency of occurrence of the focal species in 2005 and 2007 sampling in the Big Pine Key area. Data are presented from plots sampled before Hurricane Wilma.
Table 2: Estimation of total population size of focal species in entire pine rockland habitat of Big Pine Key. Confidence Interval of mean was calculated to estimate the lower and upper range of each species. Species (Number of plots) Total plants Mean plot-1 Total Plants 478 ha-
1 based on CI
Chamaecrista lineata
Pre-Wilma plots 2005 (297) 1540 5.18 816,833 to 1,709,994
Pre-Wilma plots 2007 (285) 584 2.04 178,543 to 458,227
Chamaesyce deltoidea
Pre-Wilma plots 2005 (297) 686 2.30 289,051 to 653,265
Pre-Wilma plots 2007 (285) 568 1.99 101,091 to 340,476
Croton linearis
Pre-Wilma plots 2007 (285) 260 0.91 2,039 to 5,683
Taxon % Frequency 2005 % Frequency 2007 Change C. lineata var. keyensis 48 21 -56%
C. deltoidea subsp. serpyllum 10 6 -40%
C. linearis NA 10 NA
L. arenicola 2 1 -50%
13
Figure 2: DCA plot based on percent cover data from all plots sampled in 2007.
Pine rockland edges, wetter areas. Big Pine Key and other islands mixed Lower Keys plots
with woody taxa
Pine rocklands from Big Pine Key with candidate taxa
14
OBJECTIVE 3. Document the recovery of pine rockland vegetation, including the candidate
taxa after hurricane, and monitor hurricane effects on species composition and vegetation
structure of pine rocklands.
Only pre-Wilma plots in 2005 and the exact same plots in 2007 from Big Pine Key were
compared across years to examine the effects of hurricane on species composition. Data from all
plots were utilized to compare species richness (count of unique species per subplots) and
percent cover of common species with mean cover of greater than 1% in 2005. We used both
percent cover and density per plot of the focal species as a measure of species abundance and
expected that hurricane effects would negatively impact the abundance of focal species. Paired
comparisons were made between plots where the focal species occurred either in 2005 and or
2007. Thus the difference between paired plots were tested for hurricane effects on density and
percent cover of focal species.
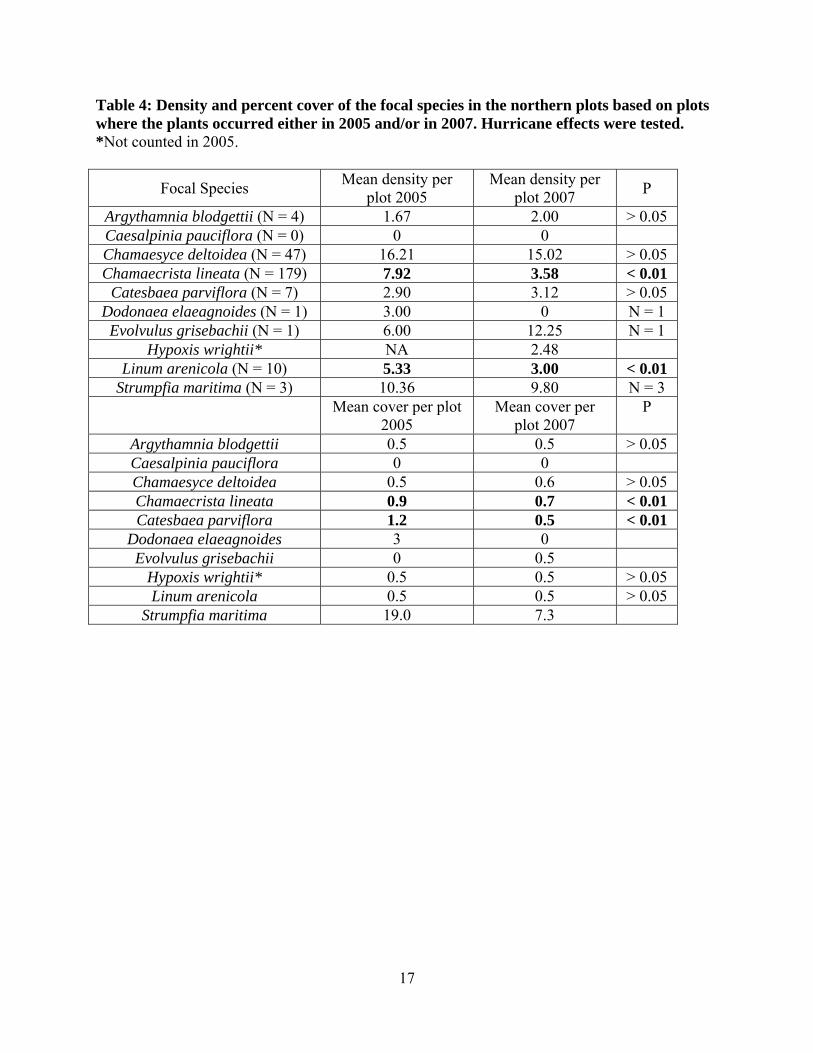
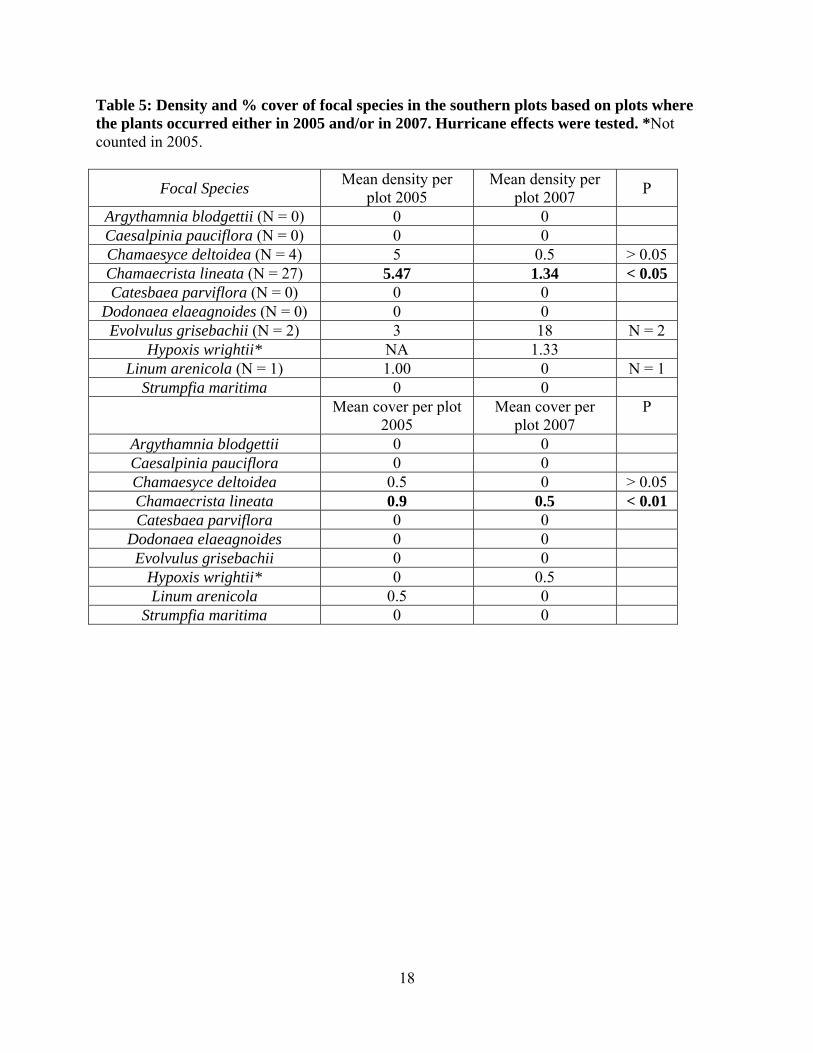
The density and percent cover of Chamaecrista lineata was significantly higher in all
plots together (Table 3), as well as separately for northern and southern plots (Tables 4 & 5), in
2005 compared to 2007. The overall density of Chamaesyce deltoidea pooled across all the study
plots was statistically similar between years (Table 3). When data from the northern and southern
plots were analyzed separately, no difference was found in Chamaesyce deltoidea abundance
before and after hurricane (Tables 4 & 5).
Rarity was definitely an underlying population dynamics trait of several of focal species,
Argythamnia blodgettii, Dodonaea elaeagnoides and Linum arenicola remained rare before and
after Hurricane Wilma and did not show a significant difference in either density or percent
cover in pooled plots or in separated northern and southern plots (Tables 4 & 5). Percent cover of
Hypoxis wrightii was higher in the southern than northern pine rocklands in 2007 than 2005,
though no counts were made in 2005 precluding a density comparison across years. Evolvulus
grisebachii showed a spike in recruitment after the hurricane, albeit in one plot only.
15
Effects of Hurricane Wilma on pine rockland vegetation composition
Species richness and diversity were negatively impacted by the hurricane with average
species richness per plot significantly greater in pre- hurricane compared to post-hurricane
sampling (16.1 ± 1.14 species plot-1 and 14.1 ± 0.89 species plot-1, P < 0.001, mean paired
difference of 2.54 ± 0.319 species plot-1) in the northern plots. The pre and post hurricane species
richness was 15.2 ± 1.4 species plot-1 and 12.1 ± 0.98 species plot-1 in the southern plots. Species
diversity was also significantly higher (2.44 ± 0.52 species plot-1) before than after the hurricane
(2.20 ± 0.12 species plot-1) in northern plots (P <0.05). Pre hurricane diversity (2.39 ± 0.21
species plot-1) in southern plots was higher than post hurricane diversity as well (2.09 ± 0.19
species plot-1).
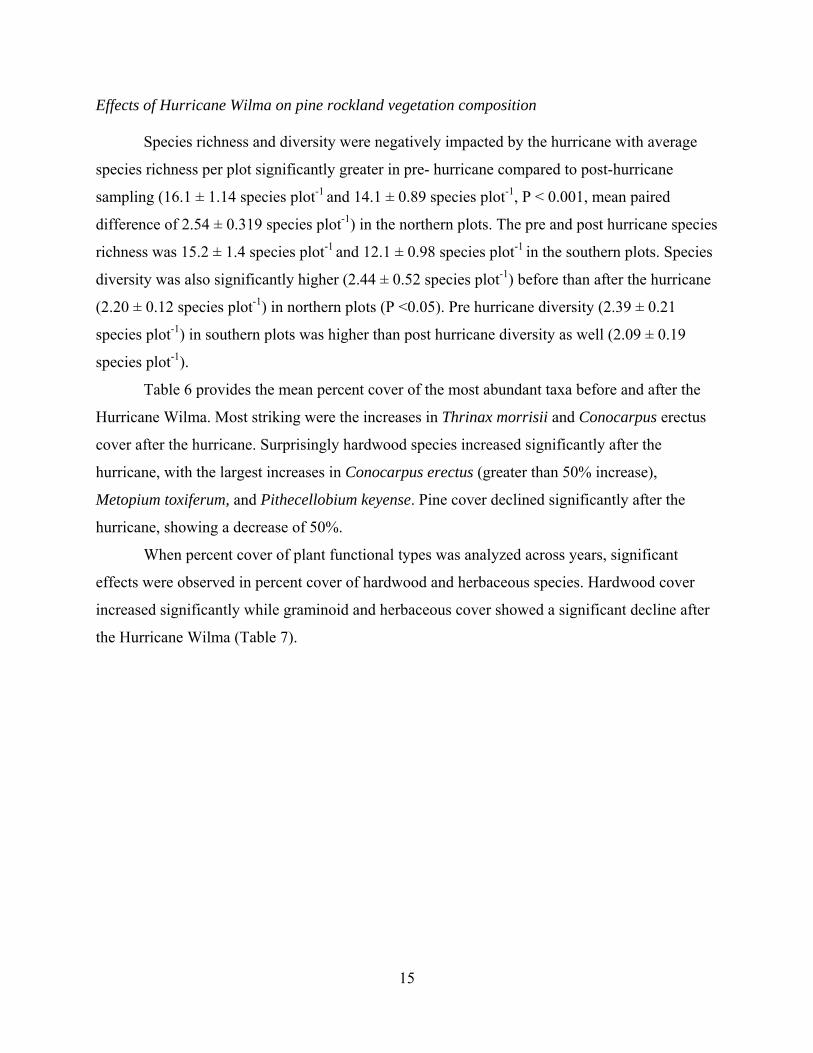
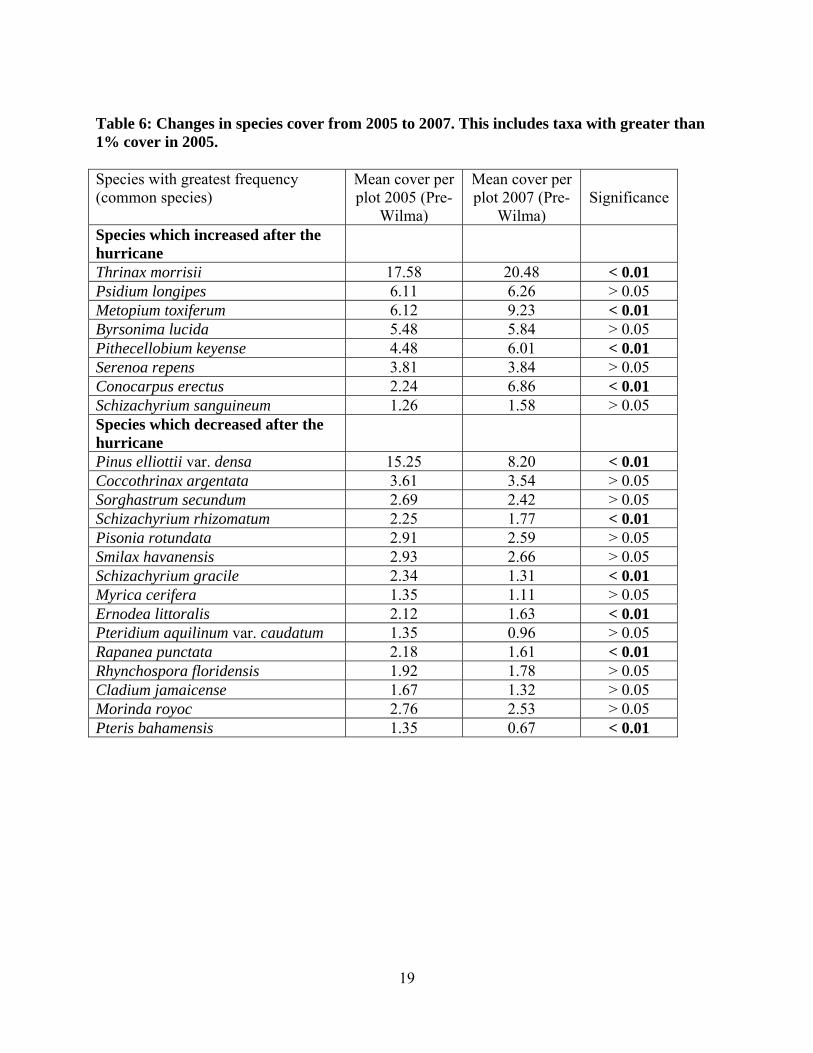
Table 6 provides the mean percent cover of the most abundant taxa before and after the
Hurricane Wilma. Most striking were the increases in Thrinax morrisii and Conocarpus erectus
cover after the hurricane. Surprisingly hardwood species increased significantly after the
hurricane, with the largest increases in Conocarpus erectus (greater than 50% increase),
Metopium toxiferum, and Pithecellobium keyense. Pine cover declined significantly after the
hurricane, showing a decrease of 50%.
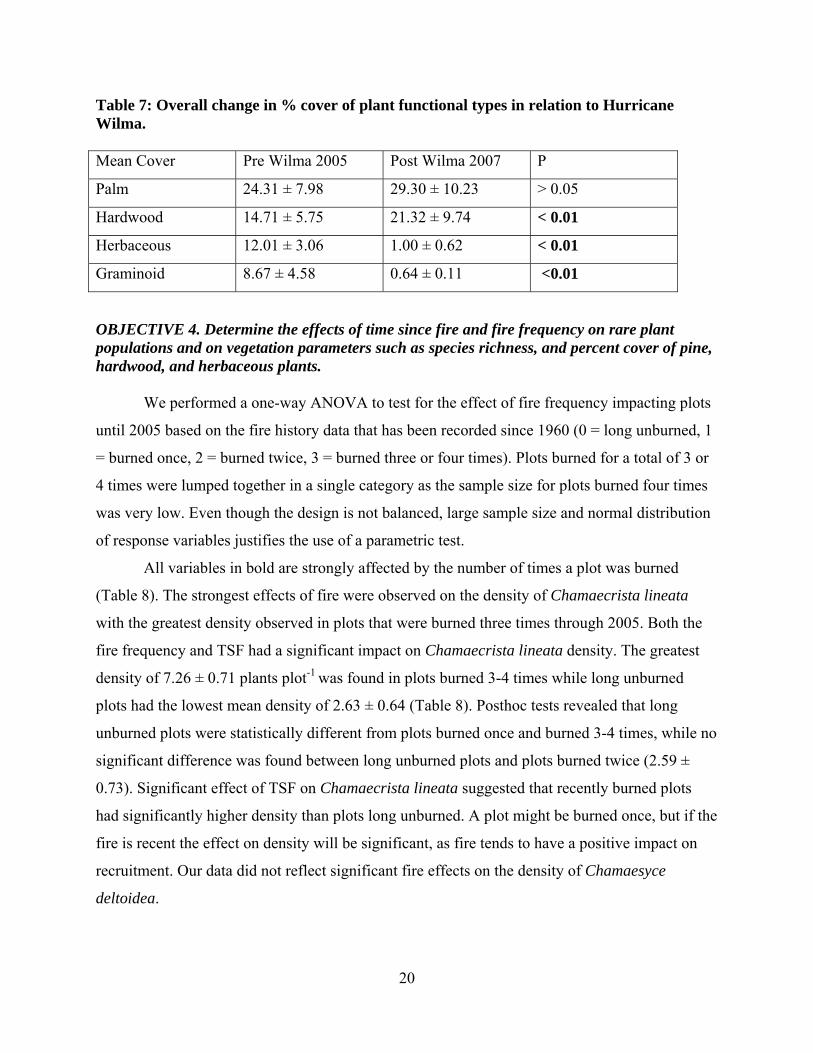
When percent cover of plant functional types was analyzed across years, significant
effects were observed in percent cover of hardwood and herbaceous species. Hardwood cover
increased significantly while graminoid and herbaceous cover showed a significant decline after
the Hurricane Wilma (Table 7).

16
Table 3: Overall changes in species density and cover of candidate and rare taxa from 2005 to 2007 based on plots where the plants occurred either in 2005 and/or in 2007. *Not counted in 2005.
Species Mean density per plot 2005
Mean density per plot 2007 P
Argythamnia blodgettii 1.25 1.5 > 0.05 Caesalpinia pauciflora 0 0 > 0.05 Catesbaea parviflora 2.28 0.71 > 0.05 Chamaecrista lineata 7.45 3.32 < 0.01 Chamaesyce deltoidea 11.45 11.23 > 0.05
Dodonaea elaeagnoides 3.00 0 > 0.05 Evolvulus grisebachii 2.25 12.33 > 0.05
Linum arenicola 3.00 1.09 > 0.05 Strumpfia maritima 16.00 13.33 > 0.05
Mean cover per plot 2005
Mean per plot 2007
P
Argythamnia blodgettii 0.05 0.052 > 0.05 Caesalpinia pauciflora 0 0 > 0.05 Catesbaea parviflora 0.10 0.05 > 0.05 Chamaecrista lineata 2.34 1.42 < 0.01 Chamaesyce deltoidea 0.54 0.31 < 0.01
Croton linearis* 0.87 0.62 = 0.05 Dodonaea elaeagnoides 0.01 0 > 0.05 Evolvulus grisebachii 0.01 0.04 N = 3
Linum arenicola 0.11 0.07 > 0.05 Strumpfia maritima 0.19 0.07 N = 3
17
Table 4: Density and percent cover of the focal species in the northern plots based on plots where the plants occurred either in 2005 and/or in 2007. Hurricane effects were tested. *Not counted in 2005.
Focal Species Mean density per plot 2005
Mean density per plot 2007 P
Argythamnia blodgettii (N = 4) 1.67 2.00 > 0.05 Caesalpinia pauciflora (N = 0) 0 0 Chamaesyce deltoidea (N = 47) 16.21 15.02 > 0.05 Chamaecrista lineata (N = 179) 7.92 3.58 < 0.01
Catesbaea parviflora (N = 7) 2.90 3.12 > 0.05 Dodonaea elaeagnoides (N = 1) 3.00 0 N = 1 Evolvulus grisebachii (N = 1) 6.00 12.25 N = 1
Hypoxis wrightii* NA 2.48 Linum arenicola (N = 10) 5.33 3.00 < 0.01
Strumpfia maritima (N = 3) 10.36 9.80 N = 3 Mean cover per plot
2005 Mean cover per
plot 2007 P
Argythamnia blodgettii 0.5 0.5 > 0.05 Caesalpinia pauciflora 0 0 Chamaesyce deltoidea 0.5 0.6 > 0.05 Chamaecrista lineata 0.9 0.7 < 0.01 Catesbaea parviflora 1.2 0.5 < 0.01
Dodonaea elaeagnoides 3 0 Evolvulus grisebachii 0 0.5
Hypoxis wrightii* 0.5 0.5 > 0.05 Linum arenicola 0.5 0.5 > 0.05
Strumpfia maritima 19.0 7.3
18
Table 5: Density and % cover of focal species in the southern plots based on plots where the plants occurred either in 2005 and/or in 2007. Hurricane effects were tested. *Not counted in 2005.
Focal Species Mean density per plot 2005
Mean density per plot 2007 P
Argythamnia blodgettii (N = 0) 0 0 Caesalpinia pauciflora (N = 0) 0 0 Chamaesyce deltoidea (N = 4) 5 0.5 > 0.05 Chamaecrista lineata (N = 27) 5.47 1.34 < 0.05 Catesbaea parviflora (N = 0) 0 0
Dodonaea elaeagnoides (N = 0) 0 0 Evolvulus grisebachii (N = 2) 3 18 N = 2
Hypoxis wrightii* NA 1.33 Linum arenicola (N = 1) 1.00 0 N = 1
Strumpfia maritima 0 0 Mean cover per plot
2005 Mean cover per
plot 2007 P
Argythamnia blodgettii 0 0 Caesalpinia pauciflora 0 0 Chamaesyce deltoidea 0.5 0 > 0.05 Chamaecrista lineata 0.9 0.5 < 0.01 Catesbaea parviflora 0 0
Dodonaea elaeagnoides 0 0 Evolvulus grisebachii 0 0
Hypoxis wrightii* 0 0.5 Linum arenicola 0.5 0
Strumpfia maritima 0 0
19
Table 6: Changes in species cover from 2005 to 2007. This includes taxa with greater than 1% cover in 2005.
Species with greatest frequency (common species)
Mean cover per plot 2005 (Pre-
Wilma)
Mean cover per plot 2007 (Pre-
Wilma) Significance
Species which increased after the hurricane
Thrinax morrisii 17.58 20.48 < 0.01 Psidium longipes 6.11 6.26 > 0.05 Metopium toxiferum 6.12 9.23 < 0.01 Byrsonima lucida 5.48 5.84 > 0.05 Pithecellobium keyense 4.48 6.01 < 0.01 Serenoa repens 3.81 3.84 > 0.05 Conocarpus erectus 2.24 6.86 < 0.01 Schizachyrium sanguineum 1.26 1.58 > 0.05 Species which decreased after the hurricane
Pinus elliottii var. densa 15.25 8.20 < 0.01 Coccothrinax argentata 3.61 3.54 > 0.05 Sorghastrum secundum 2.69 2.42 > 0.05 Schizachyrium rhizomatum 2.25 1.77 < 0.01 Pisonia rotundata 2.91 2.59 > 0.05 Smilax havanensis 2.93 2.66 > 0.05 Schizachyrium gracile 2.34 1.31 < 0.01 Myrica cerifera 1.35 1.11 > 0.05 Ernodea littoralis 2.12 1.63 < 0.01 Pteridium aquilinum var. caudatum 1.35 0.96 > 0.05 Rapanea punctata 2.18 1.61 < 0.01 Rhynchospora floridensis 1.92 1.78 > 0.05 Cladium jamaicense 1.67 1.32 > 0.05 Morinda royoc 2.76 2.53 > 0.05 Pteris bahamensis 1.35 0.67 < 0.01
20
Table 7: Overall change in % cover of plant functional types in relation to Hurricane Wilma. Mean Cover Pre Wilma 2005 Post Wilma 2007 P
Palm 24.31 ± 7.98 29.30 ± 10.23 > 0.05
Hardwood 14.71 ± 5.75 21.32 ± 9.74 < 0.01
Herbaceous 12.01 ± 3.06 1.00 ± 0.62 < 0.01
Graminoid 8.67 ± 4.58 0.64 ± 0.11 <0.01
OBJECTIVE 4. Determine the effects of time since fire and fire frequency on rare plant populations and on vegetation parameters such as species richness, and percent cover of pine, hardwood, and herbaceous plants.
We performed a one-way ANOVA to test for the effect of fire frequency impacting plots
until 2005 based on the fire history data that has been recorded since 1960 (0 = long unburned, 1
= burned once, 2 = burned twice, 3 = burned three or four times). Plots burned for a total of 3 or
4 times were lumped together in a single category as the sample size for plots burned four times
was very low. Even though the design is not balanced, large sample size and normal distribution
of response variables justifies the use of a parametric test.
All variables in bold are strongly affected by the number of times a plot was burned
(Table 8). The strongest effects of fire were observed on the density of Chamaecrista lineata
with the greatest density observed in plots that were burned three times through 2005. Both the
fire frequency and TSF had a significant impact on Chamaecrista lineata density. The greatest
density of 7.26 ± 0.71 plants plot-1 was found in plots burned 3-4 times while long unburned
plots had the lowest mean density of 2.63 ± 0.64 (Table 8). Posthoc tests revealed that long
unburned plots were statistically different from plots burned once and burned 3-4 times, while no
significant difference was found between long unburned plots and plots burned twice (2.59 ±
0.73). Significant effect of TSF on Chamaecrista lineata suggested that recently burned plots
had significantly higher density than plots long unburned. A plot might be burned once, but if the
fire is recent the effect on density will be significant, as fire tends to have a positive impact on
recruitment. Our data did not reflect significant fire effects on the density of Chamaesyce
deltoidea.
21
A significant effect of fire frequency was observed on pine and hardwood cover. The
pine and hardwood cover were significantly lower in plots burned multiple times than the plots
that were burned once or not burned at all (Table 8). Multiple comparisons using Bonferroni
posthoc tests revealed that both pine and hardwood cover were significantly lower in all other
categories of fire frequency compared to plots burned 0-2 times (pine cover of 8.01 ± 1.81 in
plots burned 3-4 times compared to the mean cover of 15.6 % in other categories, hardwood
cover of 36.94 ± 3.07 in plots burned 3-4 times compared to the mean cover of 66.34 ± 3.61 in
all other categories; P < 0.01). Time since fire did not have a significant effect on pine cover
suggesting that no matter how recent the fire is a significant reduction in pine cover occurs only
if an area is burned multiple times. Hardwood cover was significantly impacted by TSF with
hardwood cover showing a positive linear increase with increasing TSF (r2 = 0.18, P < 0.05).
Palm cover on the other hand did not show a significant effect of fire frequency or of TSF. It
ranged from 23% in plots burned twice to 31% in plots burned 3-4 times ((Table 8).
Pine rockland understory was significantly impacted by fire frequency and by TSF.
Specifically, grass cover was significantly lower (6.32 ± 1.45) in plots long unburned compared
to plots burned 3-4 times (17 ± 2.14). Time since fire had a significant linear impact on grass
cover with grass cover declining significantly with increasing TSF (r2 = 0.13, p < 0.01) showing
greatest herbaceous cover compared to the areas long unburned or burned repeatedly (fire
frequency of 3-4 times; Table 8). Time since fire did not have a significant effect on herbaceous
cover suggesting that cumulative effects of fire were more important than time since fire.
Herbaceous but non-graminoid component of pine understory was significantly impacted by fire
frequency with greatest herbaceous plant cover occurring in plots burned more frequently than in
plots burned less frequently, however no TSF effect was found on herbaceous plant cover.
Fire had a significant effect on native species richness. Native species richness was
greatest in plots burned 3-4 times (15 ± 2.15) and lowest in plots long unburned (13 ± 1.29),
however the posthoc tests failed to detect significant differences between combinations of fire
frequency categories (Table 8). The effect of fire frequency on native species richness could be a
spurious effect. Time since fire had no significant impact on native species richness as revealed
by the regression analysis.
We did not analyze the effect of fire frequency and TSF on candidate taxa in the other
islands of the Lower Keys because of their absence, but hardwood, pine, graminoid and palm
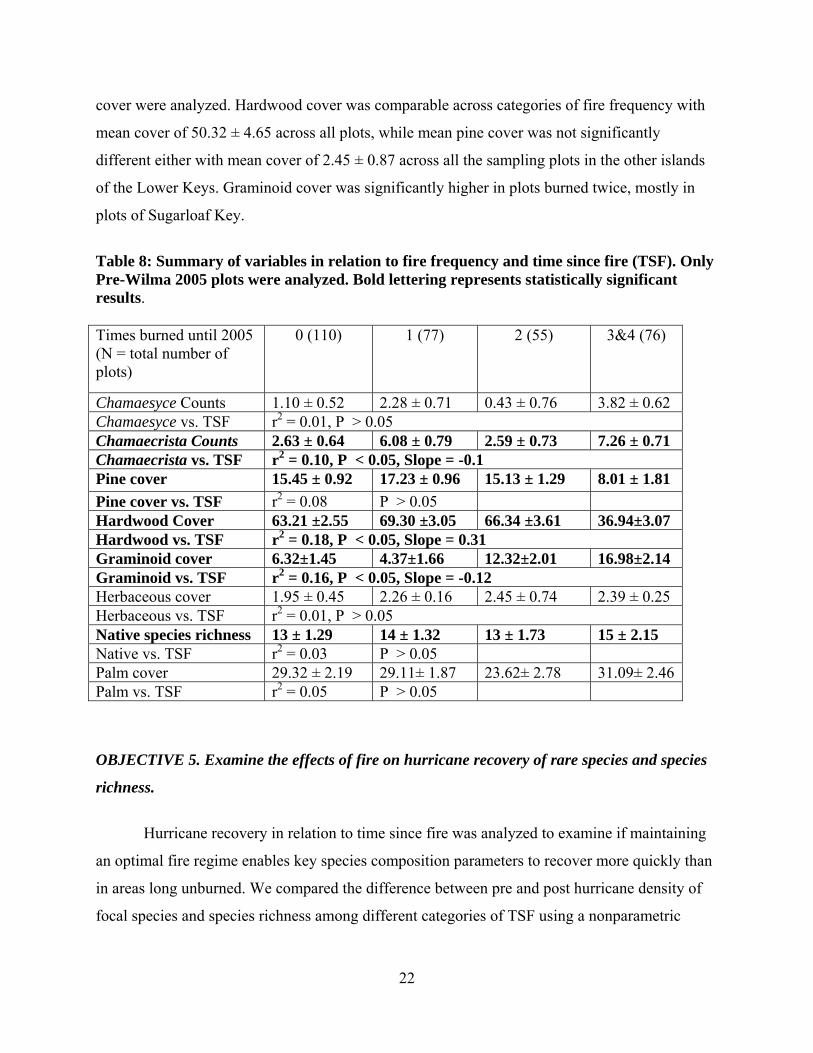
22
cover were analyzed. Hardwood cover was comparable across categories of fire frequency with
mean cover of 50.32 ± 4.65 across all plots, while mean pine cover was not significantly
different either with mean cover of 2.45 ± 0.87 across all the sampling plots in the other islands
of the Lower Keys. Graminoid cover was significantly higher in plots burned twice, mostly in
plots of Sugarloaf Key.
Table 8: Summary of variables in relation to fire frequency and time since fire (TSF). Only Pre-Wilma 2005 plots were analyzed. Bold lettering represents statistically significant results. Times burned until 2005 (N = total number of plots)
0 (110) 1 (77) 2 (55) 3&4 (76)
Chamaesyce Counts 1.10 ± 0.52 2.28 ± 0.71 0.43 ± 0.76 3.82 ± 0.62 Chamaesyce vs. TSF r2 = 0.01, P > 0.05 Chamaecrista Counts 2.63 ± 0.64 6.08 ± 0.79 2.59 ± 0.73 7.26 ± 0.71 Chamaecrista vs. TSF r2 = 0.10, P < 0.05, Slope = -0.1 Pine cover 15.45 ± 0.92 17.23 ± 0.96 15.13 ± 1.29 8.01 ± 1.81 Pine cover vs. TSF r2 = 0.08 P > 0.05 Hardwood Cover 63.21 ±2.55 69.30 ±3.05 66.34 ±3.61 36.94±3.07 Hardwood vs. TSF r2 = 0.18, P < 0.05, Slope = 0.31 Graminoid cover 6.32±1.45 4.37±1.66 12.32±2.01 16.98±2.14 Graminoid vs. TSF r2 = 0.16, P < 0.05, Slope = -0.12 Herbaceous cover 1.95 ± 0.45 2.26 ± 0.16 2.45 ± 0.74 2.39 ± 0.25 Herbaceous vs. TSF r2 = 0.01, P > 0.05 Native species richness 13 ± 1.29 14 ± 1.32 13 ± 1.73 15 ± 2.15 Native vs. TSF r2 = 0.03 P > 0.05 Palm cover 29.32 ± 2.19 29.11± 1.87 23.62± 2.78 31.09± 2.46Palm vs. TSF r2 = 0.05 P > 0.05
OBJECTIVE 5. Examine the effects of fire on hurricane recovery of rare species and species
richness.
Hurricane recovery in relation to time since fire was analyzed to examine if maintaining
an optimal fire regime enables key species composition parameters to recover more quickly than
in areas long unburned. We compared the difference between pre and post hurricane density of
focal species and species richness among different categories of TSF using a nonparametric
23
Kruskal-Wallis test. Our aim was to test if TSF has a significant positive impact on recovery of
focal species and native species richness.
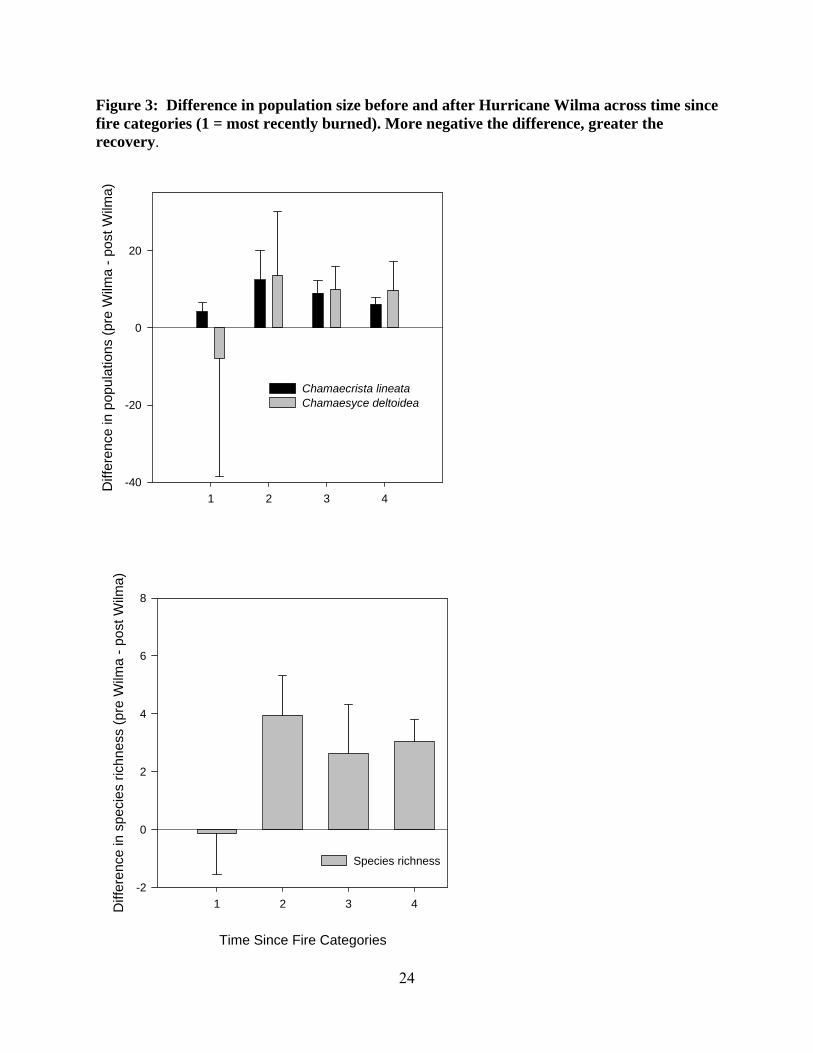
A significant effect of recent fires on species richness was detected suggesting that a
recently burned area is more likely to recover from the hurricane and resemble pre hurricane
species composition than an area long unburned (χ2 = 22.02, df = 7, P < 0.01; Figure 3).
Similarly, the post-hurricane density of Chamaecrista lineata plants in recently burned plots was
higher than plots long unburned, (χ2 = 18.76, df = 10, P < 0.05; Figure 3). No significant
differences in Chamaesyce deltoidea recovery was noticed in relation to time since fire, thus the
recruitment of Chamaesyce deltoidea after the hurricane was not influenced by time since fire.
However, the recovery rate of Chamaecrista lineata and species richness is higher in plots
recently burned than plots long unburned, suggesting that fire could be an important management
tool for successful recruitment of Chamaecrista lineata.
24
Figure 3: Difference in population size before and after Hurricane Wilma across time since fire categories (1 = most recently burned). More negative the difference, greater the recovery.
Time Since Fire Categories
1 2 3 4
Diff
eren
ce in
pop
ulat
ions
(pre
Wilm
a - p
ost W
ilma)
-40
-20
0
20
Chamaecrista lineataChamaesyce deltoidea
1 2 3 4Diff
eren
ce in
spe
cies
rich
ness
(pre
Wilm
a - p
ost W
ilma)
-2
0
2
4
6
8
Species richness
25
OBJECTIVE 6. Document the effects of Hurricane Wilma on exotic plants.
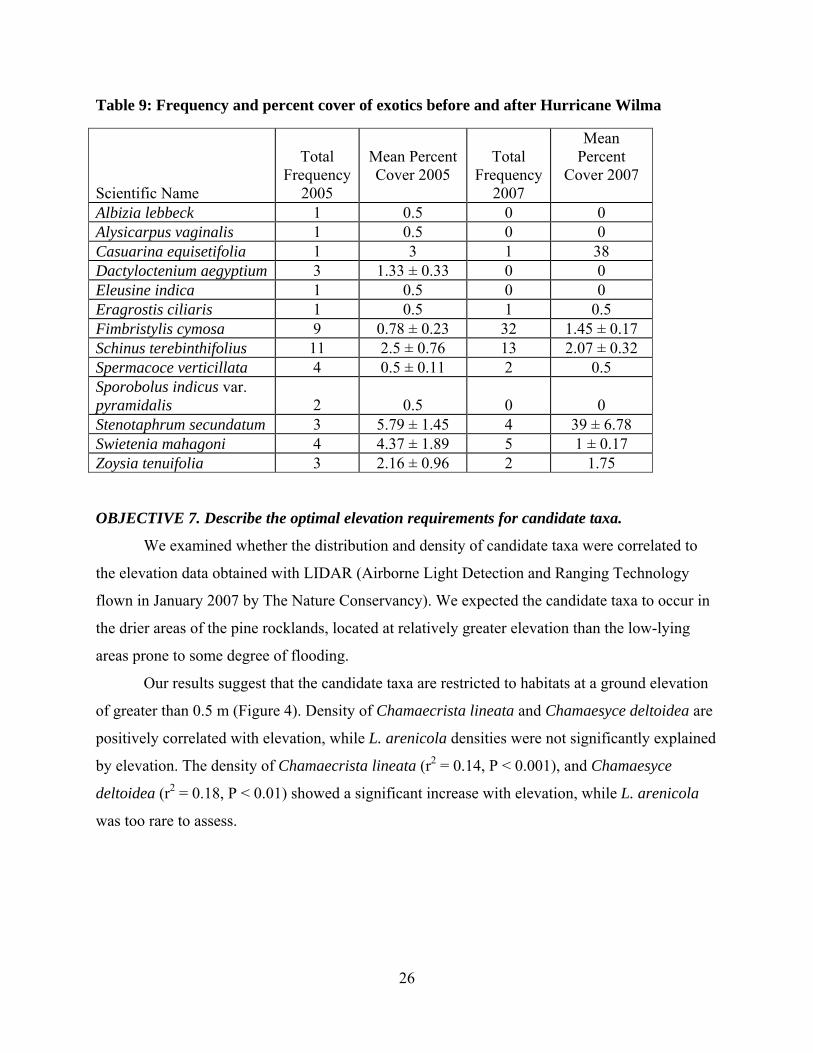
In 2005, thirteen exotic plant taxa were recorded in the study plots (Table 9). Exotic plant
taxa were found in 44 plots (15%). Most plots with exotics were in the southern pinelands. In
the southern pinelands 39 plots (49.1%) had exotics while in the northern pinelands only 5 plots
(1.9%) had exotics. The most frequent exotic was Schinus terebinthifolius which occurred in 11
plots (5.5%). Other species which occurred in five or more plots (>1%) were Fimbristylis
cymosa (3.3%), followed by Swietenia mahagoni1 (2.8%) occurring in four plots each and
Stenotaphrum secundatum (1.3%) and Dactyloctenium aegyptium (1.0%) occurring in three plots
each.
In 2007 only eight species of exotics were found in a total of 53 plots of which
Fimbristylis cymosa was the most abundant (Table 9). Mean cover of exotics with adequate
sample size for a meaningful comparison across years did not change significantly. Northern
plots, which had lower frequency of exotics species in 2005, were invaded by exotics in 2007.
For example, in 2007 Fimbristylis cymosa occurred in 26 plots in northern pine rocklands, while
in the southern pinelands only six plots had Fimbristylis cymosa. However other species
occurred with higher percent cover in southern plots for example the percent cover of Casuarina
equisetifolia and Stenotaphrum secundatum increased from 3 to 38% and 5.7 to 39 %
respectively, though the number of plots with these exotics did not change. The results suggest
that hurricanes can favor some species of exotics plants by rendering conditions for seed
germination, or by favoring the species that have the ability to sprout.
Even though the frequency of occurrence across years did not change, and the number of
exotic species decreased in 2007, the percent cover of exotics such as Casuarina equisetifolia
and Stenotaphrum secundatum had a significant impact on mean percent cover of exotics per plot
in 2007. In 2005, the exotics had a mean cover of 0.57% which increased to 0.96% in 2007.
Schinus terebinthifolius was the only exotic species recorded on other Lower Keys islands. It
occurred in four plots of Cudjoe Key with a mean percent cover of 0.5%, and in one plot of
Sugarloaf Key with 0.5% cover among all the other islands of Lower Keys.
1 Swietenia mahagoni, West Indian Mahogany is not native to the lower Florida Keys. Its historical range extended from the lower mainland south through Key Largo and Plantation Keys, and at most to Lower Matecumbe Key (Little 1978).
26
Table 9: Frequency and percent cover of exotics before and after Hurricane Wilma
OBJECTIVE 7. Describe the optimal elevation requirements for candidate taxa.
We examined whether the distribution and density of candidate taxa were correlated to
the elevation data obtained with LIDAR (Airborne Light Detection and Ranging Technology
flown in January 2007 by The Nature Conservancy). We expected the candidate taxa to occur in
the drier areas of the pine rocklands, located at relatively greater elevation than the low-lying
areas prone to some degree of flooding.
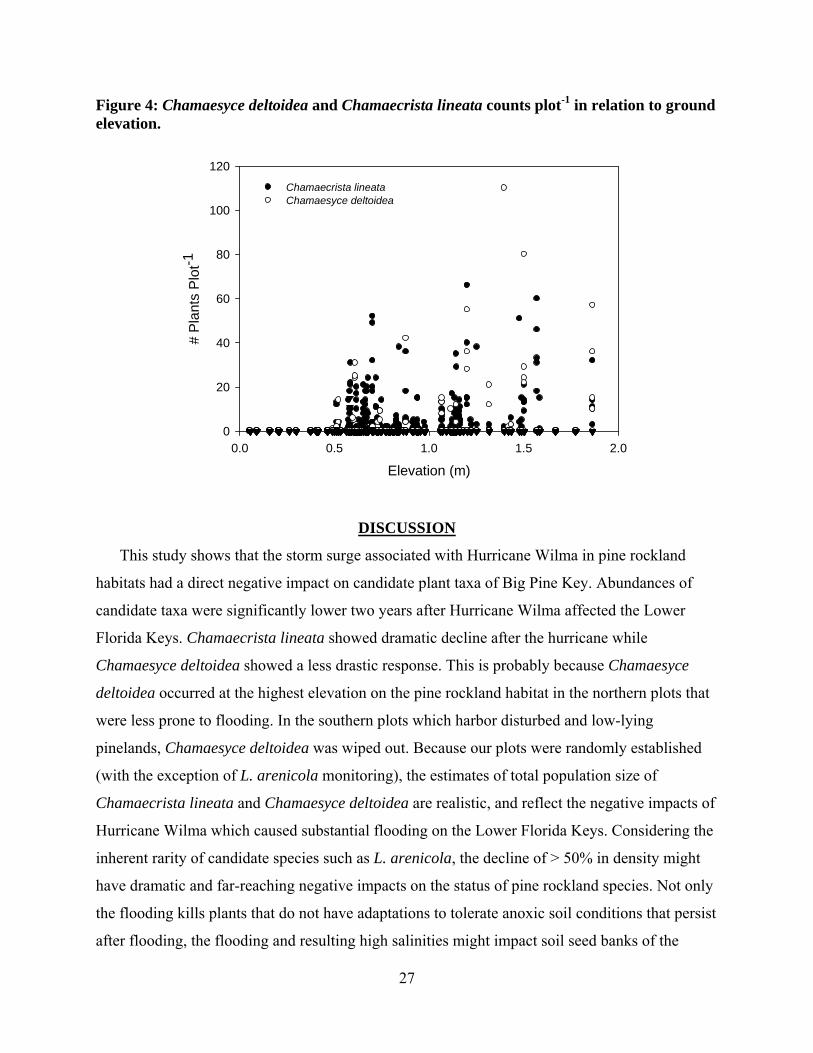
Our results suggest that the candidate taxa are restricted to habitats at a ground elevation
of greater than 0.5 m (Figure 4). Density of Chamaecrista lineata and Chamaesyce deltoidea are
positively correlated with elevation, while L. arenicola densities were not significantly explained
by elevation. The density of Chamaecrista lineata (r2 = 0.14, P < 0.001), and Chamaesyce
deltoidea (r2 = 0.18, P < 0.01) showed a significant increase with elevation, while L. arenicola
was too rare to assess.
Scientific Name
Total Frequency
2005
Mean Percent Cover 2005
Total
Frequency 2007
Mean Percent
Cover 2007
Albizia lebbeck 1 0.5 0 0 Alysicarpus vaginalis 1 0.5 0 0 Casuarina equisetifolia 1 3 1 38 Dactyloctenium aegyptium 3 1.33 ± 0.33 0 0 Eleusine indica 1 0.5 0 0 Eragrostis ciliaris 1 0.5 1 0.5 Fimbristylis cymosa 9 0.78 ± 0.23 32 1.45 ± 0.17 Schinus terebinthifolius 11 2.5 ± 0.76 13 2.07 ± 0.32 Spermacoce verticillata 4 0.5 ± 0.11 2 0.5 Sporobolus indicus var. pyramidalis 2
0.5
0
0
Stenotaphrum secundatum 3 5.79 ± 1.45 4 39 ± 6.78 Swietenia mahagoni 4 4.37 ± 1.89 5 1 ± 0.17 Zoysia tenuifolia 3 2.16 ± 0.96 2 1.75
27
Figure 4: Chamaesyce deltoidea and Chamaecrista lineata counts plot-1 in relation to ground elevation.
Elevation (m)0.0 0.5 1.0 1.5 2.0
# P
lant
s P
lot-1
0
20
40
60
80
100
120Chamaecrista lineata Chamaesyce deltoidea
DISCUSSION
This study shows that the storm surge associated with Hurricane Wilma in pine rockland
habitats had a direct negative impact on candidate plant taxa of Big Pine Key. Abundances of
candidate taxa were significantly lower two years after Hurricane Wilma affected the Lower
Florida Keys. Chamaecrista lineata showed dramatic decline after the hurricane while
Chamaesyce deltoidea showed a less drastic response. This is probably because Chamaesyce
deltoidea occurred at the highest elevation on the pine rockland habitat in the northern plots that
were less prone to flooding. In the southern plots which harbor disturbed and low-lying
pinelands, Chamaesyce deltoidea was wiped out. Because our plots were randomly established
(with the exception of L. arenicola monitoring), the estimates of total population size of
Chamaecrista lineata and Chamaesyce deltoidea are realistic, and reflect the negative impacts of
Hurricane Wilma which caused substantial flooding on the Lower Florida Keys. Considering the
inherent rarity of candidate species such as L. arenicola, the decline of > 50% in density might
have dramatic and far-reaching negative impacts on the status of pine rockland species. Not only
the flooding kills plants that do not have adaptations to tolerate anoxic soil conditions that persist
after flooding, the flooding and resulting high salinities might impact soil seed banks of the
28
candidate taxa. If the flooding is patchy the seed banks will be effective only if the health of
pine rockland habitat is maintained. Thus the anthropogenic effects causing habitat degradation,
such as fire suppression and exotic pest plant invasions should be halted to successfully conserve
the populations of candidate taxa and rare species.
The other islands of the Lower Florida Keys did not harbor sizeable populations of candidate
or rare taxa compared to Big Pine Key. Chamaesyce garberi and Caesalpinia pauciflora were
two exceptions with high counts in the other islands of the Lower Keys. Low densities of
candidate pine rockland taxa compared to Big Pine Key can be attributed to higher percent cover
of hardwoods. This is due to a fire regime characterized by few fires widely dispersed in time.
Because no clear cut fire effects were observed in the other islands of Lower Keys, hardwood
cover was similar across fire frequency and TSF, while the pine cover was very low compared to
Big Pine Key. This suggests that fire suppressed pine rockland succeeding to hammock is the
major vegetation type in the other islands of the Lower Keys with some marginal pineland
habitats, for example in parts of No Name, Sugarloaf and Little Pine keys.
Our data from 2005 strongly reflected the fragmented aspect of southern pine rocklands in
Big Pine Key. The density of candidate taxa and rare plants was lower in the southern plots
compared to northern plots, a trend that continued in 2007 as well. In addition, the decline of rare
plant taxa was greater in the southern than the northern plots. Especially noteworthy were the
declines in densities of Chamaesyce deltoidea and Chamaecrista lineata in the southern plots.
The southern plots might need a stronger management intervention if sustainable populations and
soil seed banks of candidate taxa are to be conserved and restored. The importance of soil seed
bank is reflected in the trends exhibited by Evolvulus grisebachii, which showed a spike in
recruitment after Hurricane Wilma.
Our results suggest that both fire frequency and time since fire are important parameters
affecting the abundance of candidate taxa and vegetation structure of pine rocklands. Our
assessments of fire effects are independent of the hurricane because we used data on plant
density and vegetation structure collected before Hurricane Wilma affected the Lower Keys. In
results parallel to a study by Liu et al. (2005) which showed a significant marginally negative
relationship between population growth rates of Chamaecrista lineata and TSF, the variation in
density of Chamaecrista lineata in our study plots was significantly explained by TSF (a strong
negative impact) since we had a good representation of variation in TSF. Both fire frequency and
29
TSF had a significant impact on Chamaecrista lineata with greatest density of plants occurring
in plots burned 3-4 times from 1960 until 2005. Plots that were in the category of burned 3-4
times were also recently burned, making it hard to determine the impact of fire frequency
independent of TSF. Though the densities of Chamaesyce deltoidea were greatest in plots burned
3-4 times, the effects of other fire frequency categories were less straight forward.
Vegetation structure was significantly impacted by TSF, notably the graminoid cover was
significantly higher in plots subjected to the greatest fire frequency and also the plots that were
recently burned. In contrast to graminoid cover, the cover of hardwood plants was significantly
lower in plots burned frequently than plots long unburned. While the impacts of TSF and fire
frequency were not completely independent because of the overlap of plots recently burned with
the plots in the greatest fire frequency category, the impacts of fire frequency were only
significant on the percent cover of pine, while TSF was not. Where this distinction occurred, we
inferred that not just fire but fire intensity is a significantly important factor affecting the percent
cover of a plant functional group.
Fire may be an important tool in shaping the hurricane effects on candidate taxa and
vegetation structure of pine rockland habitat. We analyzed the impact of TSF on post-hurricane
recovery by comparing if plots recently burned fared better compared to plots long unburned in
terms of vegetation recovery. Indeed, the plots burned recently showed a greater recovery of
Chamaecrista lineata and Chamaesyce deltoidea populations. It is likely that the plots burned
recently had higher plant counts before the hurricane. For example, Chamaecrista lineata, which
shows a significant effect of TSF on density recruited from existing seed banks, is likely to occur
in the vicinity of parent plants. The impact of TSF on hurricane recovery was clearly significant
for Chamaesyce deltoidea which exhibited greater rate of recovery in recently burned plots.
Since TSF did not have a significant impact on pre-Wilma density, the colonization of plots by
Chamaesyce deltoidea recruits can be attributed to recent fires that might have impacted the
suitability of habitat through hardwood removal. Thus, a fire regime maintains optimal levels of
canopy cover thereby allowing successful recruitment of candidate and rare species should be
maintained in the wake of hurricanes which eliminate the populations of candidate taxa. In areas
unevenly impacted by hurricane, fire might kill exotic species as well, and preclude the ability of
exotic species to resprout.
30
Hurricanes might increase the susceptibility pine rockland habitats to invasion, by catalyzing
species dispersal by either moving the seeds around or by soil upheaval exposing buried seeds,
and by making the space available for plant establishment as a result of massive post hurricane
plant mortality. We attribute the increase in frequency of exotic species occurrence in the
northern plots to hurricane effects. The fragmented landscape of southern pine rocklands
witnessed a dramatic increase in percent cover of exotic species such as Casuarina equisetifolia
and Stenotaphrum secundatum after Hurricane Wilma.
We conclude that increased hurricane frequency may have a devastating impact on candidate
plant taxa and on species composition in pine rocklands of the lower Florida Keys. If exotic plant
species, especially those resorting to vegetative means of reproduction are available for
colonization, hurricanes might pave the way for exotic species invasion. Our results also
emphasize the importance of maintaining a fire regime conducive to recruitment of candidate
and rare plant species through the mechanism of canopy removal. In addition, our results suggest
that fires might have a positive impact on recovery of candidate species and native species
richness, and also that fire may play an important role in catalyzing the recovery of pineland
composition and structure post-hurricane.
Acknowledgements
We would like to thank Anne Morkill of the U.S. Fish and Wildlife Service for funding
this study. Phillip Hughes of the U.S. Fish and Wildlife Service was helpful in developing the
study design and other discussions regarding the project. Field assistance was provided by Steve
Green, Mike Barry, Kate Samelson, and Lauren Brown from The Institute for Regional
Conservation. Kirsten Hines provided valuable edits to the final document.
References
Bergh, C. and J. Wisby. 1996. Fire history of lower Keys pine rocklands. The Nature Conservancy unpublished document. Key West, FL.
Bradley, K.A. 2006. Distribution and population size for three pine rockland endemic candidate
plant taxa on Big Pine Key, FL. Report submitted to U.S. Fish and Wildlife Service. Vero Beach, FL.
31
Carlson, P. R., G.W. Tanner, J.M. Wood and S.R. Humphrey. 1993. Fire in Key Deer habitat improves browse, prevents succession and preserves endemic herbs. J. Wildl. Manage. 57: 914 - 928.
Daubenmire, R.F. 1959. Canopy coverage method of vegetation analysis. Northwest Science
33:43-64. Folk, M.L. 1991. Habitat of the Key deer. Ph.D. Dissertation, Southern Illinois University,
Carbondale, Illinois. Langevin, C.D, M.T. Stewart, and C.M. Beaudoin. 1998. Effects of sea water canals on fresh
water resources: An example from Big Pine Key, Florida. Ground Water 36(3): 503-513. Little, E.L., Jr. 1978. Atlas of United States Trees, Volume 5. Florida. United States
Department of Agriculture, Miscellaneous Publication No. 1361. Washington, D.C.: United States Government Printing Office.
Liu, H., E.S. Menges, and P.F. Quintana-Ascencio. 2005. Population viability analyses of
Chamaecrista keyensis: effects of fire season and frequency. Ecol. App. 15: 210–221. McCune, B. and J.B. Grace. 2002. Analysis of Ecological Communities. Gleneden Beach, OR:
MjM Software Design. Philippi, T. 2005. Adaptive cluster sampling for estimation of abundances within local
populations of low-abundance plants. Ecology 86(5): 1091-1100. Ross, M.S., J.J. O’Brien, L.d.S.L. Sternberg. 1994. Sea Level Rise and the Reduction In Pine Forests in the Florida Keys. Ecol. App. 4(1):44-156. Simpson, L. 1982. History of Big Pine Key, Florida. Mayfield, KY: Mayfield Printing
Company.