Embed Size (px)
Citation preview

Post-M&A Operating Performance on European Markets
Bárbara da Conceiçao Lopes Monteiro
Dissertation
Master in Finance
Supervised by Professor Miguel Augusto Gomes Sousa, PhD
September, 2018
i
Abstract
The purpose of this study is to look at mergers and acquisitions (M&A) in European
countries and to examine the post-merger operating performance of acquiring companies
involved in merger activities during the period 2008-2014. This research uses the operating
performance approach, which compares the pre-merger and post-merger performance of
companies using accounting data to examine merger related gains to the acquiring firms. The
value of this study is its extension of the mergers and acquisitions performance research,
which has been conducted on mostly UK and US firms.
The results suggest that European companies are unable to use mergers and acquisi-
tion to improve their post-merger long-term performance. Even when we split the sample
by country development stage, our conclusion remains unchanged.
Post-merger operating performance changes are strongly determined by some factors.
We find that post-merger profitability of emergent and developing market acquirers is en-
hance by cash-only as a method of payment for acquisition. Moreover, merged firms’ post-
M&A cost efficiency is adversely affected when mix is the method of payment, when the
acquirer chooses a target from a different country, when the size of the firm being acquired
increases relative to the acquiring firm; and when the acquirer has high levels of pre-M&A
leverage. In turn, emergent and developing acquirers that have high pre-M&A cash reserves
and that prefer to acquire targets from the same industry experience improvements on firms’
post-merger cost efficiency. For advanced market acquirers, the positive effect of industry-
related transactions on firms’ post-merger efficiency will be higher than in emergent and
developing markets, where it is significantly positive. Regarding how corporate governance
characteristics of acquiring firms impact merger performance, we find that operating perfor-
mance outcomes are worse when the emergent and developing acquiring firm has a large
equity holder. While governance variables such as a large board, high proportion of outside
independent directors on acquirers’ board composition, and Chairman-CEO duality are ex-
pected to enhance operating performance after takeover. Regarding advanced markets, our
results show a negative effect drive by acquirers’ board be composed by a large proportion
of outside independent directors.
Key-words: corporate governance; Europe; long-term operating performance; mergers and
acquisitions; ownership structure.
JEL codes: G34
ii
Sumário
A presente dissertação examina fusões e aquisições (F&A) concluídas por adquirentes
Europeus, ao longo de 7 anos (2008-2014). Para tal, a performance operacional de longo-
prazo no período pós F&A será analisada. O nosso estudo irá comparar a performance antes
da F&A com a performance pós F&A, utilizando dados contabilísticos para medir os ganhos
ou perdas do adquirente originados pela decisão de participar numa F&A. Acreditamos que
o nosso estudo tem valor, pois irá contribuir para aumentar a literatura sobre F&A na Eu-
ropa, pois a maioria dos estudos até à data teve como foco empresas do Reino Unidos ou
dos Estados Unidos da América.
Os nossos resultados demonstram que, após a F&A e independentemente do nível de
desenvolvimento do mercado, a performance operacional do adquirente tornando-se nega-
tiva.
Relativamente aos determinantes de performance operacional pós-F&A, os nossos re-
sultados demonstram que adquirentes de países em desenvolvimento que paguem a transação
em dinheiro irão experienciar incrementos na rentabilidade. Adicionalmente, é esperado que
um mix de ações e dinheiro como pagamento pela transação; a opção de adquirir empresas
estrangeiras e de crescente dimensão relativamente ao adquirente; e o facto de o adquirente
possuir níveis de dívida elevados no período pré-F&A, origine um efeito negativo na eficácia
de custos na empresa resultante da transação. Por sua vez, adquirentes de países em desen-
volvimento que possuam elevadas reservas de dinheiro no período pré-F&A e escolham uma
empresa-alvo da mesma indústria da sua, irão experienciar aumentos significativos na eficácia
de custos pós-F&A. No caso dos países desenvolvidos, é esperado um aumento na eficácia
de custos da empresa resultante superior ao efeito positivo sentido nos países Europeus em
desenvolvimento. Relativamente ao modo como as características de governança corporativa
das empresas adquirentes afetam o desempenho das F&A, é possível concluir que a perfor-
mance operacional pós-F&A será pior se adquirentes de países em desenvolvimento possuí-
rem elevada concentração acionista. Outros fatores, tais como, o facto de possuir um elevado
número de membros no conselho de administração, o facto da maioria desses membros ser
considerado independente e, por fim, o presidente do concelho de administração ser também
o CEO da empresa, irá originar um efeito positivo na performance pós-F&A de adquirentes
que pertençam a países Europeus em desenvolvimento. Por sua vez, à medida que a propor-
ção de diretores considerados independentes aumenta na composição do conselho de admi-
nistração, é esperado um efeito negativo na performance pós-F&A dos países desenvolvidos.
iii
Contents
1. Introduction ............................................................................................................................... 1
2. Literature review and hypothesis development .................................................................... 4
2.1. M&A and accounting-based measures ............................................................................... 5
2.2. Factors affecting post-M&A operating performance ...................................................... 7
2.2.1. Bid and firm characteristics and their impact on post-M&A operating performance
7
a. Method of payment: cash versus stock .................................................................................. 8
c. Relative size of target................................................................................................................ 9
d. Pre-acquisition leverage and cash holdings of the acquirer ................................................ 9
e. Industry relatedness ................................................................................................................ 10
2.2.2. Acquirers’ corporate governance differences and their impact on post-M&A
operating performance.................................................................................................................... 10
3. Data and methodology ........................................................................................................... 14
3.1. Sample selection .................................................................................................................. 14
3.2. Sample description .............................................................................................................. 14
3.3. Performance benchmark .................................................................................................... 16
3.4. Performance measures ....................................................................................................... 17
3.5. Empirical method’s ............................................................................................................. 20
3.6. Independent variables definition ...................................................................................... 21
3.6.1. Univariate analysis ............................................................................................................... 21
3.6.2. Multivariate analysis ............................................................................................................ 22
3.6.2.1. Deal and firm variables .................................................................................................. 22
3.6.2.2. Ownership, governance, and country variables .......................................................... 24
4. Descriptive analysis ................................................................................................................. 26
4.1. Descriptive statistics ........................................................................................................... 26
4.2. Operating performance before the deal .......................................................................... 28
4.2.1. Pre-merger operating performance for the all sample .................................................. 28
4.2.2. Pre-merger operating performance for advanced and emergent and developing
acquires .............................................................................................................................................. 30
5.1. Change model ...................................................................................................................... 32
5.1.1. Return on assets for the all sample ................................................................................... 32
iv
5.1.2. Return on assets for advanced and emergent and developing acquirers .................... 33
5.1.3. Return on sales for the all sample ..................................................................................... 35
5.1.4. Return on sales for advanced and emergent and developing acquirers ...................... 36
5.2. Robustness check ................................................................................................................ 37
6. The determinants of the post-acquisition operating performance ................................. 39
6.1. Univariate analysis ............................................................................................................... 39
6.2. Cross-sectional analysis of operating performance changes following corporate
mergers .............................................................................................................................................. 43
7. Conclusions .............................................................................................................................. 50
References ......................................................................................................................................... 52
Appendix A: IMF country classification for Europe ................................................................. 60
Appendix B: Summary of post-M&A operating performance studies ................................... 61
Appendix C: Hypothesized determinants of operating performance following corporate
mergers and respective source ....................................................................................................... 65
Appendix D: Correlation coefficients among all our variables ................................................. 66
List of tables
Table 1: Sample description: distribution across completion years .......................................... 15
Table 2: Sample description: distribution by industry ................................................................ 15
Table 3: Sample description: distribution by acquirer nation .................................................... 16
Table 4: Descriptive statistics ......................................................................................................... 26
Table 5: Descriptive statistics by country development stage ................................................... 28
Table 6: Firms' performance in the three years prior acquisition: Comparison between
merged and control firms ............................................................................................................... 29
Table 7: Firms' performance in the three years prior the acquisition: Comparison between
advanced and emergent and developing market acquirers ........................................................ 31
Table 8: Change model applied to return on assets measure for the all sample .................... 32
Table 9: Change model applied to adjusted return on assets measure for advanced and
emergent and developing acquirers ............................................................................................... 34
Table 10: Change model applied to return on sales measure for the all sample .................... 35
Table 11: Change model applied to adjusted return on sales measure for advanced and
emergent and developing acquirers ............................................................................................... 37

v
Table 12: Intercept model applied to all sample, and to the comparation between advanced
and emergent and developing acquirers ....................................................................................... 38
Table 13: Univariate analysis for deal and firm variables ........................................................... 40
Table 14: Univariate analysis for ownership, governance and country variables ................... 42
Table 15: Determinants of operating performance changes following corporate mergers:
deal and firm specific determinants .............................................................................................. 45
Table 16: Determinants of operating performance changes following corporate mergers:
ownership and governance specific determinants ...................................................................... 48

1
1. Introduction
Mergers and acquisitions (hereafter, M&A) activity within the European Union has
reached a 10-year high, despite uncertainty around numerous political votes in the area. An-
nounced deal values between European Union nations have totalled $206.9bn (£159.5bn) so
far in 2017, which was the highest-year-to-date figure on record since 2007 (Thomson Reu-
ters). Even though, United States companies remained Europe’s biggest investors, European
companies together are the biggest source of the continent’s cross-border flows (56%). The
19 Eurozone countries are expected to achieve GDP growth of 1.7% in 2017 and 1.6% next
year, as well the countries of emerging and developing Europe, are expanding almost twice
as fast. Steadier and stronger growth around the world lifts demand for European products
and services at home and abroad, raises capacity utilization, and gives business decision mak-
ers the confidence to expand and invest (EY’s Attractiveness Survey Europe).
As is well known M&A continuing to be management’s favourite growth strategy, since
it can have a major impact on the competencies, organization, and therefore performance of
the involved firms. The major channels through which M&A can increase the performance
of acquirers are the achievement of synergies and the correction of mistakes made by man-
agement (Martynova and Renneboog, 2006). Synergies can be operational or financial. Op-
erational synergies are more common in M&A between related industries (Comment and
Jarrell, 1995), and can arise from economies of scale, a decrease in agency cost, and a
knowledge or skill transfer (Ravenscraft and Scherer, 1989). On the other hand, financial
synergies usually arise from diversifying deals (Martynova and Renneboog, 2006) though a
decreased probability of bankruptcy, more stable cash flows and easier access to capital
(Higgins and Schall, 1975; Stein, 1997).
Whether the motive for corporate acquisitions is indeed the anticipation of synergistic
benefits, these benefits or improvements in efficiency should lead to improved performance
following the combination. However, whereas empirical evidence suggests that M&A in-
crease the value of target firms, the outcome is mixed for acquirers. Most studies find that
shareholders of acquiring firms experience wealth destruction, on average, or at best break
even, leading to an underperformance puzzle (Andrade et al., 2001; Moeller et al., 2004).
Therefore, this study aims to answer the following: Do European acquirers experience
differences in performance after M&A? Do these differences in performance depends of
the acquirer country development stage?
2
These questions are appealing for the following two reasons. Firstly, although the lit-
erature on stock performance following M&A transactions is extensive, empirical evidence
regarding post-M&A operating performance in Europe is narrower (Martynova et al., 2007)
compared to the literature about M&A in the US and UK. To our best knowledge only
Mueller (1980), Gugler et al. (2003) and Martynova et al. (2007) focus on M&A activity by
European companies, and their studies report contradictory results. Hence, Papadakis and
Thanos (2010) suggested a need for more geographically diverse samples to overcome the
UK and US bias in the field of M&A studies. Secondly, this research is, in our understanding,
the first to distinguish between the M&A performance of European advanced and emergent
and developing acquirers1. Thanos and Papadakis (2012a) suggest a need to look at emerging
economies, because M&A results in the developed world may be valid for the developed
world, but may not be valid for the developing world (Wong and Cheung, 2009).
Our following research questions is: How corporate governance factors impacts oper-
ating performance effects?
Du and Boateng (2012) found that the most commonly studied determinants of post-
acquisition performance are firm- and industry-specific variables. While the role of corporate
governance in operating performance has received practically no attention (Carline et al.,
2009). Masulis et al. (2007) argue that M&A are among the largest and most readily observable
forms of corporate investment thereby making acquisitions ideal for testing the role and
effectiveness of corporate governance systems on M&A outcomes.
Typical issues considered in corporate governance of a firm are its ownership structure
and board effectiveness. Board effectiveness variables considered in various studies include
board size, board independence, and CEO duality (Dwivedi and Jain, 2005). Thus, as many
merger hypotheses are either unrelated to or likely to be insufficiently tested by only a set of
corporate governance factors, we unify and re-examine many of the prior results in the lit-
erature using proxies based on other characteristics of merging firms and the nature of the
underlying deals. In this way, we aim to discover which group of variables can better explain
the changes in post-merger performance of the merger firms and, at the same time, provide
evidence about the relationship between corporate governance and M&A performance.
Since the work in this regard has been made mainly in the context of developed countries
(Liu and Wang, 2013).
1 The present work follows the International Monetary Fund country classification. See Appendix A.

3
The current analysis is based on a sample of 223 European takeovers completed be-
tween 2008 and 2014. Our results can be summarized as follows.
We find a deterioration of post-M&A performance of the combined firms as meas-
ured by the return on assets. When we split the sample by country development stage, we
concluded for a significantly positive pre-M&A performance of emergent and developing
acquirers, which worsened following acquisition. For advanced markets acquirers, results
show a significant reduction on post-merger adjusted returns on assets, while no significant
change was observed with respect to firms’ cost efficiency after takeover.
Moreover, we find that post-merger operating performance changes are strongly de-
termined by some factors. Post-merger profitability of emergent and developing market ac-
quirers is enhance by cash-only as a method of payment for acquisition. Also, merged firms’
post-M&A cost efficiency is adversely affected when mix is the method of payment, when
the acquirer chooses a target from a different country, when the size of the firm being ac-
quired increases relative to the acquiring firm; and when the acquirer has high levels of pre-
M&A leverage. In turn, emergent and developing acquirers that have high pre-M&A cash
reserves and that prefer to acquire targets from the same industry experience improvements
on firms’ post-merger cost efficiency. For advanced market acquirers, the positive effect of
industry-related transactions on firms’ post-merger efficiency will be higher than in emergent
and developing markets, where it is significantly positive. Furthermore, we find that operating
performance outcomes are worse when the emergent and developing acquiring firm has a
large equity holder. While governance variables such as a large board, high proportion of
outside independent directors on acquirers’ board composition, and Chairman-CEO duality
are expected to enhance operating performance after takeover. Regarding advanced markets,
our results show a negative effect drive by acquirers’ board be composed by a large propor-
tion of outside independent directors. Lastly, the impact on post-takeover operating perfor-
mance of the method of payment, the relative size of the target, acquirers’ pre-M&A cash
reserves, and pre-M&A acquirers’ board holdings, do not differ between advanced and emer-
gent and developing markets. For the remaining factors the effect on post-merger operating
performance do differ between acquirers’ country development stage.
The rest of this work is organized as follows. Section 2 reviews previous research on
the topics. Section 3 describes the methodology. Section 4 shows the sample characteristics.
Section 5 and 6 comprises the results and discussions. Finally, Section 7 presents the conclu-
sions of the dissertation.
4
2. Literature review and hypothesis development
The efficient markets hypothesis assumes that, at the time the M&A is completed, all
future synergies must be already fully anticipated and incorporated into the acquiring firm’s
stock price (Lubatkin, 1983). Therefore, research stream based on share-price analysis or
event study methodology has used market-based measures to capture synergistic gains in
terms of value creation (Kumar, 2009). However, the continued presence as well as the length
of time over which the negative post-outcome returns are observed, contradicts the notion
of an efficient securities market (Ruback, 1988). Particularly, the event study methodology
considers the value of the decision to acquire, but not the value of the acquisition’s imple-
mentation (Haleblian et al., 2009).
Results yielded by event studies methodologies are considered biased, since changes in
market valuations, at the announcement period, could reflect the benefits of a merger, but
also other factors, such as capital market inefficiencies like an overvalued security (Barber
and Lyon, 1996; Kothari and Warner, 1997). Hence, the rise in the share price of the target
firm reflects not efficiency gains from the merger but merely a market correction (Scherer,
1988).
Likewise, environment in emerging markets is normally characterised by weaker dis-
closure requirements, persistence of earnings management (Leuz et al., 2003) and there is
poor information intermediation. Thus, investors are not able of distinguish the equity stocks
of well performing firms from the bad ones (Morck et al., 2000). Consequently, the use of
event studies in these markets is even more controversial, since they lack efficiency and are
likely to have fully incorporated the price changes before the announcement date (Narayan
and Thenmozhi, 2014).
Thus, a need for a different perspective emerge: that of company fundamentals. This
group of studies usually assesses changes in company performance in terms of key indica-
tors. The use of financial accounting data has several advantages (see Thanos and Papadakis
2012a, b). For example, accounts information is objective because they report actual perfor-
mance and is available to the public, including for unlisted companies. For a comprehensive
review see for instance Haleblian et al. (2009) and Thanos and Papadakis (2012a, b). Healy et
al. (1992) posits that returns around the takeover announcement represent investor’s expec-
tation of acquisition benefits whereas post-acquisition cash flow operating performance
measures the actual benefits, if any, generated by acquisitions. If synergies truly exist, eco-
nomic gains from mergers should thus show up in the combined firm’s fundamentals.
5
2.1. M&A and accounting-based measures
Empirical evidence about the use of accounting-based measures to evaluate whether
mergers are wealth-enhancing or value-destroying yield inconsistent results. A summary of
findings from previous empirical studies and their relevant features is displayed in Appendix
B.
The most notable and commonly cited study about this topic is by Healy et al. (1992).
Healy et al. (1992) investigated the 50 largest US acquisitions during the period of 1979 and
mid-1984. Using industry median as a benchmark, the improvements in post-merger cash
flow performance was analysed as the intercept of the regression of post-acquisition indus-
try-adjusted cash flow of the combined firm. The results showed post-merger improvements
in asset productivity, which lead to increases in post-merger operating cash flow returns in
comparison with merged firms equals. However, their study has been criticized by analysing
only very large mergers, during the time period generally referred to as "merger mania”
(Switzer, 1996).
Ghosh (2001) replicated the methodology used by Healy et al. (1992), although he crit-
icised the industry-median benchmark choose by the latter to measure improvements in op-
erating performance of acquiring firms in contrast with their industry counterparts1. For a
sample of 315 US mergers completed during the period of 1981-95, Ghosh (2001) found
that merging firms’ post-acquisition operating cash flow performance does improve by 2.4%
per annum when Healy et al. (1992) research design is follow. However, once control firms
matched on pre-acquisition performance and size from pre-event years is used, as suggested
by Barber and Lyon (1996), any statistically significant evidence of improvements in the op-
erating performance of merging firms following acquisitions was found.
As time goes by, and with the help of more sophisticated techniques to measure
changes in the post-M&A performance evidence, for the US market, tends to support the
conclusions of an significantly enhancement in profitability after the deal (Linn and Switzer,
2001; Heron and Lie, 2002), or at least the hypothesis of no change in operating performance
1 As regression-based results tend to be biased, since they do not account for acquirer firms’ size and pre-
performance. The use of industry-median firms can lead to non-random measurement errors, which in turn
will be absorbed in the intercept of the regression and will bias upward conclusions about merging firms’ post-
acquisition performance (Powell and Stark, 2005). The errors are considered non-random since acquirer firms
are normally of higher size than their industry counterparts and tend to undertake acquisitions during periods
of superior performance (See, for example: Franks and Harris, 1989; Morck et al., 1990; Penman, 1991; and
Martynova et al., 2007).
6
(Ghosh, 2001; Schlingemann and Moeller, 2004). Refusing the early evidence of a deteriora-
tion in profitability following a merger (Franks et al., 1988; Ravenscraft and Scherer, 1989;
Clark and Ofek, 1994)2.
For UK evidence about changes in post-merger operating performance is narrower
and even more contradictory than for the US. Dickerson et al., (1997) found an annual de-
crease of 1.86% in profitability, concluding that there is a detrimental long-term effect of
acquisition on profitability, whereas Powell and Stark (2005) confirmed a significant enhance-
ment. Powell and Stark (2005) followed Healy et al. (1992) and Ghosh (2001) methodologies
for the period 1985-93. For the first matching procedure, statistically significant larger im-
provements in operating performance, ranging from 0.80% to 3.1%, were found. While for
the second methodology, the median increase in post-takeover performance for acquiring
firms ranges from 0.13% to 1.78% per annum, both statistically significant. Either result
depends, however, on the definition of operating performance employed and deflator cho-
sen. This difference in estimates of improvements was also found by Ghosh (2001) and Linn
and Switzer (2001) for the US.
Most of the empirical evidence is from US and UK, which lead to the “overwhelming
geographical bias”. Therefore, to overcome that, authors started to apply more geograph-
ically diverse samples to see whether the results of previous research are ‘culture free’ or
‘culture specific’ (Papadakis and Thanos, 2010).
Martynova et al. (2007) concluded that for European firms’ empirical evidence regard-
ing this issue is practically non-existent. They studied 155 M&A of which both the acquiring
and target companies are from Continental Europe or the UK from the time period 1997-
2001. Their study followed Healy et al. (1992) and Ghosh (2001) models as methodology. In
the pre-merger period merger firms significantly outperform the median peers in their indus-
try. However, following the takeover, and once performance is control for industry, size and
pre-event performance, no significant change, between pre-and post-merger profitability of
the combined firm was found. Similar results that operating performance remains statistically
2 For the years 1957-77 Ravenscraft and Scherer (1989) examined 2,732 lines of business operated by U.S.
manufacturing corporations to analyse differences in profitability between pre-and post-merger financial per-
formance of target firms. They find that in 47% of cases acquired firms were sold off by the acquirer following
a large decline in profitability after their initial acquisition. For the remaining cases where the acquired compa-
nies were not sold off, a significant decline in performance was detected post-acquisition.
Clark and Ofek (1994) collected a sample of 38 takeovers of distressed firms occurring between 1981-88 in
the U.S. and were attempts to restructure distressed targets. Conclusions indicated bidders had negative post-
merger performance, consequently, mergers were not successful.
7
unchanged after the acquisition were also found for Greece by Pazarskis et al. (2006), Aus-
tralia (Sharma and Ho, 2002), and Canada (Dutta and Jog, 2009).
Giudici and Bonaventura (2017) observed the operating performance of a sample of
245 European IPO firms, listed in the period 1998–2008, conducting at least one acquisition
in the 2 years after going public. Their results showed that acquiring IPO firms do not gen-
erally perform differently from their non-acquiring counterparts. However, they exhibit a
significant drop in operating performance that is common to most IPO firms.
Empirical evidence about long-term impacts of M&A is based predominantly on
studies from the developed markets. Although in recent years, researchers have begun to
focus their interest in emerging markets, literature is still scarce. In line with developed-
market studies, this literature does not yield a standardised answer (Bertrand and Betschinger,
2012).
From 2000-08, Bertrand and Betschinger (2012) investigated the long-term impact on
operating performance of domestic and cross-border acquisitions initiated by Russian firms.
Their main contribution consisted in the analyse of serial acquisitions and distinguishing their
effects when compared to single acquirers. For a sample of more than 600 acquirers, their
conclusions showed that both domestic and international deals are performance-reducing,
i.e., acquirers performance decrease when compared to non-acquiring firms.
Rao-Nicholson et al. (2016) examined the post-M&A operating performance of 57
M&A in ASEAN countries between 2001-2012. They followed the same test techniques as
Healy et al. (1992) and Ghosh (2001). They reached the conclusion of a detrimental impact
on both raw performance and adjusted performance of merging firms.
Thus, considering the mixed results we theorize:
H1. There is no significant change in the operating performance of the acquirer companies following
M&A deals.
2.2. Factors affecting post-M&A operating performance
2.2.1. Bid and firm characteristics and their impact on post-M&A operating
performance
Du and Boateng (2012) found that the most commonly studied determinants of post-
M&A performance are firm- and industry-level characteristics. Empirical evidence has
mostly orbit around the following ones:
8
a. Method of payment: cash versus stock
A wide range of empirical evidence as tested whether method of payment affects post-
acquisition performance. Some authors defended that cash-financing deals originated a
higher profitability improvement than transactions financed with equity or a mixture of se-
curities (Linn and Switzer, 2001; Ghosh, 2001; Moeller et al., 2004; Rao-Nicholson et al.,
2016)3. Franks et al. (1988) theorise that the better performance of cash-based acquisitions
may be owing to the existence of asymmetries in information, where equity-financing acqui-
sitions may occur during periods in which acquirer shares are, at best, not undervalued or
targets’ equity is perceived to be overvalued. Likewise, if targets’ future excess returns are
anticipated, buyers will set a large cash offer to end up with competition and accomplish the
deal without any costly delay (Berkovitch and Narayanan, 1990). Alternatively, cash payment
is frequently funded by debt (Ghosh and Jain, 2000; Martynova and Renneboog, 2009),
which increases managerial discipline owing to increased scrutiny by the lenders and the
pressure to meet the debt repayment obligations (Narayan and Thenmozhi, 2014). Also, re-
stricts the availability of corporate funds at the managers’ disposal and hence minimizes the
scope for free cash flow problems (Jensen and Meckling, 1976).
H2. Cash-financed M&A are likely to generate higher post-M&A performance.
b. Domestic versus cross-border deals
Globalization has led to exponential growth of cross-border M&A activity as barriers
to entry into international markets are reduced (Mateev and Andonov, 2016). Companies
expand abroad to take advantage of new resources and customers (Shimizu et al., 2004), to
internalize the R&D capabilities of target companies (Eun et al., 1996), and to expanding
their businesses into new markets (as a response to globalization trends). Also, Cross-border
acquisitions make firms less vulnerable to international dynamics (Wang and Boateng, 2007).
Companies can, for example, benefit from different tax systems or exploit favourable ex-
change rate movements by acquiring foreign firms (Kang, 1993). Thus, cross-border acqui-
sitions are expected to increase the likelihood of synergy realization and improve profitability
as observed by Wang and Boateng (2007). The literature is however conflicting. Cross-cul-
3 Whereas no significant change in post-M&A performance were found between transactions that employ dif-
ferent modes of payment (Healy et al., 1992; Heron and Lie, 2002; Powell and Stark, 2005; and Martynova et
al., 2007).
9
tural sensitivity and communication in cross-border M&A is important to facilitate the inte-
gration process (Gomes et al., 2013). The expected synergistic value may not be accomplished
due to regulatory and cultural differences between the bidder and target countries which may
lead to complications in managing the post-merger process and even deteriorate the perfor-
mance of acquiring firms (Moeller and Schlingemann, 2004; Gomes et al., 2013). Moeller and
Schlingemann (2004), Goergen and Renneboog (2004), Martynova and Renneboog (2006)
show that firms acquiring foreign targets experience significantly lower takeover announce-
ment returns than their counterparts acquiring domestic targets.
H3. Cross-border deals may negatively affect operating performance of firms engaged in M&A as
compared to domestic deals.
c. Relative size of target
It is expected a proportional relationship between the size of the target and its contri-
bution to the overall performance of the combined firm (Linn and Switzer, 2001). Thus,
deals of relatively large targets enable bidders to quickly take advantage of valuable assets
such as strong market position, well-recognized branch, and established distribution net-
work, therefore leading to stronger profitability improvement compared to smaller targets
(Healy et al., 1992; Martynova et al., 2007). However, Martynova et al. 20074 showed that
managing a very large firm may be more difficult, due to acquiring mangers’ difficulties in
integrating the target firm, and hence lead to a worsening of performance. Most of empirical
evidence reports no significant relation between the relative target size and post-merger per-
formance (Healy et al., 1992; Heron and Lie, 2002; Sharma and Ho, 2002; Moeller et al., 2004;
Powell and Stark, 2005; Rao-Nicholson et al., 2016)5.
H4. The relative size of the target is likely to have no impact on post-M&A operating performance.
d. Pre-acquisition leverage and cash holdings of the acquirer
Acquirers with excessive free cash holdings are more likely to make value-destroying
investments (Jensen, 1986), which in turn could increase the agency costs of firms and cause
post-merger underperformance relative to those implemented by firms with limited cash
4 Martynova et al. (2007) discovered that the increase in post-merger profitability derive by the size effect is non-
linear, since the medium-size M&A were found to be the most profitable, and only the smallest ones tend to
have a significant negative impact on the operating performance of the combined firms.
5 The size effect was either considered harmful (Clark and Ofek, 1994; Ramaswamy and Waegelein, 2003), or
positive (Switzer, 1996; Linn and Switzer, 2001) for post-acquisition operating performance.
10
holdings (Rao-Nicholson et al., 2016). Martynova et al. (2007) found cash-poor acquirers ex-
perience an increase in the post-acquisition profitability by 1.57%, whereas acquirers with
the highest level of cash reserves experience a 2.46% decline. Therefore, acquisitions by cash-
rich companies lead to significant deteriorations in the operating performance of the com-
bined firm (Moeller et al., 2004).
Normally, highly leveraged acquirers have their activities monitored by banks. Hence
M&A which lead to losses of profitability will be prevented ex-ante (Ghosh and Jain, 2000).
Although, empirical evidence on this relationship supports no relation between acquirer’s
leverage and post-merger operating performance (Clark and Ofek, 1994; Switzer, 1996; Linn
and Switzer, 2001).
H5. M&A by cash-rich firms are likely to negatively impact their operating performance. Leverage
may have no impact.
e. Industry relatedness
Bidders may acquire targets in related industry or engage in diversifying acquisitions.
On the one hand, diversifying mergers are more likely to generate agency problems between
managers and shareholders (Shleifer and Vishny, 1989), bargaining problems within the firm
(Rajan et al., 2000) or rent-seeking behavior by divisional managers (Scharfstein and Stein,
2000), which may offset the forecasted synergies and result in a detrimental impact on post-
M&A performance. On the other hand, industry familiarity significantly diminishes the need
for acquiring firm managers to 'learn' the business of the acquired firm, which facilitate the
targets’ integration process (Hitt et al., 2001). Evidence regarding this issue is mixed. Powell
and Stark (2005), Linn and Switzer (2001), Switzer, (1996), Sharma and Ho (2002) and
Martynova et al. (2007) found that industry commonality has no impact on post-acquisition
performance. Other authors defend that diversifying acquisitions significantly outperform
their industry-related peers (Ghosh, 2001), and some empirical evidence defend a negative
effect in performance as a result of diversifying acquisitions (Healy et al., 1992; Heron and
Lie, 2002).
H6. Same-industry M&A are likely to positively impact post-M&A performance.
2.2.2. Acquirers’ corporate governance differences and their impact on post-M&A
operating performance
From the agency theory perspective, the objective of corporate governance is to en-
sure that managers resort to value maximizing strategies (Shleifer and Vishny, 1997). In spite
11
of the intensity of focus on the association between corporate governance and managerial
decisions, relatively few studies have examined the role and effectiveness of corporate gov-
ernance mechanisms on M&A performance. Since M&A are among the most observable
forms of corporate investment, they are ideal for testing how corporate governance profiles
of acquiring firms directly influence operating performance outcomes of merger decisions
(Thenmozhi and Narayanan, 2016). Typical issues considered in corporate governance of a
firm are its ownership structure and board effectiveness. Board effectiveness variable con-
sidered in various studies include board size, board independence, and CEO duality.
The clear majority of research examines the relationship between acquisition perfor-
mance and ownership structures through market based event study (Andrade et al., 2001).
However, since the work of Healy et al. (1992) that financial researchers adopted a long-term
perspective. In this sense, Wu and Chen (2007) studied the effects of corporate governance
on the performance of Taiwanese acquiring firms from 1992 to 2002, and their results
showed that insider ownership has no significant influence on long-term financial perfor-
mance. By contrast, Boateng et al. (2017) found that corporate governance characteristics of
acquiring firms (board ownership, board size, and block-holder control) have an economi-
cally and statistically significant impact on operating performance changes following mergers.
f. Ownership concentration
On the one hand, blockholders show more willingness to play an active role in corpo-
rate decisions because they partially internalize the benefits of their efficient monitoring ef-
fort over management (Grossman and Hart, 1986). Consequently, performance will improve,
since they help in disciplining the erring managers, and help to alleviate free-rider problem
in takeovers (Shleifer and Vishny, 1986). As large shareholders tend to have voting control,
their pressure is important for resolving agency problems and increasing firm value, as costs
associated with agency problems are reduced (Boateng et al., 2017). On the other hand, with-
out effective monitoring, controlling shareholders are likely to expropriate minority share-
holders and make sub-optimal decisions, and even more so, when control rights exceed the
cash flow rights (La Porta et al., 1999). Concentrated ownership may also exercise control
rights to create private benefits for themselves, which in turn creates agency problems and
may have implications for a firm’s long-term performance (Switzer, 1996; Young et al., 2008).
However, European studies by Holmen and Knopf (2004) and Faccio and Stolin (2006) find
12
no significant evidence to prove wealth transfer from minority shareholders to controlling
shareholders through takeovers.
In the context of emerging countries, the state is often the dominant owner who exer-
cise ultimate control (Young et al., 2008). The state is recognised for having different goals,
such as increase employment to reduce social instability, rather than profitability (Xu and
Wang, 1999). The presence of single large shareholders is particularly relevant to countries
with lower levels of legal investor protection (Shleifer and Vishny, 1997), which is the case
of emerging countries. Thus a higher ownership concentration may substitute for the absence
of strong external governance (Dharwadkar et al., 2000). Empirical evidence in emerging
countries have support the positive relationship between concentrated ownership and firm
performance (Xu and Wang, 1999 in China; Ramaswamy et al., 2002 in India and Russia by
Buck et al., 1999).
H7. Ownership concentration is likely to positively influence post-M&A performance.
g. Board of directors
It is argued that the effectiveness of a board increases with its size, at least up to a
point (Jensen, 1986). Boards large at excess are difficult to coordinate, and are slower at adapt
to change (Amar et al., 2011). Consistent with this view, Judge and Zeithaml (1992) found
board size related negatively to its involvement in the strategic decisions of the firm. Since
larger boards may increase the risk of making out of the time decisions, and consequently
negatively impact firm value (Eisenberg et al., 1998). However, Dwivedi and Jain (2005) and
Jackling and Johl (2009) defended large board sizes, since they give the firm a competitive
edge in different fronts ranging from more expertise, experience, resource corporate strategy
and provision of broad services.
H8. Large board sizes may positively influence post-M&A operating performance.
a. Board independence
Agency theory suggests that CEOs, if not monitored, may engage in actions which are
detrimental to shareholder wealth maximization (Jensen and Meckling, 1976). As insiders are
more subject to CEO influence (Fama and Jensen, 1983), it is important to have a board
composed by a greater proportion of outside independent directors. Such composition en-
sures a more effective way in monitoring and controlling managerial actions (Byrd and
Hickman, 1992) on behalf of shareholders. The independent directors will be responsible for

13
influencing and monitoring the proposed acquisition and resolving the conflicts of interests
among decision makers and shareholders (Boateng et al., 2017). They will do so, since com-
petition in the labour market for independent board members encourages them to build and
maintain a professional expert image, in which the interests of the shareholders they repre-
sent are promoted (Fama and Jensen, 1983). Choi et al. (2007) document a positive correla-
tion between the proportion of independent directors and a firm financial performance. On
the other hand, Duchin et al. (2010) point out that independent directors have inferior infor-
mation about the company which limits their effectiveness.
H9. The proportion of independent directors is likely to positively impact post-M&A operating per-
formance.
h. CEO duality
Chairman-CEO duality is defined in respect of one person heading both the Manage-
ment and the Board (Liu and Wang, 2013). Agency theory (Jensen and Meckling, 1976) pre-
dicts adverse outcomes for the firm in the presence of CEO duality. Duality is a signal of the
absence of separation between management decisions and control decisions (Fama and
Jensen, 1983), leading to a restriction in the board’s independence and monitoring effective-
ness (Mallette and Fowler, 1992). On the other hand, and considering the perspective of
organization theory (Boyd, 1996), when the same person concurrently holds the CEO and
chairman of the board positions, it is expected an enhanced capability for quick decision
making, which is important in M&A decisions to avoid delays with a potential of destroying
firm value (Boateng et al., 2017). Also, it allows precise leadership for purposes of strategy
formulation and implementation which should result in better organisational performance
(Anderson and Anthony, 1986). Empirical evidence range from positive (Coles et al., 2001)
to negative and mix findings (Heracleous, 2001; Adams et al., 2005) about CEO duality.
H10. CEO duality is likely to be positively related to operating performance.
Considering the contradictories results presented in previous literature regarding post-
M&A operating performance change in profitability and the effect of the several determi-
nants chosen by scholars to explain such change, it is appropriate to investigate it with newly
available data, and proper and standardized methodology to reach statistical significant con-
clusions. In this way we may help to build a consistent pattern in conclusions concerning
pot-merger operating performance of European companies.
14
3. Data and methodology
3.1. Sample selection
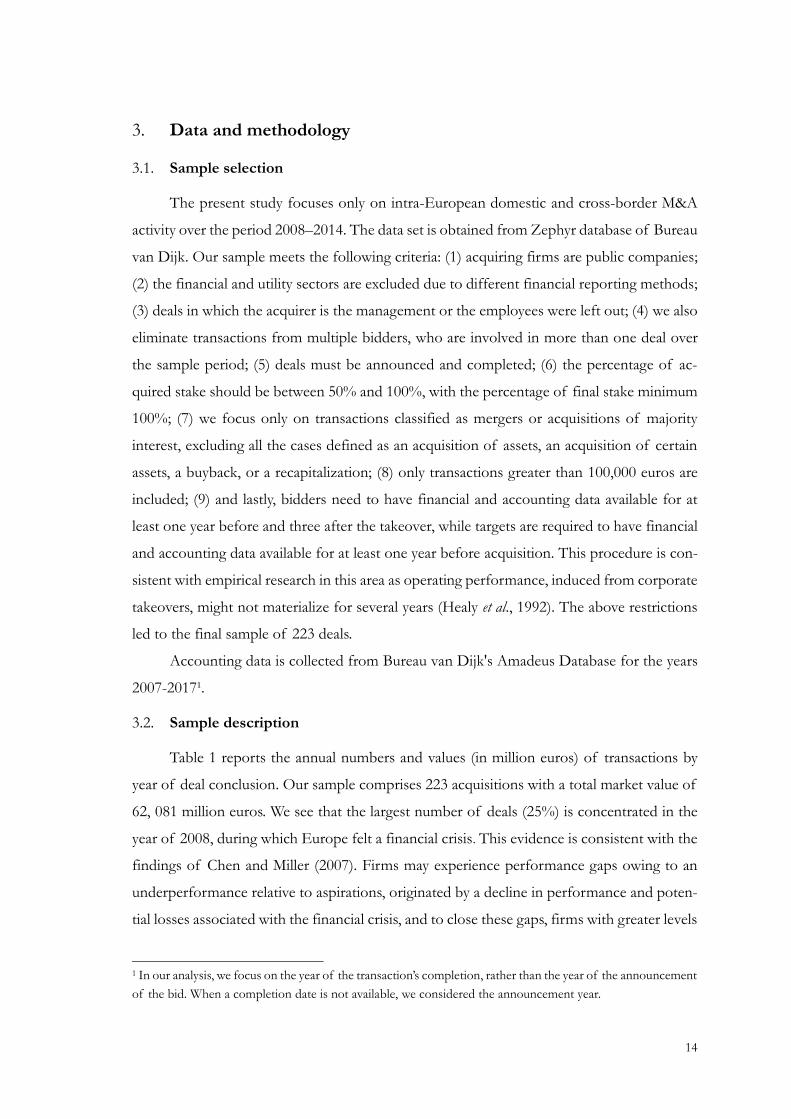
The present study focuses only on intra-European domestic and cross-border M&A
activity over the period 2008–2014. The data set is obtained from Zephyr database of Bureau
van Dijk. Our sample meets the following criteria: (1) acquiring firms are public companies;
(2) the financial and utility sectors are excluded due to different financial reporting methods;
(3) deals in which the acquirer is the management or the employees were left out; (4) we also
eliminate transactions from multiple bidders, who are involved in more than one deal over
the sample period; (5) deals must be announced and completed; (6) the percentage of ac-
quired stake should be between 50% and 100%, with the percentage of final stake minimum
100%; (7) we focus only on transactions classified as mergers or acquisitions of majority
interest, excluding all the cases defined as an acquisition of assets, an acquisition of certain
assets, a buyback, or a recapitalization; (8) only transactions greater than 100,000 euros are
included; (9) and lastly, bidders need to have financial and accounting data available for at
least one year before and three after the takeover, while targets are required to have financial
and accounting data available for at least one year before acquisition. This procedure is con-
sistent with empirical research in this area as operating performance, induced from corporate
takeovers, might not materialize for several years (Healy et al., 1992). The above restrictions
led to the final sample of 223 deals.
Accounting data is collected from Bureau van Dijk's Amadeus Database for the years
2007-20171.
3.2. Sample description
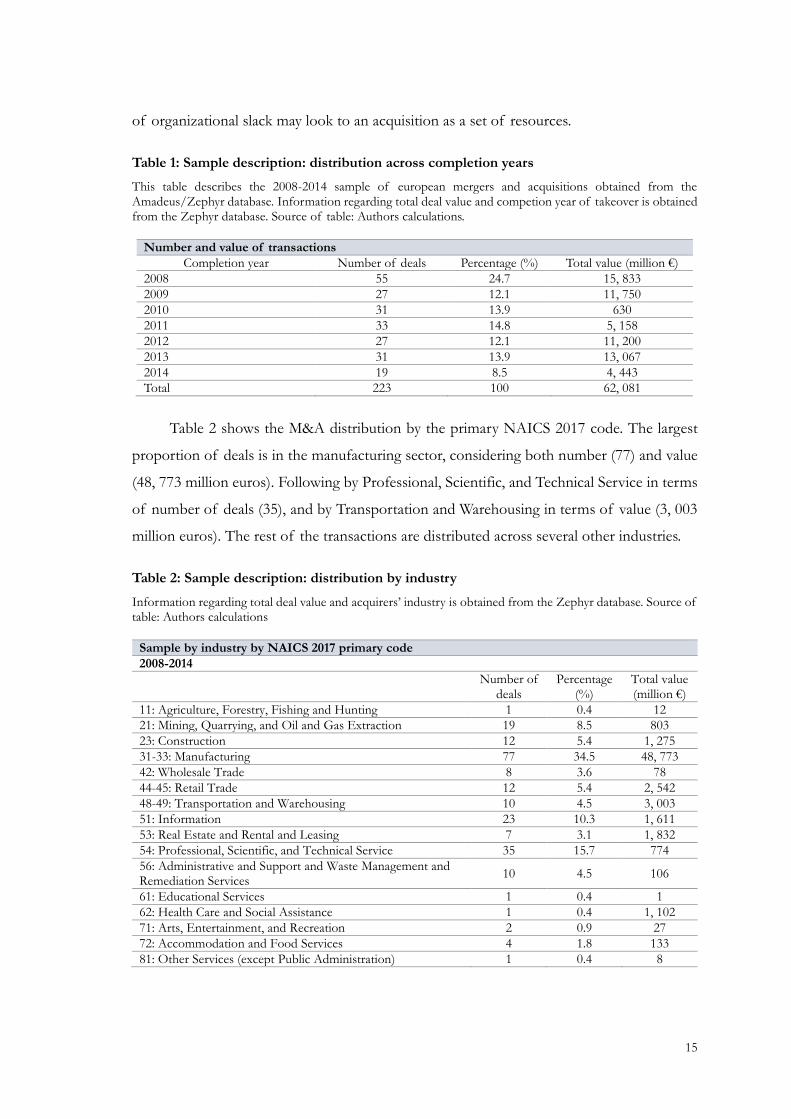
Table 1 reports the annual numbers and values (in million euros) of transactions by
year of deal conclusion. Our sample comprises 223 acquisitions with a total market value of
62, 081 million euros. We see that the largest number of deals (25%) is concentrated in the
year of 2008, during which Europe felt a financial crisis. This evidence is consistent with the
findings of Chen and Miller (2007). Firms may experience performance gaps owing to an
underperformance relative to aspirations, originated by a decline in performance and poten-
tial losses associated with the financial crisis, and to close these gaps, firms with greater levels
1 In our analysis, we focus on the year of the transaction’s completion, rather than the year of the announcement
of the bid. When a completion date is not available, we considered the announcement year.
15
of organizational slack may look to an acquisition as a set of resources.
Table 1: Sample description: distribution across completion years
This table describes the 2008-2014 sample of european mergers and acquisitions obtained from the Amadeus/Zephyr database. Information regarding total deal value and competion year of takeover is obtained from the Zephyr database. Source of table: Authors calculations.
Number and value of transactions
Completion year Number of deals Percentage (%) Total value (million €)
2008 55 24.7 15, 833
2009 27 12.1 11, 750
2010 31 13.9 630
2011 33 14.8 5, 158
2012 27 12.1 11, 200
2013 31 13.9 13, 067
2014 19 8.5 4, 443
Total 223 100 62, 081
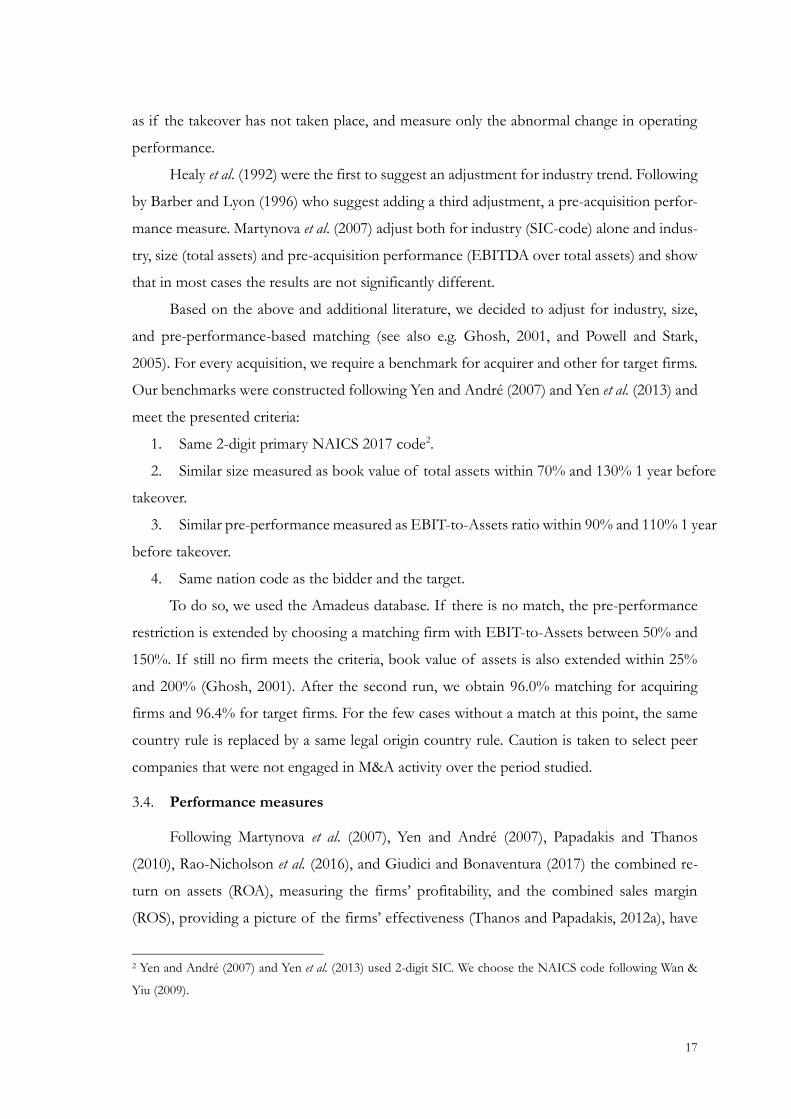
Table 2 shows the M&A distribution by the primary NAICS 2017 code. The largest
proportion of deals is in the manufacturing sector, considering both number (77) and value
(48, 773 million euros). Following by Professional, Scientific, and Technical Service in terms
of number of deals (35), and by Transportation and Warehousing in terms of value (3, 003
million euros). The rest of the transactions are distributed across several other industries.
Table 2: Sample description: distribution by industry
Information regarding total deal value and acquirers’ industry is obtained from the Zephyr database. Source of table: Authors calculations
Sample by industry by NAICS 2017 primary code
2008-2014
Number of deals
Percentage (%)
Total value (million €)
11: Agriculture, Forestry, Fishing and Hunting 1 0.4 12
21: Mining, Quarrying, and Oil and Gas Extraction 19 8.5 803
23: Construction 12 5.4 1, 275
31-33: Manufacturing 77 34.5 48, 773
42: Wholesale Trade 8 3.6 78
44-45: Retail Trade 12 5.4 2, 542
48-49: Transportation and Warehousing 10 4.5 3, 003
51: Information 23 10.3 1, 611
53: Real Estate and Rental and Leasing 7 3.1 1, 832
54: Professional, Scientific, and Technical Service 35 15.7 774
56: Administrative and Support and Waste Management and Remediation Services
10 4.5 106
61: Educational Services 1 0.4 1
62: Health Care and Social Assistance 1 0.4 1, 102
71: Arts, Entertainment, and Recreation 2 0.9 27
72: Accommodation and Food Services 4 1.8 133
81: Other Services (except Public Administration) 1 0.4 8

16
Table 3 shows the sample distribution by acquirer nation. The data confirm that the
main engine of the takeover activity in Europe is situated in the UK (31%), being Sweden
the second largest market for corporate control in Europe (13%). In terms of value the
biggest players are Ireland (20, 253 million euros) and Netherlands (13, 608 million euros).
Regarding emerging and developing Europe, Poland is by far the largest takeover market in
both, number of transactions (18) and value (356 million euros).
Table 3: Sample description: distribution by acquirer nation
Information regarding total deal value and acquirers’ country location is obtained from the Zephyr database. Source of table: Authors calculations
Sample by acquirer nation
Number of deals Percentage (%) Total value (million €)
Advanced Europe
Belgium 9 4.0 3, 568
Cyprus 2 0.9 17
Denmark 3 1.3 24
Estonia 1 0.4 10
Finland 10 4.5 1, 166
France 14 6.3 9, 485
Germany 10 4.5 2, 450
Greece 2 0.9 14
Iceland 1 0.4 41
Ireland 5 2.2 20, 253
Italy 9 4.0 216
Netherlands 5 2.2 13, 608
Norway 7 3.1 321
Portugal 1 0.4 20
Slovakia 1 0.4 27
Spain 12 5.4 3, 393
Sweden 28 12.6 553
Switzerland 7 3.1 170
United Kingdom 70 31.4 6, 312
Sub-total 197 88.3 61, 648
Emerging and Developing Europe
Bulgaria 2 0.9 10
Croatia 2 0.9 35
Latvia 1 0.4 13
Lithuania 1 0.4 12
Poland 18 8.1 356
Russian Federation 1 0.4 7
Serbia 1 0.4 0.483
Sub-total 26 11.7 433
Total 223 100 62, 081
3.3. Performance benchmark
By measuring the changes in operating performance without using a benchmark the
results may be biased. Thus, we need to compare the pre- and post-acquisition performance
17
as if the takeover has not taken place, and measure only the abnormal change in operating
performance.
Healy et al. (1992) were the first to suggest an adjustment for industry trend. Following
by Barber and Lyon (1996) who suggest adding a third adjustment, a pre-acquisition perfor-
mance measure. Martynova et al. (2007) adjust both for industry (SIC-code) alone and indus-
try, size (total assets) and pre-acquisition performance (EBITDA over total assets) and show
that in most cases the results are not significantly different.
Based on the above and additional literature, we decided to adjust for industry, size,
and pre-performance-based matching (see also e.g. Ghosh, 2001, and Powell and Stark,
2005). For every acquisition, we require a benchmark for acquirer and other for target firms.
Our benchmarks were constructed following Yen and André (2007) and Yen et al. (2013) and
meet the presented criteria:
1. Same 2-digit primary NAICS 2017 code2.
2. Similar size measured as book value of total assets within 70% and 130% 1 year before
takeover.
3. Similar pre-performance measured as EBIT-to-Assets ratio within 90% and 110% 1 year
before takeover.
4. Same nation code as the bidder and the target.
To do so, we used the Amadeus database. If there is no match, the pre-performance
restriction is extended by choosing a matching firm with EBIT-to-Assets between 50% and
150%. If still no firm meets the criteria, book value of assets is also extended within 25%
and 200% (Ghosh, 2001). After the second run, we obtain 96.0% matching for acquiring
firms and 96.4% for target firms. For the few cases without a match at this point, the same
country rule is replaced by a same legal origin country rule. Caution is taken to select peer
companies that were not engaged in M&A activity over the period studied.
3.4. Performance measures
Following Martynova et al. (2007), Yen and André (2007), Papadakis and Thanos
(2010), Rao-Nicholson et al. (2016), and Giudici and Bonaventura (2017) the combined re-
turn on assets (ROA), measuring the firms’ profitability, and the combined sales margin
(ROS), providing a picture of the firms’ effectiveness (Thanos and Papadakis, 2012a), have
2 Yen and André (2007) and Yen et al. (2013) used 2-digit SIC. We choose the NAICS code following Wan &
Yiu (2009).

18
been selected to measure acquisition performance.
Most studies on post-acquisition operating performance use EBITDA, pre-tax oper-
ating cash flow, as measure of operating performance (see e.g. Healy et al., 1992; Ghosh,
2001; Heron and Lie, 2002). Researchers agree that, since it is the sum of operating income,
depreciation, interest expense and taxes, such a performance measure is unaffected by dif-
ferences in financial structure and applied accounting method in computing depreciation,
interest, and taxes, making it a pure operating performance measure.
Even more common than the use of raw operating cash flow measure is to deflate it
before and after the transaction’s completion, in order to make financial ratios comparable
between companies and over time (Rao-Nicholson et al., 2016). The book value of assets and
sales are the deflators most commonly used3.
We utilize these same performance measures. However, given the limited availability
of acquirer depreciation and amortization data, and thus EBITDA figures, we are forced to
substitute EBIT (earnings before interest and tax), the next best measure for EBITDA. Like-
wise, due to lack of data, sales were replaced by operating sales (turnover), which we consider
an appropriated proxy. Barber and Lyon (1996) argue that, since both numerator and denom-
inator of the return metric come from the income statement, they are appropriately matched.
We calculate two measures of operating performance for each firm(i) in each year(t):
Return on assets, ROA i, t =EBIT i,t
BOOK VALUE OF ASSETS i,t (1)
Return on sales, ROS i, t =EBIT i,t
TURNOVER i,t (2)
The next steps explain how we compute the aggregate data for merged firms and con-
trol firms, respectively. Even though the illustrations are for return on assets measure, the
same procedures have been applied for return on sales variable. BASE indicates one of the
two, book value of assets (for ROA) or turnover (for ROS), scaling measures.
Following test techniques designed by Martynova et al. (2007), we start by computing
3 The market value of total assets is a commonly used deflator (Healey et al., 1992). However, will not be considered in the present study, since market values are a forward-looking measure and, intrinsically, reflect not only the assets in place but also all assets the firm is expected to acquire (Barber and Lyon, 1996). This method of adjustment is problematic as it relies on the assumption of efficient markets to properly assess the gains arising from the takeover (Powell and Stark, 2005). Empirical evidence in the UK and elsewhere suggests a systematic decline in market values for acquiring firms’ post-takeover (e.g., Gregory, 1997). Another reason why we did not scale by market value is that the European accounting regulation (IAS) only allows the purchase method of accounting in corporate acquisitions. Finally, in order to be able to use market values we require both acquirer and target to be listed - a requirement that reduces extremely our sample.
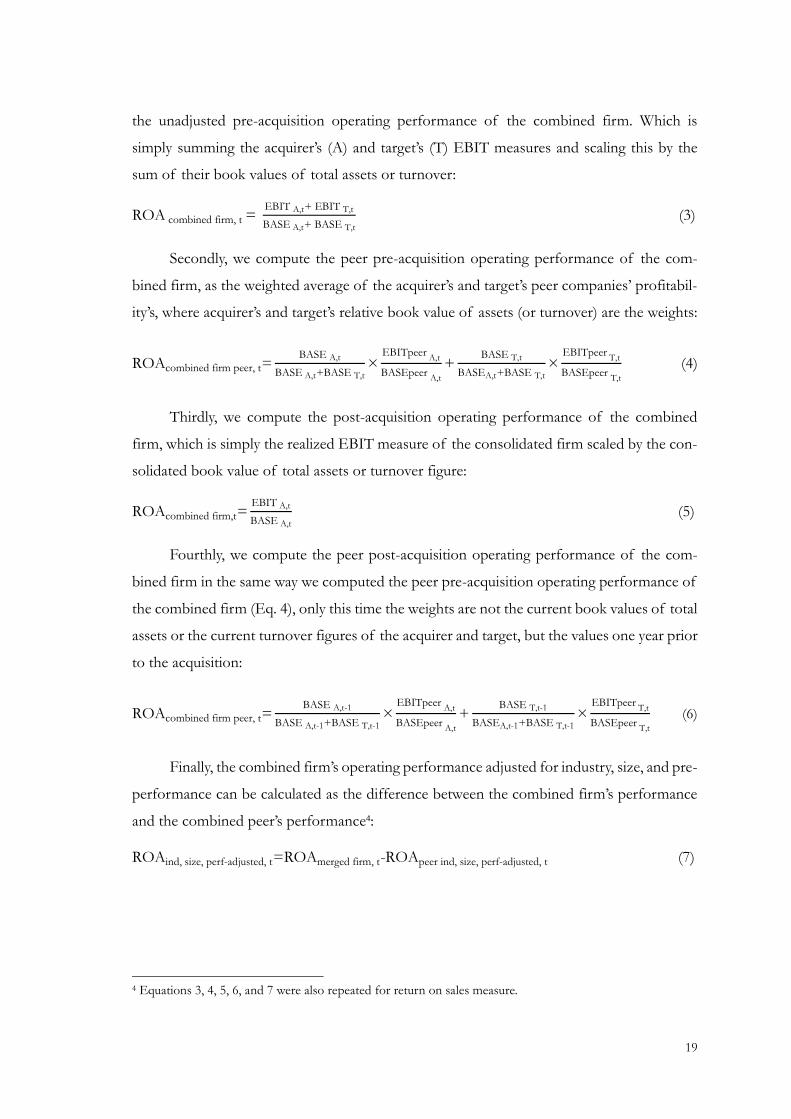
19
the unadjusted pre-acquisition operating performance of the combined firm. Which is
simply summing the acquirer’s (A) and target’s (T) EBIT measures and scaling this by the
sum of their book values of total assets or turnover:
ROA combined firm, t = EBIT A,t+ EBIT T,t
BASE A,t+ BASE T,t (3)
Secondly, we compute the peer pre-acquisition operating performance of the com-
bined firm, as the weighted average of the acquirer’s and target’s peer companies’ profitabil-
ity’s, where acquirer’s and target’s relative book value of assets (or turnover) are the weights:
ROAcombined firm peer, t=BASE A,t
BASE A,t+BASE T,t×
EBITpeer A,t
BASEpeer A,t
+BASE T,t
BASEA,t+BASE T,t×
EBITpeer T,t
BASEpeer T,t
(4)
Thirdly, we compute the post-acquisition operating performance of the combined
firm, which is simply the realized EBIT measure of the consolidated firm scaled by the con-
solidated book value of total assets or turnover figure:
ROAcombined firm,t=EBIT A,t
BASE A,t (5)
Fourthly, we compute the peer post-acquisition operating performance of the com-
bined firm in the same way we computed the peer pre-acquisition operating performance of
the combined firm (Eq. 4), only this time the weights are not the current book values of total
assets or the current turnover figures of the acquirer and target, but the values one year prior
to the acquisition:
ROAcombined firm peer, t=BASE A,t-1
BASE A,t-1+BASE T,t-1×
EBITpeer A,t
BASEpeer A,t
+BASE T,t-1
BASEA,t-1+BASE T,t-1×
EBITpeer T,t
BASEpeer T,t
(6)
Finally, the combined firm’s operating performance adjusted for industry, size, and pre-
performance can be calculated as the difference between the combined firm’s performance
and the combined peer’s performance4:
ROAind, size, perf-adjusted, t=ROAmerged firm, t-ROApeer ind, size, perf-adjusted, t (7)
4 Equations 3, 4, 5, 6, and 7 were also repeated for return on sales measure.

20
3.5. Empirical method’s
To assess the change in operating performance caused by the takeover, we employ the
change model of Ghosh (2001). As robustness check, we examine whether the intercept
model of Healy et al. (1992) yields different conclusions than the change model. We confine
analysis of pre- and post-acquisition periods over three years5, following Magenheim and
Mueller (1988), Franks et al. (1991), Rau and Vermaelen (1998) and Ghosh (2001).
Healy et al. (1992) employed a regression-based approach to estimating any improve-
ments in performance post-takeover. The model consists in an OLS regression (i=1, . . .n)
where n is sample size:
Median ROAi adj post-M&A= α+ β ∙ Median ROAi adj
pre-M&A+ εi (8)
In regression Eq. (8) Median ROAi adj post-M&Ais computed as the median return on assets
of each merged firm in the years [t=+1,...,+3] following the takeover date less the median
return on assets of each control firm in the same years. Median ROAi adj pre-M&A is the return
on assets of each merged firm in the years [t=-3,..,-1] less the return on assets of each control
company at the same time. The regression coefficients can be interpreted as follows: β is the
coefficient and reflects the relation between pre- and post-acquisition performance, while
the intercept α is an estimate of the mean amount of post-takeover performance left unex-
plained and must be, by definition, attributable to the takeover. Thus, if the value of α is
significantly different from zero, there is evidence of a significant difference in the perfor-
mance after the takeover, which is not explained by persistence in cash flows (Powell and
Stark, 2005). A T-test is applied to test for significance of the intercept and the coefficient.
Ghosh (2001) defended a change model, because the intercept model is more likely to
produce biased estimates since the presence of outliers often characterizes accounting fig-
ures. Thus, we compute Median change as the difference in industry, size, and pre-perfor-
mance adjusted return on assets/sales ί between the post-and pre-acquisition periods where
ί denotes the ίth acquisition. Instead of arbitrarily using any one of the three years to repre-
sent either the pre- or the post-acquisition period, we use the median of the industry, size,
and pre-performance adjusted return on assets/sales of years -1 to -3 to represent the pre-
5 At least one, but up to three years of both pre- and post-acquisition data is used in calculating the medians.

21
acquisition period (Median ROAi adj pre-M&A
). Similarly, the median of the years 1 to 3 repre-
sents the post-acquisition period for any acquisition ί (Median ROAi adj post-M&A
). Accordingly,
Median change is the median of the differences between the median annual post-perfor-
mance and median annual pre-performance for each of the 223 acquisitions6.
Median change = Median ROAί adjpost-M&A- Median ROAί adj
pre-M&A (9)
Furthermore, due to the presence of outliers, we apply a Wilcoxon signed rank test, to
test whether the median post-acquisition performance is significantly different from the me-
dian pre-acquisition performance (Martynova et al., 2007).
3.6. Independent variables definition
In this section, we explain the procedure followed to compute each independent vari-
able. Our objective is to see whether these variables can determine the changes in post-M&A
operating performance and whether their effect on post-merger performance validates our
hypotheses of section 2.2.2.
The first set of variables, namely deal and firm characteristics, was chosen because they
are considered some of the ‘Classic’ determinants of post-acquisition operating perfor-
mance, since the early literature have most commonly studied them (see e.g., Healy et al.,
1992; Ghosh, 2001; Linn and Switzer, 2001; Sharma and Ho, 2002; Powell and Stark, 2005;
Martynova et al., 2007). However, more recent research about the topic, start to examine the
role and effectiveness of corporate governance on M&A performance (see e.g., Yen &
André, 2007, Carline et al., 2009; Boateng et al., 2017). Thus, as many merger hypotheses are
either unrelated to or likely to be insufficiently tested by only a set of variables, we unify and
re-examine many of the prior results in the literature using proxies based on characteristics
of merging firms, the nature of the underlying deals, and corporate governance factors.
3.6.1. Univariate analysis
Following test techniques designed by Martynova et al. (2007), we present the median
6 It is important to understand that, because of the way they are calculated, median differences are sometimes
counterintuitive. A median difference is calculated as the median of differences, not by simply subtracting the
median pre-acquisition performance from the median post-acquisition performance. As a result, the median
difference might be a negative number, while, based on simply subtracting the median pre-acquisition perfor-
mance from the median post-acquisition performance, one would expect a positive difference.
22
changes driven by each independent variable in the adjusted post-M&A operating perfor-
mance measures for different sub-groups of deals. The division of each variable in sub-
groups is made in an attempt to confirm nonlinear impacts of some independent variables
in operating performance, as in previous literature (see e.g., Harford, 1999, Martynova et al.,
2007; Rao-Nicholson et al., 2016). Wilcoxon ranked test was used to test for the statistical
significance of the change in operating performance (median post-M&A performance minus
median pre-M&A performance). Additionally, we test for statistical significance of the dif-
ferences in performance measures across the sub-groups by employing a Mann-Whitney test
when 2 sub-groups are compared and a Chi-Square test when more than 2 sub-groups are
compared.
3.6.2. Multivariate analysis
Furthermore, in order to analyse the combined effect of the determinants of the post
operating performance of M&A transactions, we employ the following multivariate linear
models. Equations (10) and (11) were estimated by OLS technique. We test for individual
and joint significance of the variables using a T-test and F-test, respectively.
3.6.2.1. Deal and firm variables
Median ROA adj
post-M&A=αi+ ρ
j Median ROAj,i
adj
pre-M&A+
∑ βj
4j=1 DEALj,i+ ∑ χ
j3j=1 FIRMj,i+δj ADVANCED
j,i+ ∑ λj
4j=1 DEALj,i × ADVANCEDj,i+
∑ φj
3j=1 FIRMj,i × ADVANCEDj,i+ εi (10)
Median ROAi adj post-M&A
and Median ROAi adj pre-M&A
computations were already explained
below Eq.(8); αi is the constant of the model; DEALj,i is the j-th deal-specific determinant
(Cash, Mix, Cross border, Relative size) for the i-th observation; FIRMj,i is the j-th firm-spe-
cific determinant (Cash reserves, Leverage, Relatedness4) for the i-th observation;
ADVANCEDj,i represents the acquirer country development stage and is a dummy equal to
one if the acquirer belongs to an advanced European country and zero otherwise; lastly, we
have interactions between deal-specific and firm-specific determinants with the acquirer
country development stage (ADVANCEDj,i), respectively. εi is the error term.
First, we decided to examine the impact of the different means of payment in post-
merger operating performance, since early evidence suggest that cash-financing deals are

23
expecting to originate a higher profitability improvement than transactions financed with
equity or a mixture of securities (Linn and Switzer, 2001; Ghosh, 2001; Martynova et al.,
2007; Rao-Nicholson et al., 2016). Thus, we define Cash as a dummy equal to one when cash
is used to pay the entire acquisition price, zero otherwise. Following Fuller et al. (2002) we
consider that all-cash acquisitions include full payments of any combination of cash, debt,
and liabilities. Then, as in Gosh (2001) we define Stock as a dummy equal to one when com-
bining firms issue stock to merge, and the remaining acquisitions are classified as Mix because
they issue stock in combination with cash. Second, even though cross-border transactions
may bring additional benefits of international diversification and access to new markets, they
are also likely to be more complex and thus more costly and risky to execute than domestic
ones (Danbolt and Maciver, 2012). Thus, as in Rao-Nicholson et al. (2016), we set a dummy
that equals to one if the acquiring and target firms are from different countries (Cross bor-
der). Third, Linn and Switzer (2001) and Martynov et al. (2007), among others, have proved
that acquisitions of relatively large targets are expected to outperform takeovers of relatively
small targets, because the first have a greater scope for operational and financial synergies.
Hence, following Martynova et al. (2007) we introduce the continuous variable Relative size,
which is the ratio between the size of the target and the size of the acquirer, with size meas-
ured by total assets.
Regarding merged firms’ characteristics, Jensen (1986) considered that excessive free
cash holdings lead to an increase in agency costs. Which in turn, could lead to significant
deteriorations in the operating performance of the combined firm (Moeller et al., 2004;
Martynova et al., 2007). So, we introduce the continuous variable Cash reserves which is the
book value of cash and cash equivalents relative to market value of common stock and total
debt of acquiring firm before merger (as in Carline et al., 2009). Also following Carline et al.
(2009), the continuous variable Leverage is computed as book value of total debt relative to
market value of common stock and total debt of acquiring firm before merger. We decided
to analyse the effect of such variable due to the bank monitoring rationale, which states that
highly leveraged acquirers have their activities monitored by banks. Therefore, M&A which
lead to losses of profitability will be prevented ex-ante (Ghosh and Jain, 2000). Lastly, the
findings on industry relatedness and takeover effect on operating performance tend to sug-
gest that M&A of firms operating in different industries are normally associated with poorer
performance compared to industry-related peers (Jensen, 1986; Healy et al., 1992). Thus, we
set the dummy Relatedness4 which is equal to one if target firm and acquiring firm have the

24
same 4-digit NAICS 2017 code. Our approach follow Wan & Yiu (2009). They have used the
North American Industry Classification System (NAICS) primary code to identify whether
merging firms are in related or nonrelated industries.
3.6.2.2. Ownership, governance, and country variables
The following regression examines the combined effect of governance variables in
post-merger operating performance. The firm and deal specific determinants are now incor-
porate as control variables, since they are important variables that may affect performance
of M&A. Also, existing literature suggests that country-specific determinants may, as well,
have impact on the value created by M&A. Thus, we also control for the rule of law of the
target country.
Median ROA adj
post-M&A=αi+ β
j Median ROAj,i
adj
pre-M&A+ ∑ γj
4j=1 GOVERNANCEj,i+
δj LARGE SHAREHOLDER HOLDINGS j,i+ ηj RULE OF LAW TARGETj,i+
χj ADVANCED
j,i+ ∑ σj
4j=1 DEALj,i+ ∑ φ
j3j=1 FIRMj,i+ ∑ ϕ
j4j=1 GOVERNANCEj,i ×
ADVANCEDj,i+ ξj LARGE SHAREHOLDER HOLDINGSj,i× ADVANCEDj,i+ εi (11)
GOVERNANCEj,i is the j-th governance-specific determinant (Board size, Board hold-
ings, Independent directors, CEO duality) for the i-th observation. With respect to corporate
governance variables, large board size gives the firm a competitive advantage in different
fronts ranging from more expertise, experience, resource corporate strategy and provision
of broad services (Liu and Wang, 2013). Some studies (Dwivedi and Jain, 2005; Jackling and
Johl, 2009) favor large board sizes. Thus, as in Yen et al. (2013), Board size represent the
numbers of directors on the board in the acquiring firm. Next, we defined Board holdings
as the proportion of acquiring firm’s outstanding common stock held by its board of direc-
tors in aggregate before merger (following Carline et al., 2009). This variable attempt to meas-
ure the effect of ownership concentration with-in board of directors. Since Morck et al.
(1988) in their “entrenchment argument” indicate a negative relationship between board
ownership and corporate performance at high ownership levels. At higher ownership levels,
managers may be so wealthy that they no longer intend to maximize profit but get more
utility from maximizing market share or technological leadership. Furthermore, several stud-
ies have suggested that independent outside directors help mitigate the agency problem and
monitor the large-scale transaction like mergers, because an independent board is in a better
25
position to monitor and control mangers and hence can better align managers and share-
holders interest (Dunn, 1987). Accordingly, and following Boateng et al. (2017), we defined
Independent directors as the percentage of independent directors on the board of directors.
Lastly, we set the variable CEO duality which is a dummy equal to one if CEO and COB
positions are held by the same individual (as in Yen and André, 2007). Finkelstein and D’aveni
(1994) point out that duality removes any internal and external ambiguity regarding respon-
sibility for firm processes and outcomes. In M&A decisions quick and decisive action are
important to avoid delays which may result in hostile and costly takeover with a potential of
destroying firm value.
Concerning ownership concentration we set the variable Large shareholder holdings,
which measure the proportion of voting power in the hands of the acquirer’s largest share-
holder (see Yen & André, 2007; Yen et al., 2013). We consider this variable because researches
argue that through mergers and acquisitions, controlling shareholder improved the value of
non-listed companies. Large shareholders become involved in business management, to su-
pervise managers, so agency conflicts between managers and shareholders can be alleviated
(Sarkar and Sarkar, 2000).
Finally, the country-specific determinant Rule of law target (proxy to measure the ‘ef-
ficient’ of legal regimes: countries are scored on a scale from 0 to 100 based on an assessment
of the law and order tradition) is used as control variable (calculations following Mateev and
Andonov, 2016). Rule of Law captures perceptions of the extent to which agents have con-
fidence in and abide by the rules of society, and in particular the quality of contract enforce-
ment, property rights, the police, and the courts, as well as the likelihood of crime and vio-
lence (World Bank). We decide to control for this variable, because differences in law and
enforcement of law are responsible for explaining the intensity and the pattern of mergers
and acquisitions around the world (Rossi and Volpin, 2004).
It is important to highlight that data to compute firm and deal characteristics was ob-
tained from Bureau van Dijk's Amadeus Database or Thomson Reuters Datastream. Own-
ership and corporate governance data must be available from annual reports of each com-
pany from company websites or Thomson Reuters Eikon filings database.
Appendix C summarizes all the variables we use in the regression analysis as well as
respective data sources of each variable, while Appendix D shows the correlation matrix of
dependent and explanatory variables. All the correlations, among independent variables, re-
spect the maximum threshold of 0.7 suggested by Hair et al. (2010).

26
4. Descriptive analysis
4.1. Descriptive statistics
In Table 4, we display summary statistics of all variables for the all sample (n=223).
We present the number, mean, median and standard deviations (SD) of corporate govern-
ance variables, acquirer and deal characteristics.
Table 4: Descriptive statistics
This table reports the number, mean, median and standard deviations (SD) of corporate governance variables, acquirer and deal characteristics as well as country-specific variables. Large shareholder holdings is the percentage of voting shares held by the largest shareholder; Board size represent the numbers of directors on the board in the acquiring firm; Board holdings represent proportion of acquiring firm’s outstanding common stock held by its board of directors in aggregate before merger; Independent directors is the percentage of independent directors on the board of directors; CEO duality is a dummy equal to one if CEO and COB positions are held by the same individual; Cash is a dummy equal to one when cash is used to pay the entire acquisition price, zero otherwise; Stock is a dummy equal to one when combining firms issue stock to merge; Mix is a dummy equal to one for acquisitions that issue stock in combination with cash; Relative size is the ratio between the size of the target and the size of the acquirer, with size measured by total assets; Cash reserves is the book value of cash and cash equivalents relative to market value of common stock and total debt of acquiring firm before merger; Leverage is the book value of total debt relative to market value of common stock and total debt of acquiring firm before merger; Relatedness4 is a dummy equal to one if target firm and acquiring firm have the same 4-digit NAICS 2017 code; and Advanced represents the acquirer country development stage and is a dummy equal to one if the acquirer belongs to
an advanced European country and zero otherwise. Source of table: Authors calculations.
Becht and Rok (1999) suggested that in several European countries, the median largest
voting stake in listed companies is over 50%. Although, in our sample the median percentage
of holdings of the largest shareholder is 16.5% of the voting shares.
All Sample
Variables N Mean Median SD
Ownership variables
Large shareholder holdings 197 0.250 0.165 0.249
Governance variables
Board size 175 7.309 7.000 2.647
Board holdings 170 5.565 0.051 40.929
Independent directors 166 0.445 0.449 0.305
CEO duality (dummy) 26 0.147 - 0.355
Deal variables
Cash (dummy) 45 0.256 - 0.437
Stock (dummy) 41 0.233 - 0.424
Mix (dummy) 90 0.511 - 0.501
Cross border (dummy) 72 0.323 - 0.469
Relative size 223 0.454 0.067 1.517
Firm variables
Leverage 211 0.197 0.159 0.197
Cash reserves 211 0.146 0.088 0.164
Relatedness4 (dummy) 166 0.744 - 0.437
Country variables
Rule of law target 223 87.431 92.891 13.783
Advanced (dummy) 197 0.883 - 0.322
27
In the case of governance variables, median size of European boards’ is seven mem-
bers. A finding similar to Conyon and Peck (1998) for the UK (9), and Yen and André (2007)
(7-10 members) for English-origin countries. In addition, 44.9% of the board members are
considering independents; a number significantly higher than 36% reported in the study car-
ried out by Boateng et al. (2017). The board own in median 5.1% of the voting shares; a
higher percentage than the one discovered by Carline et al. (2009) which studied 81 domestic
deals in the UK during the period 1985–1994 and found median board holdings equal to
0.9%. CEO and Chairman positions are hold together in 14.7% cases in our sample, our
finding is similar to Boateng et al. (2017) (19% of the cases), but below the 26% documented
by Carline et al. (2009).
With respect to deal characteristics, 25.6% are all-cash acquisitions, well below
Martynova et al. (2007) finding of 70%. 23.3% of deals are entirely paid with stock, compared
to 11.3% pure stock European deals in Faccio and Masulis (2005), and 16-19% of stock paid
English-origin deals in Yen and André (2007). The largest amount of deals (51%) have a
mixed payment method. The acquiring and target firms are from different countries in 32.3%
of the cases, a value in accordance with the 33% of cross-border acquisitions in Martynova
et al. (2007). The median size of acquirers is about 6.7% times larger than that of targets.
Martynova et al. (2007) found a median target size of 8.28%.
Regarding firm-specific variables, the average level of leverage is 19.7% (compared to
21.5% in Maury and Pajuste (2005) for Western European firms and 16% in Yen and André
(2007) for English origin-countries). The median cash holdings of acquirer in the year prior
to acquisition represents 8.8% of acquirers’ size. In turn, Carline et al. (2009) results show an
ratio equal to only 0.08%. Overall, 74.4% of deals are classified as being in the same industry.
A value higher than the one reported by Martynova et al. (2007) (32%) for European coun-
tries and Rao-Nicholson et al. (2016) (30% of the cases) for Asean countries.
To finish, agents rank their confidence in and abide by the rules of society around 92.
Table 5 highlights some differences between advanced and emergent and developing
acquirers. Firstly, the concentration of voting power in the hands of the board of directors
is higher in emergent and developing markets (15.1%) than it is in advanced markets (4.7%).
Secondly, on average, 46.7% of the board members are considered independent in advanced
markets, but only 5.9% have the same status in emerging and developing European markets.
Thirdly, acquirers from emergent and developing markets prefer to pay for acquisitions issu-
ing stock, rather than using only cash. This finding is in line with Martynova and Renneboog
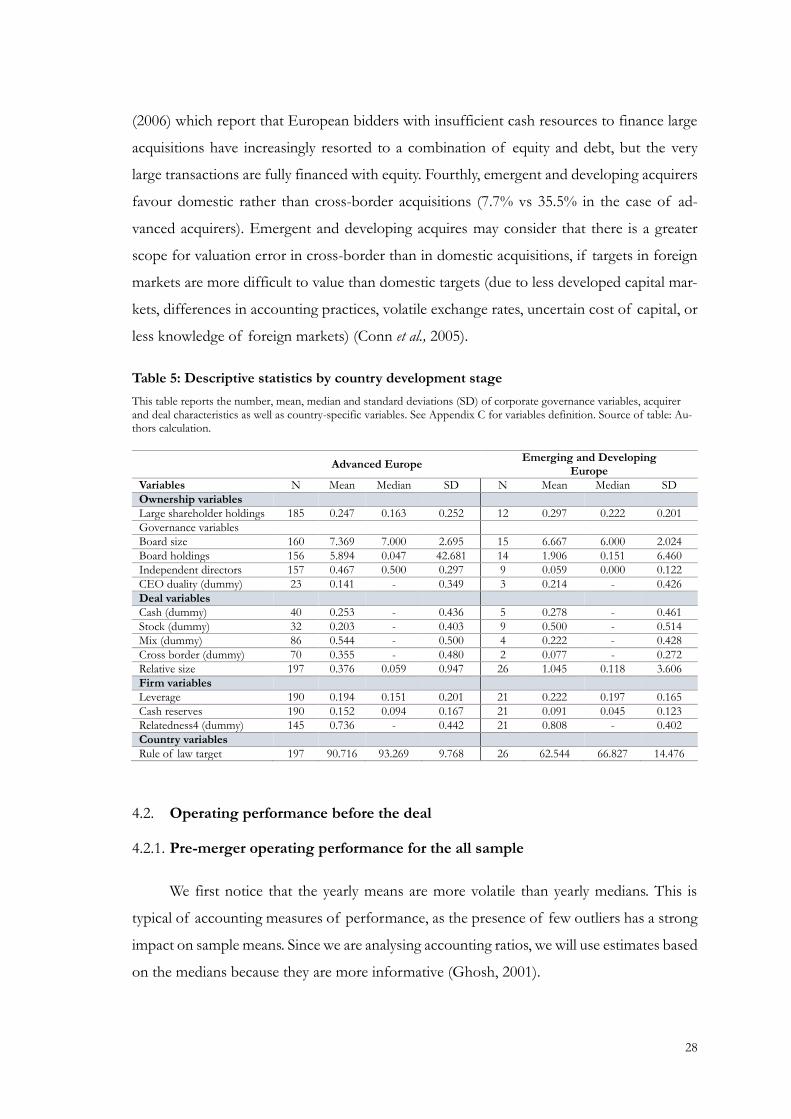
28
(2006) which report that European bidders with insufficient cash resources to finance large
acquisitions have increasingly resorted to a combination of equity and debt, but the very
large transactions are fully financed with equity. Fourthly, emergent and developing acquirers
favour domestic rather than cross-border acquisitions (7.7% vs 35.5% in the case of ad-
vanced acquirers). Emergent and developing acquires may consider that there is a greater
scope for valuation error in cross-border than in domestic acquisitions, if targets in foreign
markets are more difficult to value than domestic targets (due to less developed capital mar-
kets, differences in accounting practices, volatile exchange rates, uncertain cost of capital, or
less knowledge of foreign markets) (Conn et al., 2005).
Table 5: Descriptive statistics by country development stage
This table reports the number, mean, median and standard deviations (SD) of corporate governance variables, acquirer and deal characteristics as well as country-specific variables. See Appendix C for variables definition. Source of table: Au-thors calculation.
Advanced Europe Emerging and Developing
Europe
Variables N Mean Median SD N Mean Median SD
Ownership variables
Large shareholder holdings 185 0.247 0.163 0.252 12 0.297 0.222 0.201
Governance variables
Board size 160 7.369 7.000 2.695 15 6.667 6.000 2.024
Board holdings 156 5.894 0.047 42.681 14 1.906 0.151 6.460
Independent directors 157 0.467 0.500 0.297 9 0.059 0.000 0.122
CEO duality (dummy) 23 0.141 - 0.349 3 0.214 - 0.426
Deal variables
Cash (dummy) 40 0.253 - 0.436 5 0.278 - 0.461
Stock (dummy) 32 0.203 - 0.403 9 0.500 - 0.514
Mix (dummy) 86 0.544 - 0.500 4 0.222 - 0.428
Cross border (dummy) 70 0.355 - 0.480 2 0.077 - 0.272
Relative size 197 0.376 0.059 0.947 26 1.045 0.118 3.606
Firm variables
Leverage 190 0.194 0.151 0.201 21 0.222 0.197 0.165
Cash reserves 190 0.152 0.094 0.167 21 0.091 0.045 0.123
Relatedness4 (dummy) 145 0.736 - 0.442 21 0.808 - 0.402
Country variables
Rule of law target 197 90.716 93.269 9.768 26 62.544 66.827 14.476
4.2. Operating performance before the deal
4.2.1. Pre-merger operating performance for the all sample
We first notice that the yearly means are more volatile than yearly medians. This is
typical of accounting measures of performance, as the presence of few outliers has a strong
impact on sample means. Since we are analysing accounting ratios, we will use estimates based
on the medians because they are more informative (Ghosh, 2001).
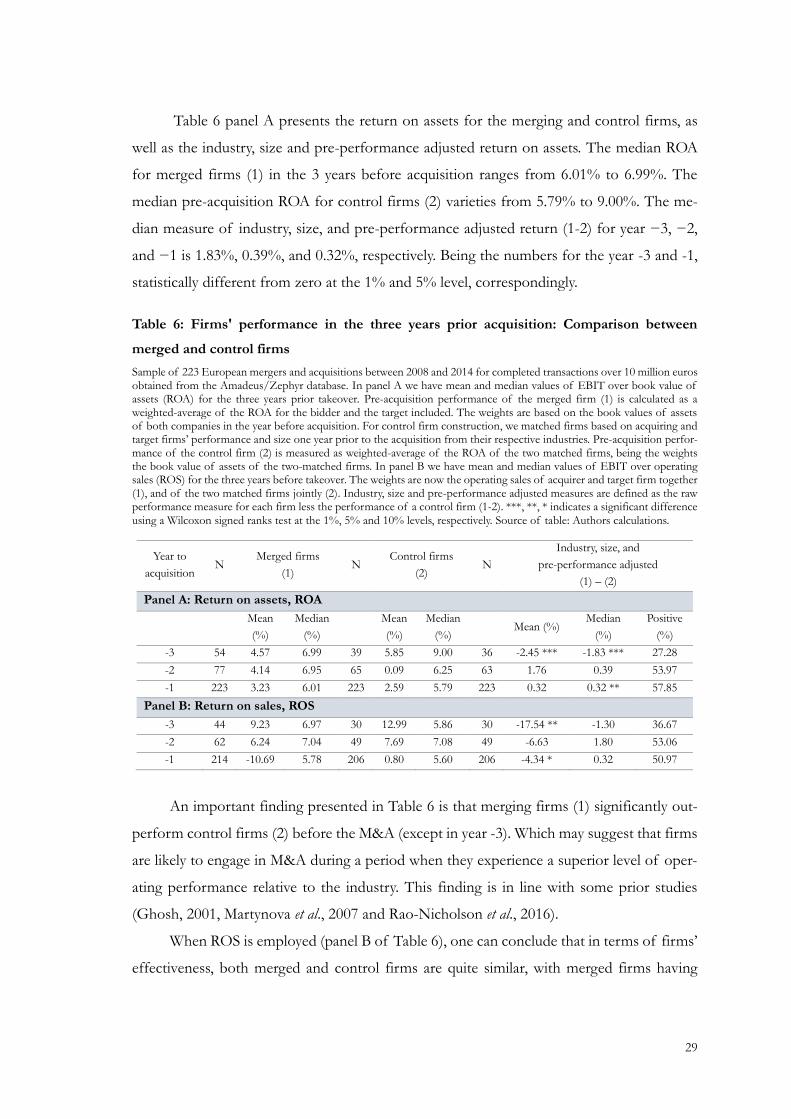
29
Table 6 panel A presents the return on assets for the merging and control firms, as
well as the industry, size and pre-performance adjusted return on assets. The median ROA
for merged firms (1) in the 3 years before acquisition ranges from 6.01% to 6.99%. The
median pre-acquisition ROA for control firms (2) varieties from 5.79% to 9.00%. The me-
dian measure of industry, size, and pre-performance adjusted return (1-2) for year −3, −2,
and −1 is 1.83%, 0.39%, and 0.32%, respectively. Being the numbers for the year -3 and -1,
statistically different from zero at the 1% and 5% level, correspondingly.
Table 6: Firms' performance in the three years prior acquisition: Comparison between
merged and control firms
Sample of 223 European mergers and acquisitions between 2008 and 2014 for completed transactions over 10 million euros obtained from the Amadeus/Zephyr database. In panel A we have mean and median values of EBIT over book value of assets (ROA) for the three years prior takeover. Pre-acquisition performance of the merged firm (1) is calculated as a weighted-average of the ROA for the bidder and the target included. The weights are based on the book values of assets of both companies in the year before acquisition. For control firm construction, we matched firms based on acquiring and target firms’ performance and size one year prior to the acquisition from their respective industries. Pre-acquisition perfor-mance of the control firm (2) is measured as weighted-average of the ROA of the two matched firms, being the weights the book value of assets of the two-matched firms. In panel B we have mean and median values of EBIT over operating sales (ROS) for the three years before takeover. The weights are now the operating sales of acquirer and target firm together (1), and of the two matched firms jointly (2). Industry, size and pre-performance adjusted measures are defined as the raw performance measure for each firm less the performance of a control firm (1-2). ***, **, * indicates a significant difference
using a Wilcoxon signed ranks test at the 1%, 5% and 10% levels, respectively. Source of table: Authors calculations.
Year to
acquisition N
Merged firms
(1) N
Control firms
(2) N
Industry, size, and
pre-performance adjusted
(1) – (2)
Panel A: Return on assets, ROA
Mean
(%)
Median
(%)
Mean
(%)
Median
(%) Mean (%)
Median
(%)
Positive
(%)
-3 54 4.57 6.99 39 5.85 9.00 36 -2.45 *** -1.83 *** 27.28
-2 77 4.14 6.95 65 0.09 6.25 63 1.76 0.39 53.97
-1 223 3.23 6.01 223 2.59 5.79 223 0.32 0.32 ** 57.85
Panel B: Return on sales, ROS
-3 44 9.23 6.97 30 12.99 5.86 30 -17.54 ** -1.30 36.67
-2 62 6.24 7.04 49 7.69 7.08 49 -6.63 1.80 53.06
-1 214 -10.69 5.78 206 0.80 5.60 206 -4.34 * 0.32 50.97
An important finding presented in Table 6 is that merging firms (1) significantly out-
perform control firms (2) before the M&A (except in year -3). Which may suggest that firms
are likely to engage in M&A during a period when they experience a superior level of oper-
ating performance relative to the industry. This finding is in line with some prior studies
(Ghosh, 2001, Martynova et al., 2007 and Rao-Nicholson et al., 2016).
When ROS is employed (panel B of Table 6), one can conclude that in terms of firms’
effectiveness, both merged and control firms are quite similar, with merged firms having
30
slightly higher median earnings ability that could be mainly due to more efficient cost man-
agement or better revenue management. The medians of the difference in ROS between
merging and matched firms are -1.30%, 1.80% and 0.32% for years -3, -2, and -1, respectively,
and these numbers are not significant at the 10% level. This result is in line with Powell and
Stark (2005), Rao-Nicholson et al. (2016), and Giudici and Bonaventura (2017).
4.2.2. Pre-merger operating performance for advanced and emergent and developing
acquires
In table 7, we split the all sample by acquirer’s country development stage: advanced
versus emergent and developing markets. We present means and median values for ROA and
ROS measures adjusted for industry, size and pre-performance.
Regarding advanced markets, median adjusted ROA for the 3 years before acquisition
varies between -1.83% and 0.29%. The negative performance felt in year -3 is significant at
a 5% level. Emergent and developing European countries present adjusted ROA ranging
from -7.64% to 0.99%. In year -1 emergent and developing acquirers show a significant and
slightly better performance than advanced bidders.
Even though performance was constructed to be similar across merged and control
firms by research design, the difference in performance for year -1 for the all sample, may
be induce by the results of emergent and developing market firms. Acquirer firms are nor-
mally of higher size than their industry counterparts and tend to undertake acquisitions dur-
ing periods of superior performance (Franks and Harris, 1989; Morck et al., 1990; Penman,
1991; and Martynova et al., 2007). Thus, we conclude that it is more difficult to find truly
control firms in those countries. Since for advanced Europe, the performance between the
two sets of firms is similar in pre-acquisition period. However, Gosh (2001), Martynova et
al. (2007), Yen and André (2007), Yen et al. (2013) and Rao-Nicholson et al. (2016), also report
median measure of industry, size, and pre-performance adjusted return statistically different
from zero in the 3 years prior takeover.
The adjusted ROS also present slightly better results, prior takeover, for emergent and
developing firms when compared to advanced firms in year -1, although not significant. The
ROS for advanced countries is -1.30%, 0.30% and -0.09% for years -3, -2, and -1, respectively.
Emergent and developing markets firms present ROS values ranging from -4.63% to 3.09%.

31
Table 7: Firms' performance in the three years prior the acquisition: Comparison between
advanced and emergent and developing market acquirers
The table splits the all sample by acquirer’s country development stage: Advanced vs Emergent and developing markets. The table report means and median values of EBIT over book value of assets (ROA) and EBIT over operating sales (ROS), for the three years prior takeover, both measures adjusted. Industry, size and pre-perfor-mance adjusted measures are defined as the raw performance measure for each firm less the performance of a control firm matched according to industry, size and pre-performance, measured in the year prior to takeover. ***, **, * indicates a significant difference using a Wilcoxon signed ranks test at the 1%, 5% and 10% levels, respectively. Source of table: Authors calculations.
Year to acquisition N Advanced N Emergent and developing
Mean (%) Median (%) Mean (%) Median (%)
Panel A: Return on assets adjusted for industry, size, and pre-performance
-3 34 -2.19 ** -1.83 ** 2 -7.64 -7.64
-2 56 1.79 0.27 7 1.73 0.99
-1 197 0.18 0.29 26 1.98 * 0.33
Panel B: Return on sales adjusted for industry, size, and pre-performance
-3 28 -1.87 -1.30 2 -4.63 -4.63
-2 42 -4.81 0.30 7 3.50 3.09
-1 180 -6.01 * -0.09 26 2.41 1.60

32
5. Operating performance following acquisitions: Results
5.1. Change model
5.1.1. Return on assets for the all sample
Table 8 presents results of the change model. Represented we have the median return
on assets (pre, post and change) for the merged firms (1), control firms (2) and the industry,
size, and pre-performance adjusted return on assets (1)-(2). Henceforth, we present only
median figures because when dealing with accounting ratios estimates based on the medians
are more informative (Ghosh, 2001).
Table 8: Change model applied to return on assets measure for the all sample
Sample of 223 European mergers and acquisitions between 2008 and 2014 for completed transactions over 10 million euros obtained from the Amadeus/Zephyr database. Returns on assets (ROA) is calculated as EBIT over book value of assets. Pre-acquisition performance of the merged firm (1) is calculated as a weighted-average of the ROA for the bidder and the target included. The weights are based on the book values of assets of both companies in the year before acquisition. Post-acquisition performance for each deal is measured by ROA of the surviving acquirer after transaction. For control firm construction, we matched firms based on acquiring and target firms’ performance and size one year prior to the acquisition from their respective industries. Pre-acquisition performance of the control firm (2) is measured as weighted-average of the ROA of the two matched firms, being the weights the book value of assets of the two-matched firms. Post-acquisition performances of the control firms are measured as weighted-average of the ROA. The weights are based on the book values of assets of acquirer and target companies, respectively, in the year before acquisition. Industry, size and pre-perfor-mance adjusted measures are defined as the raw performance measure for each firm less the performance of a control firm (1)-(2). Median pre-acquisition performance for merged firm (1) (equally for control firm (2)) is the three-year median ROA of each firm before takeover. Median pre-acquisition performance for industry, size, and pre-performance adjusted is the difference between median pre-acquisition performance of merged firm and control firm. Median post-acquisition perfor-mance follows the same procedures. Median change is equal to median post-acquisition performance minus median pre-acquisition performance. ***, **, * Significant at the 1% / 5% / 10% level. Wilcoxon signed rank test shows that the merged firm’s performance is significantly different from peer performance in the same year. ###, ##, # Significant at the 1% / 5% / 10% level. Wilcoxon signed rank test shows that median post-acquisition performance is significantly different from median pre-acquisition performance. Source of table: Authors calculations.
CHANGE MODEL – RETURN ON ASSETS
N Merged firm
(1)
Control firm
(2)
Industry, size, and
pre-performance adjusted
(1) – (2)
Year to acquisition Median (%) Median (%) Median (%) Positive (%)
Median pre-acquisition performance
(-3 to -1) 223 5.68 5.80 0.31 ** 56.95
1 223 4.33 4.89 0.09 50.76
2 223 4.55 5.15 0.46 51.57
3 223 3.94 4.97 - 0.67 *** 47.98
Median post-acquisition performance
(+1 to +3) 223 4.42 5.08 - 0.18 * 47.98
Median change
(Post – Pre) 223 - 1.28 ### 0.02 - 0.83 ### 45.29
In the 3 years after acquisition merged firms present unadjusted (‘raw’) return on assets
33
ranging from 3.94% to 4.55%, while control firms show ‘raw’ return on assets from 4.97%
to 5.15%. Therefore, the ‘raw’ performance of control firms improved after takeover and
presents higher estimates than merged firms. Since, as one can remember, in the 3 years pre-
event, control firms underperformed in relation to merged firms. However, median change
result is not distinguishable from zero. Yen and André (2007) found similar results.
Concerning merged firms, when we compare the ‘raw’ pre- and post-acquisition per-
formance there is a negative change, significant at 1% level, in operating performance fol-
lowing acquisitions of -1.28%. This result is in line with Powell and Stark (2005) and
Martynova et al. (2007). Both find that, in general, a company’s unadjusted operating perfor-
mance decreases significantly following a merger or acquisition.
To avoid the bias created because of a superior pre-event performance, we compare
the performance of merging firms with those of industry, size and pre-performance matched
firms (Ghosh, 2001). In this case (last column), the results are less straight forward. We only
have a significant deterioration in performance in year +3 of -0.18%. Even so, we can affirm
that adjusted operating performance declines following takeovers. Since the median pre-ac-
quisition performance was positive (0.31%) and significant at 5% level and after takeover
becomes negative (-0.18%), with 10% of significance. At 1% level of significance, our results
show that the change in adjusted performance is negative and equals to -0.83%. This result
is in line with Clark and Ofek (1994), Dickerson et al. (1997), and Kruse et al. (2002) who
report negative results. The results are also partly in line with Martynova et al. (2007), who
document that measures scaled by book value indicate an insignificant decrease in the per-
formance.
5.1.2. Return on assets for advanced and emergent and developing acquirers
Table 9 splits the all sample by acquirer’s country development stage: advanced versus
emergent and developing markets. The table report ‘raw’ and industry, size and pre-perfor-
mance adjusted median values of return on assets measure.
The ‘raw’ performance of advanced acquirers varies between 3.89% and 4.57%.
Whereas adjusted return on assets median values are 0.21, 0.69, and -0.76 for years +1, +2
and +3, respectively, with a significant deterioration in performance in year +3 of -0.76%.
The median change in performance is negative (-1.02%), significant at 1% level, for bench-
mark-unadjusted performance. For adjusted returns on assets the median change in perfor-
mance is also significantly negative (-0.55%). Thus, for acquirers from advanced European
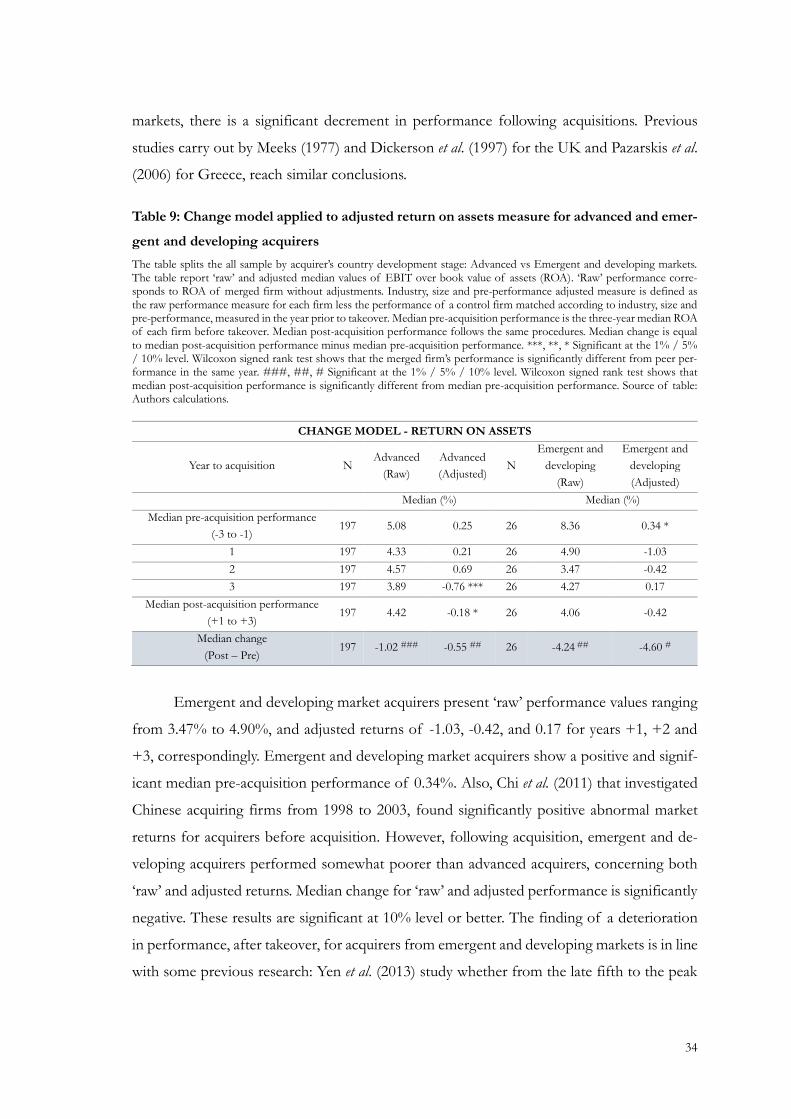
34
markets, there is a significant decrement in performance following acquisitions. Previous
studies carry out by Meeks (1977) and Dickerson et al. (1997) for the UK and Pazarskis et al.
(2006) for Greece, reach similar conclusions.
Table 9: Change model applied to adjusted return on assets measure for advanced and emer-
gent and developing acquirers
The table splits the all sample by acquirer’s country development stage: Advanced vs Emergent and developing markets. The table report ‘raw’ and adjusted median values of EBIT over book value of assets (ROA). ‘Raw’ performance corre-sponds to ROA of merged firm without adjustments. Industry, size and pre-performance adjusted measure is defined as the raw performance measure for each firm less the performance of a control firm matched according to industry, size and pre-performance, measured in the year prior to takeover. Median pre-acquisition performance is the three-year median ROA of each firm before takeover. Median post-acquisition performance follows the same procedures. Median change is equal to median post-acquisition performance minus median pre-acquisition performance. ***, **, * Significant at the 1% / 5% / 10% level. Wilcoxon signed rank test shows that the merged firm’s performance is significantly different from peer per-formance in the same year. ###, ##, # Significant at the 1% / 5% / 10% level. Wilcoxon signed rank test shows that median post-acquisition performance is significantly different from median pre-acquisition performance. Source of table: Authors calculations.
CHANGE MODEL - RETURN ON ASSETS
Year to acquisition N Advanced
(Raw)
Advanced
(Adjusted) N
Emergent and
developing
(Raw)
Emergent and
developing
(Adjusted)
Median (%) Median (%)
Median pre-acquisition performance
(-3 to -1) 197 5.08 0.25 26 8.36 0.34 *
1 197 4.33 0.21 26 4.90 -1.03
2 197 4.57 0.69 26 3.47 -0.42
3 197 3.89 -0.76 *** 26 4.27 0.17
Median post-acquisition performance
(+1 to +3) 197 4.42 -0.18 * 26 4.06 -0.42
Median change
(Post – Pre) 197 -1.02 ### -0.55 ## 26 -4.24 ## -4.60 #
Emergent and developing market acquirers present ‘raw’ performance values ranging
from 3.47% to 4.90%, and adjusted returns of -1.03, -0.42, and 0.17 for years +1, +2 and
+3, correspondingly. Emergent and developing market acquirers show a positive and signif-
icant median pre-acquisition performance of 0.34%. Also, Chi et al. (2011) that investigated
Chinese acquiring firms from 1998 to 2003, found significantly positive abnormal market
returns for acquirers before acquisition. However, following acquisition, emergent and de-
veloping acquirers performed somewhat poorer than advanced acquirers, concerning both
‘raw’ and adjusted returns. Median change for ‘raw’ and adjusted performance is significantly
negative. These results are significant at 10% level or better. The finding of a deterioration
in performance, after takeover, for acquirers from emergent and developing markets is in line
with some previous research: Yen et al. (2013) study whether from the late fifth to the peak
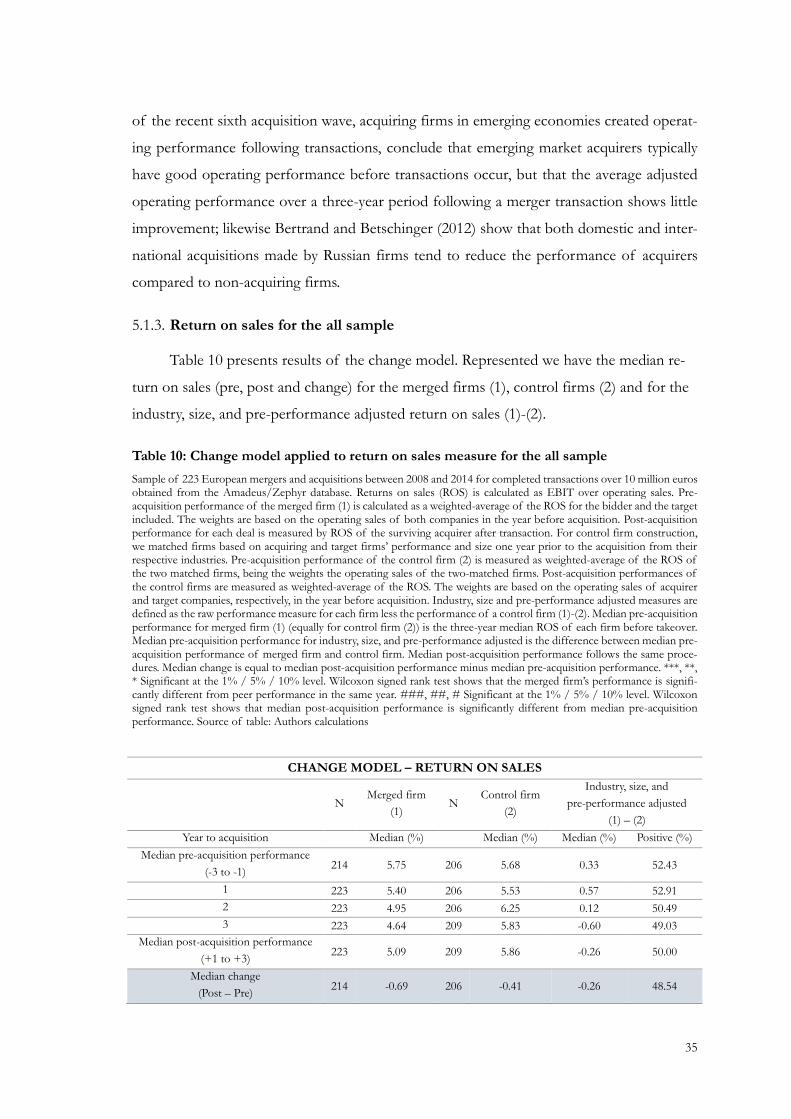
35
of the recent sixth acquisition wave, acquiring firms in emerging economies created operat-
ing performance following transactions, conclude that emerging market acquirers typically
have good operating performance before transactions occur, but that the average adjusted
operating performance over a three-year period following a merger transaction shows little
improvement; likewise Bertrand and Betschinger (2012) show that both domestic and inter-
national acquisitions made by Russian firms tend to reduce the performance of acquirers
compared to non-acquiring firms.
5.1.3. Return on sales for the all sample
Table 10 presents results of the change model. Represented we have the median re-
turn on sales (pre, post and change) for the merged firms (1), control firms (2) and for the
industry, size, and pre-performance adjusted return on sales (1)-(2).
Table 10: Change model applied to return on sales measure for the all sample
Sample of 223 European mergers and acquisitions between 2008 and 2014 for completed transactions over 10 million euros obtained from the Amadeus/Zephyr database. Returns on sales (ROS) is calculated as EBIT over operating sales. Pre-acquisition performance of the merged firm (1) is calculated as a weighted-average of the ROS for the bidder and the target included. The weights are based on the operating sales of both companies in the year before acquisition. Post-acquisition performance for each deal is measured by ROS of the surviving acquirer after transaction. For control firm construction, we matched firms based on acquiring and target firms’ performance and size one year prior to the acquisition from their respective industries. Pre-acquisition performance of the control firm (2) is measured as weighted-average of the ROS of the two matched firms, being the weights the operating sales of the two-matched firms. Post-acquisition performances of the control firms are measured as weighted-average of the ROS. The weights are based on the operating sales of acquirer and target companies, respectively, in the year before acquisition. Industry, size and pre-performance adjusted measures are defined as the raw performance measure for each firm less the performance of a control firm (1)-(2). Median pre-acquisition performance for merged firm (1) (equally for control firm (2)) is the three-year median ROS of each firm before takeover. Median pre-acquisition performance for industry, size, and pre-performance adjusted is the difference between median pre-acquisition performance of merged firm and control firm. Median post-acquisition performance follows the same proce-dures. Median change is equal to median post-acquisition performance minus median pre-acquisition performance. ***, **, * Significant at the 1% / 5% / 10% level. Wilcoxon signed rank test shows that the merged firm’s performance is signifi-cantly different from peer performance in the same year. ###, ##, # Significant at the 1% / 5% / 10% level. Wilcoxon signed rank test shows that median post-acquisition performance is significantly different from median pre-acquisition performance. Source of table: Authors calculations
CHANGE MODEL – RETURN ON SALES
N Merged firm
(1) N
Control firm
(2)
Industry, size, and
pre-performance adjusted
(1) – (2)
Year to acquisition Median (%) Median (%) Median (%) Positive (%)
Median pre-acquisition performance
(-3 to -1) 214 5.75 206 5.68 0.33 52.43
1 223 5.40 206 5.53 0.57 52.91
2 223 4.95 206 6.25 0.12 50.49
3 223 4.64 209 5.83 -0.60 49.03
Median post-acquisition performance
(+1 to +3) 223 5.09 209 5.86 -0.26 50.00
Median change
(Post – Pre) 214 -0.69 206 -0.41 -0.26 48.54
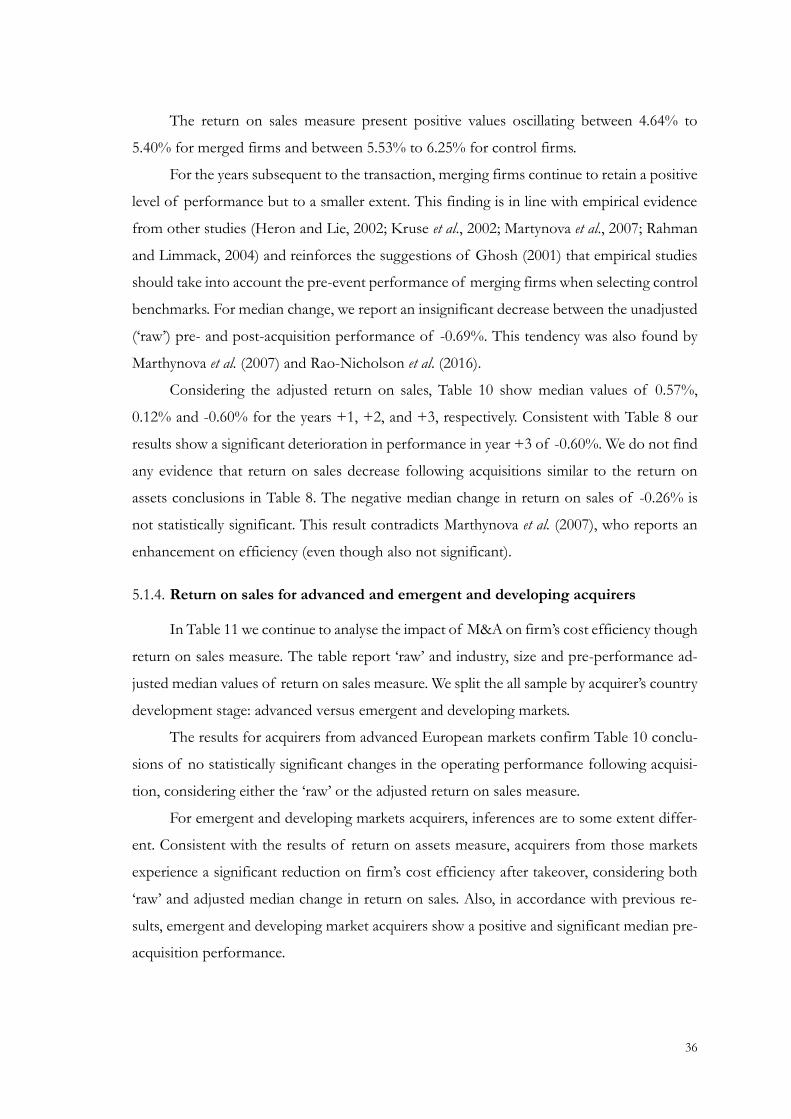
36
The return on sales measure present positive values oscillating between 4.64% to
5.40% for merged firms and between 5.53% to 6.25% for control firms.
For the years subsequent to the transaction, merging firms continue to retain a positive
level of performance but to a smaller extent. This finding is in line with empirical evidence
from other studies (Heron and Lie, 2002; Kruse et al., 2002; Martynova et al., 2007; Rahman
and Limmack, 2004) and reinforces the suggestions of Ghosh (2001) that empirical studies
should take into account the pre-event performance of merging firms when selecting control
benchmarks. For median change, we report an insignificant decrease between the unadjusted
(‘raw’) pre- and post-acquisition performance of -0.69%. This tendency was also found by
Marthynova et al. (2007) and Rao-Nicholson et al. (2016).
Considering the adjusted return on sales, Table 10 show median values of 0.57%,
0.12% and -0.60% for the years +1, +2, and +3, respectively. Consistent with Table 8 our
results show a significant deterioration in performance in year +3 of -0.60%. We do not find
any evidence that return on sales decrease following acquisitions similar to the return on
assets conclusions in Table 8. The negative median change in return on sales of -0.26% is
not statistically significant. This result contradicts Marthynova et al. (2007), who reports an
enhancement on efficiency (even though also not significant).
5.1.4. Return on sales for advanced and emergent and developing acquirers
In Table 11 we continue to analyse the impact of M&A on firm’s cost efficiency though
return on sales measure. The table report ‘raw’ and industry, size and pre-performance ad-
justed median values of return on sales measure. We split the all sample by acquirer’s country
development stage: advanced versus emergent and developing markets.
The results for acquirers from advanced European markets confirm Table 10 conclu-
sions of no statistically significant changes in the operating performance following acquisi-
tion, considering either the ‘raw’ or the adjusted return on sales measure.
For emergent and developing markets acquirers, inferences are to some extent differ-
ent. Consistent with the results of return on assets measure, acquirers from those markets
experience a significant reduction on firm’s cost efficiency after takeover, considering both
‘raw’ and adjusted median change in return on sales. Also, in accordance with previous re-
sults, emergent and developing market acquirers show a positive and significant median pre-
acquisition performance.
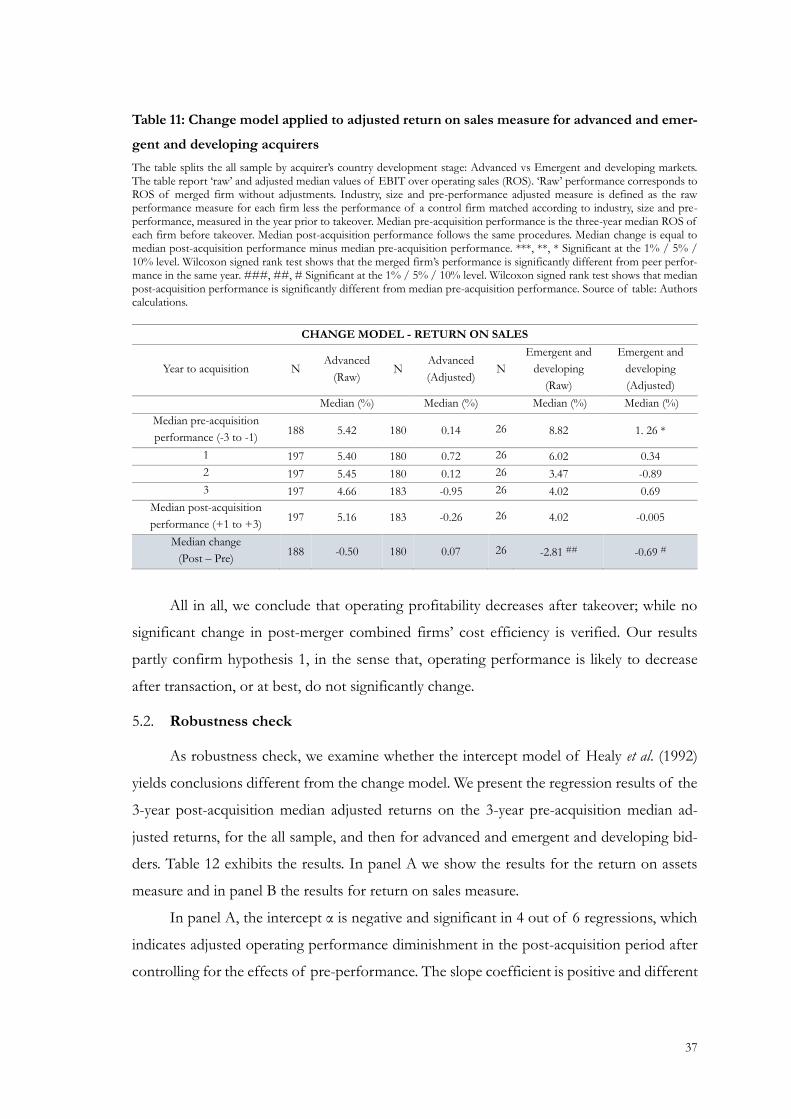
37
Table 11: Change model applied to adjusted return on sales measure for advanced and emer-
gent and developing acquirers
The table splits the all sample by acquirer’s country development stage: Advanced vs Emergent and developing markets. The table report ‘raw’ and adjusted median values of EBIT over operating sales (ROS). ‘Raw’ performance corresponds to ROS of merged firm without adjustments. Industry, size and pre-performance adjusted measure is defined as the raw performance measure for each firm less the performance of a control firm matched according to industry, size and pre-performance, measured in the year prior to takeover. Median pre-acquisition performance is the three-year median ROS of each firm before takeover. Median post-acquisition performance follows the same procedures. Median change is equal to median post-acquisition performance minus median pre-acquisition performance. ***, **, * Significant at the 1% / 5% / 10% level. Wilcoxon signed rank test shows that the merged firm’s performance is significantly different from peer perfor-mance in the same year. ###, ##, # Significant at the 1% / 5% / 10% level. Wilcoxon signed rank test shows that median post-acquisition performance is significantly different from median pre-acquisition performance. Source of table: Authors calculations.
CHANGE MODEL - RETURN ON SALES
Year to acquisition N Advanced
(Raw) N
Advanced
(Adjusted) N
Emergent and
developing
(Raw)
Emergent and
developing
(Adjusted)
Median (%) Median (%) Median (%) Median (%)
Median pre-acquisition
performance (-3 to -1) 188 5.42 180 0.14 26 8.82 1. 26 *
1 197 5.40 180 0.72 26 6.02 0.34
2 197 5.45 180 0.12 26 3.47 -0.89
3 197 4.66 183 -0.95 26 4.02 0.69
Median post-acquisition
performance (+1 to +3) 197 5.16 183 -0.26 26 4.02 -0.005
Median change
(Post – Pre) 188 -0.50 180 0.07 26 -2.81 ## -0.69 #
All in all, we conclude that operating profitability decreases after takeover; while no
significant change in post-merger combined firms’ cost efficiency is verified. Our results
partly confirm hypothesis 1, in the sense that, operating performance is likely to decrease
after transaction, or at best, do not significantly change.
5.2. Robustness check
As robustness check, we examine whether the intercept model of Healy et al. (1992)
yields conclusions different from the change model. We present the regression results of the
3-year post-acquisition median adjusted returns on the 3-year pre-acquisition median ad-
justed returns, for the all sample, and then for advanced and emergent and developing bid-
ders. Table 12 exhibits the results. In panel A we show the results for the return on assets
measure and in panel B the results for return on sales measure.
In panel A, the intercept α is negative and significant in 4 out of 6 regressions, which
indicates adjusted operating performance diminishment in the post-acquisition period after
controlling for the effects of pre-performance. The slope coefficient is positive and different
38
from zero in 4 out of 6 regressions, indicating a positive correlation between the pre- and
post-acquisition operating performance with persistence over time. Thus, for return on assets
performance measure, the intercept model results confirm the change model ones.
Outcomes of panel B, reinforce the change model results of an insignificant change
in firms’ cost efficiency. In all significant regressions, there is a positive correlation between
the pre- and post-acquisition adjusted operating performance with persistence over time.
Consistent with Martynova et al. (2007), Powell and Stark (2005), Ghosh, (2001), Linn
and Switzer (2001), and Switzer (1996), the intercept model gives generally higher absolute
changes in operating performance than the change model, which can be explained by the
structure of the models. The intercept model uses means of the median differences in its
estimations, whereas the change model is based on medians of the median differences, mak-
ing it less sensitive to outliers.
Table 12: Intercept model applied to all sample, and to the comparation between advanced
and emergent and developing acquirers
In panel A, industry, size, and pre-performance adjusted return on assets is the return on assets of merged firms minus those of matched firms, while ‘Raw’ performance corresponds to return on assets of merged firm without adjustments. In panel B, industry, size, and pre-performance adjusted return on sales is the return on sales of merged firms minus those of matched firms, while ‘Raw’ performance corresponds to return on sales of merged firm without adjustments. To test for individual and joint significance of the variables we use a T-test and F-test, respectively. Numbers in parentheses are stand-ard errors. When needed we apply White’s (1980) correction to the standard errors, to correct for an unknown form of heteroscedasticity.
All sample
(Raw) Advanced
(Raw)
Emergent and developing
(Raw)
All sample (Adjusted)
Advanced (Adjusted)
Emergent and developing (Adjusted)
Panel A: Return on assets
α -0.02 * (0.01)
-0.02 * (0.01)
0.03 (0.03)
-0.04 *** (0.01)
-0.03 ** (0.02)
-0.03 (0.02)
β 0.57 *** (0.04)
0.63 *** (0.04)
-0.01 (0.12)
0.25 *** (0.09)
0.32 *** (0.11)
0.02 (0.10)
F-statistic 198.58 *** 233.69 *** 0.02 8.11 *** 9.55 *** 0.03
R2 0.47 0.55 0.001 0.03 0.05 0.001
Panel B: Return on sales
α 0.02
(0.22) 0.03
(0.26) 0.02
(0.06) 0.28
(0.29) 0.33
(0.33) -0.08 (0.05)
β 0.04 ** (0.01)
0.04 ** (0.02)
-0.16 (0.23)
0.01 *** (0.0001)
0.01 *** (0.0001)
-0.16 (0.20)
F-statistic 5.73 ** 5.03 ** 0.47 1269.98 *** 1108.31 *** 0.02
R2 0.03 0.03 0.02 0.86 0.86 0.60
39
6. The determinants of the post-acquisition operating performance
6.1. Univariate analysis
In this section, we investigate which determinants may help to explain post-acquisition
operating performance of merging firms. In a first phase, we test whether acquirer’s firm
characteristics and deal features as means of payment, geographical scope of the deal (do-
mestic versus cross-border M&A), relative size of the target firm, pre-acquisition leverage
and cash holdings of the acquirer, and business expansion strategy (relatedness versus unre-
latedness) influence the post-acquisition performance of the combined firm. In a second
phase, we examine the role of governance (board size, board holdings, independent directors,
CEO duality) and ownership variables (large shareholder holdings) on M&A performance.
As explained in Section 3.6.1, following Martynova et al. (2007), we present predictions of
the median change in the adjusted post-M&A operating performance measures associated
with changes in specific variables. Also, we divide our continuous variables into quartiles and
test for significance of the differences in post-acquisition profitability of the combined firms
across the sub-samples.
Table 13 present the median values of the changes in post-merger operating perfor-
mance determined by deal and firm variables. Our conclusions can be summarized as follow:
Regarding deal variables and in line with previous studies (Healy et al., 1992; Heron
and Lie, 2002; Sharma and Ho, 2002; Powell and Stark, 2005 and Rao-Nicholson et al., 2016),
the adjusted operating performance measures do not differ significantly between cash-fi-
nanced and stock-financed M&A. However, mixed offers are associated with significantly
negative changes in performance (Median ROAί adj
post-M&A). Also, as in Martynova et al. (2007),
the geographic scope of the deal does not lead to statistically significant difference in the
changes in performance. However, the profitability of the combined firm may decrease fol-
lowing domestic takeovers. As well, Martynova et al. (2007) found that although the post-
merger profitability increases with the size of the target, this increase is non-linear. Thus, we
split our sample into quartiles by the relative size of the target firm and we found similar
conclusions. The first quartile ‘small targets’ and the fourth quartile ‘largest targets’ lead to
significant reductions in post-merger efficiency of the combined firm (Median ROSί adj
post-M&A).
For both measure, the relative size of the target is capable of significantly explaining the
changes in performance. The result support the view that larger deviations in firm size leads
to poorer acquisition performance (Loughran and Vijh, 1997; Moeller et al., 2004).

40
Table 13: Univariate analysis for deal and firm variables
This table presents the change in post-merger operating performance driven by firm and deal determinates.
Median ROAί adj
post-M&A/Median ROSί adj
post-M&A is computed as the median return on assets/sales of merged firm in the 3-
years following the takeover date less the median return on assets/sales of the control firm in the same years. Cash is a dummy equal to one when cash is used to pay the entire acquisition price, zero otherwise; Stock is a dummy equal to one when combining firms issue stock to merge; Mix is a dummy equal to one for acquisitions that issue stock in combination with cash; Relative size is the ratio between the size of the target and the size of the acquirer, with size measured by total assets; Cash reserves is the book value of cash and cash equivalents relative to market value of common stock and total debt of acquiring firm before merger; Leverage is the book value of total debt relative to market value of common stock and total debt of acquiring firm before merger; Relatedness4 is a dummy equal to one if target firm and acquiring firm have the same 4-digit NAICS 2017 code; Advanced represents the acquirer country development stage and is a dummy equal to one if the acquirer belongs to an advanced European country and zero otherwise. The four quartiles of relative size are Q1: less than 1.44%; Q2: 1.44%–6.71%; Q3: 6.71%–33.35% and Q4: more than 33.35%; the four quartiles of pre-M&A cash reserves are Q1: less than 3.47%; Q2: 3.47%–8.75%; Q3: 8.75%–19.53% and Q4: more than 19.53%; and the four quartiles of pre-M&A leverage levels are Q1: less than 2.40%; Q2: 2.40%–15.93%; Q3: 15.93%–27.50% and Q4: more than 27.50%. ***, **, * Significant at the 1% / 5% / 10% level. Wilcoxon ranked test was used to test for the statistical significance of the change in operating performance (median post-M&A performance minus median pre-M&A perfor-mance). ###, ##, # Significant at the 1% / 5% / 10% level. To test for statistical significance of the differences in performance measures across the sub-groups. We employ a Mann-Whitney test when 2 sub-groups are compared and a Chi-Square test when more than 2 sub-groups are compared. Source of table: Authors calculations.
𝑴𝒆𝒅𝒊𝒂𝒏 𝑹𝑶𝑨ί 𝒂𝒅𝒋𝒑𝒐𝒔𝒕−𝑴&𝑨
𝑴𝒆𝒅𝒊𝒂𝒏 𝑹𝑶𝑺ί 𝒂𝒅𝒋𝒑𝒐𝒔𝒕−𝑴&𝑨
Deal variables
Cash 0.007 0.003
Stock -0.027 0.003
Mix -0.012 ** -0.021
Difference (H0: Cash=Stock=Mix) No No
Difference (H0: Cash=Mix) No No
Domestic M&A -0.006 ** -0.013
Cross border M&A 0.005 0.010
Difference (H0: Dom=Cross) No No
Relative size Q1 0.001 -0.032 **
Relative size Q2 0.007 0.024
Relative size Q3 0.009 0.025
Relative size Q4 -0.042 *** -0.049 *
Difference (H0: Q1=Q2=Q3=Q4) Yes # Yes ##
Difference (H0: Q1=Q4) Yes # No
Firm variables
Cash reserves Q1 0.003 0.000
Cash reserves Q2 -0.014 -0.032 **
Cash reserves Q3 0.0003 0.007
Cash reserves Q4 0.0003 0.021
Difference (H0: Q1=Q2=Q3=Q4) No No
Difference (H0: Q1=Q4) No No
Leverage Q1 -0.003 0.016
Leverage Q2 -0.007 0.007
Leverage Q3 0.005 -0.003
Leverage Q4 -0.001 -0.022 *
Difference (H0: Q1=Q2=Q3=Q4) No No
Difference (H0: Q1=Q4) No No
Relatedness 0.0001 0.002
Unrelatedness -0.024 -0.021 *
Difference (H0: Relat=Unrelat) No Yes #
Advanced -0.002 -0.003
Emergent and developing -0.004 -0.000
Difference (H0: Adv=Emer) No No
Concerning firm characteristics, we divided the amount of cash reserves held by the
acquirer prior to acquisition into quartiles, because early evidence suggests that acquisitions
41
by cash-rich companies lead to declines in the operating performance of the combined firm
(Jensen, 1986; Harford, 1999). Even though not significantly, our results show that acquirers
with higher cash reserves experience better long-term performance. A possible explanation
is that managers of cash-rich firms often benefit from having cash reserves which cost less
than external financing to fund large projects thereby leading to better M&A performance
(Sun and Tong, 2003). Following, we divide our sample into quartiles by the acquirers’ pre-
acquisition leverage, in order to confirm the bank monitoring rationale which says that highly
leveraged acquirers outperform low leveraged acquirers due to better creditor monitoring
(Ghosh and Jain, 2000). In line with Martynova et al. (2007) higher levels of pre-acquisition
leverage do not lead to higher post-acquisition profitability. Regarding business expansion
strategy, related acquisition strategy leads to a significant different performance of the com-
bined firm than the diversification strategy. Also, diversification may impact negatively the
cost efficiency of the merged firm following the takeover. Our results are in accordance with
Healy et al. (1992) and Heron and Lie (2002).
Finally, the fact that the acquirer belongs to an advanced or to an emergent and devel-
oping market do not significantly explain the changes in post-merger performance.
Now we analyse the changes in post-merger operating performance driven by owner-
ship, governance and country determinants. As previous, continuous variables are divided
into quartiles to find out nonlinear effects of such variables in post-acquisition performance.
The median changes in operating performance determined by each variable are pre-
sented in Table 14.
Yen and André (2007) claimed that the relationship between concentrated ownership
and the level and change in operating cash flow returns after takeovers is non-linear. Thus,
we divided our ownership variable (Large shareholder holdings) into quartiles. The percent-
age of voting shares held by the largest shareholder is capable of significantly explain the
changes in post-merger performance. Lower levels of concentration are associated with sig-
nificant reductions in post-M&A operating performance. The results reinforce early evidence
that ownership concentration provides an efficient way of resolving agency problems and
consequently increases M&A performance (Xu and Wang, 1999; Claessens et al., 2000).
With respect to governance variables, as the percentage of independent directors on
the board of directors (Independent directors) increases it is more likely a negative effect on
post-merger performance. Results show a significant difference in post-M&A operating per-
formance between the first quartile (low proportion of independent directors on the board)
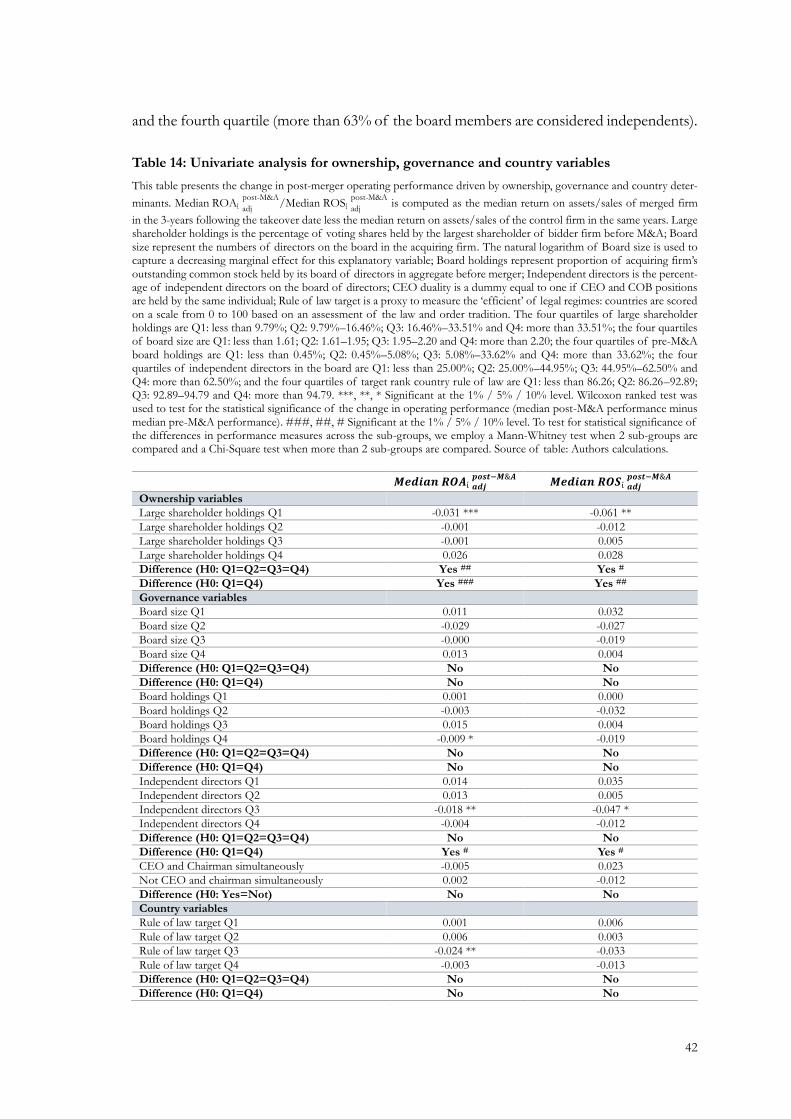
42
and the fourth quartile (more than 63% of the board members are considered independents).
Table 14: Univariate analysis for ownership, governance and country variables
This table presents the change in post-merger operating performance driven by ownership, governance and country deter-
minants. Median ROAί adj
post-M&A/Median ROSί adj
post-M&A is computed as the median return on assets/sales of merged firm
in the 3-years following the takeover date less the median return on assets/sales of the control firm in the same years. Large shareholder holdings is the percentage of voting shares held by the largest shareholder of bidder firm before M&A; Board size represent the numbers of directors on the board in the acquiring firm. The natural logarithm of Board size is used to capture a decreasing marginal effect for this explanatory variable; Board holdings represent proportion of acquiring firm’s outstanding common stock held by its board of directors in aggregate before merger; Independent directors is the percent-age of independent directors on the board of directors; CEO duality is a dummy equal to one if CEO and COB positions are held by the same individual; Rule of law target is a proxy to measure the ‘efficient’ of legal regimes: countries are scored on a scale from 0 to 100 based on an assessment of the law and order tradition. The four quartiles of large shareholder holdings are Q1: less than 9.79%; Q2: 9.79%–16.46%; Q3: 16.46%–33.51% and Q4: more than 33.51%; the four quartiles of board size are Q1: less than 1.61; Q2: 1.61–1.95; Q3: 1.95–2.20 and Q4: more than 2.20; the four quartiles of pre-M&A board holdings are Q1: less than 0.45%; Q2: 0.45%–5.08%; Q3: 5.08%–33.62% and Q4: more than 33.62%; the four quartiles of independent directors in the board are Q1: less than 25.00%; Q2: 25.00%–44.95%; Q3: 44.95%–62.50% and Q4: more than 62.50%; and the four quartiles of target rank country rule of law are Q1: less than 86.26; Q2: 86.26–92.89; Q3: 92.89–94.79 and Q4: more than 94.79. ***, **, * Significant at the 1% / 5% / 10% level. Wilcoxon ranked test was used to test for the statistical significance of the change in operating performance (median post-M&A performance minus median pre-M&A performance). ###, ##, # Significant at the 1% / 5% / 10% level. To test for statistical significance of the differences in performance measures across the sub-groups, we employ a Mann-Whitney test when 2 sub-groups are compared and a Chi-Square test when more than 2 sub-groups are compared. Source of table: Authors calculations.
𝑴𝒆𝒅𝒊𝒂𝒏 𝑹𝑶𝑨ί 𝒂𝒅𝒋
𝒑𝒐𝒔𝒕−𝑴&𝑨 𝑴𝒆𝒅𝒊𝒂𝒏 𝑹𝑶𝑺ί 𝒂𝒅𝒋
𝒑𝒐𝒔𝒕−𝑴&𝑨
Ownership variables
Large shareholder holdings Q1 -0.031 *** -0.061 **
Large shareholder holdings Q2 -0.001 -0.012
Large shareholder holdings Q3 -0.001 0.005
Large shareholder holdings Q4 0.026 0.028
Difference (H0: Q1=Q2=Q3=Q4) Yes ## Yes #
Difference (H0: Q1=Q4) Yes ### Yes ##
Governance variables
Board size Q1 0.011 0.032
Board size Q2 -0.029 -0.027
Board size Q3 -0.000 -0.019
Board size Q4 0.013 0.004
Difference (H0: Q1=Q2=Q3=Q4) No No
Difference (H0: Q1=Q4) No No
Board holdings Q1 0.001 0.000
Board holdings Q2 -0.003 -0.032
Board holdings Q3 0.015 0.004
Board holdings Q4 -0.009 * -0.019
Difference (H0: Q1=Q2=Q3=Q4) No No
Difference (H0: Q1=Q4) No No
Independent directors Q1 0.014 0.035
Independent directors Q2 0.013 0.005
Independent directors Q3 -0.018 ** -0.047 *
Independent directors Q4 -0.004 -0.012
Difference (H0: Q1=Q2=Q3=Q4) No No
Difference (H0: Q1=Q4) Yes # Yes #
CEO and Chairman simultaneously -0.005 0.023
Not CEO and chairman simultaneously 0.002 -0.012
Difference (H0: Yes=Not) No No
Country variables
Rule of law target Q1 0.001 0.006
Rule of law target Q2 0.006 0.003
Rule of law target Q3 -0.024 ** -0.033
Rule of law target Q4 -0.003 -0.013
Difference (H0: Q1=Q2=Q3=Q4) No No
Difference (H0: Q1=Q4) No No

43
The remaining governance variables are not capable of significantly explain the
changes on operating performance after takeover.
Regarding our legal variable which rank the rule of law in the target country, results
show that post-merger operating performance is negative for higher ranks. Also, Mateev and
Andonov (2016) found that cross-border bidding firms tend to experience lower announce-
ment returns when targets are located in countries (the UK/Ireland in their case) with
stronger investor protection mechanisms.
6.2. Cross-sectional analysis of operating performance changes following corporate
mergers
Following we explore the combined effect of the determinants of the post-M&A op-
erating performance in a multivariate framework. Table 15 presents the coefficient estimates
from the cross-sectional analysis for each performance measure and for combinations of the
deal and firm independent variables. The dependent variables (
Median ROAi adj
post-M&A and Median ROSi adj
post-M&A) are the post-M&A adjusted operating perfor-
mance measures. Pre-acq. adj. performance is the corresponding pre-M&A performance. We
can see that all models are significant and that R2 are between 15% and 89%.
The results of the change and intercept model presented in section 5 showed that a
company’s post-acquisition performance is generally lower than its pre-acquisition operating
performance. The results of the intercepts of Table 15 support such statement. Also, Table
15 show that pre-acquisition operating performance and post-acquisition operating perfor-
mance are positively related (all the coefficients are significant at 1% level), which is in ac-
cordance with intercept model conclusions of section 5.
In models (1) and (3) we analyse the change in post-M&A adjusted operating perfor-
mance measures, determined by the combined effect of the explanatory variables, without
interaction terms. In turn, models (2) and (4) report coefficient estimates including advanced
interaction terms (indicated in bold). Advanced represents the acquirer country development
stage and is a dummy equal to one if the acquirer belongs to an advanced European country
and zero otherwise.
Concerning deal characteristics our main conclusions are:
First, an acquirer who chooses only cash to pay the entire acquisition price (Cash),
experience a significant improvement in profitability after the takeover (column 1). This re-
sult confirms our hypothesis 2 and is in line with previous studies (see e.g., Linn and Switzer,

44
2001; Ghosh, 2001; Moeller and Schlingemann, 2004). Besides, there is no difference in the
impact of Cash as a mean of payment on post-merger operating performance between coun-
try development stages. For emergent and developing markets it is expected that cash-only
transactions will enhance the post-merger profitability. Boateng et al. (2017) found similar
results for their sample of Chinese firms.
Conversely, when emergent and developing combined firms issue stock in combina-
tion with cash to merge (Mix), they felt a significant reduction in adjusted return on sales
after takeover. Mix as a mean of payment do not lead to differences in firms’ post-M&A cost
efficiency between advanced and emergent and developing acquirers.
Second, the impact on post-M&A operating profitability of geographical diversifica-
tion (Cross border) is significantly different between advanced and emergent and developing
markets; and for emergent and developing markets the impact will be significantly negative.
Accordingly, for emergent and developing markets the option of acquiring a target from a
different country, lead to a decrease in firms’ post-merger cost efficiency. However, there is
no difference, in terms of post-M&A cost efficiency, between advanced and emergent and
developing markets. Our results for emergent and developing markets, confirm that cross-
border post-acquisition performance may decrease, due to difficulties in capturing the ex-
pected synergies, resulting from cultural and regulatory differences between the acquirer and
target, as claimed by Schoenberg (2000). Thus, our hypothesis 3 is partially confirmed.
Third, considering the model without interactions, it is expected an increase in post-
merger adjusted return on assets as the relative size of the target (Relative size) increases; as
it was in other studies (e.g., Switzer, 1996; Linn and Switzer, 2001). Since we theorize no
impact of Relative size on post-merger performance, this result rejects our hypothesis 4.
Now, regarding the models with advanced interactions terms, it is possible to conclude that
there is no difference in the impact of the increasing size of the target on firms’ post-merger
cost efficiency among acquirers from different country development stages. Merged firms
from emergent and developing markets experienced a reduction on post-merger efficiency
as the relative size of the target increases. Managers of bidding firms from these markets
may find it more difficult to assimilate large targets (Clark and Ofek, 1994). Another expla-
nation is that, as we showed in section 4.1., acquirers from emergent and developing markets
tend to choose target firms from countries even less developed than theirs, normally with
high bureaucracy cost, and the growing size of a company engaged in M&A could enhance
such costs (Bertrand and Betschinger, 2012).

45
Table 15: Determinants of operating performance changes following corporate mergers: deal
and firm specific determinants
Median ROAί adj
post-M&A/Median ROSί adj
post-M&A is computed as the median return on assets/sales of merged firm in the 3-
years following the takeover date less the median return on assets/sales of the control firm in the same years. Pre-acq. adj.
performance is equal to Median ROAi adj
pre-M&A/Median ROSi adj
pre-M&Aand is the return on assets/sale of merged firm in the
3-years after takeover less the return on assets of the matched company at the same time for models. Cash is a dummy equal to one when cash is used to pay the entire acquisition price, zero otherwise; Mix is a dummy equal to one for acqui-sitions that issue stock in combination with cash; Relative size is the ratio between the size of the target and the size of the acquirer, with size measured by total assets; Cash reserves is the book value of cash and cash equivalents relative to market value of common stock and total debt of acquiring firm before merger; Leverage is the book value of total debt relative to market value of common stock and total debt of acquiring firm before merger; Relatedness4 is a dummy equal to one if target firm and acquiring firm have the same 4-digit NAICS 2017 code; Advanced represents the acquirer country devel-opment stage and is a dummy equal to one if the acquirer belongs to an advanced European country and zero otherwise. ***, **, * Values significantly different from zero at the 1%, 5%, and 10% levels, respectively. To test for individual and joint significance of the variables we use a T-test and F-test, respectively. Numbers in parentheses are standard errors. When needed we apply White’s (1980) correction to the standard errors, to correct for an unknown form of heteroscedasticity.
Median ROAi adj
post-M&A Median ROSi adj
post-M&A
(1) (2) (3) (4)
Intercept -0.144 ** (0.069)
-0.011 (0.041)
-1.062 (1.453)
-0.068 *** (0.024)
Advanced -0.035 (0.056)
-0.182 * (0.103)
0.588 (1.170)
-0.407 (0.663)
Pre-acq. adj. performance 0.301 *** (0.104)
1.172 *** (0.306)
0.005 *** (0.000)
0.609 *** (0.160)
Advanced*Pre-acq. adj. performance
-0.871 ** (0.378)
-0.604 ***
(0.160)
Deal variables
Cash (dummy) 0.088 * (0.049)
0.102 *** (0.031)
-0.565 (1.056)
0.057 ** (0.025)
Advanced*Cash -0.010 (0.073)
-0.802 (0.686)
Mix (dummy) 0.025
(0.043) -0.044 (0.032)
-0.250 (0.908)
-0.160 *** (0.028)
Advanced*Mix 0.074
(0.071)
-0.171 (0.991)
Cross border (dummy) 0.007
(0.035) -0.117 ***
(0.037) -0.696 (0.771)
-0.070 *** (0.025)
Advanced*Cross border 0.126 ** (0.053)
-0.678 (0.609)
Relative size 0.057 *** (0.017)
-0.011 (0.046)
-0.234 (0.488)
-0.198 *** (0.045)
Advanced*Relative size 0.069
(0.062)
-0.032 (0.511)
Firm variables
Cash reserves 0.171 * (0.096)
0.150 (0.118)
1.119 (2.158)
0.363 *** (0.071)
Advanced*Cash reserves 0.031
(0.216)
0.841 (2.141)
Leverage 0.084
(0.083) -0.324 ***
(0.067) -0.053 (1.770)
-0.411 *** (0.084)
Advanced*Leverage 0.427 ***
(0.093)
0.408 (0.779)
Relatedness4 (dummy) 0.043
(0.037) 0.045
(0.036) 1.564 * (0.790)
0.202 *** (0.029)
Advanced*Relatedness 0.002
(0.056)
1.475 ** (0.723)
Observations 167 167 154 154
F-statistic 3.138 *** 1.665 * 135.104 *** 67.807 ***
Adjusted R-squared 0.152 0.159 0.887 0.885
46
Regarding acquirers’ firm characteristics Table 15 allow us the following conclusions:
The relative amount of cash reserves held by the acquirer prior to acquisition (Cash
reserves) has a positive and significant impact in post-merger adjusted return on assets (col-
umn 1). Even though, the results are in line with our univariate analysis, they contradict our
hypothesis 5. Moreover, the impact of the level of cash reserves prior takeover on firms’
post-merger cost efficiency do not differ between advanced and emergent and developing
markets. In emergent and developing markets cash-rich firms experience a positive and sig-
nificant effect on post-merger efficiency.
Additionally, the effect on post-merger adjusted return on assets of the pre-M&A lev-
els of leverage of the acquirer (Leverage) is significantly different between advanced and
emergent and developing markets. Acquirers from emergent and developing markets with
high levels of leverage prior takeover, experience a significantly reduction on post-merger
adjusted return on assets. Regarding the impact of the pre-M&A levels of leverage of the
acquirer on firms’ post-merger cost efficiency, it is expected a reduction for emergent and
developing markets acquirers, while there is no difference in the impact of such variable
considering different country development stages. In a recent study Mateev and Andonov
(2016) also show that acquirer’s pre-M&A levels of leverage affect negatively the cumulative
abnormal returns of 38 European M&As in the period 2003–2010. Even though, the result
is in line with univariate analysis, our hypothesis 5 is not confirmed.
Lastly, we confirm our hypothesis 6, when the acquirer and the target are from the
same industry (Relatedness4) it is expected a significant increase in post-merger operating
performance; Healy et al. (1992) and Heron and Lie (2002) found similar conclusions. These
results are in accordance with univariate analysis conclusions and confirms our hypothesis 6.
Furthermore, the positive effect of industry-related transactions on firms’ post-merger effi-
ciency in advanced markets will be higher than in emergent and developing markets, where
it is significantly positive.
The determinants of Table 15 have been broadly used in an attempt to explain the
differences in post-merger operating performance (see e.g., Healy et al., 1992; Ghosh, 2001;
Linn and Switzer, 2001; Sharma and Ho, 2002; Powell and Stark, 2005; Martynova et al.,
2007). However, more recently, researches start to analyse how corporate governance profiles
of acquiring firms directly influence operating performance outcomes of merger decisions
(e.g., Carline et al., 2009; Yen et al., 2013; Boateng et al., 2017). As many merger hypotheses

47
are either unrelated to or likely to be insufficiently tested by only a set of corporate govern-
ance factors, we unify and re-examine many of the prior results in the literature.
Thus, Table 16 reports regression results for our two operating performance measures
on ownership structure and governance mechanisms after controlling for firm and transac-
tion characteristics, and country variable which may also affect bidder post-merger operating
performance. All models were significant and had adjusted R2 values between 20.3% and
88.2%. Table 16 follows the same structure as Table 15: Models with odd numbers report
coefficient estimates without interaction between variables, and even-numbered models re-
port the results including advanced interaction terms. Our main inferences are:
Firstly, as in Table 15, pre-acquisition operating performance and post-acquisition op-
erating performance are positively related (all coefficients are significant at 1% level).
Secondly, the effect of higher levels of ownership concentration (Large shareholder
holdings) on post-takeover adjusted return on assets is significantly different between ad-
vanced and emergent and developing markets. As the percentage of voting shares in the
hands of the acquirers’ largest shareholder increases, it is expected a deterioration in post-
M&A performance of emergent and developing markets. A possible explanation for this
result is that there might be a conflict of interest between majority shareholders and minority
shareholders caused by wealth transfer from minority shareholders to controlling sharehold-
ers through takeovers (Detthamrong et al., 2017). The results do not allow the confirmation
of our hypothesis 7.
Thirdly, the size of the acquiring firm’s board (Board size) has a positive and significant
association with the operating performance effects of corporate mergers concerning emer-
gent and developing markets. Dalton et al. (1999) and Pearce and Zahra (1992) argue that a
larger board will have representation of people with diverse backgrounds, who bring
knowledge and intellect to the board and thus improve the quality of strategic decisions. An
alternative explanation is that larger boards could consist of more outsiders who make care-
ful decision-making policy in firms since the reputation cost, if the firm fails, is likely to be
high in comparison with their private benefit if a project turns out to be profitable (Eisenberg
et al., 1998). In addition, the impact of large boards in advanced markets is significantly dif-
ferent from the effect of such variable in emergent and developing markets. The results for
emergent and developing markets allow the confirmation of our hypothesis 8.
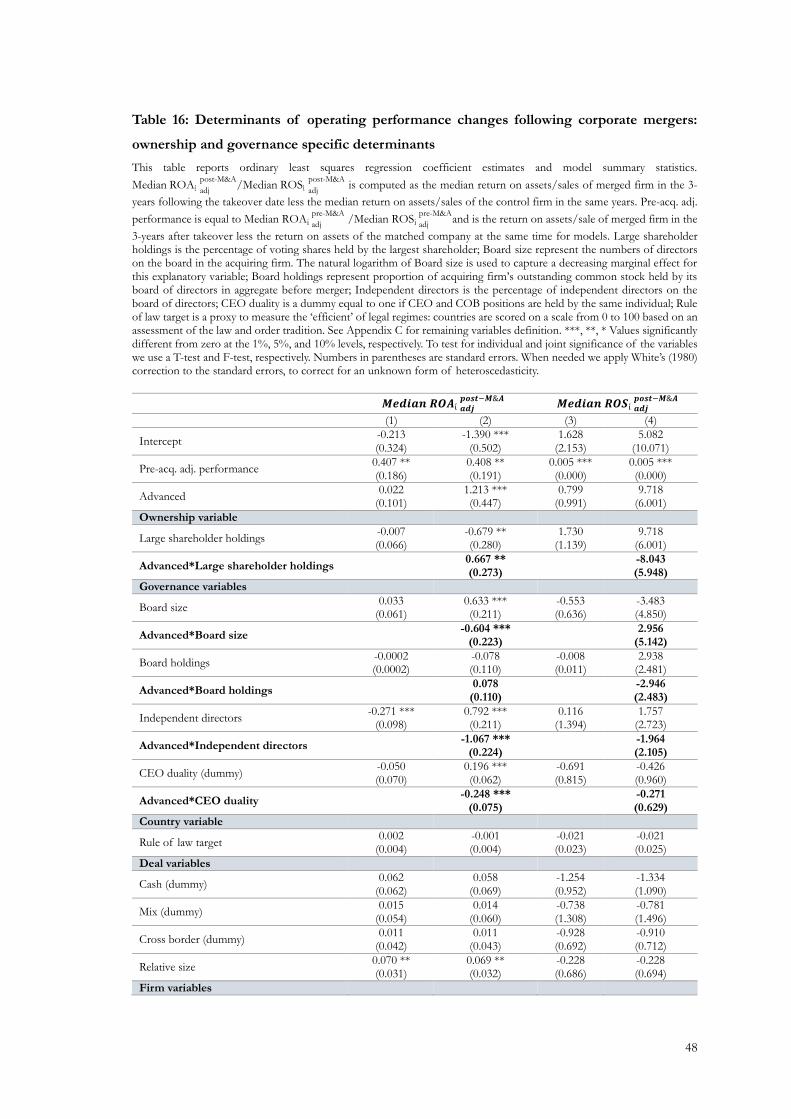
48
Table 16: Determinants of operating performance changes following corporate mergers:
ownership and governance specific determinants
This table reports ordinary least squares regression coefficient estimates and model summary statistics.
Median ROAί adj
post-M&A/Median ROSί adj
post-M&A is computed as the median return on assets/sales of merged firm in the 3-
years following the takeover date less the median return on assets/sales of the control firm in the same years. Pre-acq. adj.
performance is equal to Median ROAi adj
pre-M&A /Median ROSi adj
pre-M&Aand is the return on assets/sale of merged firm in the
3-years after takeover less the return on assets of the matched company at the same time for models. Large shareholder holdings is the percentage of voting shares held by the largest shareholder; Board size represent the numbers of directors on the board in the acquiring firm. The natural logarithm of Board size is used to capture a decreasing marginal effect for this explanatory variable; Board holdings represent proportion of acquiring firm’s outstanding common stock held by its board of directors in aggregate before merger; Independent directors is the percentage of independent directors on the board of directors; CEO duality is a dummy equal to one if CEO and COB positions are held by the same individual; Rule of law target is a proxy to measure the ‘efficient’ of legal regimes: countries are scored on a scale from 0 to 100 based on an assessment of the law and order tradition. See Appendix C for remaining variables definition. ***, **, * Values significantly different from zero at the 1%, 5%, and 10% levels, respectively. To test for individual and joint significance of the variables we use a T-test and F-test, respectively. Numbers in parentheses are standard errors. When needed we apply White’s (1980) correction to the standard errors, to correct for an unknown form of heteroscedasticity.
𝑴𝒆𝒅𝒊𝒂𝒏 𝑹𝑶𝑨ί 𝒂𝒅𝒋
𝒑𝒐𝒔𝒕−𝑴&𝑨 𝑴𝒆𝒅𝒊𝒂𝒏 𝑹𝑶𝑺ί 𝒂𝒅𝒋
𝒑𝒐𝒔𝒕−𝑴&𝑨
(1) (2) (3) (4)
Intercept -0.213 (0.324)
-1.390 *** (0.502)
1.628 (2.153)
5.082 (10.071)
Pre-acq. adj. performance 0.407 ** (0.186)
0.408 ** (0.191)
0.005 *** (0.000)
0.005 *** (0.000)
Advanced 0.022
(0.101) 1.213 *** (0.447)
0.799 (0.991)
9.718 (6.001)
Ownership variable
Large shareholder holdings -0.007 (0.066)
-0.679 ** (0.280)
1.730 (1.139)
9.718 (6.001)
Advanced*Large shareholder holdings 0.667 ** (0.273)
-8.043 (5.948)
Governance variables
Board size 0.033
(0.061) 0.633 *** (0.211)
-0.553 (0.636)
-3.483 (4.850)
Advanced*Board size -0.604 ***
(0.223)
2.956 (5.142)
Board holdings -0.0002 (0.0002)
-0.078 (0.110)
-0.008 (0.011)
2.938 (2.481)
Advanced*Board holdings 0.078
(0.110)
-2.946 (2.483)
Independent directors -0.271 ***
(0.098) 0.792 *** (0.211)
0.116 (1.394)
1.757 (2.723)
Advanced*Independent directors -1.067 ***
(0.224)
-1.964 (2.105)
CEO duality (dummy) -0.050 (0.070)
0.196 *** (0.062)
-0.691 (0.815)
-0.426 (0.960)
Advanced*CEO duality -0.248 ***
(0.075)
-0.271 (0.629)
Country variable
Rule of law target 0.002
(0.004) -0.001 (0.004)
-0.021 (0.023)
-0.021 (0.025)
Deal variables
Cash (dummy) 0.062
(0.062) 0.058
(0.069) -1.254 (0.952)
-1.334 (1.090)
Mix (dummy) 0.015
(0.054) 0.014
(0.060) -0.738 (1.308)
-0.781 (1.496)
Cross border (dummy) 0.011
(0.042) 0.011
(0.043) -0.928 (0.692)
-0.910 (0.712)
Relative size 0.070 ** (0.031)
0.069 ** (0.032)
-0.228 (0.686)
-0.228 (0.694)
Firm variables
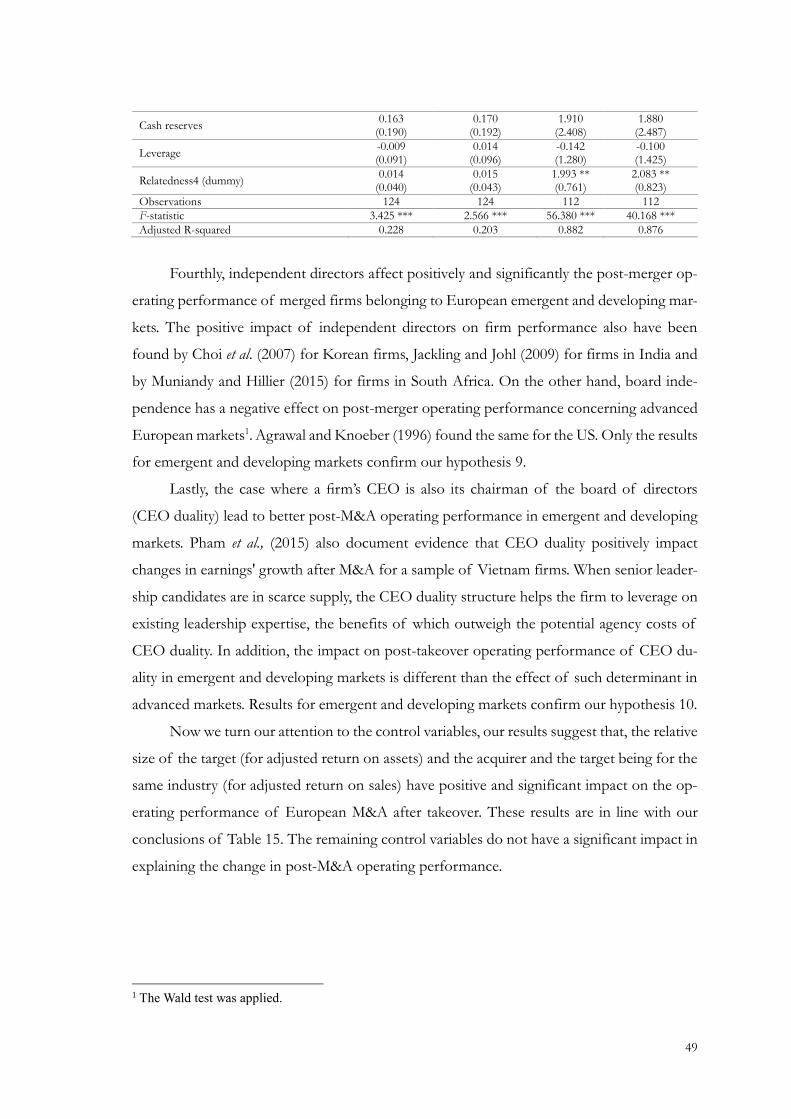
49
Cash reserves 0.163
(0.190) 0.170
(0.192) 1.910
(2.408) 1.880
(2.487)
Leverage -0.009 (0.091)
0.014 (0.096)
-0.142 (1.280)
-0.100 (1.425)
Relatedness4 (dummy) 0.014
(0.040) 0.015
(0.043) 1.993 ** (0.761)
2.083 ** (0.823)
Observations 124 124 112 112
F-statistic 3.425 *** 2.566 *** 56.380 *** 40.168 ***
Adjusted R-squared 0.228 0.203 0.882 0.876
Fourthly, independent directors affect positively and significantly the post-merger op-
erating performance of merged firms belonging to European emergent and developing mar-
kets. The positive impact of independent directors on firm performance also have been
found by Choi et al. (2007) for Korean firms, Jackling and Johl (2009) for firms in India and
by Muniandy and Hillier (2015) for firms in South Africa. On the other hand, board inde-
pendence has a negative effect on post-merger operating performance concerning advanced
European markets1. Agrawal and Knoeber (1996) found the same for the US. Only the results
for emergent and developing markets confirm our hypothesis 9.
Lastly, the case where a firm’s CEO is also its chairman of the board of directors
(CEO duality) lead to better post-M&A operating performance in emergent and developing
markets. Pham et al., (2015) also document evidence that CEO duality positively impact
changes in earnings' growth after M&A for a sample of Vietnam firms. When senior leader-
ship candidates are in scarce supply, the CEO duality structure helps the firm to leverage on
existing leadership expertise, the benefits of which outweigh the potential agency costs of
CEO duality. In addition, the impact on post-takeover operating performance of CEO du-
ality in emergent and developing markets is different than the effect of such determinant in
advanced markets. Results for emergent and developing markets confirm our hypothesis 10.
Now we turn our attention to the control variables, our results suggest that, the relative
size of the target (for adjusted return on assets) and the acquirer and the target being for the
same industry (for adjusted return on sales) have positive and significant impact on the op-
erating performance of European M&A after takeover. These results are in line with our
conclusions of Table 15. The remaining control variables do not have a significant impact in
explaining the change in post-M&A operating performance.
1 The Wald test was applied.
50
7. Conclusions
The empirical evidence on changes in post-acquisition operating performance is rela-
tively scarce in comparation with the research on the stock price performance. Even consid-
ering the few studies about post-merger operating performance, it is not possibly to confirm
that they are ‘culture free’, since most of the empirical evidence is from US and UK. Also,
conclusions are contradictory. Differences in the measurement of profitability and in the
choice of the correct peer-companies is partly responsible for the inconsistency in conclu-
sions across studies.
This dissertation contributes to the literature on mergers and acquisitions by investi-
gating post-M&A performance of European companies over 2008–2014. Using two
measures of adjusted operating performance and conducting both univariate and multivari-
ate analyses, we find a deterioration of post-M&A performance of the combined firms as
measured by the return on assets. This result is consistent with previous studies where au-
thors find a harmful impact of M&A activity (Hogarty, 1970; Franks et al., 1988; Clark and
Ofek, 1994; Dickerson et al., 1997; Sharma and Ho, 2002; Yeh and Hoshino, 2002; Pazarskis
et al., 2006; Bertrand and Betschinger, 2012). Furthermore, in line with Martynova et al.
(2007), the intercept model documents higher absolute changes in operating performance
than the change model.
When we split the sample by country development stage, our results show interesting
conclusions. Advanced markets experienced a significant reduction on post-merger adjusted
returns on assets, while no significant change was observed with respect to firms’ cost effi-
ciency after takeover. Consistent with Chi et al. (2011) and Yen et al. (2013) emergent and
developing market acquirers show a positive and significant median pre-acquisition perfor-
mance. However, after acquisition, acquirers from these markets suffer a significant decrease
in post-merger operating performance, considering both profitability and cost efficiency.
Our cross-sectional analysis of operating performance changes following corporate
mergers confirmed our change model results. That is, a company’s post-acquisition perfor-
mance is generally lower than its pre-acquisition operating performance, and pre-acquisition
operating performance and post-acquisition operating performance are positively related. We
find that post-merger operating performance changes are also strongly determined by some
factors. Regression results show that post-merger profitability of emergent and developing
market acquirers is enhance by cash-only as a method of payment for acquisition. Moreover,

51
merged firms’ post-M&A cost efficiency is adversely affected when a mix of securities is the
method of payment, when the acquirer chooses a target from a different country, when the
size of the firm being acquired increases relative to the acquiring firm; and when the acquirer
has high levels of pre-M&A leverage. In turn, emergent and developing acquirers that have
high pre-M&A cash reserves and that prefer to acquire targets from the same industry expe-
rience improvements on firms’ post-merger cost efficiency. For advanced market acquirers,
we can significantly conclude that the positive effect of industry-related transactions on
firms’ post-merger efficiency in advanced markets will be higher than in emergent and de-
veloping markets, where it is significantly positive.
It is surprising that, in spite of the intensity of focus on the association between cor-
porate governance and managerial decisions practically no attention has been devoted to how
corporate governance directly impacts the operating performance effects of mergers
(Thenmozhi and Narayanan, 2016). Thus, we explicitly examining how corporate governance
characteristics of acquiring firms impact merger performance. We find that operating per-
formance outcomes are worse when the emergent and developing acquiring firm has a large
equity holder. While governance variables such as a large board, high proportion of outside
independent directors on acquirers’ board composition, and Chairman-CEO duality are ex-
pected to enhance operating performance after takeover. Regarding advanced markets, our
results show a negative effect drive by acquirers’ board be composed by a large proportion
of outside independent directors.
Lastly, the impact on post-takeover operating performance of the method of payment,
the relative size of the target, acquirers’ pre-M&A cash reserves, and pre-M&A acquirers’
board holdings, do not differ between advanced and emergent and developing markets. For
the remaining factors the effect on post-merger operating performance do differ between
acquirers’ country development stage.
This dissertation, however, has some limitations that should be taken in consideration
when interpreting the findings. The relatively small size of European emergent and develop-
ing acquirers presented in our sample; which was driven by restrictions in deal size, and the
fact that we only considered final acquisition stakes of 100%. Also, the use of EBIT instead
of EBITDA. We were forced to use EBIT as measure of operating performance, due to the
limited availability of EBITDA data for privately held acquirers.
Finally, this dissertation can be extended for future research, specifically increasing the
sample size of European emergent and developing markets to obtain more robust results.
52
References
Adams, R. B., Almeida, H., & Ferreira, D. (2005). Powerful CEOs and their impact on corporate performance. Review of Financial Studies. https://doi.org/10.1093/rfs/hhi030
Agrawal, A., & Knoeber, C. R. (1996). Firm Performance and Mechanisms to Control Agency Problems between Managers and Shareholders. The Journal of Financial and Quantitative Analysis. https://doi.org/10.2307/2331397
Amar, W. Ben, Boujenoui, A., & Francoeur, C. (2011). CEO attributes, board composition, and acquirer value creation: A Canadian study. Canadian Journal of Administrative Sciences, 28(4), 480–492. https://doi.org/10.1002/CJAS.223
Anderson, C. A., & Anthony, R. N. (1986). The new corporate directors: Insights for board members and executives. Wiley.
Andrade, G., Mitchell, M., & Stafford, E. (2001). New Evidence and Perspectives on Mergers. Journal of Economic Perspectives, 15(2), 103–120. https://doi.org/10.1257/jep.15.2.103
Barber, B. M., & Lyon, J. D. (1996). Detecting abnormal operating performance: The empirical power and specification of test statistics. Journal of Financial Economics, 41(3), 359–399. https://doi.org/10.1016/0304-405X(96)84701-5
Becht, M., & Rok, A. (1999). Corporate Governance in Europe Blockholdings in Europe: An international comparison. European Economic Review (Vol. 43).
Berkovitch, E., & Narayanan, M. P. (1990). Competition and the medium of exchange in takeovers. Review of Financial Studies, 3(2), 153–174. https://doi.org/10.1093/rfs/3.2.153
Bertrand, O., & Betschinger, M. A. (2012). Performance of domestic and cross-border acquisitions: Empirical evidence from Russian acquirers. Journal of Comparative Economics, 40(3), 413–437. https://doi.org/10.1016/j.jce.2011.11.003
Boateng, A., Bi, X. G., & Brahma, S. (2017). The impact of firm ownership, board monitoring on operating performance of Chinese mergers and acquisitions. Review of Quantitative Finance and Accounting, 49(4), 925–948. https://doi.org/10.1007/s11156-016-0612-y
Boyd, B. K. (1996). Ceo duality and firm perfomance: A contingency model. Strategic Management Journal, 16, 301–312. https://doi.org/10.2307/2486959
Buck, T., Filatotchev, I., Wright, M., & Zhukov, V. (1999). Corporate Governance and Employee Ownership in an Economic Crisis: Enterprise Strategies in the Former USSR. Journal of Comparative Economics, 27(3), 459–474. https://doi.org/10.1006/jcec.1999.1606
Byrd, J. W., & Hickman, K. A. (1992). Do outside directors monitor managers?. Evidence from tender offer bids. Journal of Financial Economics, 32(2), 195–221. https://doi.org/10.1016/0304-405X(92)90018-S
Carline, N. F., Linn, S. C., & Yadav, P. K. (2009). Operating performance changes associated with corporate mergers and the role of corporate governance. Journal of Banking & Finance, 33(10), 1829–1841. https://doi.org/10.1016/J.JBANKFIN.2009.03.012
Chen, W.-R., & Miller, K. D. (2007). Situational and Institutional Determinants of Firms ’ R & d Search Intensity. Strategic Management Journal, 28(4), 369–381. https://doi.org/10.1002/smj.594
Chi, J., Sun, Q., & Young, M. (2011). Performance and characteristics of acquiring firms in the Chinese stock markets. Emerging Markets Review, 12(2), 152–170. https://doi.org/10.1016/j.ememar.2010.12.003
Choi, J. J., Park, S. W., & Yoo, S. S. (2007). The Value of Outside Directors: Evidence from Corporate Governance Reform in Korea. Journal of Financial & Quantitative Analysis,
53
42(4), 941–962. https://doi.org/10.2307/27647330 Claessens, S., Djankov, S., Lang, L. H. P., & Bank, W. (2000). The Separation of Ownership
and Control in East Asian Corporations The Separation of Ownership and Control in East Asian Corporations. Journal of Financial Economics, 58, 81–112.
Clark, K., & Ofek, E. (1994). Mergers as a means of restructuring distressed firms: An empirical investigation. Journal of Financial and Quantitative Analysis, 29(4), 541–565. https://doi.org/10.2307/2331109
Coles, J. W., McWilliams, V. B., & Sen, N. (2001). An examination of the relationship of governance mechanisms to performance. Journal of Management, 27(1), 23–50. https://doi.org/10.1177/014920630102700102
Comment, R., & Jarrell, G. A. (1995). Corporate focus and stock returns. Journal of Financial Economics, 37(1), 67–87. https://doi.org/10.1016/0304-405X(94)00777-X
Conn, R. L., Cosh, A., Guest, P. M., & Hughes, A. (2005). The impact on UK acquirers of domestic, cross-border, public and private acquisitions. Journal of Business Finance and Accounting. https://doi.org/10.1111/j.0306-686X.2005.00615.x
Conyon, M. J., & Peck, S. I. (1998). Board size and corporate performance: evidence from European countries. The European Journal of Finance, 4(3), 291–304. https://doi.org/10.1080/135184798337317
Dalton, D. R., Daily, C. M., Johnson, J. L., & Ellstrand, A. E. (1999). Number of directors and financial performance: A meta-analysis. Academy of Management Journal. https://doi.org/10.2307/256988
Danbolt, J., & Maciver, G. (2012). Cross-Border versus Domestic Acquisitions and the Impact on Shareholder Wealth. Journal of Business Finance and Accounting. https://doi.org/10.1111/j.1468-5957.2012.02294.x
Detthamrong, U., Chancharat, N., & Vithessonthi, C. (2017). Corporate governance, capital structure and firm performance: Evidence from Thailand. Research in International Business and Finance, 42, 689–709. https://doi.org/10.1016/j.ribaf.2017.07.011
Dharwadkar, R., George, G., & Brandes, P. (2000, July). Privatization in emerging economies: An agency theory perspective. Academy of Management Review. Academy of Management. https://doi.org/10.2307/259316
Dickerson, A. P., Gibson, H. D., & Tsakalotos, E. (1997). The impact of acquisitions on company performance: Evidence from a large panel of UK firms. Oxford Economic Papers, 49(3), 344–361. https://doi.org/10.1093/oxfordjournals.oep.a028613
Du, M., & Boateng, A. (2012). Cross-border mergers & acquisitions by emerging market firms: A review and future direction. Proceedings in Finance and Risk Perspectives.
Duchin, R., Matsusaka, J. G., & Ozbas, O. (2010). When are outside directors effective? Journal of Financial Economics, 96(2), 195–214. https://doi.org/10.1016/j.jfineco.2009.12.004
Dunn, D. J. (1987). Directors Arent Doing Their Jobs. Fortune. Dutta, S., & Jog, V. (2009). The long-term performance of acquiring firms: A re-examination
of an anomaly. Journal of Banking and Finance, 33(8), 1400–1412. https://doi.org/10.1016/j.jbankfin.2009.02.004
Dwivedi, N., & Jain, A. K. (2005). Corporate Governance and Performance of Indian Firms: The Effect of Board Size and Ownership. Employee Responsibilities and Rights Journal, 17(3), 161–172. https://doi.org/10.1007/s10672-005-6939-5
Eisenberg, T., Sundgren, S., & Wells, M. T. (1998). Larger Board Size and Decreasing Firm Value in Small Firms. Journal of Financial Economics, 48(1), 35–54. https://doi.org/10.1016/S0304-405X(98)00003-8
Eun, C. S., Kolodny, R., & Scheraga, C. (1996). Cross-border acquisitions and shareholder

54
wealth: Tests of the synergy and internalization hypotheses. Journal of Banking and Finance, 20(9), 1559–1582. https://doi.org/10.1016/S0378-4266(96)00013-1
Faccio, M., & Masulis, R. W. (2005). The choice of payment method in European mergers & acquisitions The choice of payment method in European mergers & acquisitions. Journal of Finance, 60(3), 1345–1388. Retrieved from http://papers.ssrn.com/abstract=492284
Faccio, M., & Stolin, D. (2006). Expropriation vs. proportional sharing in corporate acquisitions. The Journal of Business, 79(3), 1413–1444.
Fama, E. F., & Jensen, M. C. (1983). Separation of Ownership and Control. The Journal of Law and Economics, 26(2), 301–325. https://doi.org/10.1086/467037
Finkelstein, S., & D’aveni, R. A. (1994). CEO duality as a double-edged sword: How boards of directors balance entrenchment avoidance and unity of command. Academy of Management Journal. https://doi.org/10.2307/256667
Franks, J. R., Harris, R. S., & Mayer, C. (1988). Means of payment in takeovers:results for the United Kondom and the United States. In Alan J. Auerbach (Ed.), Corporate Takeovers: Causes and Consequences (pp. 221–264). University of Chicago Press. Retrieved from http://www.nber.org/chapters/c2058.pdf
Fuller, K., Netter, J., & Stegemoller, M. (2002). What Do Returns to Acquiring Firms Tell Us? Evidence from Firms That Make Many Acquisitions. The Journal of Finance, 57(4), 1763–1793. https://doi.org/10.1111/1540-6261.00477
Ghosh, A. (2001). Does operating performance really improve following corporate acquisitions? Journal of Corporate Finance, 7(2), 151–178. https://doi.org/10.1016/S0929-1199(01)00018-9
Ghosh, A., & Jain, P. C. (2000). Financial leverage changes associated with corporate mergers. Journal of Corporate Finance, 6(4), 377–402. https://doi.org/10.1016/S0929-1199(00)00007-9
Giudici, G., & Bonaventura, M. (2017, July 8). The impact of M&A strategies on the operating performance and investments of European IPO firms. Journal of Economics and Business. https://doi.org/10.1016/j.jeconbus.2017.06.005
Goergen, M., & Renneboog, L. (2004). Shareholder Wealth Effects of European Domestic and Cross-border Takeover Bids. European Financial Management, 10(1), 9–45. https://doi.org/10.1111/j.1468-036X.2004.00239.x
Gomes, E., Angwin, D. N., Weber, Y., & Yedidia Tarba, S. (2013). Critical Success Factors through the Mergers and Acquisitions Process: Revealing Pre- and Post-M&A Connections for Improved Performance. Thunderbird International Business Review, 55(1), 13–35. https://doi.org/10.1002/tie.21521
Gregory, A. (1997). An examination of the long run performance of UK acquiring firms.
Journal of Business Finance & Accounting, 24(7‐8), 971–1002. Grossman, S. J., & Hart, O. D. (1986). The Costs and Benefits of Ownership: A Theory of
Vertical and Lateral Integration. Journal of Political Economy, 94(4), 691–719. https://doi.org/10.1086/261404
Gugler, K., Mueller, D. C., Yurtoglu, B. B., & Zulehner, C. (2003). The effects of mergers: An international comparison. International Journal of Industrial Organization, 21(5), 625–653. https://doi.org/10.1016/S0167-7187(02)00107-8
Hair, J., Black, W. C., Babin, B. J., & Anderson, R. E. (2010). Multivariate data analysis: A global perspective. Pearson Education.
Haleblian, J., Devers, C. E., McNamara, G., Carpenter, M. A., & Davison, R. B. (2009). Taking Stock of What We Know About Mergers and Acquisitions: A Review and Research Agenda. Journal of Management, 35(3), 469–502.
55
https://doi.org/10.1177/0149206308330554 Harford, J. (1999). Corporate cash reserves and acquisitions. Journal of Finance, 54(6), 1969–
1997. https://doi.org/10.1111/0022-1082.00179 Healy, P. M., Palepu, K. G., & Ruback, R. S. (1992). Does corporate performance improve
after mergers? Journal of Financial Economics, 31(2), 135–175. https://doi.org/10.1016/0304-405X(92)90002-F
Heracleous, L. (2001). What is the impact of corporate governance on organisational performance? Corporate Governance, 9(3), 165–173. https://doi.org/10.1111/1467-8683.00244
Herman, E. S., & Lowenstein, L. (1988). The efficiency effects of hostile takeovers. Knights, Raiders and Targets, 211.
Heron, R., & Lie, E. (2002). Operating Performance and the Method of Payment in Takeovers. The Journal of Financial and Quantitative Analysis, 37(1), 137. https://doi.org/10.2307/3594998
Higgins, R. C., & Schall, L. D. (1975). Corporate bankruptcy and conglomerate merger. The Journal of Finance, 30(1), 93–113. https://doi.org/10.1111/j.1540-6261.1975.tb03162.x
Hitt, M. A., Harrison, J. S., & Ireland, R. D. (2001). Mergers & acquisitions: A guide to creating value for stakeholders. Oxford University Press.
Hogarty, T. F. (1970). The profitability of corporate mergers. Journal of Business. The University of Chicago Press. https://doi.org/10.2307/2351781
Holmen, M., & Knopf, J. D. (2004). Minority shareholder protections and the private benefits of control for Swedish mergers. Journal of Financial and Quantitative Analysis, 39(1), 167–191.
Ikeda, K., & Doi, N. (1983). The performances of merging firms in Japanese manufacturing industry: 1964-75. The Journal of Industrial Economics, 31(3), 257–266. https://doi.org/10.2307/2097886
Jackling, B., & Johl, S. (2009). Board structure and firm performance: Evidence from India’s top companies. Corporate Governance: An International Review, 17(4), 492–509. https://doi.org/10.1111/j.1467-8683.2009.00760.x
Jensen, M. C. (1986). Agency Costs of Free Cash Flow, Corporate Finance, and Takeovers. The American Economic Review, 76(2), 323–329. https://doi.org/10.2307/1818789
Jensen, M. C., & Meckling, W. H. (1976). Theory of the firm: Managerial behavior, agency costs and ownership structure. Journal of Financial Economics, 3(4), 305–360. https://doi.org/10.1016/0304-405X(76)90026-X
Judge, W. Q., & Zeithaml, C. P. (1992, October 1). Institutional and strategic choice perspectives on board involvement in the strategic decision process. Academy of Management Journal. Academy of Management. https://doi.org/10.2307/256315
Kang, J.-K. (1993). The international market for corporate control: Mergers and acquisitions of US firms by Japanese firms. Journal of Financial Economics, 34(3), 345–371. https://doi.org/10.1016/0304-405X(93)90031-6
Kothari, S. P., & Warner, J. B. (1997). Measuring long-horizon security price performance. Journal of Financial Economics, 43(3), 301–339. https://doi.org/10.1016/S0304-405X(96)00899-9
Kruse, T. A., Park, H. Y., Park, K., & Suzuki, K. I. (2002). The Value of Corporate Diversification: Evidence from Post-Merger Performance in Japan. SSRN Electronic Journal. https://doi.org/10.2139/ssrn.344560
Kumar, R. (2009). Post‐merger corporate performance: an Indian perspective. Management Research News, 32(2), 145–157. https://doi.org/10.1108/01409170910927604
Kumar, S., & Bansal, L. K. (2008). The impact of mergers and acquisitions on corporate
56
performance in India. Management Decision, 46(10), 1531–1543. https://doi.org/10.1108/00251740810920029
La Porta, R., Lopez-de-Silanes, F., Shleifer, A., & Vishny, R. (1999). The quality of government. The Journal of Law, Economics, and Organization, 15(1), 222–279.
Leuz, C., Nanda, D., & Wysocki, P. D. (2003). Earnings management and investor protection: An international comparison. Journal of Financial Economics, 69(3), 505–527. https://doi.org/10.1016/S0304-405X(03)00121-1
Lev, B., & Mandelker, G. (1972). The microeconomic consequences of corporate mergers. Journal of Business, 85–104.
Linn, S. C., & Switzer, J. A. (2001). Are cash acquisitions associated with better postcombination operating performance than stock acquisitions? Journal of Banking and Finance, 25(6), 1113–1138. https://doi.org/10.1016/S0378-4266(00)00108-4
Liu, Y., & Wang, Y. (2013). Performance of Mergers and Acquisitions under Corporate Governance Perspective. Open Journal of Social Sciences, 01(07), 17–25. https://doi.org/10.4236/jss.2013.17004
Loughran, T., & Vijh, A. M. (1997). Do long-term shareholders benefit from corporate acquisitions? Journal of Finance, 52(5), 1765–1790. https://doi.org/10.1111/j.1540-6261.1997.tb02741.x
Lubatkin, M. (1983). Mergers and the Performance of the Acquiring Firm. Academy of Management Review, 8(2), 218–225. https://doi.org/10.5465/AMR.1983.4284724
Mallette, P., & Fowler, K. L. (1992). Effects of Board Composition and Stock Ownership on the Adoption of “Poison Pills.” Academy of Management Journal, 35(5), 1010–1035. https://doi.org/10.2307/256538
Mantravadi, P., & Reddy, A. (2008). Type of merger and impact on operating performance: the indian experience. Economic and Political Weekly, 43(39), 66–74. https://doi.org/10.2307/40278002
Martynova, M., Oosting, S., & Renneboog, L. (2007). The long-term operating performance of European mergers and acquisitions. In International mergers and acquisitions activity since 1990: Quantitative analysis and recent research (pp. 79–116). Massachusetts:Elsevier. https://doi.org/10.1016/B978-075068289-3.50006-X
Martynova, M., & Renneboog, L. (2006). Mergers and acquisitions in Europe. Advances in Corporate Finance and Asset Pricing, 13–75. https://doi.org/10.2139/ssrn.944407
Martynova, M., & Renneboog, L. (2009). What determines the financing decision in corporate takeovers: Cost of capital, agency problems, or the means of payment? Journal of Corporate Finance, 15(3), 290–315. https://doi.org/10.1016/j.jcorpfin.2008.12.004
Masulis, R. W., Wang, C., & Xie, F. (2007). Corporate governance and acquirer returns. Journal of Finance, 62(4), 1851–1889. https://doi.org/10.1111/j.1540-6261.2007.01259.x
Mateev, M., & Andonov, K. (2016). Do cross-border and domestic bidding firms perform differently? New evidence from continental Europe and the UK. Research in International Business and Finance, 37, 327–349. https://doi.org/10.1016/j.ribaf.2016.01.001
Maury, B., & Pajuste, A. (2005). Multiple large shareholders and firm value. Journal of Banking and Finance, 29(7), 1813–1834. https://doi.org/10.1016/j.jbankfin.2004.07.002
Meeks, G. (1977). Disappointing Marriage: A Study of the Gains from Merger. (CUP Archive, Ed.) (51st ed.). Cambridge: Cambridge University Press. Retrieved from https://books.google.pt/books?hl=pt-PT&lr=&id=wO03AAAAIAAJ&oi=fnd&pg=PR7&dq=meeks+1977&ots=3UFvgKYCE7&sig=3Silx8csC7dE0Jbf9-OjNYGloHo&redir_esc=y#v=onepage&q=meeks 1977&f=false
Moeller, S. B., & Schlingemann, F. P. (2004). Are Cross-Border Acquisitions Different from

57
Domestic Acquisitions? Evidence on Stock and Operating Performance for U.S. Acquirers. Journal of Banking and Finance. https://doi.org/10.2139/ssrn.311543
Moeller, S. B., Schlingemann, F. P., & Stulz, R. M. (2004). Firm size and the gains from acquisitions. Journal of Financial Economics, 73(2), 201–228. https://doi.org/10.1016/j.jfineco.2003.07.002
Morck, R., Shleifer, A., & Vishny, R. W. (1988). Management ownership and market valuation: An empirical analysis. Journal of Financial Economics, 20, 293–315. https://doi.org/10.1016/0304-405X(88)90048-7
Morck, R., Shleifer, A., & Vishny, R. W. (1990). Do Managerial Objectives Drive Bad Acquisitions? The Journal of Finance, 45(1), 31–48. https://doi.org/10.1111/j.1540-6261.1990.tb05079.x
Morck, R., Yeung, B., & Yu, W. (2000). The information content of stock markets: why do emerging markets have synchronous stock price movements? Journal of Financial Economics, 58(1–2), 215–260. https://doi.org/10.1016/S0304-405X(00)00071-4
Mueller, D. C. (1980). The determinants and effects of mergers: An international comparison. (Oelgeschlager, Gunn, & Hain, Eds.) (24th ed.). Königstein/Ts.: Verlag A. Hain.
Muniandy, B., & Hillier, J. (2015). Board independence, investment opportunity set and performance of South African firms. Pacific Basin Finance Journal. https://doi.org/10.1016/j.pacfin.2014.11.003
Narayan, P. C., & Thenmozhi, M. (2014). Do cross-border acquisitions involving emerging market firms create value: Impact of deal characteristics. Management Decision, 52(8), 1451–1473. https://doi.org/10.1108/MD-04-2014-0227
Papadakis, V. M., & Thanos, I. C. (2010). Measuring the performance of acquisitions: An empirical investigation using multiple criteria. British Journal of Management, 21(4), 859–873. https://doi.org/10.1111/j.1467-8551.2009.00671.x
Parrino, J. D., & Harris, R. S. (1999). Takeovers, management replacement, and post-acquisition operating performance: some evidence from the 1980s. Journal of Applied Corporate Finance, 11(4), 88–97. https://doi.org/10.1111/j.1745-6622.1999.tb00518.x
Pawaskar, V. (2001). Effects of Mergers on Corporate Performance in India. Vikalpa, 26(1), 19–31. https://doi.org/10.1177/0256090920010103
Pazarskis, M., Vogiatzogloy, M., Christodoulou, P., & Drogalas, G. (2006). Exploring the improvement of corporate performance after mergers–the case of Greece. International Research Journal of Finance and Economics, 1(6), 184–192. Retrieved from http://www.drogalas.gr/uploads/publications/Exploring_the_improvement_of_corporate_performance_after_mergers_-_the_case_of_Greece.pdf
Pearce, J. A., & Zahra, S. A. (1992). Board composition from a strategic contingency perspective. Journal of Management Studies. https://doi.org/10.1111/j.1467-6486.1992.tb00672.x
Penman, S. H. (1991). An Evaluation of Accounting Rate-of-return. Journal of Accounting, Auditing & Finance, 6(2), 233–255. https://doi.org/10.1177/0148558X9100600204
Pham, N., Oh, K. B., & Pech, R. (2015). Mergers and acquisitions: CEO duality, operating performance and stock returns in Vietnam. Pacific Basin Finance Journal, 35, 298–316. https://doi.org/10.1016/j.pacfin.2015.01.007
Powell, R. G., & Stark, A. W. (2005). Does operating performance increase post-takeover for UK takeovers? A comparison of performance measures and benchmarks. Journal of Corporate Finance, 11(1–2), 293–317. https://doi.org/10.1016/j.jcorpfin.2003.06.001
Rahman, R. A., & Limmack, R. J. (2004). Corporate Acquisitions and the Operating Performance of Malaysian Companies. Journal of Business Finance <html_ent Glyph="@amp;" Ascii="&"/> Accounting, 31(3–4), 359–400.
58
https://doi.org/10.1111/j.0306-686X.2004.00543.x Rajan, R., Servaes, H., & Zingales, L. (2000). The Cost of Diversity: The Diversification
Discount and Inefficient Investment. The Journal of Finance, 55(1), 35–80. https://doi.org/10.1111/0022-1082.00200
Ramaswamy, K., Li, M., & Veliyath, R. (2002). Variations in ownership behavior and propensity to diversify: A study of the Indian corporate context. Strategic Management Journal, 23(4), 345–358. https://doi.org/10.1002/smj.227
Ramaswamy, K. P., & Waegelein, J. F. (2003). Firm financial performance following mergers. Review of Quantitative Finance and Accounting, 20(2), 115–126. https://doi.org/10.1023/A:1023089924640
Rao-Nicholson, R., Salaber, J., & Cao, T. H. (2016). Long-term performance of mergers and acquisitions in ASEAN countries. Research in International Business and Finance, 36, 373–387. https://doi.org/10.1016/j.ribaf.2015.09.024
Ravenscraft, D. J., & Scherer, F. M. (1989). The profitability of mergers. International Journal of Industrial Organization, 7(1), 101–116. https://doi.org/10.1016/0167-7187(89)90048-9
Rossi, S., & Volpin, P. F. (2004). Cross-country determinants of mergers and acquisitions. Journal of Financial Economics, 74(2), 277–304. https://doi.org/10.1016/j.jfineco.2003.10.001
Ruback, R. S. (1988). Do target shareholders lose in unsuccessful control contests? In Corporate takeovers: Causes and consequences (pp. 137–156). University of Chicago Press.
Sarkar, J., & Sarkar, S. (2000). Large shareholder activism in corporate governance in developing countries: Evidence from India. International Review of Finance, 1(3), 161–194. https://doi.org/10.1111/1468-2443.00010
Scharfstein, D. S., & Stein, J. C. (2000). The dark side of internal capital markets: Divisional rent-seeking and inefficient investment. Journal of Finance, 55(6), 2537–2564. https://doi.org/10.1111/0022-1082.00299
Scherer, F. M. (1988). Corporate Takeovers: The Efficiency Arguments. Journal of Economic Perspectives, 2(1), 69–82. https://doi.org/10.1257/jep.2.1.69
Schlingemann, F. P., & Moeller, S. B. (2004). Are Cross-Border Acquisitions Different from Domestic Acquisitions? Evidence on Stock and Operating Performance for U.S. Acquirers. Journal of Banking and Finance. https://doi.org/10.2139/ssrn.311543
Schoenberg, R. (2000). The influence of cultural compatibility within cross-border acquisitions: A review. In Advances in mergers and acquisitions (pp. 43–59). Emerald Group Publishing Limited.
Sharma, D. S., & Ho, J. (2002). The impact of acquisitions on operating performance: Some Australian evidence. Journal of Business Finance and Accounting, 29(1–2), 155–200. https://doi.org/10.1111/1468-5957.00428
Shimizu, K., Hitt, M. A., Vaidyanath, D., & Pisano, V. (2004). Theoretical foundations of cross-border mergers and acquisitions: A review of current research and recommendations for the future. Journal of International Management. https://doi.org/10.1016/j.intman.2004.05.005
Shleifer, A., & Vishny, R. W. (1986). Large Shareholders and Corporate Control. Journal of Political Economy, 94(3, Part 1), 461–488. https://doi.org/10.1086/261385
Shleifer, A., & Vishny, R. W. (1989). Management entrenchment. The case of manager-specific investments. Journal of Financial Economics, 25(1), 123–139. https://doi.org/10.1016/0304-405X(89)90099-8
Shleifer, A., & Vishny, R. W. (1997). A Survey of Corporate Governance. The Journal of Finance, 52(2), 737. https://doi.org/10.2307/2329497
59
Stein, J. C. (1997). Internal Capital Markets and the Competition for Corporate Resources. The Journal of Finance, 52(1), 111. https://doi.org/10.2307/2329558
Sun, Q., & Tong, W. H. S. (2003). China share issue privatization: The extent of its success. Journal of Financial Economics, 70(2), 183–222. https://doi.org/10.1016/S0304-405X(03)00145-4
Switzer, J. A. (1996). Evidence on real gains in corporate acquisitions. Journal of Economics and Business, 48(5), 443–460. https://doi.org/10.1016/S0148-6195(96)00033-1
Thanos, I. C., & Papadakis, V. M. (2012a). The use of accounting-based measures for measuring M&A performance: a review of five decades of research. Advances in Mergers and Acquisitions, 10(5), 103–120. https://doi.org/10.1108/S1479-361X(2012)0000010009
Thanos, I. C., & Papadakis, V. M. (2012b). Unbundling acquisition performance: How do they perform and how can this be measured? In D. Faulkner, S. Teerikangas, & R. J. Joseph (Eds.), Handbook of Mergers and Acquisitions. Oxford UK: Oxford University Press.
Thenmozhi, M., & Narayanan, P. C. (2016). Rule of law or country level corporate governance: What matters more in emerging market acquisitions? Research in International Business and Finance, 37, 448–463. https://doi.org/10.1016/j.ribaf.2016.01.008
Wan, W. P., & Yiu, D. W. (2009). From crisis to opportunity: Environmental jolt, corporate acquisitions, and firm performance. Strategic Management Journal, 30(7), 791–801. https://doi.org/10.1002/smj.744
Wang, Q., & Boateng, a. (2007). Cross-Border M&As by Chinese Firms: An Analysis of Strategic Motivation and Performance. Thunderbird International Business Review, 3(4), 19. https://doi.org/10.1002/tie
Wong, A., & Cheung, K. Y. (2009). The Effects of Merger and Acquisition Announcements on the Security Prices of Bidding Firms and Target Firms in Asia. International Journal of Economics and Finance, 1(2), 274. https://doi.org/10.5539/ijef.v1n2p274
Wu, W., & Chen, C. (2007). Relationship Among Corporate Governance, Agency Problem, and the Performances of Mergers and Acquisitions: Case of Listed Companies in Taiwan. Journal of Macau University of Science and Technology, 1(2), 71–93.
Xu, X., & Wang, Y. (1999). Ownership structure and corporate governance in Chinese stock companies. China Economic Review, 10(1), 75–98. https://doi.org/10.1016/S1043-951X(99)00006-1
Yeh, T., & Hoshino, Y. (2002). Productivity and operating performance of Japanese merging firms: Keiretsu-related and independent mergers. Japan and the World Economy, 14(3), 347–366. https://doi.org/10.1016/S0922-1425(01)00081-0
Yen, T.-Y., Chou, S., & André, P. (2013). Operating performance of emerging market acquirers: Corporate governance issues. Emerging Markets Finance and Trade, 49(sup3), 5–19.
Yen, T. Y., & André, P. (2007). Ownership structure and operating performance of acquiring firms: The case of English-origin countries. Journal of Economics and Business, 59(5), 380–405. https://doi.org/10.1016/j.jeconbus.2007.04.003
Young, M. N., Peng, M. W., Ahlstrom, D., Bruton, G. D., & Jiang, Y. (2008). Corporate governance in emerging economies: A review of the principal-principal perspective: Review paper. Journal of Management Studies, 45(1), 196–220. https://doi.org/10.1111/j.1467-6486.2007.00752.x
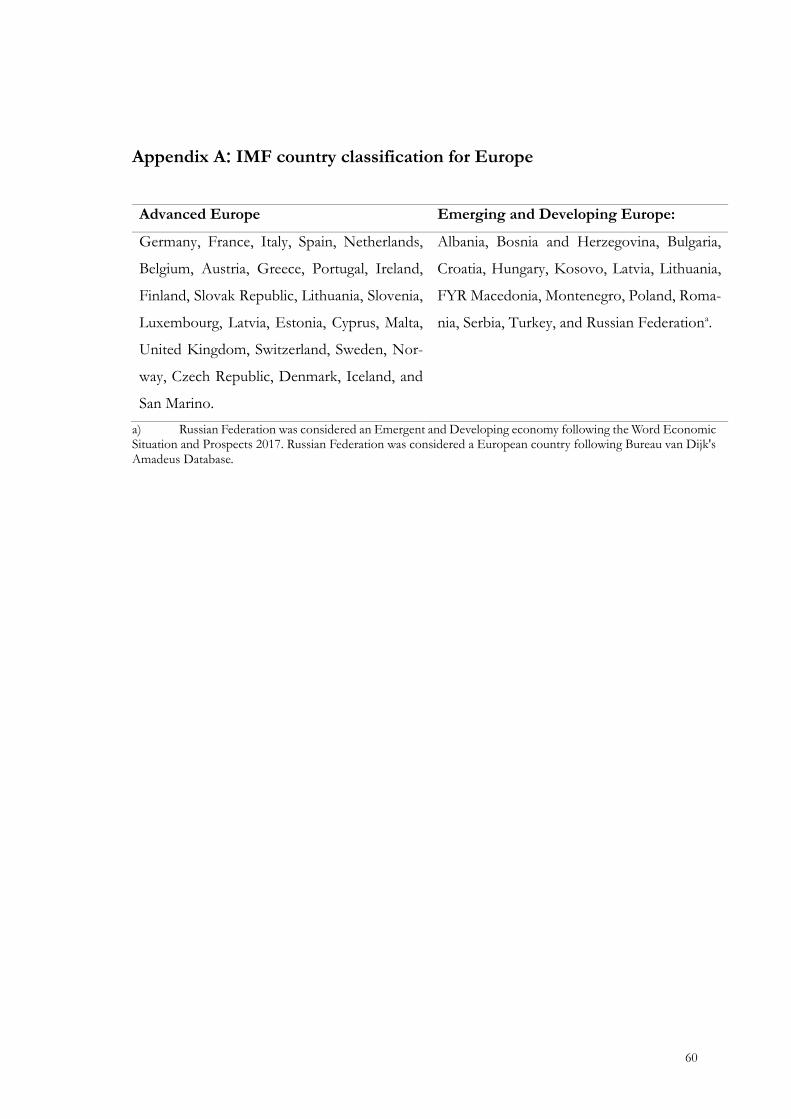
60
Appendix A: IMF country classification for Europe
Advanced Europe Emerging and Developing Europe:
Germany, France, Italy, Spain, Netherlands,
Belgium, Austria, Greece, Portugal, Ireland,
Finland, Slovak Republic, Lithuania, Slovenia,
Luxembourg, Latvia, Estonia, Cyprus, Malta,
United Kingdom, Switzerland, Sweden, Nor-
way, Czech Republic, Denmark, Iceland, and
San Marino.
Albania, Bosnia and Herzegovina, Bulgaria,
Croatia, Hungary, Kosovo, Latvia, Lithuania,
FYR Macedonia, Montenegro, Poland, Roma-
nia, Serbia, Turkey, and Russian Federationa.
a) Russian Federation was considered an Emergent and Developing economy following the Word Economic Situation and Prospects 2017. Russian Federation was considered a European country following Bureau van Dijk's Amadeus Database.

61
Appendix B: Summary of post-M&A operating performance studies Source of table: continuation of the review of Rao-Nicholson et al. (2016)
Author(s), year Market Sample period
Sample size
Performance measure
Scaled by Benchmark
Object of study: bidder (B) or target (T)
Change (C) or Intercept (I) Model
Changes in post-M&A performance
Advanced markets
Hogarty, 1970 US 1953–1964
43 (1) EPS, (2) Capital gains
Nr. of shares Industry B Other Deterioration
Lev and Mandelker, 1972 US 1952–1963
69 (1) Net income (2) Operating income
(1) BV as-sets, (2) BV eq-uity, (3) Sales, (4) Nr. of shares
(1) Industry, (2) Size
B and T C No significant change
Franks et al., 1988 US 1975–1979
42
(1) Return on common eq-uity, (2) Total return to shareholders
None
(1) Industry, (2) Size, and (3) Pre-perfor-mance
B C and I Deterioration
Herman and Lowenstein, 1988
US hostile offers
1975-1983 56 (1) Net income (2) EBIT
(1) BV Equity (2) Capital
Unmatched B C No significant change
Healy et al., 1992 US 1979–1984
50 Pre-tax Cash flow
Adj. MV As-sets
Industry B and T C and I Enhancement
Clark and Ofek, 1994 US 1981–1988
38 EBITD Sales Industry B and dis-tressed T
C and I Deterioration
Switzer, 1996 US 1967–1987
324 Pre-tax cash flow
MV assets Industry B and T C and I Enhancement
Parrino and Harris, 1999 US 1982–1987
197 Pre-tax cash flow
MV assets Industry B and T C and I Enhancement if target management is replaced
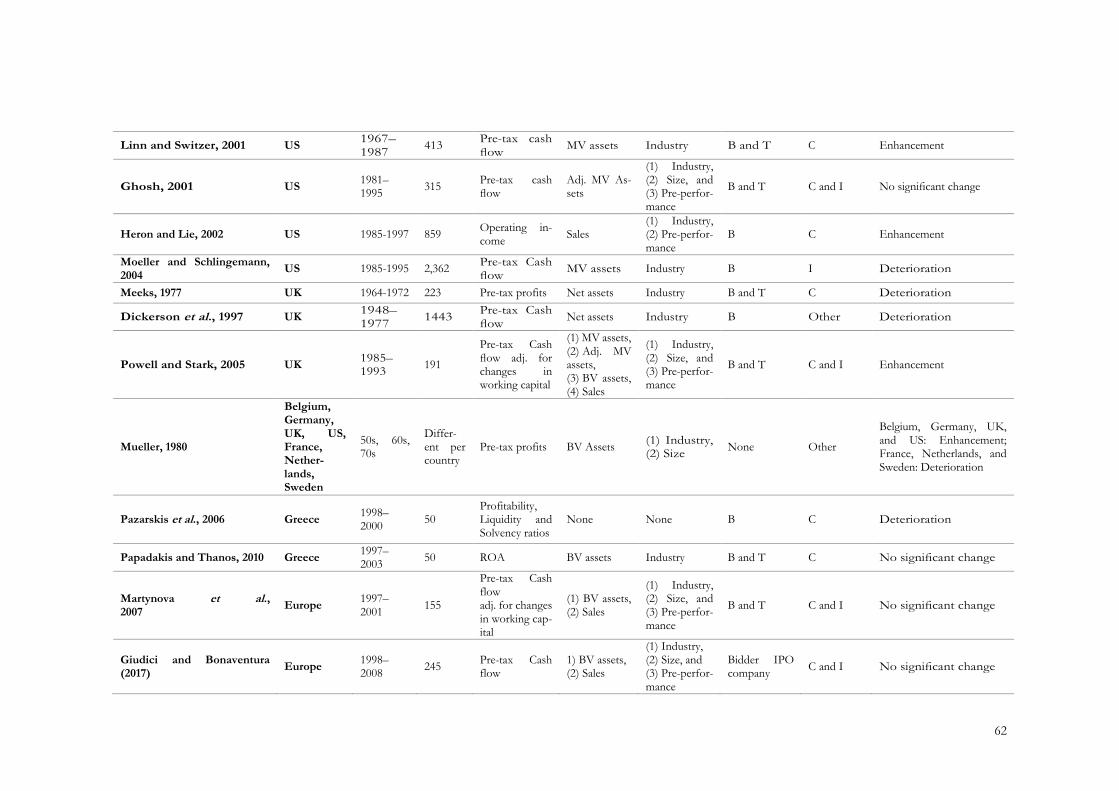
62
Linn and Switzer, 2001 US 1967–1987
413 Pre-tax cash flow
MV assets Industry B and T C Enhancement
Ghosh, 2001 US 1981–1995
315 Pre-tax cash flow
Adj. MV As-sets
(1) Industry, (2) Size, and (3) Pre-perfor-mance
B and T C and I No significant change
Heron and Lie, 2002 US 1985-1997 859 Operating in-come
Sales (1) Industry, (2) Pre-perfor-mance
B C Enhancement
Moeller and Schlingemann, 2004
US 1985-1995 2,362 Pre-tax Cash flow
MV assets Industry B I Deterioration
Meeks, 1977 UK 1964-1972 223 Pre-tax profits Net assets Industry B and T C Deterioration
Dickerson et al., 1997 UK 1948–1977
1443 Pre-tax Cash flow
Net assets Industry B Other Deterioration
Powell and Stark, 2005 UK 1985–1993
191
Pre-tax Cash flow adj. for changes in working capital
(1) MV assets, (2) Adj. MV assets, (3) BV assets, (4) Sales
(1) Industry, (2) Size, and (3) Pre-perfor-mance
B and T C and I Enhancement
Mueller, 1980
Belgium, Germany, UK, US, France, Nether-lands, Sweden
50s, 60s, 70s
Differ-ent per country
Pre-tax profits BV Assets (1) Industry, (2) Size
None Other
Belgium, Germany, UK, and US: Enhancement; France, Netherlands, and Sweden: Deterioration
Pazarskis et al., 2006 Greece 1998–2000
50 Profitability, Liquidity and Solvency ratios
None None B C Deterioration
Papadakis and Thanos, 2010 Greece 1997–2003
50 ROA BV assets Industry B and T C No significant change
Martynova et al., 2007
Europe 1997–2001
155
Pre-tax Cash flow adj. for changes in working cap-ital
(1) BV assets, (2) Sales
(1) Industry, (2) Size, and (3) Pre-perfor-mance
B and T C and I No significant change
Giudici and Bonaventura (2017)
Europe 1998–2008
245 Pre-tax Cash flow
1) BV assets, (2) Sales
(1) Industry, (2) Size, and (3) Pre-perfor-mance
Bidder IPO company
C and I No significant change

63
Sharma and Ho, 2002 Australia 1986–1991
36
Pre-tax Cash flow adj. for changes in working cap-ital
(1) BV assets, (2) BV equity, (3) Sales, (4) Nr. Of shares
(1) Industry, (2) Size
B and T C and I No significant change
Dutta and Jog, 2009 Canada 1993–2002
1300 Pre-tax Cash flow
BV assets
(1) Industry, (2) Size, and (3) Pre-perfor-mance
B C and I No significant change
Ikeda and Doi, 1983 Japan 1964–1975
49 Pre-tax cash flow
(1) BV equity, (2) BV assets
Industry B and T C Enhancement
Yeh and Hoshino, 2002 Japan 1970–1974
86
ROA, ROE, Sales growth, Employment growth
None Industry B and T Other Deterioration
Kruse et al., 2002 Japan 1969–1999
69 Pre-tax Cash flow
(1) MV assets, (2) Sales
(1) Industry, (2) Size
B and T C and I Enhancement
Emerging and developing markets
Rahman and Limmack, 2004 Malaysia 1988–1992
113
Pre-tax Cash flow adj. for changes in working cap-ital
BV assets (1) Industry, (2) Size
B and T C and I Enhancement
Pawaskar, 2001 India 1992–1995
36 Pre-tax Cash flow
Net assets (1) Industry, (2) Size
B Other Deterioration
Mantravadi and Reddy, 2008 India 1991–2003
118
6 different financial and operating ratios
None None B C Deterioration
Kumar and Bansal, 2008 India 2003 74
Working capi-tal, operating profit, profit before tax, ROE, EPS, debt to equity ratios
None None B C Enhancement
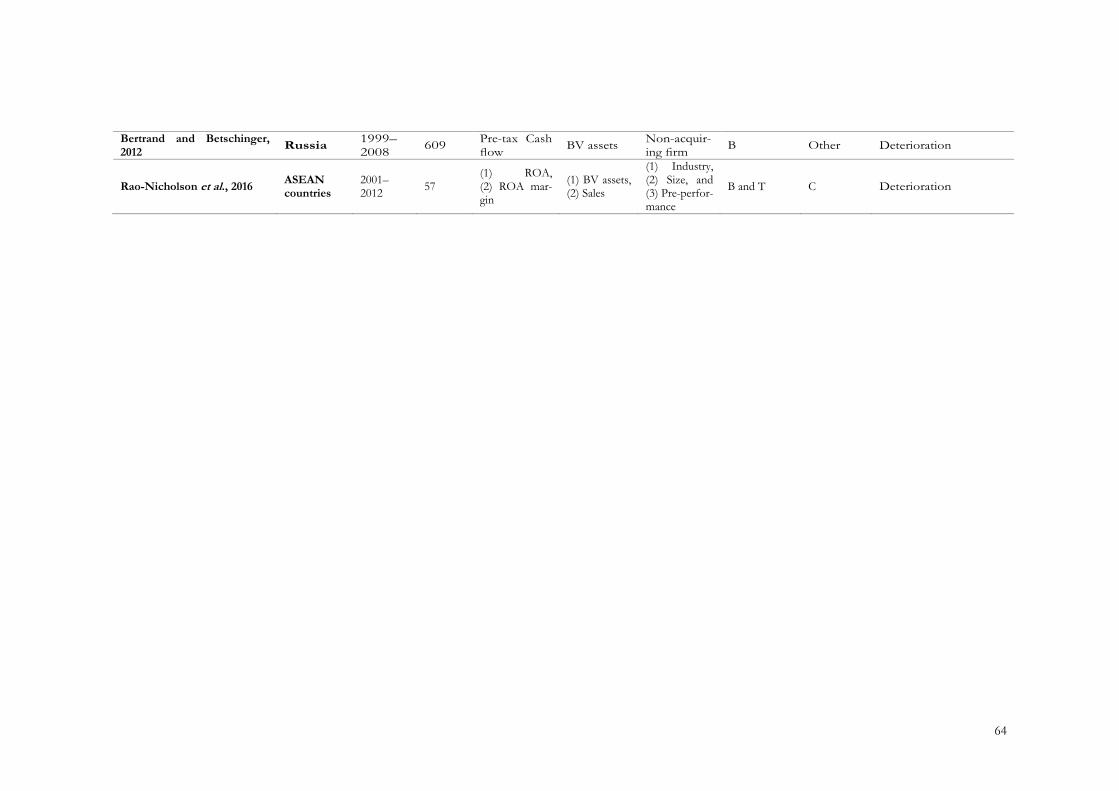
64
Bertrand and Betschinger, 2012
Russia 1999–2008
609 Pre-tax Cash flow
BV assets Non-acquir-ing firm
B Other Deterioration
Rao-Nicholson et al., 2016 ASEAN countries
2001–2012
57 (1) ROA, (2) ROA mar-gin
(1) BV assets, (2) Sales
(1) Industry, (2) Size, and (3) Pre-perfor-mance
B and T C Deterioration
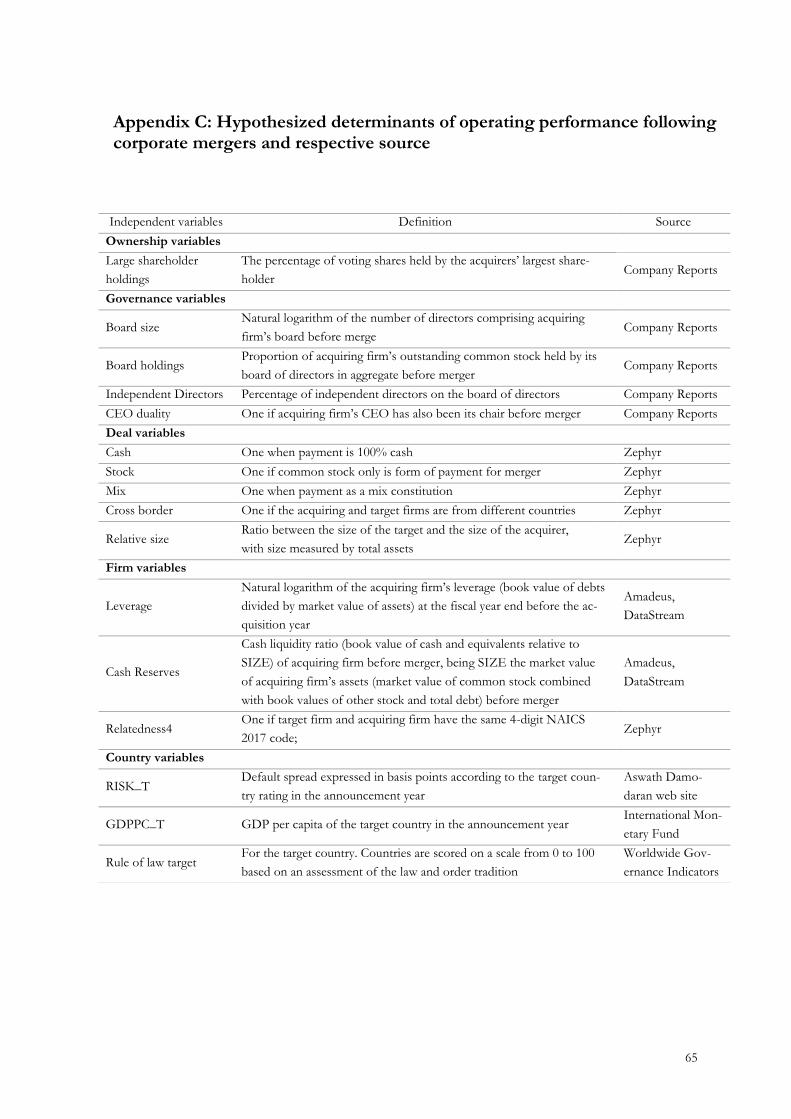
65
Appendix C: Hypothesized determinants of operating performance following corporate mergers and respective source
Independent variables Definition Source
Ownership variables
Large shareholder
holdings
The percentage of voting shares held by the acquirers’ largest share-
holder Company Reports
Governance variables
Board size Natural logarithm of the number of directors comprising acquiring
firm’s board before merge Company Reports
Board holdings Proportion of acquiring firm’s outstanding common stock held by its
board of directors in aggregate before merger Company Reports
Independent Directors Percentage of independent directors on the board of directors Company Reports
CEO duality One if acquiring firm’s CEO has also been its chair before merger Company Reports
Deal variables
Cash One when payment is 100% cash Zephyr
Stock One if common stock only is form of payment for merger Zephyr
Mix One when payment as a mix constitution Zephyr
Cross border One if the acquiring and target firms are from different countries Zephyr
Relative size Ratio between the size of the target and the size of the acquirer,
with size measured by total assets Zephyr
Firm variables
Leverage
Natural logarithm of the acquiring firm’s leverage (book value of debts
divided by market value of assets) at the fiscal year end before the ac-
quisition year
Amadeus,
DataStream
Cash Reserves
Cash liquidity ratio (book value of cash and equivalents relative to
SIZE) of acquiring firm before merger, being SIZE the market value
of acquiring firm’s assets (market value of common stock combined
with book values of other stock and total debt) before merger
Amadeus,
DataStream
Relatedness4 One if target firm and acquiring firm have the same 4-digit NAICS
2017 code; Zephyr
Country variables
RISK_T Default spread expressed in basis points according to the target coun-
try rating in the announcement year
Aswath Damo-
daran web site
GDPPC_T GDP per capita of the target country in the announcement year International Mon-
etary Fund
Rule of law target For the target country. Countries are scored on a scale from 0 to 100
based on an assessment of the law and order tradition
Worldwide Gov-
ernance Indicators

66
Appendix D: Correlation coefficients among all our variables
Median ROA
(Pos. Adj.)
Median ROA
(Pre. Adj.) Cash Stock Mix
Cross border
Relative Size
Cash reserves
Leverage Relatedenss 4 Large Shareholder
Holdings Board size
Board holdings
Independent directors
CEO duality
Rule of law target
Median ROA (Pos. Adj.)
1.0 0.3 0.1 0.1 -0.1 -0.1 0.3 0.1 0.0 0.0 -0.1 0.0 0.0 -0.3 0.0 0.0
Median ROA (Pre. Adj.)
0.3 1.0 0.1 -0.2 0.1 0.0 0.0 0.0 0.0 -0.1 -0.3 0.2 0.1 0.1 -0.1 -0.1
Cash 0.1 0.1 1.0 -0.3 -0.6 0.0 -0.2 -0.1 0.1 -0.1 0.1 0.2 -0.1 0.1 -0.1 0.0
Stock 0.1 -0.2 -0.3 1.0 -0.5 -0.2 0.3 0.1 0.1 0.1 0.1 -0.2 -0.1 -0.3 0.1 0.0
Mix -0.1 0.1 -0.6 -0.5 1.0 0.1 -0.1 0.0 -0.1 0.0 -0.2 0.0 0.1 0.2 0.0 0.0
Cross border -0.1 0.0 0.0 -0.2 0.1 1.0 -0.1 0.1 -0.1 0.1 -0.2 -0.1 0.0 0.3 0.0 0.0
Relative Size 0.3 0.0 -0.2 0.3 -0.1 -0.1 1.0 0.0 -0.1 0.0 0.0 -0.2 0.2 -0.1 0.0 0.1
Cash reserves 0.1 0.0 -0.1 0.1 0.0 0.1 0.0 1.0 -0.2 -0.1 -0.1 0.0 -0.1 0.0 0.1 0.1
Leverage 0.0 0.0 0.1 0.1 -0.1 -0.1 -0.1 -0.2 1.0 0.1 0.0 0.2 0.1 0.0 -0.2 0.0
Relatedenss 4 0.0 -0.1 -0.1 0.1 0.0 0.1 0.0 -0.1 0.1 1.0 -0.1 0.0 -0.2 -0.1 0.0 0.1
Large Shareholder Holdings
-0.1 -0.3 0.1 0.1 -0.2 -0.2 0.0 -0.1 0.0 -0.1 1.0 0.0 0.0 -0.1 0.3 -0.1
Board size 0.0 0.2 0.2 -0.2 0.0 -0.1 -0.2 0.0 0.2 0.0 0.0 1.0 -0.1 0.2 -0.1 -0.1
Board holdings 0.0 0.1 -0.1 -0.1 0.1 0.0 0.2 -0.1 0.1 -0.2 0.0 -0.1 1.0 0.0 -0.1 0.1
Independent directors
-0.3 0.1 0.1 -0.3 0.2 0.3 -0.1 0.0 0.0 -0.1 -0.1 0.2 0.0 1.0 -0.3 0.3
CEO duality 0.0 -0.1 -0.1 0.1 0.0 0.0 0.0 0.1 -0.2 0.0 0.3 -0.1 -0.1 -0.3 1.0 -0.1
Rule of law target 0.0 -0.1 0.0 0.0 0.0 0.0 0.1 0.1 0.0 0.1 -0.1 -0.1 0.1 0.3 -0.1 1.0
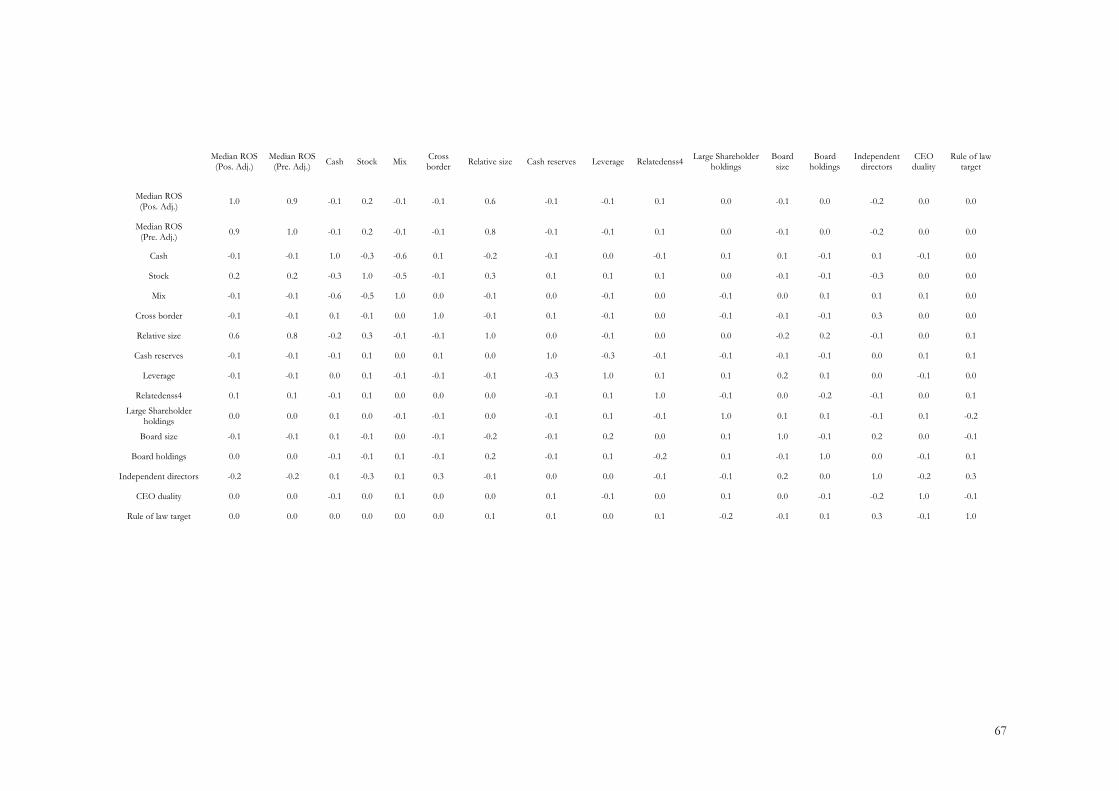
67
Median ROS (Pos. Adj.)
Median ROS (Pre. Adj.)
Cash Stock Mix Cross border
Relative size Cash reserves Leverage Relatedenss4 Large Shareholder
holdings Board size
Board holdings
Independent directors
CEO duality
Rule of law target
Median ROS (Pos. Adj.)
1.0 0.9 -0.1 0.2 -0.1 -0.1 0.6 -0.1 -0.1 0.1 0.0 -0.1 0.0 -0.2 0.0 0.0
Median ROS (Pre. Adj.)
0.9 1.0 -0.1 0.2 -0.1 -0.1 0.8 -0.1 -0.1 0.1 0.0 -0.1 0.0 -0.2 0.0 0.0
Cash -0.1 -0.1 1.0 -0.3 -0.6 0.1 -0.2 -0.1 0.0 -0.1 0.1 0.1 -0.1 0.1 -0.1 0.0
Stock 0.2 0.2 -0.3 1.0 -0.5 -0.1 0.3 0.1 0.1 0.1 0.0 -0.1 -0.1 -0.3 0.0 0.0
Mix -0.1 -0.1 -0.6 -0.5 1.0 0.0 -0.1 0.0 -0.1 0.0 -0.1 0.0 0.1 0.1 0.1 0.0
Cross border -0.1 -0.1 0.1 -0.1 0.0 1.0 -0.1 0.1 -0.1 0.0 -0.1 -0.1 -0.1 0.3 0.0 0.0
Relative size 0.6 0.8 -0.2 0.3 -0.1 -0.1 1.0 0.0 -0.1 0.0 0.0 -0.2 0.2 -0.1 0.0 0.1
Cash reserves -0.1 -0.1 -0.1 0.1 0.0 0.1 0.0 1.0 -0.3 -0.1 -0.1 -0.1 -0.1 0.0 0.1 0.1
Leverage -0.1 -0.1 0.0 0.1 -0.1 -0.1 -0.1 -0.3 1.0 0.1 0.1 0.2 0.1 0.0 -0.1 0.0
Relatedenss4 0.1 0.1 -0.1 0.1 0.0 0.0 0.0 -0.1 0.1 1.0 -0.1 0.0 -0.2 -0.1 0.0 0.1
Large Shareholder holdings
0.0 0.0 0.1 0.0 -0.1 -0.1 0.0 -0.1 0.1 -0.1 1.0 0.1 0.1 -0.1 0.1 -0.2
Board size -0.1 -0.1 0.1 -0.1 0.0 -0.1 -0.2 -0.1 0.2 0.0 0.1 1.0 -0.1 0.2 0.0 -0.1
Board holdings 0.0 0.0 -0.1 -0.1 0.1 -0.1 0.2 -0.1 0.1 -0.2 0.1 -0.1 1.0 0.0 -0.1 0.1
Independent directors -0.2 -0.2 0.1 -0.3 0.1 0.3 -0.1 0.0 0.0 -0.1 -0.1 0.2 0.0 1.0 -0.2 0.3
CEO duality 0.0 0.0 -0.1 0.0 0.1 0.0 0.0 0.1 -0.1 0.0 0.1 0.0 -0.1 -0.2 1.0 -0.1
Rule of law target 0.0 0.0 0.0 0.0 0.0 0.0 0.1 0.1 0.0 0.1 -0.2 -0.1 0.1 0.3 -0.1 1.0

68