Embed Size (px)
Citation preview
Post Opening Project Evaluation
A2 Bean – Cobham (Phase 2)
Five Years After Study
October 2015
Notice
This document and its contents have been prepared and are intended solely for Highways England’s information and use in relation to the Post Opening Project Evaluation of Major Schemes.
Atkins assumes no responsibility to any other party in respect of or arising out of or in connection with this document and/or its contents.

Post Opening Project Evaluation
A2 Bean – Cobham (Phase 2) Five Year After Study
Table of Contents
Chapter Pages
1. Introduction 6
Background 6
Scheme Context 6
Scheme Description 7
Scheme History 9
Scheme Objectives 9
Nearby Highway and Land Use Schemes 10
Post-Opening Project Evaluation 12
Highways England’s Appraisal Process 12
2. Traffic Impact Evaluation 14
Introduction 14
Background Changes in Traffic 14
Traffic Volume Analysis 16
Observed Flows 18
Heavy Goods Vehicle (HGV) Flows 20
Screenline Analysis 21
Forecast and Observed Traffic Impacts 22
Journey Time Analysis 24
Journey Time Reliability 27
3. Safety Evaluation 29
Introduction 29
Collision Study Areas 29
Data Sources 29
Collision Numbers 31
Collision Locations 33
Collision Rates – A2 34
Forecast vs. Observed Collision Savings 35
Personal Security 35
4. Economy 37
Introduction 37
Sources 37
Present Value Costs 37
Present Value Benefits 39
Transport Economic Efficiency 39

Post Opening Project Evaluation
A2 Bean – Cobham (Phase 2) Five Years After Study
3
Safety Benefits 40
Summary of Present Value Benefits 40
Benefit Cost Ratio (BCR) 41
Wider Economic Impact 42
5. Environment 44
Introduction 44
Summary of OYA Evaluation Findings 44
Methodology 46
Data Collection 46
Site Inspection 46
Consultation 46
Traffic Forecast Evaluation 47
Five Years After Assessment 48
6. Accessibility and Integration 70
Accessibility 70
7. Appraisal Summary Table & Evaluation Summary Table 75
Appraisal Summary Table 75
Evaluation Summary Table 75
8. Conclusions 81
Scheme Specific Objectives 81
9. Appendices 82
Appendix A: Glossary 82
Appendix B: Tables and Figures Listed in this report 84
Appendix C: Environment Information Requested 86
Appendix D: Record of Scheme Including ES Photomontages Before and FYA comparisons 87
Appendix E: Record of Scheme Including OYA and FYA periods 91
Appendix F: Predicted Impacts, Mitigation and Evaluation for Landscape Sub-Objective 95
Appendix G: Predicted Impacts, Mitigation and Evaluation for Biodiversity Sub-Objective 99

Post Opening Project Evaluation
A2 Bean – Cobham (Phase 2) Five Years After Study
4
Executive Summary
Scheme Description The A2 Bean – Cobham- Phase 2 scheme was a major Highways England project in Kent which opened in February 2009. The A2 trunk road is an east-west route between London and north Kent. The A2 Bean – Cobham scheme was implemented in two phases, with Phase 1 completed in December 2004. This involved works to improve the A2 from Bean to Pepperhill. Phase 2 comprised works from Pepperhill to Cobham, a distance of 4.5 miles. These works involved providing a new, wider road alongside the original A2, although some widening of the existing road also took place. This document summarises the findings of the five years after post-opening evaluation study of Phase 2 of the scheme.
Scheme Objectives
Objectives (Selection from Various Sources) Objective Achieved?
Reduce journey time and improve reliability
Improve safety Provide enhanced access to the major regeneration area of Kent Thameside and other regeneration areas in north and east Kent
Facilitate access to Ebbsfleet International Rail Station from the road network
Provide safe and appropriate access along the route for non-motorised users
Key Findings
Five years after opening, the scheme has been successful in achieving its objectives; Journey times on the A2 have been reduced from pre-scheme to post-scheme; Although the number of collisions has not reduced, the severity index of collisions has
decreased, meaning there are fewer collisions classed as fatal or serious; and Traffic has increased on the A2 from the before to after periods.
Summary of Scheme Impacts
Traffic
Average daily traffic flows on the A2 have increased by as much as 18% five years after the opening of the scheme.
In contrast, traffic flows have decreased along the M20. This suggests some re-routing of traffic from the M20 on to the A2. However, several other schemes have been constructed in the vicinity so impacts should not be overstated.
Traffic flow increases on the A2 were higher than forecast, which may also have been affected by nearby schemes or due to an underestimation in traffic growth prior to construction.
Journey times have decreased in both directions on the A2 and across all time periods (AM peak, inter-peak and PM peak), with savings as high as three minutes.
Safety
The number of personal injury collisions occurring along the Phase 2 section of the A2 has remained consistent with before the scheme.

Post Opening Project Evaluation
A2 Bean – Cobham (Phase 2) Five Years After Study
5
In the wider area, which includes the M20 and the Phase 1 section of the A2, collisions increased slightly. The severity of these collisions has decreased.
The collision rate on this part of the A2 has reduced, even taking into account the increased level of traffic.
The installation of two footbridges to replace subways crossing the A2 has had a positive impact on personal security for pedestrians and cyclists.
Environment
Noise mitigation measures for the scheme, such as acoustic barriers, are in good condition. The landscape mitigation measures provided are as expected in the Environmental
Statement. Landscape impacts are considered moderate beneficial, as expected, as mitigation
measures have been provided as planned. The impacts on heritage are neutral, as expected. In terms of the water sub-objective, impacts are slight beneficial, as expected. The scheme’s impact on physical fitness is moderate beneficial, as expected. Journey ambience receives a score of moderate beneficial.
Accessibility and Integration
Facilities for non-motorised users have improved along the route, with the installation of footbridges and the provision of off-road walking and cycling facilities.
All integration sub-objectives received an as expected score.
Economic Performance
All Monetary Figures in 2002 Prices and Values Forecast Outturn
Investment Cost in Present Value (PVC) £122.4m £124.9m
Present Value Benefit (PVB) £360.4m £260.6m
Benefit Cost Ratio (BCR)
Indirect Tax Impact Treated as a Cost
2.9 2.1
Benefit Cost Ratio (BCR)
Indirect Tax Impact Treated as a Benefit
3.0 2.1
Due to the nature of the improvements, journey time benefits would be expected from the opening of the scheme. Journey times, which made up the benefits, improved as expected, although forecasts were higher than observed.
Collision benefits were not monetised, due to the scheme having no impact on collisions. This helps to explain why the forecast Present Value Benefits are higher than the outturn benefits.
With regards to wider economic benefit, the impacts on the Regeneration Area are positive. The BCR is slightly lower than expected, although significant benefits are still experienced
from this scheme and the scheme offers high value for money.

Post Opening Project Evaluation
A2 Bean – Cobham (Phase 2) Five Years After Study
6
1. Introduction
Background
1.1 This report presents a Five Years After (FYA) opening evaluation of Phase 2 of the A2 Bean – Cobham Widening project (hereafter referred to as ‘the scheme’), which opened in February 2009. The evaluation has been prepared as part of Highways England’s Post Opening Project Evaluation (POPE) programme. The purpose of this report is to build upon the findings of the One Year After (OYA) report, published in April 2012. It is worth noting that the OYA report also included the FYA findings of the A2 Bean – Cobham Phase 1 scheme.
Scheme Context
1.2 The A2 trunk road is an east-west route between London and north Kent. Over the last decade, there have been several Highways England Major Schemes on this route to address congestion issues and to accommodate measures for the High Speed Rail line, which opened in 2007.
1.3 The A2 Bean – Cobham scheme was implemented in two phases, as follows:
Phase 1: Bean – Pepperhill. This consisted of online widening along a distance of 2.5 miles. The scheme opened in December 2004; and
Phase 2: Pepperhill – Cobham. This element involved further widening along a distance of 4.5 miles and opened in February 2009. This route is primarily a new offline section of the A2, built as close to the line of the Channel Tunnel Rail Link as possible, but also included some online widening.
1.4 Throughout this report, the individual schemes are referred to as ‘Phase 1’ and ‘Phase 2’, although this study seeks to, where possible, isolate the impacts of Phase 2 at the FYA stage.
1.5 The location of the A2 Bean – Cobham scheme is shown by each phase in Figure 1.1. The main junctions along the A2 are also labelled.

Post Opening Project Evaluation
A2 Bean – Cobham (Phase 2) Five Years After Study
7
Figure 1.1 Location Plan
Scheme Description
1.6 Phase 1 of the scheme was completed within the existing highway boundary and included (but was not limited to) the following measures:
Widening to provide four lanes from Bean – Pepperhill; and
Widening of the London-bound carriageway to four lanes from Pepperhill Junction entry slip to the London-bound exit slip at Bean Junction.
1.7 Phase 1 also included upgrading the non-motorised user (NMU) facilities, providing emergency telephones and installing Enhanced Message Signs (EMS) and matrix signals.
1.8 Phase 2, which is the focus of this report, involved the following measures:
Between Pepperhill Junction (A2260) and Marling Cross:
- Replacing a three-lane dual carriageway with a new section of four-lane dual carriageway built 100 – 200m south of the original highway, thus distancing the road from residential areas and bringing it closer to the Channel Tunnel Rail Link line;
- Closure of the former route of the road between Pepperhill/Downs Road and Marling Cross to vehicles, the route instead being open to pedestrians and cyclists. A separate equestrian route was also incorporated and extensive landscaping and planting took place;
- Removal of subways under the old route at Hog Lane and Hever Court;

Post Opening Project Evaluation
A2 Bean – Cobham (Phase 2) Five Years After Study
8
- Installation of footbridges over the new route east of Tollgate and west of Marling Cross (Ifield Court and Church Road); and
- Installation of an over-bridge at Downs Road.
Provision of new junctions at Tollgate (A227) and Marling Cross;
From Marling Cross to Cobham Junction:
- Construction of online widening of the existing three-lane dual carriageway to four lanes with minimised impacts on the Shorne and Ashenbank Woods Sites of Special Scientific Interest (SSSI);
- Provision of new bridges at Thong Lane and Downs Lane; and
- Creation of new combined cycleway and pedestrian route alongside the A2 from Marling Cross to Brewers Road.
Widening a section 800m in length through Cobham Junction (Cobham Extension);
Installation of low noise surfacing along the new road; and
Upgrading of communications to motorway standard.
Figure 1.2 shows the main features of Phase 2, with the new layout of the A2.
Figure 1.2 Measures Incorporated During Phase 2

Post Opening Project Evaluation
A2 Bean – Cobham (Phase 2) Five Years After Study
9
Scheme History
1.9 Figure 1.3 presents a timeline showing the history and key dates of the scheme. The timeline shows both Phase 1 and Phase 2 in order to provide a comprehensive overview of the entire scheme. The A2 in Kent was originally constructed as a three-lane carriageway during the 1960s.
Figure 1.3 Scheme Timeline
Scheme Objectives
1.10 The overall objectives of both phases of the scheme were to improve congestion and safety and contribute to an integrated and sustainable transport strategy for the Kent Thameside area. The specific objectives are sourced from the Roads Review (1998), and are as follows:
Provide a consistent standard of four-lane dual carriageway from the M25 to the M2 at Junction 4, in conjunction with other major schemes, such as the A282 Dartford Improvements and the A2/M2 Cobham – J4 Widening Scheme; and
Provide the additional capacity required for predicted traffic growth in the region, including that arising as a result of the opening of Ebbsfleet International Station in 2002.
Year
2001
2002
2003
2004
2005
2006
2007
2009
Phase 1
Public consultation followed by Secretary of State's (SoS) decision to
approve Phase 1.
Phase 1a construction began
Phase 1b construction began
Phase 1 completed
Ebbsfleet Junction works completed
Phase 2
Public consultation of route options resulting in preference for mainly
offline route to be constructed
Preferred route announced by SoS
-
Second public consultation
Public enquiry and SoS approval
Offline construction work began
Online construction work began
Phase 2 completed

Post Opening Project Evaluation
A2 Bean – Cobham (Phase 2) Five Years After Study
10
1.11 Phase 2 of the scheme also aimed to achieve the following objectives, which were sourced from the Environmental Statement, Inspector’s Report and Stage 3 Scheme Assessment Report at the OYA stage:
Reduce journey times and improve reliability;
Provide enhanced access to the major regeneration area of Kent Thames-side and other regeneration areas in North and East Kent allowing access to Channel crossings;
Facilitate access to Ebbsfleet International Rail Station from the national motorway and trunk road network;
Reduce the environmental impact of the widened trunk road where practicable, particularly on the adjacent residential areas of Gravesend;
Provide safe and appropriate access across and along the trunk road for non-motorised users;
Increase capacity on road to cope with forecast increase in traffic flows on the road and major new developments planned in the region;
Improve safety through improving junctions;
To be part of and to support the other elements of an integrated and sustainable public transport based strategy for the Kent Thameside regeneration area; and
Reduce noise and improve local air quality by moving the A2 away from residential areas.
Nearby Highway and Land Use Schemes
Adjacent Major Schemes
1.12 The following major road schemes were also undertaken by Highways England in the area near to the A2 Bean – Cobham scheme:
A2/M2 Cobham to J4 widening- east of Phase 2;
A2/A282 Dartford improvements (included widening of A2- west of Phase 1); and
M25 J1b – 3 widening- through Dartford improvement scheme.
1.13 Table 1.1 shows additional highways schemes which have taken place in the area surrounding the scheme. Due to the proximity of these schemes to the A2 Bean – Cobham scheme, it is likely that there was some impact on traffic trends. However, the impacts of Phase 2 have been isolated where possible.
1.14 Additionally, some nearby land use schemes have been implemented during the period from 2000 – 2014. These are as follows:
Ebbsfleet International- Opened to the public in 2007. The A2 works were fundamental in improving access to this important transport link;
HS1- Opened 2003; and
Cyclopark- this development made use of the old A2 highway after the new highway was constructed by building facilities for cycling and mountain biking. The Cyclopark opened in 2012.

Post Opening Project Evaluation
A2 Bean – Cobham (Phase 2) Five Years After Study
11
Table 1.1 Nearby Highways Schemes
Scheme 2000 2001 2002 2003 2004 2005 2006 2007 2008 2009 2010 2011 2012 2013 2014
A2/M2 Cobham – J4 Widening
A2 Bean – Cobham (Phase 1)
A2 Bean – Cobham (Phase 2)
Ebbsfleet Junction Work
A2/A282 Dartford Improvement
M25 J1b – 3 Widening
M2 J5 Stockbury Roundabout Resurfacing
M20 J4 – 6 Resurfacing
M20 J6 – 7 Signing and Resurfacing Scheme
A2 Littledale Joint Replacement Scheme

Post Opening Project Evaluation
A2 Bean – Cobham (Phase 2) Five Years After Study
12
Post-Opening Project Evaluation
Highways England’s Appraisal Process
1.15 Highways England is responsible for improving the strategic highway network (motorways and trunk roads) through the Major Schemes programme (formerly Targeted Programme of Improvements). At each key decision stage through the planning process, schemes are subject to a rigorous appraisal process to provide a justification for the project’s continued development. When submitting a proposal for a major transport scheme, the Department for Transport (DfT) specifies that an Appraisal Summary Table (AST) is produced which records the degree to which five objectives (Environment, Safety, Economy, Accessibility and Integration1) have been achieved. The AST for this scheme is presented in Chapter 7 of this report.
Post Opening Project Evaluation
1.16 POPE studies are undertaken at two stages after all Major Schemes have opened: one year after scheme opening and five years after scheme opening. The purpose of POPE studies is to document outturn impacts, evaluate the strengths and weaknesses of the techniques used for appraising schemes so that informed improvements can be made to the appraisal process in the future. This is achieved by comparing information collected before and after the opening of the scheme to traffic, against predictions made during the planning process. The outturn impacts of a scheme are summarised in an Evaluation Summary Table (EST) which summarises the extent to which the objectives of a scheme have been achieved. The EST for this scheme can be found in Chapter 7.
Summary of the A2 Bean - Cobham One Year After (OYA) Opening Study
1.17 The purpose of the FYA study is to verify and study in more detail the emerging trends and conclusions presented in the OYA study report. The OYA study for Phase 2 was combined with the FYA report for Phase 1. The main conclusions made in this report were as follows:
FYA opening, Phase 1 had been successful in achieving its objectives;
OYA opening, Phase 2 had also been successful;
Traffic on the A2 has increased at a greater rate compared with other routes in the area, potentially as a result of the increased capacity;
Some journey time savings were observed following completion of Phase 1, and further savings following the implementation of Phase 2;
The outturn BCR for both phases is greater than forecast, with safety and journey time benefits better than predicted;
The overall safety impact of the improvements has been better than expected and there is a lower collision rate despite the impact of an additional junction at Ebbsfleet; and
Both phases contribute to providing access to the Ebbsfleet International station.
1.18 This FYA report will reconsider the status of the above findings and provide further clarity on the longer term effects of the improvements on the immediate area affected by the scheme. This is of particular importance when considering collision and environmental impacts, and longer term economic regeneration effects.
Report Structure
1.19 Including the introduction, this report comprises eight chapters. These are structured as follows:
Chapter 2 - Traffic Impact Evaluation;
1 In recent years these have changed, but the evaluation of this scheme in this study will use those defined at the time of its appraisal, namely Environment, Safety, Economy, Accessibility and Integration.

Post Opening Project Evaluation
A2 Bean – Cobham (Phase 2) Five Years After Study
13
Chapter 3 – Safety;
Chapter 4 – Economy;
Chapter 5 – Environment;
Chapter 6 – Accessibility and Integration;
Chapter 7 – Appraisal Summary Table and Evaluation Summary Table; and
Chapter 8 – Conclusions.
1.20 A glossary is included as Appendix A which explains the technical terms and acronyms used within the document.
Post Opening Project Evaluation
A2 Bean – Cobham (Phase 2) Five Years After Study
14
2. Traffic Impact Evaluation
Introduction
2.1 This section examines traffic data to provide a before and after opening comparison of traffic flows and journey times along the A2 from Pepperhill – Cobham. Traffic flow analysis will also be undertaken on other routes within the wider area to understand the broader traffic impacts of the scheme. The purpose of this evaluation is to understand whether changes in traffic flows and journey times may be attributable to the scheme.
2.2 This chapter comprises:
An assessment of national, regional and local background traffic trends;
A summary of the sources used to compile data for this analysis;
A detailed comparison of before, OYA and FYA traffic flows on key routes in the study area likely to be affected by the scheme;
A comparison of journey times for before scheme construction and FYA stages;
An evaluation of key differences between forecast and outturn impacts of the scheme in terms of traffic flows and journey times; and
An evaluation of journey time reliability.
Background Changes in Traffic
2.3 Historically in POPE scheme evaluations, the ‘before’ traffic counts have often been factored to take account of background traffic growth so that they are directly comparable with the ‘after’ counts. This usually involves the use of National Road Traffic Forecasts (NRTF), with local adjustments made using Local Growth Factors if applicable.
2.4 However, in light of the recent economic climate, and coinciding widespread reductions in motor vehicle travel in the UK as a whole since 2008, it is no longer deemed appropriate to use this method of factoring ‘before’ counts to reflect background changes in traffic. Rather, recent POPE studies have taken a more considered approach in order to assess changes in the vicinity of the scheme, within the context of national, regional and locally observed background changes in traffic.
Local, Regional and National Trends
2.5 The DfT produces observed annual statistics for all motor vehicles by local authority2. Data between 2005 (before construction) and 2013 (the latest available) is shown in million vehicle kilometres (mvkm) for Kent, the South East region and England in Figure 2.1.
2 Motor vehicle traffic (vehicle kilometres) by region in Great Britain, annual from 1993 to 2013. Table TRA8904
(Department for Transport; accessed October 2014).

Post Opening Project Evaluation
A2 Bean – Cobham (Phase 2) Five Years After Study
15
Figure 2.1 Local, Regional and National Trends in Million Vehicle Kilometres (mvkm)
2.6 Figure 2.1 shows that local traffic patterns are in line with national and regional trends and experience a decrease in mvkm between 2007 and 2010, which coincides with the economic recession experienced in the UK.
2.7 From 2010, all three trends show an increase in mvkm, although Kent shows the largest increase. There is a subsequent decline for this local trend between 2011 and 2013. In 2013, the Kent local trend is slightly above national and regional trends.
2.8 In terms of Phase 2 of the A2 Bean – Cobham scheme, construction occurred in the period from 2007 – 2009 where there was a decline in mvkm. Following the scheme opening in 2009 was an increase in mvkm, which may indicate an increase in traffic during the post-opening period.
Long Term Traffic Trends on the A2
2.9 In order to gain a greater understanding of the historical fluctuations in yearly traffic flows in the vicinity, TRADS data has been obtained for surrounding routes. Highways England’s TRADS database provides historical permanent traffic count data, although limited data is available for larger sections of the A2. For this reason, TRADS data for the section of the M20 between Junction 3 and Junction 4 has been obtained and is shown in Table 2.1.
Table 2.1 AAWT for M20, Junctions 3 – 4
Year
M20 Junction 3 – 4 Eastbound M20 Junction 3 – 4 Westbound
AAWT Factor of
Change on 2006 AAWT
Factor of Change on 2006
2006 57,100 1.00 57,500 1.00
2007 56,300 0.99 56,800 0.99
2008 57,000 1.00 55,800 0.97
2009 55,700 0.97 52,500 0.91

Post Opening Project Evaluation
A2 Bean – Cobham (Phase 2) Five Years After Study
16
Year
M20 Junction 3 – 4 Eastbound M20 Junction 3 – 4 Westbound
AAWT Factor of
Change on 2006 AAWT
Factor of Change on 2006
2010 53,600 0.94 48,700 0.85
2011 54,400 0.95 - -
2012 53,400 0.93 - -
2013 53,600 0.94 54,500 0.95
2.10 Table 2.1 shows long-term changes in average weekday traffic (AWT) flows from 2007. It is worth noting that data for some months is missing and the 2013 average figure for the westbound flows is based on one month of data. The data can be used as an indication of traffic flows on the M20 near to the scheme.
2.11 From Table 2.1 it can be seen that AWT flows on the route decreased by 5% from 2007 – 2013 in the eastbound direction and by 4% in the westbound direction. This is roughly in line with the trends shown in Figure 2.1, which also showed a decrease in traffic flows, and could partly be attributed to economic downturn and reduced employment.
Conclusions on Background Changes in Traffic
2.12 Based on the information presented in this section, it has been considered that no annual growth factors should be applied to the data presented in this report. Rather, when reading this report, it is important to note that there has been a broader decrease in vehicle flows across the region, coinciding with the economic recession across the UK.
Traffic Volume Analysis
Data Sources
2.13 This section uses a variety of data sources to inform the before and after analysis of changes in traffic volumes. To complete this evaluation, data from before construction of Phase 2 (March 2006), OYA opening (March 2010) and FYA opening (March 2014) is compared. Before and after data has been collected for neutral periods to avoid seasonal variation impacting on the results.
Traffic Volume Data Sources
2.14 For the purpose of this evaluation study, the following source has been utilised:
Permanent traffic count data obtained from the TRADS database for count locations on Highways England’s network for before construction, OYA and FYA.
2.15 The locations of the traffic count data sites used in this evaluation are summarised in Figure 2.2.

Post Opening Project Evaluation
A2 Bean – Cobham (Phase 2) Five Years After Study
17
Figure 2.2 Location of Traffic Counts
Site Location
A A2 west of M25
B A2 east of M25
C A2 east of Bean
D A2
E A2
F A2
G M2 Between J1 – 2
H M2 Between J2 – 3
I M20 Between J1 – 2
J M20 Between J2 – 3
K M20 Between J3 – 4
L M20 Between J4 – 5

Post Opening Project Evaluation
A2 Bean – Cobham (Phase 2) Five Years After Study
18
Observed Flows
2.16 As per the OYA report, observed ADT flows for the A2 and M2 are presented by direction in Figure 2.3. Combined flows for the A2 and M2 and flows for the wider area are shown in Figure 2.4.
Figure 2.3 Observed Before Construction, OYA and FYA by Direction (ADT) Flows

Post Opening Project Evaluation
A2 Bean – Cobham (Phase 2) Five Years After Study
19
Figure 2.4 Observed Before Construction, OYA and FYA Two-Way (ADT) Flows

Post Opening Project Evaluation
A2 Bean – Cobham (Phase 2) Five Years After Study
20
2.17 Figure 2.3 demonstrates that:
There have been increases in traffic from the before period to FYA at all sites except at Site A (WB) beyond the regional variation in traffic over time;
Traffic increased from the OYA stage to the FYA stage at all sites;
Traffic volumes decrease along the A2 from sites C to F and onwards to the M2, suggesting that use of the A2 is highest along Phase 1 and part of Phase 2 of the scheme; and
As would be expected, differences in traffic travelling eastbound and westbound are roughly consistent with each other.
2.18 Figure 2.4 demonstrates that:
Whereas consistent increases in traffic flows have been observed at sites A – H, traffic flows have generally decreased across the sites along the M20, suggesting that traffic may have migrated to the A2/M2 route. However, the reductions in traffic are fairly small and are not enough to account for the increases along the A2, particularly when considering the regional reductions in traffic;
This may imply that the opening of Ebbsfleet International and other developments in the area have generated traffic flows in the area, or that traffic has switched from other routes, such as the A226 and B260; and
Traffic flows on the M20 increase significantly at junction 3.
2.19 Traffic flow increases on the A2 are further to the wider traffic flow changes shown in Figure 2.1, which suggests a decrease in traffic in recent years. However, the reductions in traffic along the M20 partly account for this, and may suggest that traffic has transferred from other routes with the opening of this scheme.
Heavy Goods Vehicle (HGV) Flows
2.20 Table 2.2 provides observed HGV flows and the percentage of total flow that this represents along the A2 and M2. The length of 5.2m has been used throughout this evaluation as it is the only classification available in the older TRADS data.
Table 2.2 HGV Proportions on the A2 and M2
2.21 As can be seen from Table 2.2, the proportion of HGVs has increased from the before period (2006) to the FYA period (2014). This occurs at all sites except Site H, where the proportion of HGVs is roughly in line with the previous years. The FYA figures are less consistent than across the before and OYA periods.
2.22 The increases in the proportion of HGVs is fairly substantial, further to the general increases in traffic flows along the route shown in Figure 2.3. This could be partly due to an increase
Route Site
Reference Direction
Weekday HGV% of AWT (Length- 5.2m)
Before OYA FYA
A2
D EB
17% N/A 26%
WB
17% N/A 19%
E EB
16% 16% 36%
WB
11% 15% 37%
F EB
17% 16% 25%
WB
18% 16% 19%
M2
G EB
18% 17% 19%
WB
18% 17% 31%
H EB
17% 20% 19%
WB
20% 17% 17%

Post Opening Project Evaluation
A2 Bean – Cobham (Phase 2) Five Years After Study
21
in transportation of goods, particularly in terms of home deliveries, but could also be partly attributed to drivers choosing the route when travelling between London/the Midlands and Dover/Folkestone.
Screenline Analysis
2.23 In order to investigate any potential re-routing as a result of the scheme, a screenline analysis has been undertaken using screenlines identified in Figure 2.5. Traffic crossing screenlines represents vehicle movements across a wider corridor and can therefore better represent traffic flow changes than studying individual roads in isolation.
2.24 Two strategic screenlines have been selected for this study. These are as follows:
Screenline 1: East – west routes from A2 to M20 at junctions 2 – 3; and
Screenline 2: East – west routes from A2 to M20 at junctions 3 – 4.
2.25 These screenlines use data taken from TRADS sites and will provide an indication of whether traffic has been redistributed, possibly as a result of the scheme. These screenlines have been selected to understand whether traffic travelling between Dover/Folkestone and London/the Midlands choose to use the M2/A2 route or the M20.
2.26 The traffic flows across the screenlines are presented in Table 2.3.
Figure 2.5 Identification of Screenlines

Post Opening Project Evaluation
A2 Bean – Cobham (Phase 2) Five Years After Study
22
Table 2.3 Two Way Traffic Flows across Screenlines
2.27 Table 2.3 provides a summary of traffic flows across the screenlines. Key points to note are:
Screenline 1:
- Overall traffic flows have increased by 10%, with traffic increasing by 14% on the A2; and
- Traffic reassignment has occurred as traffic has transferred from the M20 to the A2, which could be partially as a result of the scheme.
Screenline 2:
- Traffic flows have again increased on the A2 and decreased along the M20, again showing traffic reassignment onto the A2.
Forecast and Observed Traffic Impacts
Study Area
2.28 The Traffic Forecasting Report (TFR) (October 2004) details the pre-scheme traffic forecasts. The report provides forecasts for the following major links:
A2 between M25 J2 and M2 J1;
M20 between M25 J3 and M20 J3; and
M25 between J1a and J3.
Traffic Forecasting
2.29 The TFR was based on a SATURN model from 2003. The basis for traffic growth was obtained from TEMPro for 2003 to provide local forecasting. Additionally, development plans of Dartford, Gravesham, and Kent County Council were built into the SATURN modelling for future years, and the predicted impacts of the opening of Ebbsfleet International Station were also included. For Phase 2, the Do Minimum (DM) network assumed Phase 1 had been completed.
2.30 Elastic assignment as an indicator of variable trip demand was used in the modelling. The results showed that Phase 2 of the scheme was forecast to cause a marginal increase in traffic, over and above the Do Minimum scenario.
2.31 The model accounted for the following major changes to the highway network which would occur in the DM and Do Something (DS) scenarios:
Description of Site
Two Way Traffic Flow (ADT)
Before (2006)
FYA (2014)
Difference Percentage Difference
Scre
en
lin
e 1
A2 Bean – Ebbsfleet 127,000 147,800 20,700 14%
M20 J1 – 2 57,400 55,300 -2,100 -4%
Screenline Total 184,500 203,000 18,600 10%
Scre
en
lin
e 2
A2 Marling Cross 110,100 123,300 13,200 12%
M20 J3 – 4 104,500 100,300 -4,200 -4%
Screenline Total 214,600 223,700 9,000 8%

Post Opening Project Evaluation
A2 Bean – Cobham (Phase 2) Five Years After Study
23
A2 Bean – Cobham Phase 1;
A2/M2 widening;
A2/A282 Dartford Improvement; and
Links for developments at the former chalk pit Eastern Quarry and at the Swanscombe peninsula.
2.32 Forecasts have been provided in the TFR for the years 2007, 2012, 2022 and 2032. It is worth noting that although 2007 was the expected opening year for the scheme, the works were not complete until 2009. Forecasts have been calculated for 2014 in a low growth, DS situation.
2.33 To provide a suitable basis for comparison between the forecast and observed data, forecast flows for 2014 have been calculated based on a straight line interpolation between 2012 and 2022. These interpolated forecasts and the observed data for the DS situation are shown in Table 2.4 for AADT and hourly flows in the AM, IP and PM periods.
Forecast vs. Observed DS Traffic Flows
2.34 Annual Average Daily Traffic (AADT) flows on sections of the A2 have been obtained in order to make a direct comparison with the AADT Central Growth Forecasts. The figures presented in the following table do therefore not match those presented earlier in this chapter, which were ADT flows.
Do Something Scenario
2.35 A comparison of the DS forecast traffic flows and those observed on the A2 at FYA is provided in Table 2.4.
Table 2.4 Forecast and Observed Flows for the Do Something Scenario
Section of A2
Direction
Forecast (2014) 2014 Observed % Difference
AADT AM IP PM AADT AM IP PM AADT AM IP PM
Pepperhill - Tollgate
EB 68,000 4,500 4,000 6,600 69,800 4,100 3,800 7,800 2.6% -9% -6% 19%
WB 71,100 6,600 4,200 4,900 70,800 6,800 3,700 4,700 -0.4% 2% -13% -6%
Tollgate – Marling Cross
EB 62,000 4,200 3,600 6,200 67,900 4,200 3,700 7,500 9.5% 1% 2% 22%
WB 67,300 6,300 3,900 4,900 68,500 6,400 3,600 4,700 1.8% 1% -8% -5%
Marling Cross – Cobham Junction
EB 58,500 4,100 3,300 5,800 61,800 4,000 3,300 6,700 5.7% -3% 0% 15%
WB 63,700 6,100 3,600 4,600 60,100 5,500 3,100 4,300 -5.5% -10% -15% -7%
Note- AADT figures are collected from October 2013 – November 2014, to provide an average over a full year. Figures for AM, IP and PM periods are taken from March 2014, as per previously in the report.
2.36 The main points to note from Table 2.4 are as follows:
Along the A2 from Pepperhill to Marling Cross, AADT observed figures were higher than forecast;

Post Opening Project Evaluation
A2 Bean – Cobham (Phase 2) Five Years After Study
24
Along the A2 from Marling Cross to M2 J1, observed AADT figures were lower than forecast in the TFR;
Observed traffic flows during the AM peak were roughly in line with forecasts along the section of the A2 from Pepperhill – Marling Cross; and
The largest discrepancies between forecast and observed figures can be seen from Tollgate to Marling Cross, where during the PM peak, with observed figures 20% higher than were forecast.
Do Minimum Scenario
2.37 The forecast flows for the DM scenario and the observed before scheme construction flows are shown in Table 2.5. 2006 was chosen as the period before the scheme began construction to enable comparison with the DM scenario.
Table 2.5 Forecast and Observed Flows for the Do Minimum Scenario
Section of A2 Direction Forecast AADT
(2007) Observed AADT
(2006) % Difference
Pepperhill – Tollgate
EB 51,500 60,200 17%
WB 56,400 60,900 8%
Tollgate – Marling Cross
EB 51,400 60,800 18%
WB 51,900 58,500 13%
Marling Cross – Cobham Junction
EB 47,800 55,500 16%
WB 50,600 55,400 9%
2.38 Table 2.5 shows that observed traffic flows along the A2, before the scheme was constructed, were higher than those forecast, by as much as 18%. The DS flows were also lower in many cases in Table 2.4, although the discrepancies seen between the forecast and observed flows in the DM scenario are greater than those in the DS scenario. These results may suggest that traffic growth forecasts were underestimated pre-construction and that the increase in traffic flows may not be wholly attributable to the scheme.
Journey Time Analysis
2.39 Journey time analysis has been undertaken to understand the impact of the scheme on journey times along the A2 between Pepperhill and the M2 at Junction 1. This assessment is comprised of the following:
Analysis of observed before scheme construction and FYA journey times on the A2 from Pepperhill to M2 Junction 1; and
A comparison of forecast and observed FYA journey times along this section.
2.40 It is worth noting that journey times are considered along the section of the A2 from the end of the scheme from Cobham Junction to M2 J1. The reason for this is that this is classed as one link in the JTDB.
Journey Time Data Source
2.41 Journey times along the A2 from Pepperhill to M2 J1 were obtained from Highways England’s Journey Time Database (JTDB) for before both phases of the scheme opened.
Scheme Objective: Reduce journey times and improve reliability

Post Opening Project Evaluation
A2 Bean – Cobham (Phase 2) Five Years After Study
25
Data was also gathered for FYA the opening of Phase 2. The two were then compared to understand whether the scheme has had an impact on journey times along the route. 2002 was used as the ‘before’ scheme period, when neither phase of the scheme had been constructed. This is because when comparing results between after the opening of Phase 1 and FYA the opening of Phase 2, benefits were thought to be significantly understated and not representative of the benefits of Phase 2. Therefore, this section compares data for the month of March in 2002 (before Phases 1 or 2) with 2014 (FYA opening of Phase 2).
2.42 The following weekday time periods were analysed as per the OYA report:
Morning peak (07:00 – 10:00);
Inter-peak (10:00 – 16:00); and
Evening peak (16:00 – 19:00).
2.43 Journey times were analysed along the A2 from Pepperhill junction (A2260) to M2 Junction 1, in both directions. Data was collected for the links A227 – M2 Junction 1 and A2260 – A227 and combined to provide times for the entire route. This route is shown in Figure 2.6.
Figure 2.6 Journey Time Analysis Route
Journey Time Results
2.44 Table 2.6 presents the before and FYA journey time savings along the route shown in Figure 2.6.

Post Opening Project Evaluation
A2 Bean – Cobham (Phase 2) Five Years After Study
26
Table 2.6 Observed Journey Times Before and After Scheme Opening
Total- Combined Route
EB WB
AM IP PM AM IP PM
Before (mm:ss) 05:46 05:58 07:09 08:54 05:50 05:41
FYA (mm:ss) 04:56 04:58 05:10 05:54 05:03 04:58
Saving (mm:ss) 00:50 01:00 01:59 03:00 00:47 00:43
2.45 The key points from Table 2.6 are as follows:
Post-opening journey time savings are experienced throughout all time periods, in both directions;
The greatest improvements can be seen during the AM peak in the westbound direction, with a saving of three minutes; and
Savings are fairly significant, with the smallest saving being more than 40 seconds.
Forecast vs. Observed Journey Times
2.46 The TFR provided forecast journey times for the A2 between the M2 and M25 for the DM and DS scenarios. The DM scenario included the completion of the A2/A282 Dartford Improvement Scheme. The TFR reported journey time forecasts for 2007 and 2012 for the M25 to the M2. Comparing these forecasts with the before and after observed journey times would add the impact of the A2/A282 Dartford Improvement Scheme which was under construction in 2006. Instead, forecast journey time savings between Pepperhill Junction and M2 J1 have been calculated using the forecast speeds on each intermediate section of the A2. Table 2.7 presents the forecast and outturn journey time savings.
Table 2.7 Forecast and Outturn Journey Time Savings- Pepperhill Junction – M2 J1
Direction Time Period
Forecast Saving (Do Minimum – Do Something in Opening Year (Low Growth)
(mm:ss)
Observed 2002 – 2014 Savings
(mm:ss)
EB
AM 01:17 00:50
IP 00:50 01:00
PM 02:14 01:59
WB
AM 02:50 03:00
IP 00:50 00:47
PM 01:22 00:43
2.47 From Table 2.7, the following observations can be made:
The observed journey time savings are roughly in line with those forecast. In some cases, the observed journey time savings exceed the forecast savings, although in more instances, the savings are lower than forecast. Where the observed journey time saving is less than forecast, the difference in observed and forecast figures is

Post Opening Project Evaluation
A2 Bean – Cobham (Phase 2) Five Years After Study
27
greater than the differences shown where there are journey time savings greater than forecast; and
Where the largest saving was forecast- during the AM peak in the westbound direction- the largest savings were observed, and these were higher than expected.
Journey Time Reliability
Background
2.48 It should be noted that journey times are fairly consistent throughout the day and whilst data is not available for quantitative assessment of reliability, the journey time results suggest that day-to-day variability in journey times will have reduced. As a result, the impact of the scheme on the reliability sub-objective is beneficial, with more consistent journey times experienced.
Forecast
2.49 The AST did not provide route stress statistics but the reliability forecast given in the AST states that improvements to the A2 in terms of capacity, alignment and junction access will result in more consistent journey times.
Observed Route Stress
2.50 Route stress statistics have been calculated for before and after scheme opening as shown in Table 2.8. WebTAG states that where stress values are less than 75% or greater than 125%, values of 75% and 125%, respectively, should be used. However, this is not the case in this instance, and so the calculated route stress is shown.
Table 2.8 Calculation of Route Stress on the A2
Calculated Outturn Stress (Adjusted Stress)
Before Scheme Opening FYA Scheme Opening
Site F, A2 91% 84%
2.51 Table 2.8 shows that the route stress has decreased from 91% to 84% from the before period to five years after the scheme opened. The route stress figure remains fairly low, despite the increase in traffic observed on the route.

Post Opening Project Evaluation
A2 Bean – Cobham (Phase 2) Five Years After Study
28
Key Points- Traffic
Traffic Flows ADT traffic flows on the A2 have increased since the scheme opening, which is contrary to the
background reductions experienced across the UK.
Traffic flows have decreased slightly along the M20. This suggests that some re-routing on to
the A2 has occurred.
Traffic Forecasts Traffic flows on the A2 increased more than was forecast, by a difference of 0.4% to around
10%. Traffic flow forecasts were underestimated pre-construction, which means that traffic
flows increases may not be wholly attributable to the scheme.
Journey Times Analysis of journey times shows that there have been savings in both directions across all time
periods, with substantial savings observed in some time periods.
Journey time forecast savings for the scheme section of the A2 were slightly overstated.
Reliability
Route stress has decreased from the pre-scheme period to the post-scheme period.
Reliability along the route is likely to have improved with the introduction of the scheme, despite
increased traffic flows.

Post Opening Project Evaluation
A2 Bean – Cobham (Phase 2) Five Years After Study
29
3. Safety Evaluation
Introduction
3.1 This chapter examines the impact of the scheme on safety. The DfT’s objectives for transport set out the principle objectives to reduce collisions and improve security. This includes reducing the loss of life, injuries and damage resulting from transport collisions and crime.
3.2 In order to assess the scheme’s impact on collisions, this chapter of the report analyses changes in Personal Injury Collision (PICs) occurring in the five year periods before construction of the scheme and after the scheme opening.
3.3 For the safety objective, the AST states that:
‘Users and non-users will benefit from a reduction in accidents on the network’.
Collision Study Areas
3.4 The study area chosen for analysis is identical to the OYA study area. This is different to the area used in the assessment of the forecasts published in the AST. The forecast used an area which includes many local roads for which the impacts of the changes to the A2 are likely to be only a minor factor, compared to many other impacts including localised changes. For this reason, the urban local authority roads have been omitted from the wider area evaluation. The two study areas are as follows:
Wider Area: this includes the A2 from the M25 J2 to M2 J4 (Phases 1 and 2 of the scheme), the parallel routes of the A226 and M20 and the major connecting routes from the M20; and
Phase 2 of A2: this is the scheme section of the A2, from Pepperhill to M2 J1. The section from Cobham Junction to M2 J1 was included due to an increase in traffic flows along this section consistent with those along the scheme section. Collisions may have therefore been affected by this increase in traffic just outside of the scheme area.
Data Sources
Forecast Data
3.5 COBA was used to model the safety impact of the scheme and forecast the benefits, although the COBA model was not available for POPE. An approximation was instead estimated in the POPE OYA study based on the 60 year forecast saving and using the accident capitalisation factors given in the PAR guidance.
Observed Data
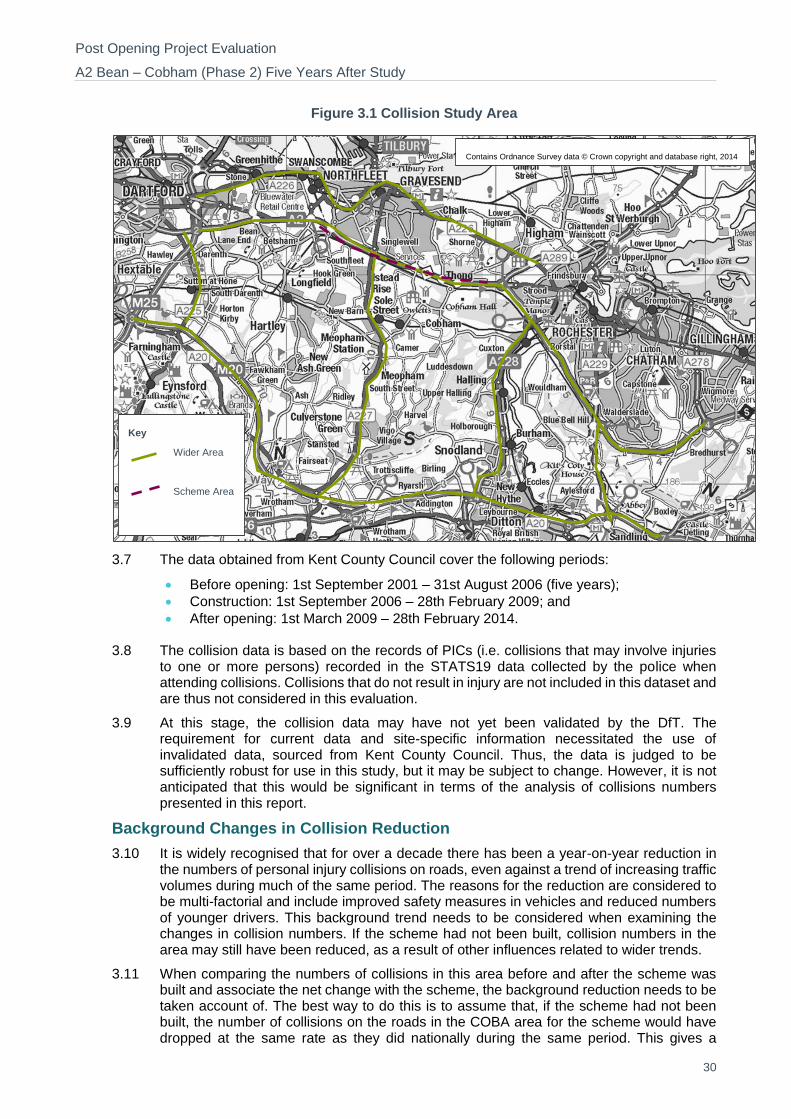
3.6 Collision data has been obtained from Kent County Council, with input from Medway Council where the study area crossed a local authority border. Figure 3.1 identifies the collision area.
Post Opening Project Evaluation
A2 Bean – Cobham (Phase 2) Five Years After Study
30
Figure 3.1 Collision Study Area
3.7 The data obtained from Kent County Council cover the following periods:
Before opening: 1st September 2001 – 31st August 2006 (five years);
Construction: 1st September 2006 – 28th February 2009; and
After opening: 1st March 2009 – 28th February 2014.
3.8 The collision data is based on the records of PICs (i.e. collisions that may involve injuries to one or more persons) recorded in the STATS19 data collected by the police when attending collisions. Collisions that do not result in injury are not included in this dataset and are thus not considered in this evaluation.
3.9 At this stage, the collision data may have not yet been validated by the DfT. The requirement for current data and site-specific information necessitated the use of invalidated data, sourced from Kent County Council. Thus, the data is judged to be sufficiently robust for use in this study, but it may be subject to change. However, it is not anticipated that this would be significant in terms of the analysis of collisions numbers presented in this report.
Background Changes in Collision Reduction
3.10 It is widely recognised that for over a decade there has been a year-on-year reduction in the numbers of personal injury collisions on roads, even against a trend of increasing traffic volumes during much of the same period. The reasons for the reduction are considered to be multi-factorial and include improved safety measures in vehicles and reduced numbers of younger drivers. This background trend needs to be considered when examining the changes in collision numbers. If the scheme had not been built, collision numbers in the area may still have been reduced, as a result of other influences related to wider trends.
3.11 When comparing the numbers of collisions in this area before and after the scheme was built and associate the net change with the scheme, the background reduction needs to be taken account of. The best way to do this is to assume that, if the scheme had not been built, the number of collisions on the roads in the COBA area for the scheme would have dropped at the same rate as they did nationally during the same period. This gives a
Key
Wider Area
Scheme Area
Contains Ordnance Survey data © Crown copyright and database right, 2014

Post Opening Project Evaluation
A2 Bean – Cobham (Phase 2) Five Years After Study
31
counterfactual ‘without scheme’ scenario on a like-for-like basis with the observed post-opening data, which is the ‘with scheme’ scenario.
3.12 The comparison needed is between the middle year in the after period and the middle of the pre-construction period. Therefore, the comparison is between the years 2004 and 2011. The approach is to use national data to calculate changes in the number of collisions in this period occurring on ‘A roads’, which broadly represents the A2 and surrounding roads. Figure 3.2 illustrates the changes in collision numbers by road type between 2004 and 2011.
3.13 The difference between the numbers of collisions in these two scenarios can then be attributed to the scheme rather than wider national trends. The result will inform the calculation of monetised safety benefits achieved by the scheme as discussed in the economy chapter of this report.
Figure 3.2 Trends in Injury Collision Numbers
Collision Numbers
3.14 This section analyses observed changes in the number of PICs and the relative severity of collisions following the implementation of the scheme. It has not been possible to analyse changes in the number of casualties as the data obtained from Kent County Council does not detail casualty information.
Collisions – Wider Area
3.15 The wider area presents collisions on the A2/M2 corridor and the parallel routes of the M20 and A226, as well as the main links between these routes. Some of the connecting routes from the M20 have been included in this area as the scheme could potentially attract users of this route to the newly improved A2/M2 corridor.
3.16 The evaluation of before and after opening collision numbers for collision area using the before scheme construction counterfactual number of collisions, which is an alteration based on the counterfactual scenario, is shown in Table 3.1.

Post Opening Project Evaluation
A2 Bean – Cobham (Phase 2) Five Years After Study
32
Table 3.1 Number of Collisions by Severity in the Wider Area
3.17 The main points to note from Table 3.1 are as follows:
The average annual number of PICs on the roads in the wider area has increased by 27.9 collisions with the introduction of the scheme. This is taking into account the without scheme counterfactual; and
The severity rate has decreased from 15.6% to 8.7%, showing a reduction in the number of collisions classed as fatal and serious.
3.18 Although the number of collisions has increased, it is worth noting that the average annual collision figures in the FYA report for Phase 1 and OYA report for Phase 2 were much higher, indicating an overall reduction in collisions with the introduction of the scheme as a whole. It is also likely that surrounding highways schemes impacted on collision numbers.
3.19 A statistical test3 was carried out on these collision numbers for the wider area. The test used the without scheme counterfactual and post-opening numbers of collisions to establish whether the change in collision numbers between these period is significant or is likely to have occurred by chance. The test found that the observed increase in collisions was significant, and that we can be 95% confident that the change is not a result of chance alone, and therefore the scheme has had an impact on collision rates. However, this does not take into account the reduction in the severity index. Also, as shown in Table 1.1, the impact of a large number of schemes being constructed in the area surrounding the A2 would not be shown in this test. Therefore, it is not possible to attribute an increase in collision numbers to this scheme alone.
Collisions – Key Links (A2- Phase 2)
3.20 In addition to considering the changes in the number of collisions in the wider area, analysis has been undertaken to understand the changes in collisions along the scheme area, from Pepperhill to Cobham. Table 3.2 presents before and after scheme opening collision numbers by year for the scheme area, and shows the counterfactual without scheme collisions.
3 Chi-square with a 95% confidence level
Time Period
Date Number of Collisions Annual Average Average Severity
Index From To Fatal Serious Slight Total Fatal Serious Slight All
Before Scheme Opening
Sep 2001 Aug 2002 11 56 325 392
7.6 47.8 355.2 410.6 15.6%
Sep 2002 Aug 2003 3 53 352 408
Sep 2003 Aug 2004 6 43 393 442
Sep 2004 Aug 2005 7 41 348 396
Sep 2005 Aug 2006 11 46 358 415
Without scheme counterfactual 303.9 -
After Scheme Opening
Mar 2009 Feb 2010 3 29 307 339
4.2 25.2 302.4 331.8 8.7%
Mar 2010 Feb 2011 5 31 303 339
Mar 2011 Feb 2012 4 17 304 325
Mar 2012 Feb 2013 3 19 289 311
Mar 2013 Feb 2014 6 30 309 345
Change in annual average collision numbers 27.9 -

Post Opening Project Evaluation
A2 Bean – Cobham (Phase 2) Five Years After Study
33
Table 3.2 Number of Collisions on Key Link (A2 – Phase 2)
3.21 The main points to note from Table 3.2 are as follows:
Comparing annual average numbers of collisions in the pre-scheme and post-scheme data shows negligible change of 0.3 on the key section of the A2; and
The severity index of collisions has decreased by 6.3%, showing that numbers of fatal and serious collisions have fallen compared with those classified as slight.
3.22 In order to analyse these results while ignoring the impact of the increase in traffic flows along the A2, the collision rate has been calculated later on in this chapter.
3.23 A chi-squared test was also carried out on the specific scheme section, which is the focus of this analysis. This test determined that the observed marginal increase in collisions along the scheme section was not statistically significant: we can be 95% confident that the change in collision numbers could have occurred by chance alone and therefore the change in accident rates is not necessarily a direct impact of the scheme.
Collision Locations
3.24 The location of collisions occurring along the scheme section are fairly evenly distributed along the route, with slight clusters of collisions at junctions, as would be expected. The locations of collisions is shown in Figure 3.3, by severity. The collisions classed as slight are evenly distributed, and there appears to be no pattern to the location of collisions classed as serious.
Time Period Date Number of Collisions Annual Average Average
Severity Index From To Fatal Serious Slight Fatal Serious Slight All
Before scheme
construction
Sep 2001 Aug 2002 0 6 43
0.4 7.2 47 56.1 13.5%
Sep 2002 Aug 2003 0 6 44
Sep 2003 Aug 2004 0 6 55
Sep 2004 Aug 2005 0 5 49
Sep 2005 Aug 2006 2 13 44
Without scheme counterfactual 41.5 -
Post-scheme
Mar 2009 Feb 2010 0 3 32
0.2 2.8 38.2 41.8 7.2%
Mar 2010 Feb 2011 0 2 39
Mar 2011 Feb 2012 0 3 39
Mar 2012 Feb 2013 0 1 43
Mar 2013 Feb 2014 1 5 38
Change in annual average collision numbers 0.3 -

Post Opening Project Evaluation
A2 Bean – Cobham (Phase 2) Five Years After Study
34
Figure 3.3 Collision Locations
Collision Rates – A2
3.25 The number of collisions along a length of road together with its AADT can be used to calculate a collision rate (calculated as number of collisions per million vehicle kilometres). By looking at the rate it is possible to identify the impact of the road of interest whilst ignoring the impact of the change in traffic volumes.
3.26 Collision rates are shown in Table 3.3.
Table 3.3 Collision Rates on the A2 Scheme Section
Time Period Collision
Rate (PIC/mvkm)
Five years before scheme opening 0.145
Five years before opening counterfactual rate
0.109
Five years after scheme opening 0.093
Observed saving 0.016 (15%)
3.27 From Table 3.3, it can be seen that following the opening of the scheme, there has been an observed saving of 0.016 PIC/mvkm. This takes into account the before scheme opening counterfactual rate. The observed five year after scheme opening collision rate is 0.093 PIC/mvkm, compared with an adjusted pre-scheme rate of 0.109.

Post Opening Project Evaluation
A2 Bean – Cobham (Phase 2) Five Years After Study
35
Forecast vs. Observed Collision Savings
3.28 This section compares the number of observed collisions with those forecast in the COBA model. As mentioned in Paragraph 3.5, the COBA model was not available for the POPE of the A2. Forecasts of the collision saving in the opening year is normally only found in the COBA model, hence no precise forecast for collision numbers saved in the opening year is known. A rough approximation has been obtained by using the accident capitalisation factors given in the PAR guidance. This was undertaken at the OYA stage.
3.29 The forecast changes in collision and casualty numbers as provided in the AST are shown in Table 3.4. A weighted value has been included and is based on 60:40 of low and high growth (which was the standard when this scheme was appraised). From this information, an estimate of the forecast opening year collision saving has been made.
Table 3.4 Safety Forecasts from AST
Forecast Savings with Scheme (Wide Area) Central Growth
60 year collision saving
Fatal 9.3
Serious 54.7
Slight 987.2
Opening year collision saving (POPE estimate) 7.4
3.30 Table 3.4 shows that 7.4 PICs were forecast to be saved during the opening year. From the observed collisions, it can be seen that this was an overestimation, with collisions increasing over the expected without scheme situation.
Personal Security
3.31 The aim of this sub-objective is to reflect both changes in security and the likely number of users affected. In terms of roads, security includes the perception of risk from personal injury, damage to or theft of vehicles, and theft of property for individuals or from vehicles in the following areas:
On the road itself (e.g. being attached whilst broken down);
In service areas, car parks etc. (e.g. vehicle damaged while parked at a service station, being attached whilst walking to a parked car); and
At junctions (e.g. smash and grab incidents while queuing at lights).
3.32 The primary indicators for personal security on roads include:
Surveillance;
Landscaping;
Lighting and visibility;
Emergency call facilities; and
Cyclists and pedestrian facilities.
3.33 The scheme appraisal scored personal security as ‘moderate beneficial’, with benefits being achieved for NMUs through the replacement of subways with footbridges. Additionally, landscaping was designed to provide clear sight lines so that there were no hidden areas. These elements were implemented as expected.
3.34 Overall, the scheme is assessed as having a ‘moderate beneficial’ impact on personal security, as forecast in the AST.

Post Opening Project Evaluation
A2 Bean – Cobham (Phase 2) Five Years After Study
36
Key Points- Safety
Collisions
Once national background trends are accounted for, following scheme opening, collision numbers
on the section of the A2 within this scheme have remained fairly consistent with no significant
change.
The collision rate on the A2 after scheme opening is 0.093 PIC/mvkm, compared with an adjusted
pre-scheme rate of 0.109. This is a saving of 15%, showing that the accident rate has decreased.
The collision severity rate has reduced both on the A2 scheme section and in the wider area.
Forecast vs. Observed Collision Numbers The COBA model was unavailable for POPE, but it is estimated that the appraisal had an opening
year saving of 7.4.The observed collision numbers in the wider area were higher than forecast.
Personal Security
As part of the scheme, subways were replaced with footbridges to improve personal security.
The personal security sub-objective receives a score of ‘moderate beneficial’, as expected.

Post Opening Project Evaluation
A2 Bean – Cobham (Phase 2) Five Years After Study
37
4. Economy
Introduction
4.1 The purpose of this chapter is to evaluate the scheme’s performance against the economy objective, which consists of the following sub-objectives:
Achieve good value for money in relation to impacts on public accounts;
Improve Transport Economic Efficiency (TEE) for business users, transport provide and consumer users;
Improve journey reliability; and
Provide beneficial wider economic impacts.
4.2 This section provides a comparison between the outturn costs and benefits and the forecast economic impacts, as well as considering the wider economic impacts of the scheme. Outturn journey time and safety economic impacts are based upon the observed results reported in Chapters 2 and 3.
4.3 The original Phase 2 economic appraisal was based on Phase 1 having already been completed and the assumption that the A2/A282 Dartford scheme would be completed. As this reflects the current situation, comparisons can be made between the forecast benefits and the outturn benefits at the five year after stage.
Sources
4.4 The following documents and tools have been utilised to inform the post-opening evaluation of the scheme benefits:
Economic Assessment Report (EAR), October 2004;
Traffic Forecasting Report (TFR), October 2004;
COBA (used for appraising safety benefits);
QUADRO (used to appraise construction impacts);
Transport Economic Efficiency (TEE) i.e. journey time savings and vehicle operating costs were appraised using TUBA from outputs of the SATURN simulation and buffer highway model which covered the study area; and
Outturn Costs from Regional Finance Manager (RFM), provided in December 2014.
4.5 The reports provide an original appraisal forecast for 30 or 60 year appraisal period based on a 2007 opening year. This chapter presents outturn figures based on 2014 in comparison to a 60 year forecast. All costs presented in this chapter are in 2002 prices unless otherwise stated.
4.6 Journey time and safety benefit monetary forecast savings are taken from the AST TAG worksheets as the EAR was based on 30 years and the AST on 60 years.
Present Value Costs
4.7 Cost benefit analysis of a major scheme requires all the costs to be considered for the whole of the appraisal period and they need to be expressed on a like-for-like basis with the benefits. This basis is termed Present Value. Present Value is the value today of an amount of money in the future. In cost-benefit analysis, values in differing years are converted to a standard base year by the process of discounting giving a present value.
4.8 The full Present Value Costs (PVC) for this scheme comprises of the following costs converted to present value:
Investment costs; and
Impact on indirect tax revenues during the scheme life.

Post Opening Project Evaluation
A2 Bean – Cobham (Phase 2) Five Years After Study
38
Investment Costs
4.9 This section compares the forecast cost of the scheme with the outturn cost. Scheme costs include the cost to Highways England of constructing the scheme and purchasing land.
4.10 The forecast cost of the scheme at the works commitment stage was obtained. Table 4.1 shows the forecast costs compared with the outturn costs in 2002 prices, to enable comparison.
Table 4.1 Summary of Investment Costs (2002 Prices)
Forecast Cost (£m) Outturn Cost (£m)
Works, preparation and supervision
£101.8m £97.0m
Land £14.1m £16.4m
Total £115.9m £113.4m
4.11 Table 4.1 shows that the outturn cost for the A2 Bean – Cobham scheme (Phase 2) is £113.4 million, £2.5 million (2%) lower than forecast. Converted to into present value cost (PVC), this figure is £118.83m, which is the figure compared with the benefits used to work out the scheme’s benefit cost ratio (BCR).
Indirect Taxation
4.12 Indirect tax revenue impact is the expected change in indirect tax revenue to the Government due to changes in the transport sector as a result of the scheme over the appraisal period.
4.13 A highway scheme may result in changed fuel consumption due to the following:
Changes in speeds resulting in greater or less fuel efficiency for the same trips;
Changes in the distances travelled; and
Increased road use through induced traffic or the reduction of trip suppression.
4.14 For this scheme, there is inconsistency in the treatment of tax impact in the various economic forecasts.
4.15 The EAR reported that the modelling showed that the scheme would result in an overall reduction in fuel consumption due to reduced delays. This results in a reduction in the tax revenues raised from fuel and hence the impact to HM Treasury would be to increase the cost of the scheme. The forecast indirect tax in this report was in the range of £9m - £12m in 1998 prices over 30 years. The EAR is superseded by the later AST worksheets. The AST worksheet stated that tax revenue loss during both scheme construction (as assessed by QUADRO) and during scheme operation (as assessed by TUBA) were included in the assessment of the public accounts sub-objective. However, the detail of the figures presented in the AST worksheet document do not include the TUBA figure for tax impact during scheme operation. The details of the TUBA assessment could not be obtained.
4.16 The most recent pre-construction forecast of the capital costs as shown in Table 4.1 was £115.9m, whereas the AST shows a PVC based on central growth of £122.0m. If it is assumed the same capital costs were used in both, the indirect tax impact (i.e. loss of revenue) which comprises the difference is, therefore, £6.1m. For the purpose of this evaluation, it is assumed that the indirect tax impact is as forecast. This is due to uncertainties in the assessment area: it is not clear where the impact was generated, as the forecast was carried out for a wider area.
4.17 Therefore, it is assumed that over 60 years, the amount of fuel duty paid by drivers was forecast to be £6.1m less than it would have been without the scheme.

Post Opening Project Evaluation
A2 Bean – Cobham (Phase 2) Five Years After Study
39
4.18 This assumed value is incorporated into the calculations of the Benefit Cost Ratio in Table 4.2.
Present Value Benefits
4.19 The forecast monetised benefits for the scheme have been extracted from the relevant documents and converted to 2002 prices and values for comparative purposes. These forecast benefits have then been compared to calculated outturn benefits based on data collected in previous chapters.
4.20 Maintenance delay was not included in the assessment of this scheme, the reason for which is not provided in the AST worksheet document. However, the EAR (2004) stated that this had not been assessed due to its likely insignificant impact.
4.21 Table 4.2 summarises the figures for central growth figures as provided in the published forecasts. These are in 2002 prices and values.
Table 4.2 Forecast Present Value Benefits for Phase 2
PVB (£m) Evaluation Approach
TEE (Journey Time and Vehicle Operating Costs)
£386.1m
Journey Time and Vehicle Operating Costs were not split in
the AST so are evaluated as one.
Safety £27.1m Assess using safety benefits
presented in Chapter 3.
Construction Delay £-52.8m Assume this is as forecast.
Total PVB £360.4m -
Transport Economic Efficiency
Journey Time Benefits
4.22 The TUBA model used to determine the benefits of Phase 2 is based on changes to the journey times between origins and destinations and is not split by route. It is not possible to rerun the TUBA model and it is not possible to evaluate the economic impacts at the post-opening stage using direct comparisons between forecast and observed data on individual links.
4.23 In light of these constraints, the PAR method has been used based on observed traffic flows and journey times in the A2 corridor only. The outturn benefits have been determined using capitalisation factors based on both 0% and National Road Traffic Forecasting (NRTF) growth as per the PAR guidance.
4.24 As there is additional traffic along the A2 following the completion of the scheme, the ‘Rule of a Half’ has been used in the calculations of the benefits for these trips. This method provides existing traffic with the full scheme benefits and additional traffic which may have re-routed from elsewhere half the benefits.
4.25 The PAR approach has been used to assess the outturn benefits of journey times. The PAR approach is a simplification compared to the detailed TUBA analysis. The PAR method for monetising TEE benefits is based on the following steps:
Calculate vehicle hours saved in one year;
Multiply by value of time in market prices in the opening year; and
Capitalise the benefits to 60 years and discount to 2002.

Post Opening Project Evaluation
A2 Bean – Cobham (Phase 2) Five Years After Study
40
4.26 Table 4.3 shows the outturn journey time benefits in 2002 prices and values.
Table 4.3 PAR Method for Outturn Journey Time Benefits
PAR Method for Time Saving Benefits
Annual Vehicle Hour Saving in Year 5
EB 301,012
WB 320,544
Total 621,556
Value of Time in opening year of 2009 (one hour) £12.86
Saving capitalised over 60 year appraisal period and discounted
0% Growth NRTF Growth
£248.5m £313.4m
4.27 The results presented in Table 4.3 show that the outturn TEE journey time benefits for the scheme are evaluated to be £313.4m, assuming NRTF rate of traffic growth.
Safety Benefits
4.28 The evaluation of outturn safety benefits is based on the forecast 60 year appraisal period safety benefits and the comparison between the forecast opening year saving and the observed annual average collision saving in the first five years. The economic impact of changes in safety are calculated by assigning monetary benefits to the predicted reduction in the number and severity of personal injury collisions over the appraisal period.
4.29 The results presented in Chapter 3 showed that there was an increase in collision numbers in the wider area. Therefore, no monetised safety benefits are attributed to this scheme in this five years after evaluation.
Construction Delay and Maintenance Benefits
4.30 The DfT’s QUADRO program was used to estimate the economic impact of the scheme on road users in terms of journey times and operating costs during the construction phase and future maintenance periods.
4.31 In the appraisal of Phase 2, it has been stated that maintenance benefits are considered to be negligible and so not assessed. It is noted, however, that there were major underground services located under the old route. Whilst it is beyond the scope of this study to investigate the frequency and costs associated with the traffic management required in order to access these services, it is considered that the maintenance benefits over the 60 years will occur in line with the forecast.
Summary of Present Value Benefits
4.32 A comparison of all forecast and outturn benefits, as discussed in previous sections, is presented in Table 4.4. Forecast safety benefits have not been included in the total PVB to enable comparison with outturn PVB, for which safety benefits have not been monetised. Note that the outturn TEE benefits do not include the impact of vehicle operating cost.

Post Opening Project Evaluation
A2 Bean – Cobham (Phase 2) Five Years After Study
41
Table 4.4 Summary of Present Value Benefits
Benefit Forecast Outturn (NRTF
Growth)
TEE/Journey Time £386.1m £313.4m
Safety £27.1m N/A
Construction Delay -£52.8m -£52.8m
Total PVB £360.4m £260.6m
4.33 Table 4.4 shows that the forecast PVB for the scheme was £360.4m, which takes into account forecast safety benefits. The outturn PVB is £260.6m, which is lower than expected. This can, in part, be attributed to the lack of safety benefit. However, substantial benefits have still been delivered by the scheme.
Benefit Cost Ratio (BCR)
4.34 The benefit-cost ratio (BCR) is an indicator used in the cost-benefit analysis of a road scheme that attempts to summarise the overall value for money of a project or proposal. The BCR is the ratio of the benefits of a project or proposal, expressed in monetary terms, relative to its costs, also expressed in monetary terms. All benefits and costs are expressed in present values. Projects with a BCR greater than 1 have greater benefits than costs, thus providing positive net benefits.
4.35 At the time of scheme appraisal, Treasury guidance was to include indirect tax impact as part of the cost. However, the most recent guidance on indirect tax impacts recommends that it is included as part of the benefit. This means that when a scheme such as this which leads to increased fuel consumption and hence increases indirect tax revenue, the PVB is increased rather than the PVC being decreased.
4.36 Table 4.5 shows the calculation of the BCR using the costs and benefits presented in this chapter, with consideration made for indirect tax impact as a benefit and cost.
Table 4.5 Forecast vs Outturn BCRs
Forecast vs Outturn BCRs Forecast
Outturn
NRTF Growth
Indirect tax as impact on costs
(as appraisal approach)
Present Value Benefits £360.4m £260.6m
Present Value Costs £122.4m £124.9m
Benefit Cost Ratio 2.9 2.1
Indirect tax as impact on benefits
Present Value Benefits £354.3m £254.5m
Present Value Costs £116.3m £118.8m
Benefit Cost Ratio 3.0 2.1
4.37 The key points to note from the BCR evaluation are:
In considering the BCR as it was in the original appraisal (including indirect tax), the BCR is 2.1, which is slightly lower than the forecast BCR of 2.9 but still represents value for money; and

Post Opening Project Evaluation
A2 Bean – Cobham (Phase 2) Five Years After Study
42
In treating indirect tax as a benefit in accordance with current guidance, the BCR is the same, thus representing a return of £2.10 for every £1 spent. This is considered high value for money by the DfT.
4.38 It should be noted that the BCR ignores non-monetised impacts. Following the former NATA assessment and the replacement Transport Business Case, the impacts on wider objectives such as environmental, accessibility and integration must be assessed, although they are not monetised. These wider objectives are covered in the following chapters.
Wider Economic Impact
4.39 It is inherently difficult to isolate and measure wider economic impacts which could be attributed to the scheme. However, it is important to understand the socio-economic context in which the scheme opened and how the upgrading of the A2 between Pepperhill and Cobham may have assisted local and regional socio-economic aspirations.
Forecast
4.40 The AST predicted an increase in jobs accessible in the Regeneration Area, as a result of improved accessibility. The number of jobs accessible to the workforce in the area was forecast to be in the order of 55,124 – 85,150.
4.41 Additionally, it was predicted unemployment levels would decrease, with the number of employed residents expected to increase by 84 – 376 jobs.
Evaluation
4.42 Regeneration in the local area and increased accessibility is likely to have had a positive impact on economic growth.
4.43 One example of regeneration in the area is the Thames Gateway project, which encompasses Sittingbourne and the Kent Thameside and Ebbsfleet Valley regeneration areas.
4.44 The scheme will have improved accessibility and, in parallel with other highways schemes and land use schemes (such as the opening of Ebbsfleet Station), growth is likely to have occurred in the area.

Post Opening Project Evaluation
A2 Bean – Cobham (Phase 2) Five Years After Study
43
Key Points – Economy
Present Value Benefits
The outturn journey time benefits from the scheme are £313.4 million, assuming NRTF rate of
growth. This has been calculated using the PAR method.
Collision benefits were not calculated as the small increase in collisions was found to be not
statistically significant and not attributable to the scheme.
It is expected that there is a maintenance benefit as a result of major underground services being
located under the old A2 route where offline widening occurred.
Present Value Costs The outturn investment cost (PVC) was £118.83m.
Indirect tax is assumed as forecast a reduction of £6.1m.
Benefit Cost Ratio
The outturn BCR is 2.1. This is regardless of whether indirect tax impact is treated as a cost or a
benefit.
This is considered high value for money by the DfT.
Wider Economic Impacts Whilst there is no evidence to suggest the scheme has directly led to wider economic impacts, the
scheme has improved accessibility around the Regeneration Area and Ebbsfleet International
Station.

Post Opening Project Evaluation
A2 Bean – Cobham (Phase 2) Five Years After Study
44
5. Environment
Introduction
5.1 This chapter documents the evaluation of the environmental sub-objectives contained in the Environmental Statement (ES), focusing on those aspects not fully evaluated at the OYA stage and where suggestions were made for further study. The evaluation is based on the information that is made available to the POPE process; OYA report, ES, Appraisal Summary Table (AST), Handover Environmental Management Plan (HEMP) and consultation with stakeholders.
Summary of OYA Evaluation Findings
5.2 The OYA study identified a number of areas for further analysis at the FYA stage to confirm the longer term impacts of the scheme on the environment, which are summarised as follows:
Landscape: The location of the new A2 moved traffic further away from residential areas and allowed the provision of an attractive green space within the old A2 route as expected. However, the new transport corridor with associated lighting and sign gantries located close to the CTRL had adversely impacted on the local landscape character and although new landscape planting was in place it was expected to take time to mitigate the effects. It was suggested that landscape effects should be revisited at FYA to reconsider visual impacts and the establishment of seeding and planting. Re-consultation with Gravesend Borough Council and Kent Downs AONB was also suggested;
Biodiversity: Land take at SSSI adjacent to existing A2 was as expected. Provision for protected species during construction and mitigation measures had been provided as part of the scheme. Extensive new areas of habitat had been provided which in time should benefit biodiversity. No monitoring information was available at OYA stage which would have allowed full evaluation. It was suggested that biodiversity including bats, badgers and wild flower grassland should be reconsidered at FYA;
Water Mitigation: Measures had been incorporated into the scheme but no information has been provided to POPE which would indicate that they were performing other than as expected. No water quality data was made available. It was suggested that the Environment Agency be re-contacted at FYA as it was unable to respond at OYA;
Heritage: Based on the information available at the OYA stage, it was considered that sufficient evaluation had been carried out. A popular booklet had been produced and the academic report was being finalised. It was suggested that the FYA evaluation should consider the findings of the academic report and confirm deposition of the archive and finds; and
Physical Fitness: Mitigation measures had been implemented to incorporate new NMU links into the scheme and existing NMU routes have been retained as expected.
Scheme Objectives:
To minimise the environmental impact of the widening of the trunk road where practicable (particularly on adjacent residential areas).
To improve the environment in line with the Highways Agency’s Environmental Strategy and statutory planning objectives.
(Environmental Statement, September 2004)

Post Opening Project Evaluation
A2 Bean – Cobham (Phase 2) Five Years After Study
45
5.3 A key location plan is provided in Figure 5.1 which serves to identify locations of sites mentioned within this chapter.
Figure 5.1 Key Location Plan- Scheme Locations Referenced in Environment Chapter
5.4 It is the intention of this report to evaluate the effectiveness of the scheme at FYA according to the scheme’s objectives, and a number of agreed sub-objectives, as identified in the ES.
5.5 The following environmental sub-objectives were appraised in the ES and in the AST according to the DfT’s objectives for transport:
Noise;
Local Air Quality;
Greenhouse Gases;
Landscape;
Biodiversity;
Heritage of Historic Resources;
Water Environment;
Physical Fitness; and
Journey Ambience.
5.6 For each of the environmental sub-objectives, the environmental impacts predicted in the AST and ES are assessed against those observed at FYA. This section is based upon findings from the OYA evaluation and new evidence obtained at FYA, including:
An evaluation of the ongoing effectiveness of the mitigation measures implemented as part of the scheme;
An updated summary of key impacts against all of the nine WebTAG sub-objectives (excluding Townscape), with particular focus on assessment of sub-objectives where it was too early to conclude at the OYA evaluation stage; and

Post Opening Project Evaluation
A2 Bean – Cobham (Phase 2) Five Years After Study
46
Additional analysis relevant to close out issues or areas for further study as identified at the OYA stage to for consideration at the FYA stage.
Methodology
5.7 This section focuses on those aspects not fully evaluated at OYA (or where at OYA, suggestions were made for further study) and also on any issues that have arisen since the OYA evaluation. Although the detail of the OYA evaluation is not repeated here, reference is made to the OYA evaluation where required and key points are incorporated into this FYA report to provide contextual understanding where appropriate.
5.8 No new modelling or survey work has been undertaken for this FYA environmental evaluation.
Data Collection
5.9 The following documents/data have been used for the FYA evaluation:
Environmental Statement (September 2004);
Appraisal Summary Table (AST) (June 2006);
Handover Environmental Management Plan (HEMP) (April 2014);
Archaeology Academic Report ‘A Road through the Past’ (2012)
As Built drawings as part of the Landscape and Ecology Aftercare Plan (2009); and
Landscape and Ecology Aftercare Plan (LEAP) (June 2009).
5.10 A full list of the background information requested and received to help with the compilation of this report is included in Appendix C.
Site Inspection
5.11 As part of the FYA evaluation, a site visit was undertaken in September 2014. This included the taking of photographs to provide a comparison with material produced for the ES and at OYA (Appendix D).
Consultation
5.12 Statutory environmental organisations (Natural England, English Heritage and the Environment Agency), Kent County Council, Gravesham District Council, Council and Kent Wildlife Trust were contacted as part of the FYA evaluation regarding their views on the impacts they perceive the scheme has had on the environment. A summary of each response is shown in Table 5.1.
Table 5.1 Summary of Environmental Consultation Responses
Organisation Field of Interest
Comments at OYA Comments at FYA
Natural England
Biodiversity & Landscape
Natural England has no data or survey information to allow it to answer the questions on the environmental impacts pertinent to its remit
Unfortunately we are unable to provide information on the effectiveness of the mitigation measures from a landscape and ecological perspective as we would expect these to be compiled as part of the post consent monitoring works undertaken.
English Heritage
Heritage No response No response at time of writing.
Environment Agency
Water & Biodiversity
No response Would not comment without payment
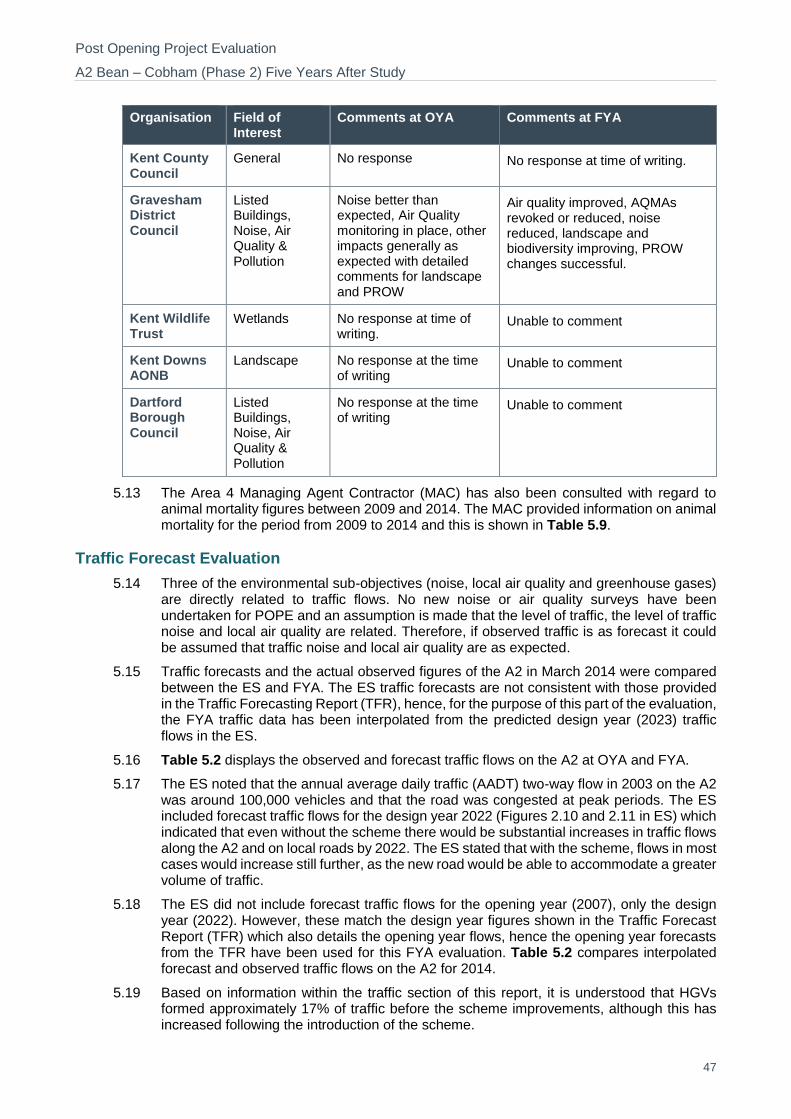
Post Opening Project Evaluation
A2 Bean – Cobham (Phase 2) Five Years After Study
47
Organisation Field of Interest
Comments at OYA Comments at FYA
Kent County Council
General No response No response at time of writing.
Gravesham District Council
Listed Buildings, Noise, Air Quality & Pollution
Noise better than expected, Air Quality monitoring in place, other impacts generally as expected with detailed comments for landscape and PROW
Air quality improved, AQMAs revoked or reduced, noise reduced, landscape and biodiversity improving, PROW changes successful.
Kent Wildlife Trust
Wetlands No response at time of writing.
Unable to comment
Kent Downs AONB
Landscape No response at the time of writing
Unable to comment
Dartford Borough Council
Listed Buildings, Noise, Air Quality & Pollution
No response at the time of writing
Unable to comment
5.13 The Area 4 Managing Agent Contractor (MAC) has also been consulted with regard to animal mortality figures between 2009 and 2014. The MAC provided information on animal mortality for the period from 2009 to 2014 and this is shown in Table 5.9.
Traffic Forecast Evaluation
5.14 Three of the environmental sub-objectives (noise, local air quality and greenhouse gases) are directly related to traffic flows. No new noise or air quality surveys have been undertaken for POPE and an assumption is made that the level of traffic, the level of traffic noise and local air quality are related. Therefore, if observed traffic is as forecast it could be assumed that traffic noise and local air quality are as expected.
5.15 Traffic forecasts and the actual observed figures of the A2 in March 2014 were compared between the ES and FYA. The ES traffic forecasts are not consistent with those provided in the Traffic Forecasting Report (TFR), hence, for the purpose of this part of the evaluation, the FYA traffic data has been interpolated from the predicted design year (2023) traffic flows in the ES.
5.16 Table 5.2 displays the observed and forecast traffic flows on the A2 at OYA and FYA.
5.17 The ES noted that the annual average daily traffic (AADT) two-way flow in 2003 on the A2 was around 100,000 vehicles and that the road was congested at peak periods. The ES included forecast traffic flows for the design year 2022 (Figures 2.10 and 2.11 in ES) which indicated that even without the scheme there would be substantial increases in traffic flows along the A2 and on local roads by 2022. The ES stated that with the scheme, flows in most cases would increase still further, as the new road would be able to accommodate a greater volume of traffic.
5.18 The ES did not include forecast traffic flows for the opening year (2007), only the design year (2022). However, these match the design year figures shown in the Traffic Forecast Report (TFR) which also details the opening year flows, hence the opening year forecasts from the TFR have been used for this FYA evaluation. Table 5.2 compares interpolated forecast and observed traffic flows on the A2 for 2014.
5.19 Based on information within the traffic section of this report, it is understood that HGVs formed approximately 17% of traffic before the scheme improvements, although this has increased following the introduction of the scheme.

Post Opening Project Evaluation
A2 Bean – Cobham (Phase 2) Five Years After Study
48
5.20 As explained in the traffic section of this report, information relating to traffic speeds after opening is not available for some links and speed is not considered further in this environment section.
Table 5.2 Forecast and Observed Traffic Flows on the Scheme Section
Section of A2
Dir
ecti
on
Pre Scheme Forecast with High Growth Observed
Baseline
2003 AADT
from ES
Forecast for
2007 AADT
from Traffic
Forecast
Report
2014 AADT
(Interpolated
between 2007
and 2022)
2014 AADT
A2 Pepperhill (A2260) to Tollgate (A227)
EB 49,500 67,700 69,731 70,900 (+1.6%)
WB 52,300 71,600 73,835 71,300 (-3.4%)
A2 Tollgate (A227) to Marling Cross
EB 50,600 62,900 64,338 69,000 (+7.2%)
WB 50,900 68,000 70,122 69,200 (-1.3%)
A2 Marling Cross-Cobham
EB 47,700 58,800 60,505 62,700 (+3.6%)
WB 48,500 63,900 65,745 60,600 (-7.8%)
Five Years After Assessment
5.21 This section includes a brief summary of statements from the AST, ES and OYA evaluations, including a summary of the key issues identified for further reporting at the FYA stage. These key issues have been included to provide the context for the FYA evaluation.
Noise
AST Forecast
5.22 The AST stated that there would be a significant reduction in noise levels for large numbers of properties due to increased distance to the new road and quieter road surface. The estimated population annoyed by road traffic noise would fall by 37%, and fewer people would be exposed/annoyed within the higher noise bands. It was predicted that approximately 511 less people would be annoyed in the Do Something (DS) scenario compared to the Do Minimum (DM).
Environment Statement
5.23 The ES noted that the existing A2 generated high noise levels for many properties in Gravesend to the north of the road. With the scheme in place the overall effect would be beneficial with substantial and widespread reductions in noise and nuisance levels that would result in a significant decrease in noise level for properties with 60-70+ dB level.
5.24 Without the scheme in 2022 there would be imperceptible increases in noise of around 1dB due to increased traffic for most properties although there would be some small imperceptible decreases in noise for some other properties. The scheme would move the A2 further away from most of the affected properties and 2502 would experience noise decreases with more than half of these experiencing a perceptible decrease in noise levels of 3dB or more. Of these, 251 properties would experience noise reductions of 10dB which would amount to a halving of noise levels. 39 houses were predicted to experience increased noise although this was expected to be less than 1dB which is imperceptible. Noise nuisance and vibration were also noted as likely to improve with the scheme.
5.25 It was considered that no properties were likely to be eligible for noise insulation under the Noise Insulation Regulations. Because of the general reductions in noise for the majority of

Post Opening Project Evaluation
A2 Bean – Cobham (Phase 2) Five Years After Study
49
dwellings, no specific mitigation was proposed. The scheme included a low noise surface which was noted as reducing noise levels by up to 3dB.
OYA Conclusions
5.26 It was confirmed at OYA that the observed traffic flows were within +25% or -20% of the interpolated predicted flows so on this basis noise levels were likely to be as expected. The proposed low noise surface had been implemented as proposed. The ES did not consider the effect of the noise mounding in the linear park as the details were not known at the time of the ES, so the actual noise levels at receptors were likely to be lower than expected in these sections. Results of monitored noise levels at a local primary school showed noise levels were better than expected and Gravesend Borough Council considered that although it had not carried out any monitoring, noise levels overall are better than expected.
5.27 The new alignment had brought traffic noise nearer to some properties and monitoring indicated that noise was slightly worse than expected at one property, Long View.
FYA Consultation
5.28 Gravesham District Council were consulted as part of the FYA evaluation and reported that whilst no formal measurement of noise levels from the A2 have been carried out by them, it is clear that there had been a significant reduction in noise as it affects existing properties that were in close proximity to the A2.
FYA Evaluation
5.29 Observations from the site visit noted that the noise barrier at Long View is in good condition as shown in Figure 5.2. Earth mounding is included as part of the scheme in the linear park between the new and old A2 and there is an off-site noise bund at the southern end of the scheme east of the Cobham services. This mounding is unchanged from the OYA report.
Figure 5.2 Environmental Barrier at Long View
5.30 With reference to the OYA report, it was confirmed that low noise surfacing has been provided but POPE still has no confirmation of the Road Surface Influence (RSI) value of the surface installed. POPE is not aware of any further noise survey undertaken for the scheme or adjacent properties since those carried out and reported at OYA noted above.
5.31 Observed flows on the A2 are within +/- 7.5% of the interpolated high growth ES forecast for 2014. Under POPE traffic changes of less than -20% or +25% are not considered to alter the noise assessment. It is therefore considered that overall the noise climate is likely to be as expected although the OYA report noted that there was likely to be an improvement

Post Opening Project Evaluation
A2 Bean – Cobham (Phase 2) Five Years After Study
50
over the ES (and by implication the AST) assessment as it had not considered the effect of mounding in the linear park.
Table 5.3 Evaluation Summary: Noise
Air Quality
AST Forecast
5.32 The AST stated that there would be significant improvements in air quality for large numbers of properties due to increased distance to the new road and improvements in emissions technology over time. Some properties would benefit by being removed from the Air Quality Management Area (AQMA). Compared to the existing situation, the AST noted that emissions would all decrease in the future, regardless of whether the improvement scheme was implemented or not, but that there would be a smaller decrease with the scheme compared to the Do Minimum scenario.
Environmental Statement
5.33 The ES stated that traffic congestion would be improved with the scheme, as there would be a reduction in acceleration and deceleration and thus vehicle emissions and pollution would be reduced.
5.34 The ES concluded that the scheme would not have any significant adverse effects on air quality and would bring significant improvements within the AQMA that had been designated adjacent to the existing A2. Increases in pollutant levels were predicted at some receptors but these were not considered to be significant. Concentrations at many dwellings and a school would be reduced, bringing significant benefits to local communities adjacent to the scheme.
OYA Conclusions
5.35 Observed traffic flows are lower than or within 10% of those forecast indicating that in line with POPE methodology air quality would be as expected. Gravesham Borough Council was expecting to reduce the number of properties in the AQMA following 2 years of monitoring data.
FYA Consultation
5.36 Gravesham Borough Council commented that the levels of particulate matter (PM10) have reduced such that there is no longer an exceedance of the relevant objective i.e. annual average.
5.37 Nitrogen dioxide levels (NO2) have reduced significantly in areas where the route has moved away from the residential areas however exceedances remain in the areas where it is still close to houses. The continuous analyser is situated in a school field in a location where the route was moved away. No exceedance of the annual average was monitored at this station however diffusion tube monitoring in nearby residential areas where the route was not moved away are still in exceedance.
5.38 The monitored concentrations recorded at the Gravesham A2 Roadside monitor at Painters Ash School between 2004 and 2013 are provided in Table 5.4. Although it can be seen that concentrations have decreased over time, as a result of more stringent emissions legislation and despite an increase in traffic flows over this time, since 2009, the first full year of opening, there have not been any exceedances of any air quality criteria at this monitoring site.
Sub-Objective AST FYA
Noise 511 properties will
benefit Likely to be as or better
than expected
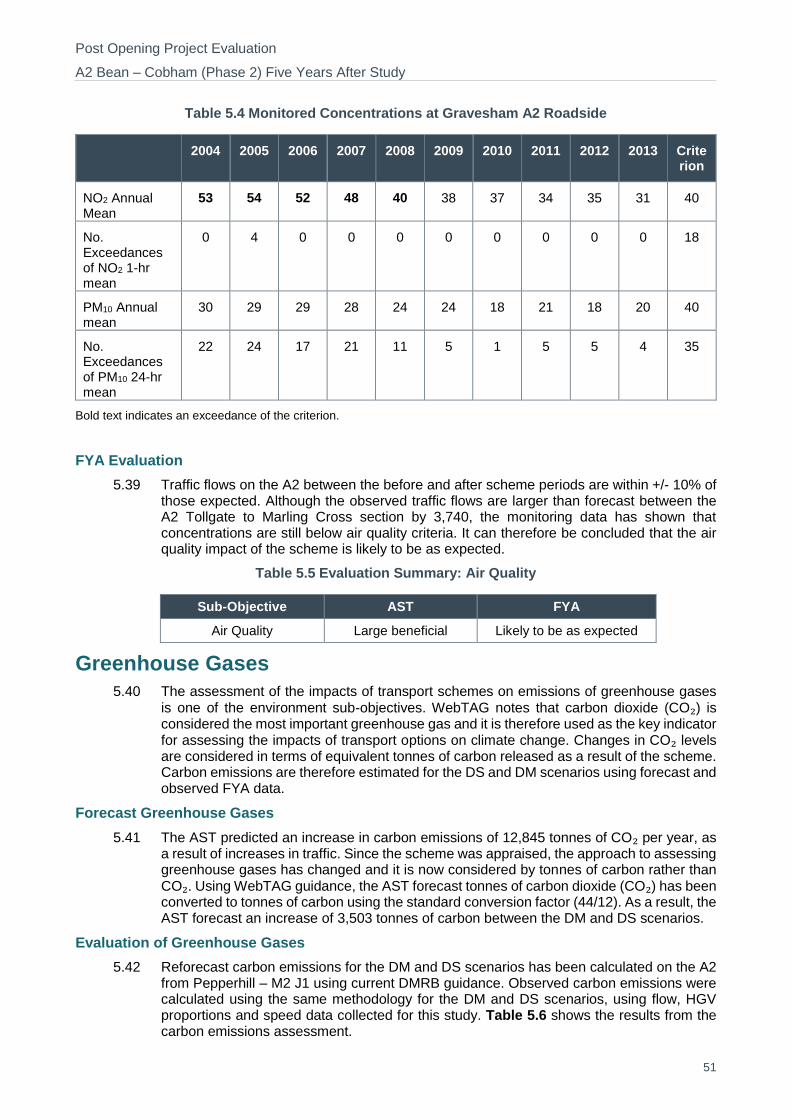
Post Opening Project Evaluation
A2 Bean – Cobham (Phase 2) Five Years After Study
51
Table 5.4 Monitored Concentrations at Gravesham A2 Roadside
2004 2005 2006 2007 2008 2009 2010 2011 2012 2013 Criterion
NO2 Annual Mean
53 54 52 48 40 38 37 34 35 31 40
No. Exceedances of NO2 1-hr mean
0 4 0 0 0 0 0 0 0 0 18
PM10 Annual mean
30 29 29 28 24 24 18 21 18 20 40
No. Exceedances of PM10 24-hr mean
22 24 17 21 11 5 1 5 5 4 35
Bold text indicates an exceedance of the criterion.
FYA Evaluation
5.39 Traffic flows on the A2 between the before and after scheme periods are within +/- 10% of those expected. Although the observed traffic flows are larger than forecast between the A2 Tollgate to Marling Cross section by 3,740, the monitoring data has shown that concentrations are still below air quality criteria. It can therefore be concluded that the air quality impact of the scheme is likely to be as expected.
Table 5.5 Evaluation Summary: Air Quality
Sub-Objective AST FYA
Air Quality Large beneficial Likely to be as expected
Greenhouse Gases
5.40 The assessment of the impacts of transport schemes on emissions of greenhouse gases is one of the environment sub-objectives. WebTAG notes that carbon dioxide (CO₂) is considered the most important greenhouse gas and it is therefore used as the key indicator for assessing the impacts of transport options on climate change. Changes in CO₂ levels are considered in terms of equivalent tonnes of carbon released as a result of the scheme. Carbon emissions are therefore estimated for the DS and DM scenarios using forecast and observed FYA data.
Forecast Greenhouse Gases
5.41 The AST predicted an increase in carbon emissions of 12,845 tonnes of CO₂ per year, as a result of increases in traffic. Since the scheme was appraised, the approach to assessing greenhouse gases has changed and it is now considered by tonnes of carbon rather than CO₂. Using WebTAG guidance, the AST forecast tonnes of carbon dioxide (CO₂) has been converted to tonnes of carbon using the standard conversion factor (44/12). As a result, the AST forecast an increase of 3,503 tonnes of carbon between the DM and DS scenarios.
Evaluation of Greenhouse Gases
5.42 Reforecast carbon emissions for the DM and DS scenarios has been calculated on the A2 from Pepperhill – M2 J1 using current DMRB guidance. Observed carbon emissions were calculated using the same methodology for the DM and DS scenarios, using flow, HGV proportions and speed data collected for this study. Table 5.6 shows the results from the carbon emissions assessment.

Post Opening Project Evaluation
A2 Bean – Cobham (Phase 2) Five Years After Study
52
Table 5.6 Carbon Emissions- DM and DS at FYA
Carbon Emissions
(carbon tonnes/year)
Re-Forecast Observed
Do Minimum 24,827 27,397
Do Something 30,501 32,265
Net Change 5,674 4,868
23% 18%
5.43 Table 5.6 shows that observed carbon emissions increased by 18% between the DM and DS scenarios, equivalent to 4,868 tonnes of carbon. This is in contrast to the reforecast growth in emissions of 23% between the DM and DS scenarios, equating to 5,674 tonnes of carbon. Therefore, the net increase in carbon emissions is lower than expected. This is despite increased traffic on the A2. The reason for this could be that forecast flows, in some cases, particularly from Cobham – M2 J1, were lower than forecast. This observed net change in carbon emissions is worse than the AST forecast of 3,503 however this is not directly comparable as it is not known what links were included in the assessment in the AST.
Table 5.7 – Greenhouse Gases
Sub-Objective FYA Score Evaluation
Greenhouse Gases 4,868 Better than expected
Landscape
AST Forecast
5.44 The AST stated that some properties experienced substantial existing visual impact from the existing A2 alignment - all of these properties would benefit from the scheme. Landscape effects would be slight beneficial only initially, as the road would move out into the wider landscape, but this would bring significant benefits to local people. As such, the residual impact of the proposed scheme was assessed as ‘moderate beneficial’.
5.45 Townscape was not considered in the AST.
Environmental Statement
5.46 The ES concluded that the overall effects on landscape character would be neutral initially, becoming slight to moderate beneficial over time with the main benefits being on the southern fringe of Gravesend. Effects on the North Kent Area of Outstanding Natural Beauty (AONB) would not be significant. The new A2 would be visible from a relatively restricted area to the north, but from a wider area to the south, though views from here would be limited by the High Speed 1 (HS1) rail line, intervening topography and tree cover.
5.47 The ES predicted that there would be initial adverse visual impact ranging from negligible or slight for 22 properties up to moderate for 3 properties reducing for most properties in the design year with the maturing of planting. There would be beneficial effects for 121 properties in year one.
5.48 The ES noted that due to the location of the proposals the townscape sub-objective was not considered applicable in the context of the scheme.

Post Opening Project Evaluation
A2 Bean – Cobham (Phase 2) Five Years After Study
53
OYA Conclusions
5.49 The OYA report noted that the location of the new A2 moved traffic further away from residential areas and allowed the provision of an attractive green space within the old A2 route as expected. However, the new transport corridor with associated lighting and sign gantries located close to the HS1 rail line had adversely impacted on the local landscape character and although new landscape planting was in place it would take time to mitigate the effects.
5.50 Landscape mitigation measures had generally been implemented as proposed, including earth shaping, cuttings, environmental barriers, retained existing planting and new planting. Subject to successful continued establishment, it was expected that in time the new planting should provide a framework for the scheme and help screen traffic from nearby properties. A five year aftercare period was included in the contract and evidence of maintenance activities was noted from the OYA site visit.
5.51 At OYA, both the Handover Environmental Management Plan (HEMP) and Landscape and Ecology Aftercare Plan (LEAP) were said to be being produced. The LEAP became available shortly after the OYA was produced. Updates to the plan were expected to be made annually but it appears that this did not happen. The HEMP was produced in 2014.
5.52 It was suggested that landscape should be revisited at FYA to reconsider visual impacts and the establishment of landscape planting and seeding. Re-consultation was also suggested for the FYA report.
FYA Consultation
5.53 Kent County Council was unable to provide any feedback due to lack of resources to monitor the progress of the scheme.
5.54 Gravesham District Council commented that the landscaping that has been put in (combined with that from HS1) has matured somewhat so the scheme has lost the raw edge. The cycleway has proved popular (now National Cycle Route (NCR) 177) and the Cyclopark has been developed on land west of Tollgate. This provides a major regional recreational facility.
5.55 No other consultation responses have been received.
FYA Evaluation
5.56 A review of predicted landscape impacts, mitigation and evaluation from the ES and OYA/FYA is included in Appendix F: Predicted Impacts, Mitigation and Evaluation for Landscape Sub-Objective
5.57 A HEMP was produced in 2014 and details the management actions that took place during the 5 year aftercare period. The indications from the HEMP are that maintenance operations were fairly routine and there were no unexpected interventions.
5.58 A Landscape Ecology Aftercare Plan was produced in May 2014. The LEAP specified the monitoring, management and maintenance requirements of the landscape and scheme, and will be used by the MAC following the initial five year aftercare periods.
5.59 Observations from the site visit and as built plans found that overall the landscape mitigation measures are as expected in the ES. Retained vegetation has integrated well with planted vegetation and provides screening of the motorway for residential / business receptors and Non-Motorised Users (NMUs). Although some plots have experienced less successful plant establishment than others, in general, the planting provides screening to receptors such as the residential properties along the old A2 and NMUs on the cycle path. Maintenance is reported to have been carried out in accordance with the LEAP and specification with no indication of injurious weeds having been found.

Post Opening Project Evaluation
A2 Bean – Cobham (Phase 2) Five Years After Study
54
Figure 5.3 ‘Orchard’ Planting in Linear Park
Figure 5.4 Planting at the Marling Cross Junction
5.60 The environmental barrier at Long View is in good condition and provides immediate visual screening from traffic for adjacent properties (see Figure 5.2).

Post Opening Project Evaluation
A2 Bean – Cobham (Phase 2) Five Years After Study
55
Figure 5.5 Good Establishment of Off-Site Planting Opposite Cobham Services
5.61 The planting, earth mounds and barriers integrate well with the surrounding landscapes and enhance the settings of landscape designations, including the Kent Downs Area of Outstanding Natural Beauty.
5.62 A series of photos comparing the situation before the scheme was built and at OYA and FYA are included in Appendix D: Record of Scheme Including ES Photomontages Before and FYA comparisons.
5.63 Overall, the landscape impacts of the scheme are considered ‘slight adverse’, as expected. It will be important for future landscape maintenance to continue as per the aftercare requirements set out in the LEAP to ensure that scheme planting meets its objectives for landscape integration and visual screening in the future.
Table 5.8 Evaluation Summary: Landscape
Sub-Objective AST FYA
Landscape Moderate beneficial As expected
Biodiversity
AST Forecast
5.64 The AST stated that there would be some land take from the Shorne and Ashenbank Site of Special Scientific Interest (SSSI), although this would be alongside the existing road. There would also be some disturbance to protected species in the short term, although there would be longer term benefits. Extensive creation of new, semi-natural habitats would occur with the scheme. The qualitative column text stated that effects would vary for different biodiversity topics, and the TAG process required adoption of the worst score, but in overall terms the scheme would have slight beneficial effects, increasing over time. However, inconsistently the overall assessment on the rightmost qualitative column is slight adverse.
Environmental Statement
5.65 The ES stated that overall the land within the study area was considered to be of low nature conservation value and lacked a diversity of species.

Post Opening Project Evaluation
A2 Bean – Cobham (Phase 2) Five Years After Study
56
5.66 The main adverse effects of the scheme were noted as follows:
Localised losses of land within Shorne and Ashenbank Woods SSSI;
Localised losses of other woodland, hedgerow, verge vegetation and other existing highway planting;
Adverse impact on localised populations of protected species including great crested newts, reptiles, badgers and possibly dormice;
Noise, light and other possible disturbance during construction;
Extensive losses of land mainly under agricultural production and of low existing nature conservation interest; and
Potential increases in mortality of fauna, severance and disturbance effects during the operational phase.
5.67 Mitigation measures for habitat loss and creative conservation for the scheme were proposed including planting extensive areas alongside the road and landscaping the redundant part of the existing A2. The new areas of woodland and grassland would be designed specifically to improve existing habitats. There would be species rich calcareous grassland on exposed chalk cutting slopes, bat boxes in adjacent woodland and an artificial badger sett with badger tunnels under barriers to maintain access.
OYA Conclusions
5.68 The OYA report concluded that the land take at the SSSI adjacent to the existing A2 was as expected. Provision for protected species during construction and mitigation measures had been provided as part of the scheme. Extensive new areas of habitat had been provided which in time should benefit biodiversity. No monitoring information was available at the OYA stage which would allow full evaluation and biodiversity should be reconsidered at FYA.
FYA Consultation
5.69 Natural England responded that they were unable to provide information on the effectiveness of the mitigation measures from a landscape and ecological perspective as they expected these to be compiled as part of the post consent monitoring works undertaken.
5.70 Kent County Council was unable to provide any feedback.
5.71 Gravesham District Council commented that no further information was available but observed that as a result of the planting, landscape etc. on the A2 and HS1 they thought there was a more a diverse environment than existed before (open fields with a few hedges and trees), but they had no information as to whether this is true. They also commented that it was pertinent to note that Jeskyns (Forestry Commission owned http://www.forestry.gov.uk/jeskyns) had converted intensively-farmed land into diverse open space which will have also impacted on biodiversity over the whole corridor.
FYA Evaluation
5.72 Information on the ecological effects of the scheme are included in Appendix G: Predicted Impacts, Mitigation and Evaluation for Biodiversity Sub-Objective.
5.73 It is understood that as part of the scheme no ecological monitoring was instructed or took place during the five year aftercare period. The FYA evaluation is therefore based on site observations, consultation responses and informal conversations with project participants.
5.74 There was evidence from the site visit that the badger tunnel at the Ifield Court footbridge was being used and that the artificial badger sett was still in use. Calcareous and wildflower grassland had established satisfactorily though there had been no surveys to establish which species were present. There was no evidence, in the documentation available to POPE of monitoring of ecological mitigation during the aftercare period as had been indicated in the LEAP. The orchids that had been noted at Tollgate junction in the ES had not reappeared despite management operations to clear overshadowing scrub having been carried out.

Post Opening Project Evaluation
A2 Bean – Cobham (Phase 2) Five Years After Study
57
Figure 5.6 Chalk Cutting Slopes on A2 Showing Colonisation with Wildflower Grassland Above
5.75 Overall, it is considered that impacts on biodiversity are likely to be neutral which is better than the slight adverse expected in the AST.
Table 5.9 Wildlife Mortality Data
Year Location Species Number
2010 Pepperhill Junction to Tollgate Fox 2
Tollgate to Cobham Junction Fox 2
2011 Pepperhill Junction to Tollgate Fox 2
Badger 1
Tollgate to Cobham Junction Fox 1
Badger 2
2012 Pepperhill Junction to Tollgate Fox 1
Tollgate to Cobham Junction Badger 1
2013 Pepperhill Junction to Tollgate Fox 1
Tollgate to Cobham Junction Badger 1
Deer 1
2014 Pepperhill Junction to Tollgate Deer 1
Tollgate to Cobham Junction Fox 1
5.76 The consistent level of fox mortality over the 5 year period is not unexpected given the increasing numbers of this species nationally and the proximity of the scheme to suburban housing where foxes are becoming more prevalent. Similarly, the deer mortality to the eastern end of the scheme is consistent with the alignment through the wooded area of the country park. There was a single badger mortality in the Pepperhill to Tollgate section where an artificial badger sett was created and badger fencing which suggests that mitigation is working and badgers here have adjusted to the new road alignment. Three other badger fatalities have been on the eastern section where no badger netting has been

Post Opening Project Evaluation
A2 Bean – Cobham (Phase 2) Five Years After Study
58
provided and which may indicate increased population of this species since the scheme was opened.
Figure 5.7 Badger Tunnel Adjacent to the Ifield Court Overbridge
Heritage
AST Forecast
5.77 The AST stated that without mitigation, the scheme would have an adverse effect upon the archaeological resources, affecting both known sites and potentially unknown sites. Potential effects on known and unknown archaeology would be effectively mitigated by proposed pre-construction evaluation. The assessment score was neutral.
Environmental Statement
5.78 The ES set out an archaeological mitigation strategy that aimed to minimise the effect of the scheme, provide a record of the archaeology affected by the scheme and maximise positive amenity benefits from the interpretation and presentation of the historic landscape to the public. The mitigation of impacts was to be achieved by avoidance where possible, modifications to the design leading to preservation in situ and preservation by record using a range of approaches.
5.79 The ES concluded that the scheme would have no direct impacts on Scheduled Monuments, Listed Buildings or other designated sites and only slight indirect impacts on two other designated sites (Grade II Listed Buildings). It would however have direct impacts on 45 known archaeological sites of varying importance but the impacts could be adequately mitigated by archaeological recording so that the residual effect was considered to be neutral. There was potential to affect unknown archaeology and the potential impacts could be very large however it was felt that the impacts could be mitigated such that the residual effect was likely to be neutral.
Sub-Objective AST FYA
Biodiversity Slight Adverse Neutral, better than expected

Post Opening Project Evaluation
A2 Bean – Cobham (Phase 2) Five Years After Study
59
OYA Conclusions
5.80 The direct and indirect effects on designated sites were considered to be as expected at OYA. The report noted that for archaeology, an extensive topsoil strip and investigation had been carried out over a large area. This had revealed numerous deposits from a variety of periods some of which were extremely valuable. A popular publication had been produced and an academic report was in preparation and should be available for the FYA report. The topsoil strip enabled the site to be investigated thoroughly and impacts of the scheme on buried archaeology to be mitigated by preservation and record. Overall, the AST assessment of neutral impact would appear to have been correct. The FYA evaluation should consider the findings of the academic report and confirm deposition of the archive and finds.
FYA Consultation
5.81 No comments were received from English Heritage and Kent County Council regarding heritage. Gravesham Borough Council has commented that, as was expected from work that had been done on CTRL there were likely to be significant finds in the corridor – as was duly the case.
FYA Evaluation
5.82 The academic report for the scheme ‘A Road through the Past’ was published in 2012. It details the extensive archaeological works that were carried out as part of the scheme and notes that features of every period from Neolithic to post-medieval were found. The following summarises the eras from which finds were made:
Neolithic – large post hole associated with flint scatter; a Beaker pit;
Bronze Age – two partial enclosures associated with metalled track ways; scattered pits and cremations;
Iron Age – groups of pits often with four post structures and occasional ditched boundaries, some with rich assemblages indicative of ritual deposition. Two high status burials; a major ditched boundary with burials; a ditched settlement near Cobham;
Roman – large rectilinear enclosure with burial pit and cemetery with high status burials;
Saxon – sunken-featured building; and
Medieval – three low status settlements that were abandoned in the 14th century.
5.83 The finds and archive are reported to have been deposited with Kent County Council.
Table 5.10 Evaluation Summary: Archaeology
Water
AST Forecasts
5.84 The AST stated that there would be slight beneficial effects on water quality in the river Ebbsfleet and aquifer due to improved pollution control and a neutral effect on hydrology. The AST predicted a slight beneficial impact overall.
Environmental Statement
5.85 The ES concluded the effects of the scheme would, due to mitigation measures incorporated into the scheme, improve the overall hydrological and hydrogeological environments giving it an overall minor beneficial impact.
Sub-Objective AST FYA
Heritage Neutral As expected

Post Opening Project Evaluation
A2 Bean – Cobham (Phase 2) Five Years After Study
60
5.86 The only watercourse in the area was noted as the River Ebbsfleet which rises from a spring 50m north of the existing A2, although its catchment extends south and would be crossed by the proposed scheme. The underlying permeable chalk geology together with abstractions at a chalk pit to the north meant that flows in the river were low and surveys suggested that water quality was also poor. There were a number of other water bodies in and around the study area.
5.87 The ES noted that there were eight groundwater abstraction licences within 1km of the scheme and that most of the road would be near enough to abstraction points that any pollutants released from the highway to could potentially enter the water supply. Groundwater Source Protection Zones (SPZ) are defined by the Environment Agency to protect groundwater abstraction and the scheme was said to be near one Zone 1 SPZ with three others within 2km of the route alignment. The highway drainage from the old A2 was a sealed pipe system that discharged to 4 ponds and linked to soakaways all of which were in poor condition with significant deposits of probably contaminated silt. There were no pollution prevention measures at discharge points and there was potential for significant pollution of the SPZs in the event of a spill.
5.88 For drainage purposes the scheme was divided into five catchment areas (A-E) and drainage in each of these was treated differently. In the two most westerly sections (A and B), there would be kerbs and gullies discharging via sealed pipes to a sealed settlement/attenuation pond and then via a siphon under the HS1 line to the River Ebbsfleet. In catchment area C there would also be kerbs, gullies and a sealed pipe system but the discharge would be to a strip or linear soakaway pond. Catchment D had a non-sealed drainage system which would discharge to infiltration ponds on either side of the A2. Catchment E used the existing drainage arrangements unchanged. At the Tollgate Junction, the existing condition of the pond and maintenance access were below standard and arrangements were proposed for its adoption by the local authority.
5.89 The scheme would increase the area draining to the River Ebbsfleet by 1.4ha but the treatment systems meant that the discharge was equivalent to Environment Agency River Ecosystem classification RE1 and therefore better than the existing water quality in the river. The discharges to the groundwater would be improved by the removal of pollutants with the scheme and this improvement of the existing A2 was seen as a neutral to minor beneficial. The drainage system would include shut off valves which in combination with the treatment systems would significantly reduce the risks of pollution leaving the drainage system such that the net effect was considered minor to moderate beneficial despite the increases in traffic flows with the scheme. Culverts were to be provided under the new road to provide a drainage pathway for the (mainly dry) valleys so there would be a neutral effect on flooding.
OYA Conclusions
5.90 The OYA report noted that mitigation measures have been incorporated into the scheme and no information was provided to POPE which would indicate that they were performing other than as expected. No water quality data had been made available. It was suggested that the Environment Agency was re-contacted at FYA as it was unable to respond at OYA.
FYA Consultation
5.91 Gravesham Borough Council commented that subsequent to the A2 works there has been remediation work on Cobham North Services site as investigations showed there had been a significant leakage of petrochemical substances under the site. This however was not directly related to the A2 scheme. There were some issues earlier this year (2014) due to the very wet winter – but that was exceptional.
FYA Evaluation
5.92 As noted from the site visit, highway drainage including balancing ponds appears to be performing in line with the proposals. None of the ponds were colonised with reeds. It is the MAC’s responsibility to maintain the drainage system following the five year aftercare period. The ES expected that the quality of any run-off would be improved due to pollution

Post Opening Project Evaluation
A2 Bean – Cobham (Phase 2) Five Years After Study
61
control measures included in the scheme and POPE has no evidence that this is not the case.
Figure 5.8 Attenuation Pond B at Downs Road
Figure 5.9 Infiltration Pond C at Marling Cross

Post Opening Project Evaluation
A2 Bean – Cobham (Phase 2) Five Years After Study
62
Figure 5.10 Infiltration Pond at Cobham Services
5.93 Overall, impacts to the water environment are likely to be ‘Slight Beneficial’, as expected.
Table 5.11 Evaluation Summary: Water
Sub-Objective AST FYA
Water Slight
Beneficial
Likely to be as expected, although improvement on water quality
cannot be demonstrated.
Physical Fitness
AST Forecasts
5.94 The AST noted that there was no data on numbers walking or cycling but journey lengths on existing routes would be largely unaffected and the scheme provided a new foot/cycleway connection along its length linking with the country park to the east. Numbers cycling and walking should increase. The assessment score was noted as moderate beneficial.
Environmental Statement
5.95 The ES included the assessment of physical fitness in the Pedestrians, Cyclists, Equestrians and Community Effects chapter. It concluded there would be no new severance, there would be slight beneficial effects on journey length and ambience for existing routes and moderate beneficial effects arising from the new pedestrian/ cycle route along the new A2. There would be slight beneficial effects on community facilities in the long term through the provision of new public open space on the old A2.
5.96 The ES noted that there was a network of existing rights of way south of the A2 which linked across the road to Gravesend to the north via two subways at Hog Lane and Hever Court Road both of which suffered from antisocial activities such as graffiti and car dumping. There were footways running along the north and south of the A2 but these were narrow, in poor condition and over hung with vegetation. They were not suitable for use by cyclists who consequently had to use the main A2 carriageways.

Post Opening Project Evaluation
A2 Bean – Cobham (Phase 2) Five Years After Study
63
5.97 The improvements to the A2 would affect a number of rights of way that cross the line of the road and arrangements were made to maintain or reconnect these. The following proposals were made:
At Downs Road there would be a new road bridge that would carry the diverted bridleway over the new A2 and linking with a bridge over the HS1 line;
East of Tollgate junction there would be a new footbridge across the new A2 carrying diverted footpaths and linking with a bridge over the HS1 line;
West of the Marling Cross junction there would be a new footbridge over the new A2 carrying a diverted footpath and linking with a bridge over the HS1 line;
New 3.5m wide combined footpath and cycleway created along the former northern carriageway of the existing A2 between Pepperhill and Marling Cross. The remaining areas of the northern carriageway and the whole of the former southern carriageway would be landscaped forming a Linear Park. All access points to the proposed cycleway/footpath would include appropriate barriers to prevent access by motorcycles;
The existing subways at Hog Lane and Church Road would be demolished; and
From Marling Cross a shared cycle/footway would be provided along the north side of the road leading to Cobham services (North), Thong Lane and the Cobham junction. A footway would be provided to Cobham services (south) via Henhurst Road along the south side of the proposed link road; it would continue to Thong Lane making use of the proposed drainage pond access track.
5.98 There were expected to be some minor changes in journey length and ambience with the proposals for footpaths crossing the A2 but overall a slight benefit was predicted. The proposals to create new footways and cycle ways along the new A2 and on the old A2 were seen as a moderately beneficial effect of the scheme. There would be some loss of community facilities in the form of the linear park associated with the HS1 which would have an adverse effect in the short term but this would be reduced when scheme construction was finished and the effect on community facilities would be slight beneficial overall when the public open space on the old A2 became established.
OYA Conclusions
5.99 NMU routes had been retained as expected. It was understood that an NMU or vulnerable user post opening survey was not required for this scheme and there was no information available to POPE which would have provided quantifiable data for usage of the PROW network. No new NMU surveys were undertaken specifically for the OYA report.
5.100 The OYA report noted that:
Bridges over the new A2 were upgraded in consultation with the local authority for equestrian use and incorporated a ‘hare’ motif as a gateway feature;
A new ‘Cyclopark’ was proposed in the land between the new and old A2 and was expected to open in 2012; and
The cycle route which used the old A2 formed part of the National Cycle Route (NCR 177) and was also used by equestrians.
FYA Consultation
5.101 Gravesham Borough Council commented that the rights of way changes have proved highly successful (with some subsequent enhancements) in providing an enhanced space for walking, cycling etc. along the A2 corridor as well as access across it.
FYA Evaluation
5.102 No NMU surveys have been undertaken specifically for POPE which would provide quantifiable data relating to usage of NMU facilities. However, observations from the FYA site visit have been used as one of the information sources of this evaluation.

Post Opening Project Evaluation
A2 Bean – Cobham (Phase 2) Five Years After Study
64
Cyclists
5.103 During the site visit a number of cyclists were sighted using the old A2 and it is believed that the majority were using the route for leisure purpose. Gravesham Borough Council did comment that the rights of way changes have proved highly successful (with some subsequent enhancements) in providing an enhanced space for walking, cycling etc. along the A2 corridor as well as access across it. The cycleway (now NR 177) has proved popular and the Cyclopark has been developed on land west of Tollgate. This provides a major regional recreational facility.
Figure 5.11 New NMU Bridge Illustrating Hare Motif
Figure 5.12 View West Along Linear Park Showing New Access to Cyclopark

Post Opening Project Evaluation
A2 Bean – Cobham (Phase 2) Five Years After Study
65
Figure 5.13 BMX Track at Cyclopark
Pedestrians
5.104 At the time of the FYA site visit, a number of pedestrians were seen to be walking along the old A2. The footbridge links across the new A2 provide access to the wider footpath network.
Equestrians
5.105 No equestrians were sighted during the site visit.
5.106 Overall impacts on physical fitness are considered to be moderate beneficial as expected.
Table 5.12 Evaluation Summary: Physical Fitness
Journey Ambience
AST Forecasts
5.107 The AST noted that driver stress should reduce, as the scheme would reduce congestion and improve traffic flows. The roadside environment would be more pleasant and views from the road would improve, increasingly so over time. Overall the impacts were assessed as moderate beneficial.
Environmental Statement
5.108 The ES considered views from the road, driver stress and traveller care for vehicle travellers.
5.109 The ES considered journey ambience under the heading Vehicle Travellers and concluded that the scheme would have beneficial effects on driver stress and views from the road would be improved such that there would be moderate beneficial effects in the long term. There would be a slight adverse effect on access to the services and the local road network due to closures of the slip roads at Thong Lane junction leading to slightly longer journeys.
Sub-Objective AST FYA
Physical Fitness Moderate Beneficial As expected
Post Opening Project Evaluation
A2 Bean – Cobham (Phase 2) Five Years After Study
66
5.110 Views from the existing A2 were mostly short range being restricted by the edge of Gravesend to the north and the line of the HS1 to the south. Some longer distance views were possible over the HS1 line and from the western and eastern extents of the scheme. Views were mostly urban or industrial in character but some rural views to the south were possible. Levels of driver stress were high due to congestion and stress levels were likely to increase with traffic growth.
5.111 With the scheme, congestion would reduce and both frustration and fear of accidents would also decrease leading to beneficial effects on driver stress. The quality of the view from the road would improve with the scheme as the new A2 would be further from the edge of Gravesend and there would be a new landscape scheme associated with the proposals. Longer distance views from the road would remain initially but these would become restricted over time as the planting developed. An initial assessment of slight benefit for traveller views would rise to moderate beneficial over time.
5.112 The petrol filling station south of Tollgate Junction would be demolished due to the scheme but the services at Cobham north and south would remain. The slip roads at Thong Lane junction would be closed and access to Thong village and the Inn on The Lake would be slightly longer via Cobham junction.
OYA Conclusions
5.113 The OYA report noted that congestion had been eased and journey times were more reliable. New planting and grassland areas were in place and would provide a pleasant landscape corridor for the A2 route as it matured.
5.114 As part of the scheme the existing petrol filling station south of the Tollgate junction was demolished but the Cobham south service area remained, both as expected. However the Cobham north service area had been closed and demolished and it was expected in the ES that this would remain in operation.
5.115 Views from the new A2 were considered to be as expected, where the road was in cutting and where earth mounding had been provided as part of the scheme, views out were restricted although there were open views available. As the new landscape planting matured it would provide an attractive landscape corridor but would also restrict views from the road. New sign gantries were visually prominent, except at the eastern end of the scheme where the A2 followed the existing route within areas of mature vegetation. The overall width of the road, signs and lighting presented an urban feel to the route.
5.116 As a result of the scheme, congestion had eased and journey times were more reliable. This would have helped reduce driver frustration and fear of accidents which would have lowered driver stress. New signage had been provided as part of the scheme and it was considered this should avoid any driver uncertainty.
FYA Consultation
5.117 Gravesham Borough Council commented that they were concerned that the Tollgate and Marling Cross junctions were not operating efficiently and that traffic was backing up onto the A2 at peak periods.
FYA Evaluation
5.118 A summary of the FYA evaluation of journey ambience can be found in Table 5.13.

Post Opening Project Evaluation
A2 Bean – Cobham (Phase 2) Five Years After Study
67
Table 5.13 Summary of Journey Ambience Evaluation
Sub-Objective FYA Score Evaluation
Views from the Road
Beneficial Views from the A2 vary from enclosed by earthworks and vegetation to open and far distant. Increased signage and gantries give urbanised feel in some sections as would be expected.
Driver Stress - frustration
Beneficial Increased lanes, better traffic flow and less traffic volume have all contributed to improved journey times. Clear signage and overhead gantries help reduce driver uncertainty.
Driver Stress – fear of potential collisions
Beneficial The realignment of the A2 has improved sight distances and reduced lane conflict. Driver stress and levels of fear are likely to be less when compared to before scheme construction.
Driver Stress – route uncertainty
Beneficial With the provision of the new VMS’ and signage, drivers are now better informed.
Traveller Care Worse than expected
No new facilities have been provided and the existing service areas at Tollgate Junction and Cobham North have been closed. Closure of the Cobham North services was unexpected.
Journey Ambience Summary Score
Moderate Beneficial
As expected
5.119 A result of the scheme, the A2 provides extra lanes for motorists which reduces driver stress and frustration. With the provision of VMS and gantries, motorists are now better informed which is likely to reduce drivers stress. The old A2 provides a safer more pleasant environment for equestrians, cyclists and walkers away from the high speed trunk road traffic. Overall, the scheme has had a ‘moderate beneficial’ impact on journey ambience, as expected.
Table 5.14 Evaluation Summary: Journey Ambience
Sub-Objective AST FYA
Journey Ambience Moderate beneficial As expected

Post Opening Project Evaluation
A2 Bean – Cobham (Phase 2) Five Years After Study
68
Key Points – Environment Noise
Observed flows on the A2 are within +/- 7.5% of the interpolated high growth ES forecast for 2014.
Noise mitigation such as acoustic barriers are generally in good condition. It is considered that
overall the noise climate is likely to be as expected
Air Quality Traffic flows on the A2 between the before and after scheme periods are within +/- 10% of those
expected. Although the observed traffic flows are larger than forecast between the A2 Tollgate to
Marling Cross section by 3,740, the monitoring data has shown that concentrations are still below
air quality criteria. It can therefore be concluded that the air quality impact of the scheme is likely to
be as expected.
Greenhouse Gases
Observed carbon emissions increased by 18% between the DM and DS scenarios, equivalent to
4,868 tonnes of carbon. This is in contrast to the reforecast growth in emissions of 23% between
the DM and DS scenarios, equating to 5,674 tonnes of carbon. Therefore, carbon emissions are
lower than expected. This is despite increased traffic on the A2. The reason for this could be that
forecast flows, in some cases, particularly from Cobham – M2 J1, were lower than forecast.
Landscape
The landscape mitigation measures provided are as expected in the ES. Earth mounds, cuttings,
environmental barriers, retained/ new planting have integrated well with the surrounding landscapes,
and is starting to provide screening of the A2 for residential receptors and non-motorised users.
Although some vegetation has not established as well as others, it has ultimately helped soften the
impacts of the scheme. It is anticipated that by design year the impact would be as expected, subject
to on-going establishment of the planting.
It will be important for future landscape maintenance to continue as per the aftercare requirements
set out in the HEMP.
Landscape impacts are considered moderate beneficial, as expected.
Biodiversity
Mitigation measures included badger tunnels and an artificial sett and wildflower/calcareous grass
which have been provided as expected.
Badgers appear to be using the tunnels and the artificial sett.
It is considered overall that impacts for biodiversity are as expected
Heritage As reported at OYA there have been no direct or indirect impacts on built heritage – as expected.
There was a major programme of archaeological works ahead of construction and numerous finds
from Neolithic to post medieval periods were found.
An academic report (‘A Road Through the Past’) has been published.
Finds and records have been archived
Overall, the impacts on heritage are neutral, as expected.

Post Opening Project Evaluation
A2 Bean – Cobham (Phase 2) Five Years After Study
69
Key Points – Environment
Water According to the information provided by consultees and as noted from the site visit, highway drainage
including balancing ponds appeared to be performing in line with the proposals.
POPE is not aware that the drainage provision is performing other than as expected so at FYA, it is
considered that impacts are slight beneficial, as expected
Physical Fitness
The old A2 provides non-motorised users including cyclists, pedestrian and equestrians a new, safer
and more attractive route in this area.
The Cyclopark proposals as discussed at OYA has been built and is operating successfully.
The Cyclopark and new route is likely to increase cyclists demand in the area but this can’t be confirmed
by POPE.
Overall the scheme’s impact on physical fitness is scored as Moderate Beneficial, as expected.
Journey Ambience
Journey ambience, in terms of views from the road and driver stress, have been improved although there has been some reduction in traveller care.

Post Opening Project Evaluation
A2 Bean – Cobham (Phase 2) Five Years After Study
70
6. Accessibility and Integration
6.1 This chapter evaluates the impact of the scheme in terms of the accessibility and integration objectives; comparing qualitative forecast assessments from the scheme AST with post-opening findings and analysis of policy objectives.
Accessibility
6.2 The accessibility objective is concerned with how the scheme has affected the ability of people in different locations to reach different types of facility, using any mode of transport. The accessibility objective consists of three sub-objectives. These are:
Option values;
Access to the transport system; and
Severance.
Option Values
6.3 Option values, as defined in WebTAG, relate to the availability of different transport modes within the study area, even if they are not used. For example, a car user may value a bus service along their route even if they have never used it because they have the option of another mode should their car become unavailable. This sub-objective provides a measurement of the value of which people place on having an alternative travel mode option available.
6.4 For the objective regarding option values, the AST states that there would be no change to services and hence the impact would be neutral.
6.5 The former section of the A2 where offline widening took place, between Pepperhill and Marling Cross, has been developed into a separate pedestrian, cycle and equestrian route. Between Marling Cross and Cobham the footpath was upgraded to a combined pedestrian/cycleway. These routes are connected to the new footbridges and existing local rights of way.
6.6 This evaluation has found that the creation of a segregated route for NMUs has improved option values. Therefore, the impact is better than expected in the AST.
Severance
6.7 The AST states that there will be a slight beneficial impact on severance, as a result of improved junctions and pedestrian/cycle crossing facilities. New footbridges have been constructed to link the Gravesend northern side of the road with the wide NMU network to the south. The Ifield Court and Church Road bridges are suitable for use by cyclists and equestrians. Figure 6.1 shows a footbridge over the A2.
6.8 As the bridges have been constructed, as expected, the evaluation for this sub-objective is slight beneficial.
Scheme Objective: Provide enhanced access to regeneration areas and facilitate access to Ebbsfleet International Rail Station

Post Opening Project Evaluation
A2 Bean – Cobham (Phase 2) Five Years After Study
71
Figure 6.1 Footbridge over A2 Showing Hare Motif
Access to the Transport System
6.9 This sub-objective was scored as slight beneficial in the AST, due to the improved junction layouts which will enable easier access for traffic to and from the A2 mainline.
6.10 The outturn evaluation is that this remains true. The improved junctions may lead to better access for those in local areas, such as Gravesend, to longer distance bus or coach services.
Integration
6.11 The integration objective consists of two main elements. These are as follows:
Interchange with other transport modes: how the scheme assists different modes of transport in working together and the ease of people moving between them to choose sustainable transport choices; and
Land Use Policy and Other Government Policies: how the scheme integrates with local land use and wider government objectives.
Transport Interchange
6.12 The transport interchange objective relates to the extent to which the scheme contributed towards the Government objective of improving transport interchange for passengers and freight. Regarding this, the AST forecast states that the scheme will enable easy access to Ebbsfleet station. The AST forecast a neutral impact for the transport interchange objective. As there have been no additional services along the route, the assessment score of neutral can be upheld.
Land Use Policy
6.13 The AST scored the impact of the scheme on land use policy as neutral, with the scheme providing enhanced access to local land use development. However, there was some conflict with greenbelt protection, so the overall impact for this sub-objective is evaluated as neutral as expected.

Post Opening Project Evaluation
A2 Bean – Cobham (Phase 2) Five Years After Study
72
Other Government Policies
6.14 The scheme was evaluated as beneficial in the AST in terms of this sub-objective, as it was thought that it would assist policies for regenerating Gravesham.
6.15 The Thames Gateway project was the largest regeneration programme in Europe and includes Sittingbourne in Kent and the Kent Thameside and Ebbsfleet Valley regeneration areas. It was stated in the OYA report that Kent Thameside stated that the road widening scheme provides significant improvements, and that the regeneration project will benefit directly from this increased accessibility. This sub-objective has therefore been evaluated as beneficial.
6.16 Table 6.1 shows how the scheme aligns with local, regional and national policy.

Post Opening Project Evaluation
A2 Bean – Cobham (Phase 2) Five Years After Study
73
Table 6.1 Scheme Alignment with National, Regional and Local Policy
Policy/Document
Relevant Policy Objective/Reference Relevant Scheme Impacts Alignment
Lo
cal an
d
Su
b-
Reg
ion
al
Po
licie
s Local
Transport Plan for Kent (2011 – 2016)
This document provides a strategy for transport across the county. In particular, goals which are
relevant are as follows:
- Growth without Gridlock- this involves tackling congestion and improving access to
employment and services; and
- A Safer and Healthier County- includes enabling active travel.
Pedestrian and cycle facilities have improved with the scheme;
Bridges have been provided to improve access for NMUs; and
Access to local facilities, such as Ebbsfleet Station, have improved.
Reg
ion
al
Po
lic
y
The South East Plan (The Regional Spatial Strategy for the South East) (2009)
The RSS states that the A2/A282/M2 corridor has been identified a priority link which is likely to face increasing pressure due to traffic growth. This involves tackling congestion and its effects, such as decreased air quality.
The scheme aimed to tackle congestion as a result of increasing traffic.
Nati
on
al
Po
licy
A New Deal for Trunk Roads in England
(1998)
The Government’s overarching objectives for transport at the time of the appraisals were set out in this document, and include policies to:
Protect and enhance the built and natural environment;
Improve safety for all travellers;
Contribute to an efficient economy, and to support sustainable economic growth in appropriate locations;
Promote accessibility to everyday facilities for all, especially those without a car; and
Promote the integration of all forms of transport and land use planning, leading to a better, more efficient transport system.
Accessibility for NMUs has been improved with the introduction of footbridges and foot/cycle ways;
The old A2 route has been re-used; and
Economic growth has been promoted in the area, with access to Ebbsfleet and HS1 improved.

Post Opening Project Evaluation
A2 Bean – Cobham (Phase 2) Five Years After Study
74
Key Points – Accessibility and Integration
Accessibility Impacts
NMU facilities have been improved along the A2 and provide off-road walking and cycling
facilities.
Most accessibility sub-objectives receive an as expected score, although the Option Values sub-
objective performed better than expected.
Integration Impacts
The scheme has had no impact on access to the transport system, with the EST being scored
as neutral.
All integration sub-objectives received an as expected score.

Post Opening Project Evaluation
A2 Bean – Cobham (Phase 2) Five Years After Study
75
7. Appraisal Summary Table & Evaluation Summary Table
Appraisal Summary Table
7.1 The AST is a brief summary of the main economic, safety, environmental and social impacts of a highway scheme. Table 7.1 presents the AST for the A2 Bean – Cobham scheme.
7.2 The AST presents a brief description of the scheme, a statement detailing the problems that the scheme planned to address, and makes an assessment of the scheme’s predicted qualitative and quantitative impacts against the following objectives:
Environment – an estimate of the impact of the scheme on factors such as noise, local air quality, landscape, biodiversity, and water;
Safety – measured reduction in the number and severity of collisions and qualitative assessment of impacts on security;
Economy – estimated impact of the scheme upon journey times, vehicle operating costs, scheme costs, journey time reliability and wider economic impact;
Accessibility – a review of scheme impact upon access to the public transport network, community severance, and non-motorised user impact; and
Integration – a description of how a scheme is integrated with wider local planning, regional and national policy objectives.
Evaluation Summary Table
7.3 The EST was devised for the POPE process to record a summary of the outturn impacts against the same objectives, compared to the predictions in the AST.
7.4 Table 7.2 presents the EST for the scheme. An assessment of each of the objectives at the FYA stage is given. Where possible, the format of the EST mirrors the appearance and process of the AST to enable direct comparison between the two.

Post Opening Project Evaluation
A2 Bean – Cobham (Phase 2) Five Years After Study
76
Table 7.1 Appraisal Summary Table (AST)
Option Description: On line and off line A2 widening from dual 3-lane to 4-lane carriageway, with improved alignment and junction accesses
Problems Present Value of Costs to Public Accounts £122.044m (Central Case)
OBJ
SUB-OBJECTIVE QUALITATIVE IMPACTS QUANTITATIVE ASSESSMENT ASSESSMENT
En
vir
on
men
t
Noise Significant reduction in noise levels for large numbers of properties due to increased distance to new road and quieter
road surface. The estimated population annoyed by road traffic noise will fall by 37%, and fewer people will be
exposed/annoyed within the higher noise bands.
Estimated population annoyed in 2022 is
1,368 do-minimum, 857 with Scheme.
Net population win = 511
Local Air Quality Significant improvements in air quality for large numbers of properties due to increased distance to new road and
improvements in emissions technology over time. Some properties will benefit to the extent of being removed from the
AQMA. Compared to the present situation, the total emissions of NOx and PM10 in the future with the scheme will
decrease, although the total emissions would be slightly higher than the future do-minimum situation.
Detailed modelling indicates significant
benefits for most properties, and no
significant adverse effects.
Data not available in form required by
TAG, but overall effects would be large
beneficial
Greenhouse Gases Some increases over time due to increases in traffic. 2022 do-minimum would produce 60,351
tonnes of CO2 per year, scheme would
produce 73,196
Net increase of 12,845 tonnes per year
with scheme
Landscape Some properties experience substantial existing visual impact from current A2 alignment - all of these properties would
benefit from the scheme. Landscape effects would be slight beneficial only initially, as the road would move out into the
wider landscape, but this brings significant benefits to local people.
27 properties with increased visual
impact in year 1 (none by year 15). 121
properties with decreased visual impact
in year 1 (202 by year 15).
Moderate beneficial
Townscape No townscape assessment undertaken, as scheme passes the edge of Gravesend rather than going through it. However
there would be benefits to the urban fringe.
n/a n/a
Heritage of Historic Resources
Without mitigation, the scheme would have an adverse effect upon the archaeological resource, affecting both known
sites and, potentially, unknown sites. Potential effects on known and unknown archaeology would be effectively mitigated
by proposed pre-construction evaluation.
n/a Neutral
Biodiversity Some land take from SSSI, although this would be alongside existing road. Some disturbance to protected species in the
short term, though there would be longer term benefits. Extensive creation of new, semi-natural habitats. Effects vary for
different biodiversity topics, and TAG process requires adoption of worst score, but in overall terms scheme would have
slight beneficial effects, increasing over time.
n/a Slight adverse
Water Slight beneficial effects on water quality in river and aquifer due to improved pollution control. Neutral effect on
hydrology.
n/a Slight beneficial
Physical Fitness No data on numbers walking or cycling, but journey lengths on existing routes would be largely unaffected and scheme
provides new foot/cycleway connections along its length, linking with Country Park to the east. Numbers cycling and
walking should increase.
n/a Moderate beneficial
Journey Ambience Driver stress should reduce, as scheme will reduce congestion and improve traffic flows. Roadside environment will be
more pleasant and views from the road will improve, increasingly so over time.
n/a Moderate beneficial

Post Opening Project Evaluation
A2 Bean – Cobham (Phase 2) Five Years After Study
77
Safe
ty Accidents
Users and non-users will benefit from a reduction in accidents on the network.
Small accident cost during scheme construction.
Additional accident saving with extended scheme will be +£0.007m low / +£0.009m central / +£0.012m high.
Reduction of 9.4 / 9.3 / 10.4 Fatal, 57.1 / 54.7 /
58.6 Severe, 1026.9 / 987.2 / 1052.8 Slight,
PVB £28.194m / £27.012m / £29.146m (Table
4 CJIR)*
Increase in No. accidents during construction 51 / 52 / 54, PVB -£3.736m / -£3.811m / -£3.922m (Table 5 CJIR)
PVB Low £24.458m,
PVB Central £23.201m,
PVB High £25.224m
Security Subways replaced by footbridges to improve security for users.
Landscaping designed to provide clear sight lines. No concealed areas.
n/a Moderate Beneficial
Eco
no
my
Public Accounts
Extended A2 scheme will require significant public capital expenditure:
+£3.8m more than initial scheme low / central / high
Central Govt PVC (incl. lost tax revenue) £121.884m / £.123.332m / £126.513m (Local Govt PVC £0m) (Table 3 CJIR) Less Indirect tax revenue during construction, PVC -£0.775m / -£1.288m / -£1.870m (Table 5 CJIR)
PVC Low £121.109m,
PVC Central £122.044m,
PVC High £124.643m
Transport Economic Efficiency: Business Users & Transport Providers
Journey time and vehicle operating cost benefits accrue to users of the A2 and local roads that cross the A2 through junction improvements. Freight and public transport operator also benefit.
Freight and public transport operator also benefit.
Users PVB £204.526m / £212.216m / £247.231m, (Table 3 CJIR )
(Transport Providers Included within Users Other PVB £0m)
Delays due to construction and maintenance, PVB -£22.911m / -£28.918m / -£35.887m, (Table 5 CJIR) (of which -£0.178m / -£0.227m / -£0.285m to Transport Providers)
PVB Low £181.615m,
PVB Central £183.298m,
PVB High £211.344m
Transport Economic Efficiency: Consumers
Journey time and vehicle operating cost benefits accrue to users of the A2 and local roads that cross the A2 through junction improvements.
Users PVB £204.526m / £212.216m / £247.231m (Table 3 CJIR)
Delays due to construction and maintenance, PVB -£15.865m / -£20.079m / -£25.029m (Table 5 CJIR)
PVB Low £153.336m,
PVB Central £153.857m,
PVB High £173.890m
Reliability Improved A2 capacity, alignment and junction access will provide better speed / flow characteristics and more consistent journey times
No quantitative assessment of reliability benefits has been made.
Additional PVB £30m-£80m
(not included in full appraisal benefits)
Wider Economic Impacts
Increase in jobs accessible in Regeneration Area, based on changes in accessibility 55,124 / 85,150 increase in jobs accessible to workforce in RA
84 - 376 increase in employment of residents in deprived wards
84 / 376 increase in employment of residents in deprived wards
Acce
ssib
ilit
y Option Values Scheme will not affect mode choice options in the study area n/a Neutral
Severance Improved Junctions and pedestrian / cycle crossing facilities will reduce severance n/a Slight beneficial
Access to the Transport System
Improved junction layouts will enable easier access for traffic to and from the A2 mainline n/a Slight beneficial

Post Opening Project Evaluation
A2 Bean – Cobham (Phase 2) Five Years After Study
78
Inte
gra
tio
n Transport Interchange Scheme will enable easy access to Ebbsfleet CTRL station site n/a Neutral
Land-use Policy Scheme will provide enhanced access to local land use development n/a Neutral
Other Government Policies Scheme will assist policies for regenerating Gravesham n/a Beneficial
TUBA Central Case BCR 3.0
PVC (high) £124.643m
PVC (low) £121.109m
PVB (high) £410.458m
PVB (low) £359.409m
PVB (Central) £360.356m
PVC (Central) £122.044m
NPV (Central) £238.312m
* CJIR A2 Cobham Junction Improvement Report

Post Opening Project Evaluation
A2 Bean – Cobham (Phase 2) Five Years After Study
79
Table 7.2 Evaluation Summary Table (EST)
OBJ SUB-OBJECTIVE QUALITATIVE IMPACTS QUANTITATIVE IMPACT ASSESSMENT
En
vir
on
men
t
Noise As expected the new alignment has moved traffic further away from the main residential areas which have generally benefited with decreased noise. The new alignment has brought traffic noise nearer to some properties and monitoring indicates that noise is slightly worse than expected at one property.
- As expected main residential areas benefited with decreased noise
Local Air Quality Observed traffic flows are lower than or within 10% of those forecast. Gravesham Borough Council has reduced the number of properties in one AQMA following and revoked the other 2 years of monitoring data.
- As expected. Significant decreases in pollutant concentrations at continuous
monitoring site near A2
Greenhouse Gases Increase, but less than expected. - 4,868 tonnes in 2014
Landscape
The location of the new A2 moves traffic further away from residential areas and has allowed the provision of an attractive green space within the old A2 route as expected. However, the new transport corridor with associated lighting and sign gantries located close to the CTRL has adversely impacted on the local landscape character and although new landscape planting is in place it will take time to mitigate the effects.
- As expected in AST (moderate beneficial)
Heritage of Historic Resources
Based on the information available at this FYA stage it is considered that sufficient evaluation has been carried out. A popular booklet and academic report has been produced. The FYA evaluation confirms deposition of the archive and finds.
- Neutral as expected
Biodiversity Land take at SSSI adjacent to existing A2 as expected. Provision for protected species during construction and mitigation measures provided as part of the scheme. Extensive new areas of habitat provided which in time should benefit biodiversity. No monitoring information available at this FYA stage which would allow full evaluation.
- Neutral, better than expected in AST
(slight adverse, but note this was a worst case assessment)
Water Mitigation measures have been incorporated into the scheme and no information has been provided to POPE which would indicate that they are performing other than as expected. No water quality data has been made available.
- Slight beneficial as expected
Physical Fitness Mitigation measures have been implemented to incorporate new NMU links into the scheme and existing NMU routes have been retained as expected. Cyclopark has been constructed between OYA and FYA.
- Moderate beneficial as expected
Journey Ambience Congestion has been eased and journey times are more reliable. New planting and grassland areas in place and will provide a pleasant landscape corridor for the A2 route as it matures. Traveller care facilities have been closed.
- Worse than expected (large beneficial) due to closure of services
Safe
ty
Collisions The number of collisions in the wider area has increased, but there has been negligible impact on the scheme section. Average Annual increase of 0.3
collisions. Worse than expected- no collision
savings
Security Footbridges have replaced subways along the route to improve personal security. - As expected (moderate beneficial)
Eco
no
my
Public Accounts Scheme costs are slightly higher than expected.
Forecast PVC (with tax as cost) = £122.4m
Observed PVC (with tax as cost) = £124.9m
Forecast PVC (with tax as benefit) = £116.3m
Observed PVC (with tax as benefit) = £118.8m
Slightly worse than expected
Transport Economic Efficiency
Across the AM, Inter Peak and PM periods, observed Do-Something journey times improved but were slightly lower than forecast.
Journey Time Benefits – £313.4m over 60 years
Beneficial
Reliability Adjusted route stress has decreased between before scheme construction and post-scheme periods, thus suggesting less day to day variability.
- As expected (beneficial)
Wider Economic Impacts The scheme has improved access for the Regeneration Area. - As expected
Acce
ssi
bilit
y Option Values
The scheme has had no impact on access to the transport system, with the EST being scored as neutral. -
As expected (neutral)
Severance As the bridges have been constructed, as expected, the evaluation for this sub-objective is slight beneficial. - As expected (slight beneficial)

Post Opening Project Evaluation
A2 Bean – Cobham (Phase 2) Five Years After Study
80
OBJ SUB-OBJECTIVE QUALITATIVE IMPACTS QUANTITATIVE IMPACT ASSESSMENT
Access to the Transport System
The existing route of the A2 was followed closely with no direct changes to public transport, as expected. - As expected
(slight beneficial)
Inte
gra
tio
n
Transport Interchange As there have been no additional services along the route, transport interchange receives a score of neutral. - As expected
(neutral)
Land Use Policy and Other Government Policies
The impact on the Regeneration Area scores this sub-objective as beneficial. - As expected (beneficial)

Post Opening Project Evaluation
A2 Bean – Cobham (Phase 2) Five Years After Study
81
8. Conclusions
8.1 To conclude this report, this section summarises whether the scheme is meeting its specified objectives.
Scheme Specific Objectives
8.2 Table 8.1 presents an evaluation of the scheme’s objectives using the evidence presented in this study.
Table 8.1 Success Against Scheme Objectives
Objective Achieved?
Reduce journey time and improve reliability
Journey times have decreased along the scheme section of the A2, with journey times becoming more reliable.
Journey time savings have been observed in all time periods (AM peak, inter-peak and PM peak).
Improve safety
While the number of collisions along the route has remained unchanged, the severity of these collisions has decreased, meaning there are fewer collisions classed as fatal or serious.
There has been a positive impact on personal security, with the addition of footbridges to replace subways.
Provide enhanced access to the major regeneration area of Kent Thameside and other regeneration areas in north and east Kent
The extra capacity and additional junctions provided by both Phases 1 and 2 of the scheme has improved access to the regeneration areas in the vicinity.
Facilitate access to Ebbsfleet International Rail Station from the road network
Access has been improved for Ebbsfleet International Rail Station, by improving journey times and providing extra capacity along the route.
Provide safe and appropriate access along the route for non-motorised users
Subways have been replaced with footbridges.
New cycle/footway alongside route with addition of Cyclopark.
8.3 The scheme has, in general, met the objectives. While the economic benefits are smaller than forecast, benefits have still been experienced across the range of objectives. It is important to note that this report isolates the impacts of Phase 2 of the A2 Bean – Cobham scheme, although in reality the benefits are likely to be achieved through the scheme as a whole. The fact that this scheme has met its objectives and achieved a high value for money gives an indication of the scheme’s success.

Post Opening Project Evaluation
A2 Bean – Cobham (Phase 2) Five Years After Study
82
9. Appendices
Appendix A: Glossary Terms Definition
AADT Annual Average Daily Traffic. Average of 24 hour flows, seven days a week, for all days within a year.
Accessibility Accessibility can be defined as 'ease of reaching'. The accessibility objective is concerned with increasing the ability with which people in different locations, and with differing availability of transport, can reach different types of facility.
ADT Average Daily Traffic. Average daily flows across a given period.
AONB Area of Outstanding Natural Beauty
AST Appraisal Summary Table. This records the impacts of the scheme according to the Government’s five key objects for transport, as defined in DfT guidance contained on its Transport Analysis Guidance web pages, WebTAG.
AAWT Annual Average Weekday Traffic. As AADT but for five days (Monday to Friday) only.
AWT Average Weekday Traffic. As ADT but for five days (Monday to Friday) only.
BCR Benefit Cost Ratio. This is the ratio of benefits to costs when both are expressed in terms of present value i.e. PVB divided by PVC.
CEMP Construction Environment Management Plan
COBA
Cost Benefit Analysis. A computer program which compares the costs of providing road schemes with the benefits derived by road users (in terms of time, vehicle operating costs and collisions), and expresses the results in terms of a monetary valuation. The COBA model uses the fixed trip matrix unless it is being used in Collision-only mode.
DfT Department for Transport
Discount Rate The percentage rate applied to cash flows to enable comparisons to be made between payments made at different times. The rate quantifies the extent to which a sum of money is worth more to the Government today than the same amount in a year's time.
Discounting
Discounting is a technique used to compare costs and benefits that occur in different time periods and is the process of adjusting future cash flows to their present values to reflect the time value of money, e.g. £1 worth of benefits now is worth more than £1 in the future. A standard base year needs to be used which is 2002 for the appraisal used in this report.
DM Do Minimum. In scheme modelling, this is the scenario which comprises the existing road network plus improvement schemes that have already been committed.
DS Do Something. In scheme modelling, this is the scenario detailing the planned scheme plus improvement schemes that have already been committed.
EA Environment Agency
EAR Economic Assessment Report
ES Environmental Statement
EST Evaluation Summary Table. In POPE studies, this is a summary of the evaluations of the TAG objectives using a similar format to the forecasts in the AST.
FYA Five Year After
HEMP Handover Environmental Management Plan
HGV Heavy Goods Vehicle
HS1 High Speed 1
KCC Kent County Council
KSI Killed or Seriously Injured. KSI is the proportion of casualties who are killed or seriously injured and is used as a measure of collision severity.
LEAP Landscape and Ecology Aftercare Plan

Post Opening Project Evaluation
A2 Bean – Cobham (Phase 2) Five Years After Study
83
Terms Definition
MAC Managing Area Contractor Organisation normally contracted in 5-year terms for undertaking the management of the road network within an Highways England area.
MVKM Million Vehicle Kilometres
NATA New Approach to Appraisal. The basis of the standard DfT appraisal approach when this scheme was appraised. This is now referred to as the DfT’s objectives for transport.
NCR National Cycle Route
NMU Non-Motorised User. A generic term covering pedestrians, cyclists and equestrians.
NRTF
National Road Traffic Forecasts. This document defines the latest forecasts produced by the Department of the Environment, Transport and the Regions of the growth in the volume of motor traffic. At the time this scheme was appraised, the most recent one was NRTF97, i.e. dating from 1997.
OYA One Year After
PIC Personal Injury Collisions
POPE Post Opening Project Evaluation. The before and after monitoring of all major highway schemes in England.
Present Value Present Value. The value today of an amount of money in the future. In cost benefit analysis, values in differing years are converted to a standard base year by the process of discounting giving a present value.
PROW Public Right of Way
PVB Present Value Benefits. Value of a stream of benefits accruing over the appraisal period of a scheme expressed in the value of a present value.
PVC Present Value Costs. As for PVB but for a stream of costs associated with a project.
QUADRO Queues and Delays at Roadworks. A software program for calculating the monetary impacts of delays at roadworks.
SSSI Site of Special Scientific Interest
TEE Transport Economic Efficiency
TEMPro Trip End Model Program. This program provides access to the DfT's national Trip End Model projections of growth in travel demand, and the underlying car ownership and planning data projections.
TRADS Traffic Flow Data System. Database holding information on traffic flows at sites on the strategic network.
UK United Kingdom
VMS Variable Message Sign
WebTAG DfT's website for guidance on the conduct of transport studies at http://www.webtag.org.uk/

Post Opening Project Evaluation
A2 Bean – Cobham (Phase 2) Five Years After Study
84
Appendix B: Tables and Figures Listed in this report
Figure 1.1 Location Plan 7
Figure 1.2 Measures Incorporated During Phase 2 8
Figure 1.3 Scheme Timeline 9
Figure 2.1 Local, Regional and National Trends in Million Vehicle Kilometres (mvkm) 15
Figure 2.2 Location of Traffic Counts 17
Figure 2.3 Observed Before Construction, OYA and FYA by Direction (ADT) Flows 18
Figure 2.4 Observed Before Construction, OYA and FYA Two-Way (ADT) Flows 19
Figure 2.5 Identification of Screenlines 21
Figure 2.6 Journey Time Analysis Route 25
Figure 3.1 Collision Study Area 30
Figure 3.2 Trends in Injury Collision Numbers 31
Figure 3.3 Collision Locations 34
Figure 5.1 Key Location Plan- Scheme Locations Referenced in Environment Chapter 45
Figure 5.2 Environmental Barrier at Long View 49
Figure 5.3 ‘Orchard’ Planting in Linear Park 54
Figure 5.4 Planting at the Marling Cross Junction 54
Figure 5.5 Good Establishment of Off-Site Planting Opposite Cobham Services 55
Figure 5.6 Chalk Cutting Slopes on A2 Showing Colonisation with Wildflower Grassland Above 57
Figure 5.7 Badger Tunnel Adjacent to the Ifield Court Overbridge 58
Figure 5.8 Attenuation Pond B at Downs Road 61
Figure 5.9 Infiltration Pond C at Marling Cross 61
Figure 5.10 Infiltration Pond at Cobham Services 62
Figure 5.11 New NMU Bridge Illustrating Hare Motif 64
Figure 5.12 View West Along Linear Park Showing New Access to Cyclopark 64
Figure 5.13 BMX Track at Cyclopark 65
Figure 6.1 Footbridge over A2 71
Table 1.1 Nearby Highways Schemes 11
Table 2.1 AAWT for M20, Junctions 3 – 4 15
Table 2.2 HGV Proportions on the A2 and M2 20
Table 2.3 Two Way Traffic Flows across Screenlines 22
Table 2.4 Forecast and Observed Flows for the Do Something Scenario 23
Table 2.5 Forecast and Observed Flows for the Do Minimum Scenario 24
Table 2.6 Observed Journey Times Before and After Scheme Opening 26
Table 2.7 Forecast and Outturn Journey Time Savings- Pepperhill Junction – M2 J1 26
Table 2.8 Calculation of Route Stress on the A2 27
Table 3.1 Number of Collisions by Severity in the Wider Area 32

Post Opening Project Evaluation
A2 Bean – Cobham (Phase 2) Five Years After Study
85
Table 3.2 Number of Collisions on Key Link (A2 – Phase 2) 33
Table 3.3 Collision Rates on the A2 Scheme Section 34
Table 3.4 Safety Forecasts from AST 35
Table 4.1 Summary of Investment Costs (2002 Prices) 38
Table 4.2 Forecast Present Value Benefits for Phase 2 39
Table 4.3 PAR Method for Outturn Journey Time Benefits 40
Table 4.4 Summary of Present Value Benefits 41
Table 4.5 Forecast vs Outturn BCRs 41
Table 5.1 Summary of Environmental Consultation Responses 46
Table 5.2 Forecast and Observed Traffic Flows on the Scheme Section 48
Table 5.3 Evaluation Summary: Noise 50
Table 5.4 Monitored Concentrations at Gravesham A2 Roadside 51
Table 5.5 Evaluation Summary: Air Quality 51
Table 5.6 Carbon Emissions- DM and DS at OYA 52
Table 5.7 – Greenhouse Gases 52
Table 5.8 Evaluation Summary: Landscape 55
Table 5.9 Wildlife Mortality Data 57
Table 5.10 Evaluation Summary: Archaeology 59
Table 5.11 Evaluation Summary: Water 62
Table 5.12 Evaluation Summary: Physical Fitness 65
Table 5.13 Summary of Journey Ambience Evaluation 67
Table 5.14 Evaluation Summary: Journey Ambience 67
Table 6.1 Scheme Alignment with National, Regional and Local Policy 73
Table 7.1 Appraisal Summary Table (AST) 76
Table 7.2 Evaluation Summary Table (EST) 79
Table 8.1 Success Against Scheme Objectives 81
Table 9.1 Record of Environmental Background Information Requested and Received 86

Post Opening Project Evaluation
A2 Bean – Cobham (Phase 2) Five Years After Study
86
Appendix C: Environment Information Requested
Table 9.1 Record of Environmental Background Information Requested and Received
Requested Information Response
Environmental Statement
A2 Bean To Cobham Widening Phase 2: Pepperhill To Cobham Environmental Statement September 2004 including main text, appendices and figures
AST AST produced April 2005
Any amendments/ updates/addendums etc. to the ES or any further studies or reports relevant to environmental issues. Have there been any significant changes to the Scheme since the ES.
No major amendments or changes.
'As Built' drawings for landscape, ecological mitigation measures, drainage, fencing, earthworks etc. Preferably electronically or on CD.
Provided
Copies of the H&S File, Construction Environment Management Plan (CEMP) Landscape/Ecology Management Plan, Handover Environmental Management Plans
HEMP April 2014;
Contact names for consultation Provided by Highways England and sourced by POPE team
Archaeology - were there any finds etc. Have any Archaeological reports been written either popular or academic and if so are these available?
Numerous finds detailed in academic report ‘A Road Through The Past’ 2012
Have any properties been eligible for noise insulation?
No properties eligible for noise insulation Noise figures recalculated for two properties March 2009
Has any post opening survey or monitoring been carried out e.g. for ecology/biodiversity or water quality and if so would copies of the reports be available?
No monitoring carried out and no reports
Animal Mortality Data Provided by the MAC
Copy of post opening Non-motorised User Survey
Not provided
Any publicity material Sourced from Highways England webpage
Information may be available regarding environmental enhancements to streetscape/townscape for bypassed settlements
N/A
Employer’s Requirement works Information for environment
Not provided
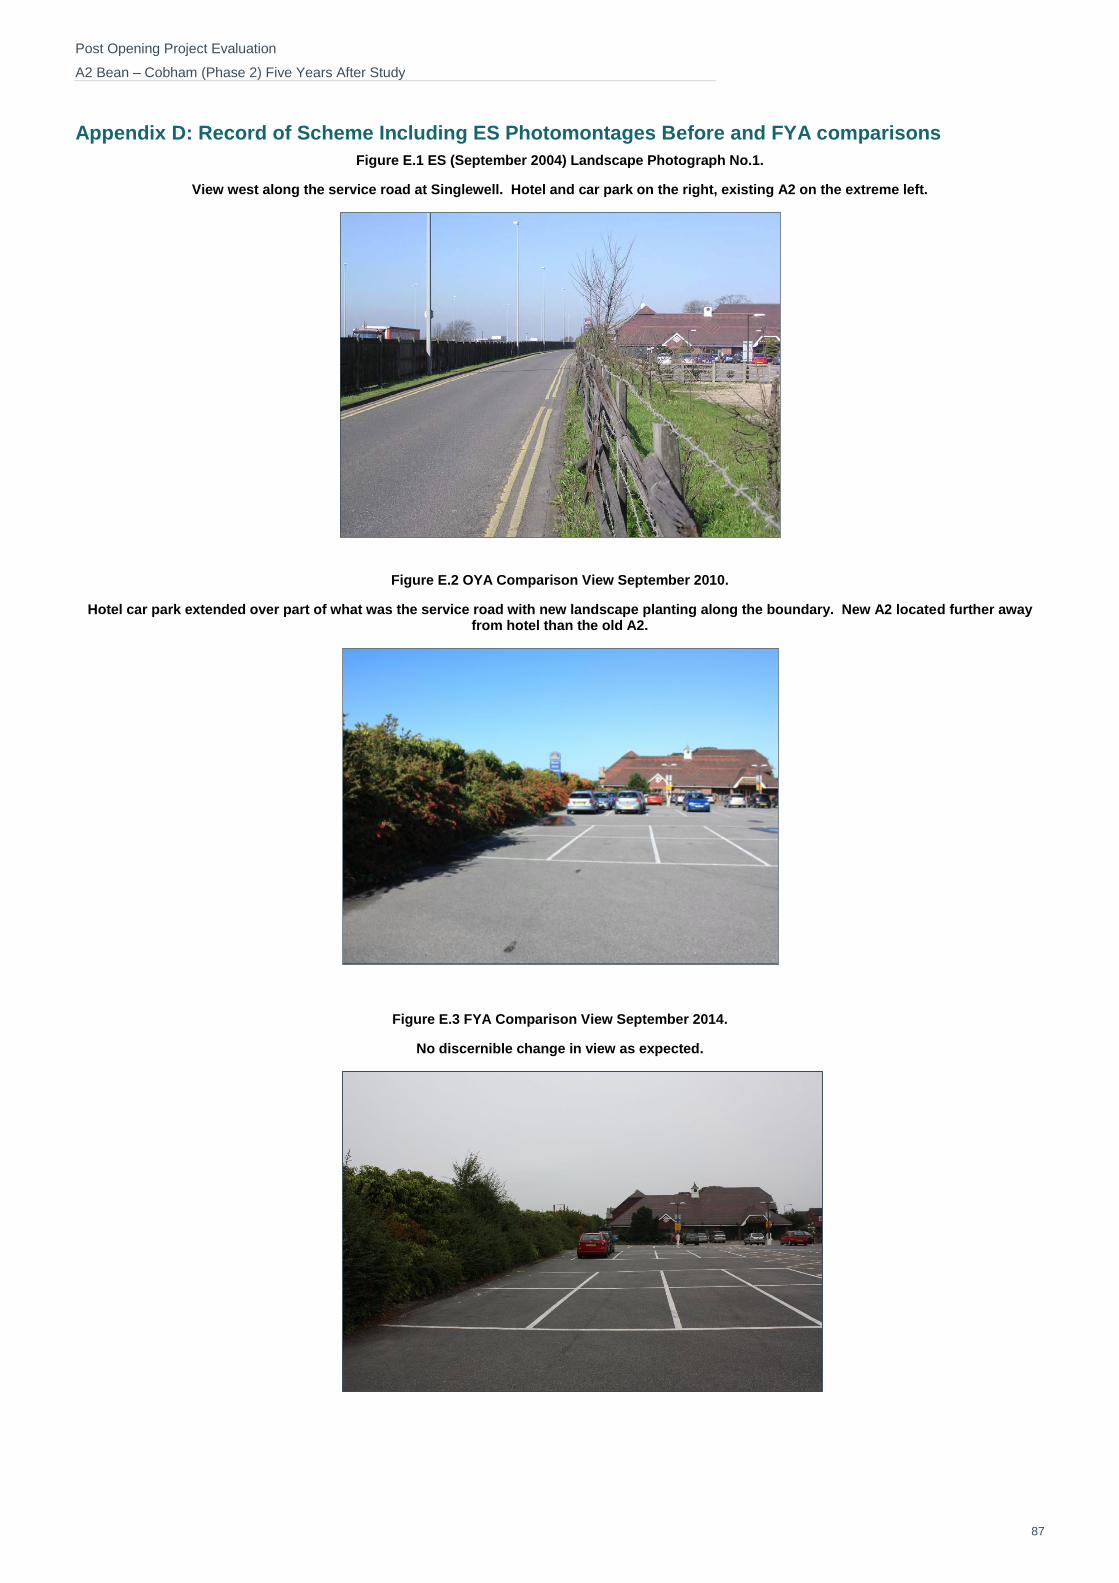
Post Opening Project Evaluation
A2 Bean – Cobham (Phase 2) Five Years After Study
87
Appendix D: Record of Scheme Including ES Photomontages Before and FYA comparisons
Figure E.1 ES (September 2004) Landscape Photograph No.1.
View west along the service road at Singlewell. Hotel and car park on the right, existing A2 on the extreme left.
Figure E.2 OYA Comparison View September 2010.
Hotel car park extended over part of what was the service road with new landscape planting along the boundary. New A2 located further away from hotel than the old A2.
Figure E.3 FYA Comparison View September 2014.
No discernible change in view as expected.
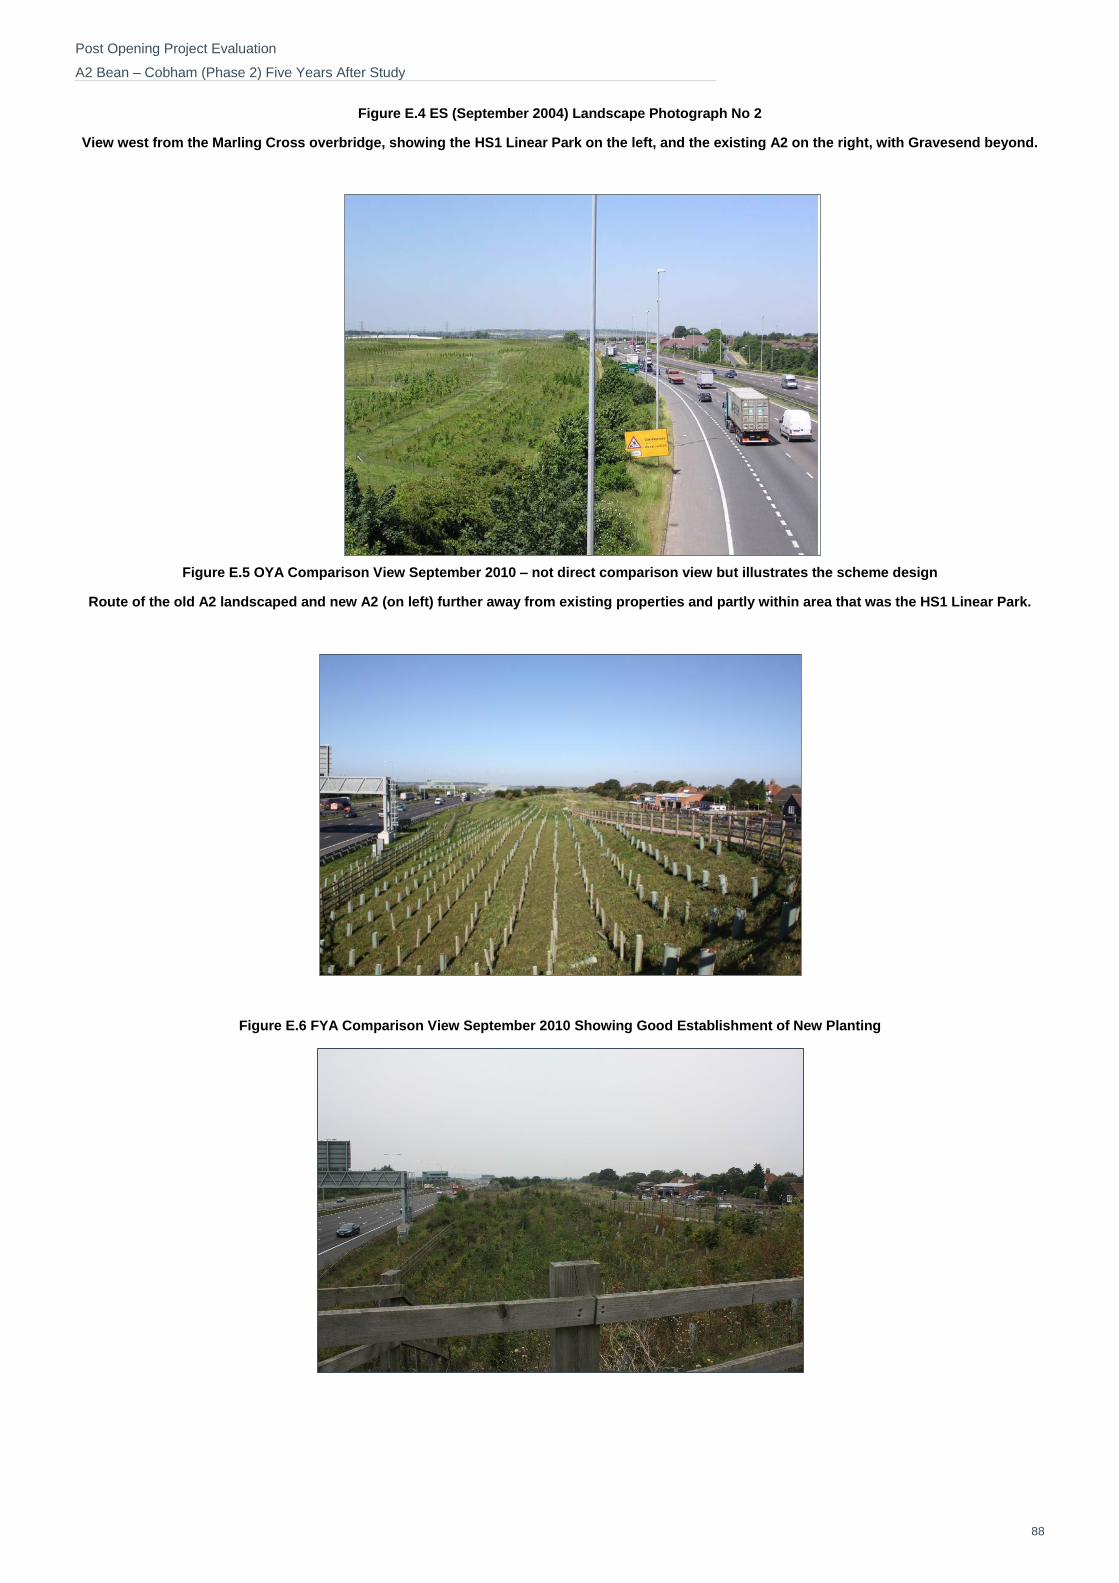
Post Opening Project Evaluation
A2 Bean – Cobham (Phase 2) Five Years After Study
88
Figure E.4 ES (September 2004) Landscape Photograph No 2
View west from the Marling Cross overbridge, showing the HS1 Linear Park on the left, and the existing A2 on the right, with Gravesend beyond.
Figure E.5 OYA Comparison View September 2010 – not direct comparison view but illustrates the scheme design
Route of the old A2 landscaped and new A2 (on left) further away from existing properties and partly within area that was the HS1 Linear Park.
Figure E.6 FYA Comparison View September 2010 Showing Good Establishment of New Planting

Post Opening Project Evaluation
A2 Bean – Cobham (Phase 2) Five Years After Study
89
Figure E.7 ES (September 2004) Landscape Photograph No 3
View south east from the footway on the south side of the existing A2 towards the HS1 Downs Road overbridge.
Figure E.8 OYA Comparison View September 2010
Existing Downs Road bridge over HS1 visible middle distance to right of the new bridge and gantries over the new A2. Traffic on the new road can be seen beyond the highway boundary fence. New planting in the foreground.
Figure E.9 FYA Comparison View September 2014
Existing Downs Road bridge over HS1 now obscured by new planting in the foreground. Traffic screened but lighting and gantries still visible in view

Post Opening Project Evaluation
A2 Bean – Cobham (Phase 2) Five Years After Study
90
Figure E.10 ES (September 2004) Landscape Photograph No 4
View from the footway on the north side of the A2 (just west of the Cobham Services) towards Thong village.
Figure E.11 OYA Comparison View September 2010
No change as a result of the A2 Improvements, as expected.
Figure E.12 FYA Comparison View September 2014
View unchanged from OYA, as expected.
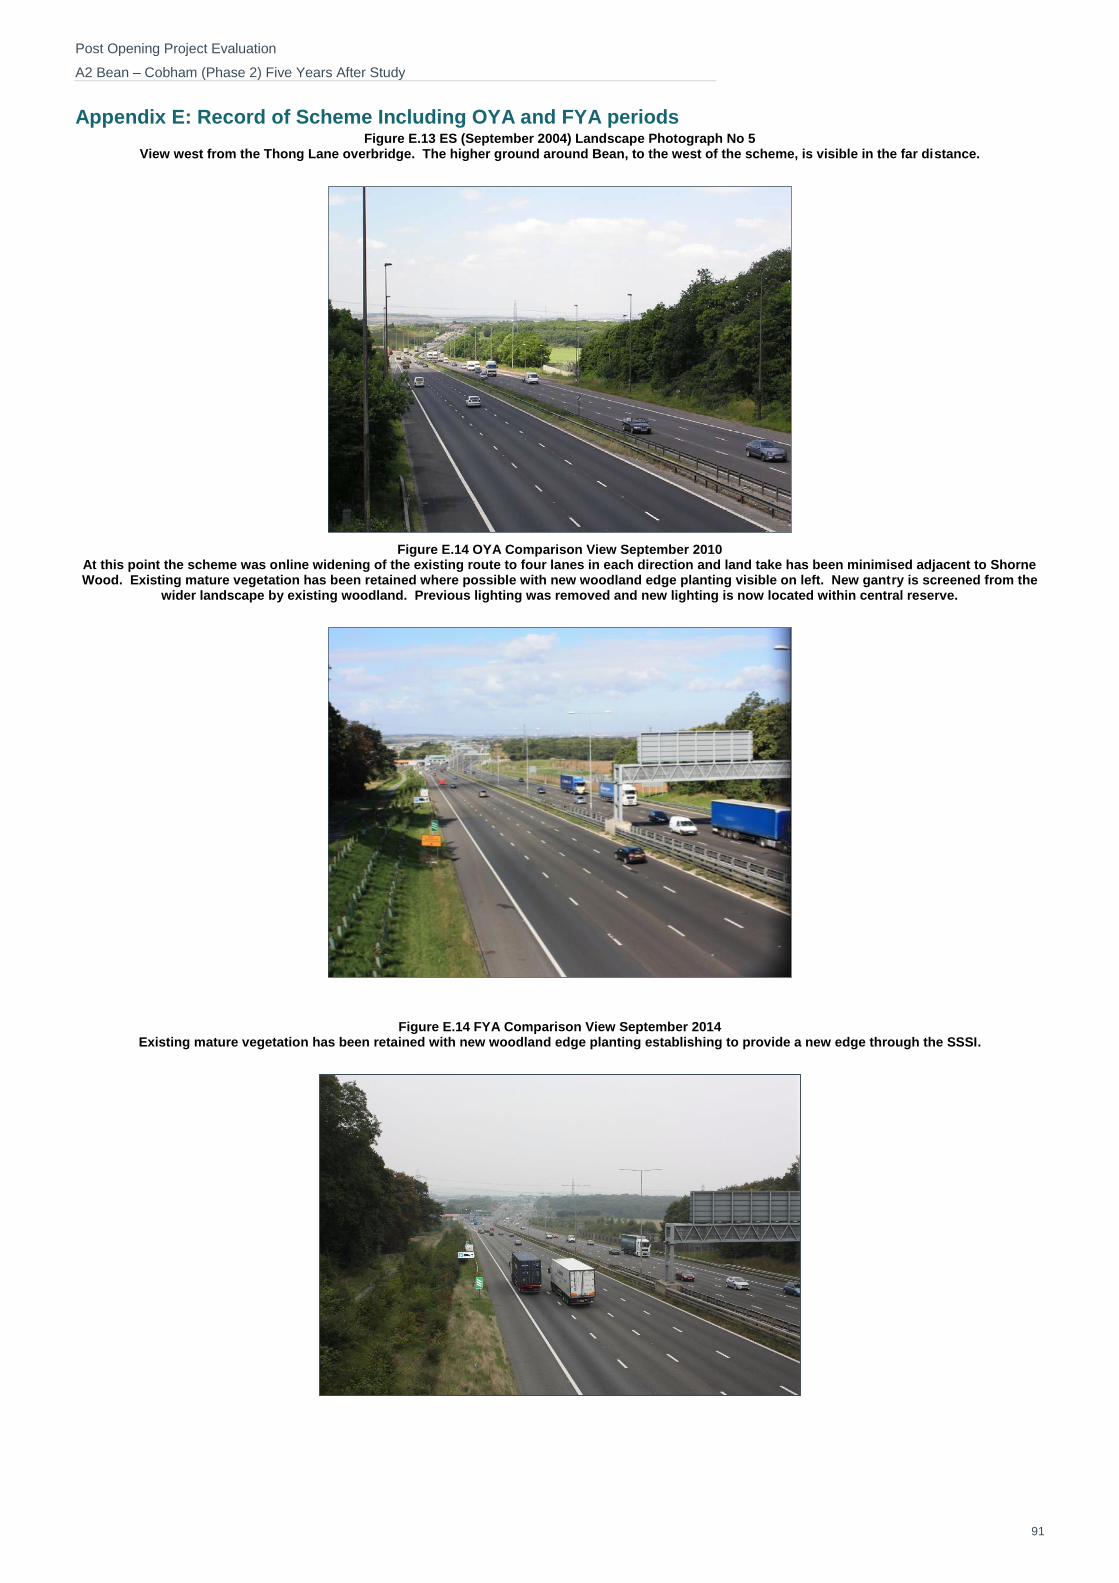
Post Opening Project Evaluation
A2 Bean – Cobham (Phase 2) Five Years After Study
91
Appendix E: Record of Scheme Including OYA and FYA periods Figure E.13 ES (September 2004) Landscape Photograph No 5
View west from the Thong Lane overbridge. The higher ground around Bean, to the west of the scheme, is visible in the far distance.
Figure E.14 OYA Comparison View September 2010 At this point the scheme was online widening of the existing route to four lanes in each direction and land take has been minimised adjacent to Shorne Wood. Existing mature vegetation has been retained where possible with new woodland edge planting visible on left. New gantry is screened from the
wider landscape by existing woodland. Previous lighting was removed and new lighting is now located within central reserve.
Figure E.14 FYA Comparison View September 2014 Existing mature vegetation has been retained with new woodland edge planting establishing to provide a new edge through the SSSI.

Post Opening Project Evaluation
A2 Bean – Cobham (Phase 2) Five Years After Study
92
Figure E.15 ES (September 2004) Landscape Photograph No 7 Properties screened by existing timber noise barrier. Winter view.
Figure E.16 OYA Comparison View September 2010 Summer view with existing vegetation screening house behind. Old A2 has been relocated further away and area landscape. View is at edge of the new
linear park.
Figure E.17 FYA Comparison View September 2014 Summer view showing continued growth of existing and new vegetation but occasional elm die-back.

Post Opening Project Evaluation
A2 Bean – Cobham (Phase 2) Five Years After Study
93
Figure E.18 ES (September 2004) Landscape Photograph No 9 Properties on Old Watling Street face directly onto the existing A2 from first floor windows.
Figure E.19 – OYA Comparison View September 2010 Wider angle view which illustrates the old A2 now relocated further away from properties and route landscape as part of the new linear park. Existing
vegetation on boundary retained.
Figure E.20 – FYA Comparison View September 2014 Wider angle view which illustrates the establishment of planting in the new linear park and growth of existing vegetation on boundary.

Post Opening Project Evaluation
A2 Bean – Cobham (Phase 2) Five Years After Study
94
Figure E.21 ES (September 2004) Landscape Photograph No 10 View North West from the approach to the HS1 Downs Road overbridge, showing properties in elevated positions at Pepperhill with views along the line
of the new scheme (which would run between the viewpoint and the existing A2). The line of the existing A2 can be seen from the white lorry on the right of the view.
Figure E.22 – OYA Comparison View September 2010 New A2 on embankment with gantries and lighting overlooked by properties in Pepperhill as expected. New planting in place on embankment slope.
Figure E.23 – FYA Comparison View September 2014 New planting on embankment slope beginning to screen views of traffic.

Post Opening Project Evaluation
A2 Bean – Cobham (Phase 2) Five Years After Study
95
Appendix F: Predicted Impacts, Mitigation and Evaluation for Landscape Sub-Objective
Effects on Landscape Proposed Mitigation Evaluation at OYA Evaluation at FYA
Exis
tin
g L
an
dscap
e F
eatu
res
Retention of majority of
existing A2 vegetation.
Loss of some areas of
existing A2 roadside
planting particularly at
junctions and limited
vegetation outside existing
highway boundary
(1.5ha).
Localised loss including a
few mature trees within
Shorne and Ashenbank
Woods SSSI.
Partial loss of new HS1
linear park (5.6ha).
Removal of detracting
features - derelict café at
Marling Cross and
subways at Hog Lane and
Hever Court Road subject
to antisocial behaviour.
Existing vegetation would be retained where
possible and where it was in good condition. No
significant losses of existing vegetation on north
side of existing A2 screening properties on south
edge of Gravesend.
New landscape planting to replace vegetation lost
to the scheme. 18.9ha new woodland, 4.7ha shrub
planting and 17.8ha wildflower / calcareous
grassland.
It was noted that the HS1 linear park was very
recently created and therefore planting was
immature. Loss would be compensated for by
extensive new open space in the area to the west
and along redundant A2 carriageway.
The loss of trees within SSSI was not seen as significant in the context of the considerable extent of the overall area of the SSSI.
Based on the As Built drawings it would appear that generally
existing vegetation has been retained as expected and in the
few instances where this has not been possible, replacement
planting has been provided. The LEAP includes management
prescriptions for retained vegetation within the highway
boundary.
New planting has been provided and based on the As Built
drawings it is in line with the ES proposals.
75,000 locally grown native trees and shrubs have been
planted.
Replacement landscape has been included to compensate for
the loss of the HS1 linear park.
The LEAP also recognises that some of the new landscaped
areas included in the scheme e.g. the Linear Park are not
typical of highway landscaping and being open to the public
may be subject to vandalism but are not at the moment.
Based on the As Built drawings removal of vegetation in the
vicinity of the SSSI appears to have been minimised and
localised.
The scheme provided the opportunity to remove some local eyesores and improve the landscape and visual amenity of the roadside environment.
Existing vegetation was retained within the scheme boundary but no particular evidence of management operations having taken place.
The rate of plant establishment varies between plots and most are considered successful and provide good screening for motorists and other receptors, but some are less well established. Some die-back of larger trees noted in cherry tree plantation area. Good establishment as expected on areas of undisturbed ground to north of scheme. Some evidence of vandalism (broken trees etc.) but overall this does not appear to have been a problem. No evidence of anti-social behaviour noted within linear park and eyesores/behaviour problems pre scheme are not evident.
Overall, vegetation establishment across the scheme is considered likely as expected.

Post Opening Project Evaluation
A2 Bean – Cobham (Phase 2) Five Years After Study
96
Effects on Landscape Proposed Mitigation Evaluation at OYA Evaluation at FYA
Landscape Character
Areas
Ebbsfleet Valley – area
dominated by intrusive
urban elements and
scheme effects would be
neutral.
Gravesend and Northfleet
– the A2 would move
further away from
Gravesend with
substantial beneficial
change.
Urban fringe – adverse
effects initially due to new
road including two
junctions and traffic,
removal existing
vegetation to south of
Tollgate & Marling Cross
junctions and loss of part
HS1 linear park.
Undulating agricultural
land – between Pepperhill
and Tollgate mostly in
cutting but slight adverse
effects initially where new
road moves onto open
countryside away from
urban edge.
Enclosed agricultural
landscape – road widened
along existing alignment
with neutral effects.
Woodland – adverse
effects as road would be
widened to 6 to 6 lanes
with some vegetation loss
including within AONB.
Immediate beneficial effects where the existing A2
moved away from residential areas increasing in
the longer term as planting matures to screen and
integrate the new road.
Where the new road encroaches into open
countryside the initial adverse impacts would be
reduced over time as new planting matures.
Potential for offsite planting within enclosed
agricultural landscape character area. Potential to
create habitats of value or potential for nature
conservation.
Loss of vegetation within AONB not significant as
the scheme would affect a very small part to a
limited extent and within a woodland area where
any effects would be visually contained. The Kent
Downs AONB Management Plan 2004-2009 noted
the importance of promoting non-car based
countryside recreation and the scheme would
provide an improved pedestrian and cycle
connection from Gravesend to the Shorne Wood
Country Park within the AONB.
New planting would use locally native and local
provenance species (some grown on locally from
seed and cuttings) together with more striking
planting possible based on local landscape
characteristics of fruit orchards.
New linear park created between Pepperhill and
Marling Cross on southern edge of Gravesend
along 4km of existing A2 redundant carriageway,
with extensive mounding, tree & shrub planting,
wildflower grassland and new 3.5m wide
pedestrian and cycle route.
Woodland and woodland edge planting on new earthworks where A2 passes through woodland at the east of the scheme to repair any scars created by the new earthworks and reintegrate the road with the surrounding woodland.
The existing A2 has been moved further away from residential
areas and new planting will in time screen views to traffic and
enclose the road within areas of tree and shrub planting.
The new road in association with the HS1 line has introduced
major transport infrastructure into the local landscape and as
expected the impacts initially are adverse.
Off-site planting has been provided adjacent to Cobham
services. Generally the new landscape areas have the
potential for nature conservation interest to develop.
Based on the As Built drawings and site visit it would seem
that effects on the AONB are as expected and improved
pedestrian and cycle connection is in place although the
AONB notes some consequences of new user conflict arising
which could be useful in informing design of future projects.
The LEAP confirms that locally native and local provenance
species have been used wherever possible and for all planting
close to the SSSI. It provides a named nursery from which any
replacement stock should be sourced. Areas of planting
reflecting the locally distinctive fruit orchards have been
included.
The redundant section of A2 has been landscape to provide
28 hectares of public open space including a shared footway /
cycleway and a dedicated equestrian route. As expected
extensive areas of earth mounding help screen the southern
edge of the residential areas of Gravesend from the new road.
Woodland and woodland edge planting has been provided and in time, subject to successful ongoing establishment and as it matures, planting will help soften the engineering works and merge with the surrounding woodland.
Benefits of moving the A2 for properties in Gravesend remain and have increased slightly
with establishment of screening vegetation.
New A2 alignment and HS1 combine to form a major transport corridor which intrudes into
countryside on edge of Gravesend but impact of both schemes reducing with establishment
of new tree planting on both schemes.
Off-site planting opposite Cobham services has established well. The planting will help to
reduce impacts on Thong village over time.
Effects on AONB remain as expected with no evidence of new user conflicts from consultation
or site visit. Use of cycle path in linear park anecdotally appears good.
Establishment of larger trees in fruit orchard area is patchy with many showing evidence of
die back. ‘Orchard’ effect of planting not coming through well at this stage possibly due to
wide plant spacing and poor establishment.
The public open space has established well with use of footway/cycleway appearing to be
good and evidence of informal paths being created by pedestrians and dog walkers through
the planting. Since the OYA evaluation the Cyclopark facility that had been proposed has
been built and has been open to the public for several years. Discussions with the operator
indicate that the facility is well used with extensive facilities for cyclists and others.
Planting in highway land within the woodland at east of scheme establishing satisfactorily.

Post Opening Project Evaluation
A2 Bean – Cobham (Phase 2) Five Years After Study
97
Effects on Landscape Proposed Mitigation Evaluation at OYA Evaluation at FYA
Vis
ua
l Im
pa
cts
Visual Effects
Properties on southern
edge of Gravesend mostly
beneficial effect with open
existing views from Old
Watling Street benefiting
most whereas elevated
properties at Painters Ash
Lane at Pepperhill would
have views of new road
but could not see the
existing A2.
Properties south of the
HS1 line – a few scattered
properties would have
views across railway line
to new road, No
discernible change for
distant views from
northern edge of Istead
Rise.
Properties on south side of
A2 at Marling Cross –
views opened up by
demolition of The Retreat
and new road closer than
existing A2.
Existing vegetation would be retained where
possible and new planting would in time help
screen traffic using the new road.
Use of surplus material to create gently graded
mounds up to 5m high on land retained from the
existing A2 or acquired for the purpose e.g. at
Marling Cross Junction and on land south of the
new road (Ch. 6700 to 7400) either densely
planted with woodland species for screening or
seeded as areas of species rich grass.
Planting as early as possible in the construction
period so that new planting establishes earlier and
has more screening effect.
If possible some of the affected planting in the HS1
line linear park would be lifted and reused.
Where screening of new road not required e.g. where in cutting, visual interest/variety would be provided by scattered trees interspersed with wildflower grassland.
Offsite planting by agreement to be investigated for areas of limited space e.g. north of new road east of Cobham Services where 3m mound would help screen views from open countryside and village of Thong.
Existing vegetation has been retained generally as expected
and new planting provided which is establishing satisfactorily
and should in time help screen traffic using the new road.
Traffic has been moved further away from the main residential
areas as expected.
Mounding using surplus material has been provided within the
new linear park along the route of the old A2.
Landscaping includes a variety of landscape types from
woodland, to shrubs and species rich grassland.
POPE is not aware where any of the HS1 line planting was
able to be lifted and reused.
Areas of species rich grassland and scattered trees have been
included within the landscape design.
A 2.4m high environmental barrier has been provided adjacent
to Long View on Henhurst Road. The ES noted that the new
road would be closer and views to it would be opened up by
the demolition of The Retreat. Moderate adverse visual impact
in year 1 winter was assessed reducing to neutral in year 15
when new planting had matured.
Offsite planting has been provided on a mound to the east of Cobham services.
Existing vegetation remains within the scheme boundary although no evidence of any
management operations. Some die-back of regenerating elm noted.
Most landscape planting has appeared to establish satisfactorily and helping to screen traffic
on the new A2. Mounding within new linear park continues to provide good visual screening
which, combined with noise reductions improves amenity for residents on southern edge of
Gravesend.
The environmental barrier at Long View appears to be in good condition and provides
immediate visual screening from traffic for adjacent properties. Planting adjacent to barrier
establishing satisfactorily and will screen views further so impact at year 15 expected to be
neutral. The off-site planting on the mounding at Cobham services is establishing well.
In general, planting does provide some screening to the properties. In design year the
screening by planting to receptors will be as expected.
Public Rights of Way
Some views towards the scheme from some PROWs and bridleways would be changed to cross over rather than under A2.
Bridleways currently use the subways at Hog Land
and Hever Court which were unpleasant and
intimidating. New routes would cross over A2 and
in the long term be more pleasant.
Views from footpaths not considered to be
significant change and in the long term neutral or
slight beneficial.
New routes have been provided across the new A2 as
expected. GBC notes that it would have been desirable to have
a more elegant design but in the event at GBC request bridges
were widened and a hare motif added which makes the
bridges distinctive. A rubberised surface has been used on the
bridleway bridges to provide better grip for horses.
Views from PROWs have changed and in the short term the
new A2 is more intrusive in the countryside until planting
becomes more mature. Earthworks and retained existing
vegetation both help soften the views.
New NMU routes across A2 remain with rubberised surface in good condition providing
benefits for equestrians. New planting not currently making significant change in visual
amenity but expected to do so by design year. No evidence of anti-social behaviour
associated with underpasses of old A2 but perhaps need to consider encroachment of
vegetation in long term which might make passive safety less achievable.
Post Opening Project Evaluation
A2 Bean – Cobham (Phase 2) Five Years After Study
98
Effects on Landscape Proposed Mitigation Evaluation at OYA Evaluation at FYA
Scheme structures
Widening of the road
corridor with several new
structures including road
and footbridges, gantries
and cantilever signs
(MS3), road signs,
lighting.
The existing A2 was lit with
a number of structures and
traffic signs but no gantries
or MS3s.
Scheme broadly beneficial
for residential properties
with lighting moving
further away but adverse
landscape effects as light
sources move into the
countryside away from the
urban edge.
New bridges designed to be attractive and the
structural steel components painted a common
colour to give sense of unity and identity. Distinct
from the HS1 structure so each transport corridor
has own identity.
New road may appear visually cluttered due to
gantries and signs. In time planting would help
integrate road into surroundings.
New lighting would be replacing lighting along the existing A2. Would be same type, height and number as existing although would be illuminating a wider carriageway and proposed junctions would be more extensive than existing. New lighting would be seen against existing light sources within the area, New lighting at junctions, underpasses and services areas with high pressure sodium lamps having flat glass luminaires to reduce glare.
New A2 lighting uses 15m high central reserve columns and it
is understood that 440 new lighting columns have been
provided.
23 signage and communications gantries have been provided along the route and as noted in the GBC consultation response these are open structures rather than concrete A frames, even so they are visually prominent.
No change from OYA evaluation.

Post Opening Project Evaluation
A2 Bean – Cobham (Phase 2) Five Years After Study
99
Appendix G: Predicted Impacts, Mitigation and Evaluation for Biodiversity Sub-Objective
Aspect Predicted Impact Mitigation Measures Evaluation at OYA Evaluation at FYA
Desig
nate
d S
ite
s In
tern
ati
on
al
Loss of 0.26ha of Shorne and Ashenbank SSSI on south side of road south of access track to The Lodge at eastern end of scheme due to realignment of Thong Lane and proposed new over bridge.
Indirect effect by widening on southern carriageway moving traffic 8m closer to Scalers Hill section of the SSSI with loss of buffer scrub planting from verge.
Footpath enhancement works
(improving access to Shorne
Wood Country Park) and minor
loss of species rich woodland
edge.
This section of SSSI already degraded by fly-tipping and proximity to existing road. Proposed drainage system would be sealed with no discharge within SSSI.
Low level effects to be seen in context of the HS1 works severing small part of SSSI next to A2 from bulk of SSSI south of the HS1 line – severance reduced by provision of ‘green link’ land bridge over HS1.
The generally woody/scrubby nature of the habitat expected to absorb lighting, pollution and noise to some extent so disturbance relative to existing situation likely to be low.
Additional mitigation could include active management in woodland to south of The Lodge (in agreement with landowner and NE) and erection of fencing and gate to access track along boundary of SSSI (to design agreed with NE) to reduce fly-tipping.
The LEAP notes that a programme of sympathetic management operations were undertaken during construction within the SSSI and adjoining woodland in agreement with NE and the landowner – ongoing management is the responsibility of the landowner. The LEAP notes that the SSSI boundary has not be redrawn since the works although the part of the SSSI now within the site has none of the special interest for which the SSSI was notified and it is proposed to treat the SSSI boundary as if it runs along the highway boundary.
Low noise surface has been used throughout the scheme.
It would appear that Scotland Lane which passes over the HS1 line on a bridge is the ‘green link’ referred to as it includes vegetated verges. This location was not visited by POPE.
No information received from Environment Agency or Natural England with regard to the SSSI boundary. New planting on highway earthworks along this section establishing satisfactorily. Low noise surface assumed to be operating as planned. Impacts as expected.
Desig
nate
d S
ite
s C
ou
nty
/
Reg
ion
al
Ebbsfleet SNCI would be subject to inflow of drainage from western sector of realigned and widened section of road. Already receives untreated discharge from existing A2 and drainage from the HS1 line. The scheme not expected to adversely affect existing aquatic flora, invertebrates or water vole population colonising the Ebbsfleet.
SNCI already being disturbed by the HS1 construction works.
Discharge from new road would be via balancing pond/reedbed filtration system. Water quantity /hydrological issues would be controlled through the siphon beneath Pepperhill Junction. Ecological surveys pre construction for protected species and any work subject to appropriate licences as necessary.
The LEAP notes that the Ebbsfleet SNCI located some 600m to west of western most end of scheme in Pepperhill Junction area has been unaffected by the scheme. Water voles were not found to be present in pre-scheme surveys. Pollution control measures have been included as expected as part of the highway drainage design.
No new surveys carried out as part of POPE and scheme didn’t include monitoring. Environment Agency has not provided information regarding any pollution incident. It is assumed that pollution control measures are operating as expected.
East of Marling Cross Junction route widening would decrease carriageway distance to Claylane Woods ancient woodland by a few metres with loss of verge. No significant changes expected to noise levels, air quality or light pollution in the ancient woodland.
Minor negative impact offset by use of low noise surface.
Low noise surface has been used throughout the scheme. No change since OYA evaluation.
Veg
eta
tio
n
Loss of 1.5ha established roadside vegetation and further 5.6ha of recent HS1 planting including some from within the HS1 Linear Park.
Species rich verge and associated man orchid colony east of Tollgate Junction not directly affected by the scheme
Losses compensated for by 23.6ha of new woodland or woodland edge planting and retention and management of 34.5ha existing roadside vegetation. Opportunity within proposed linear park for nature conservation areas and creation of semi-natural habitat.
Diminishing colony of man orchid to be safeguarded by management of verges,
New woodland and woodland edge planting has been provided including within the linear park (28ha). It is understood that local provenance stock has been used in the vicinity of the SSSI.
The LEAP notes that the colony of man orchid (nationally scarce and Priority Species in Kent BAP) on old A2 species rich grass cutting slope had been adversely affected by shading from scrub and had not been evident for around 3 years. Measures will be implemented to restore the value of the former calcareous grassland community in this area including control of the scrub
New woodland and woodland edge planting establishing as expected. Contractor advised that measures (scrub clearance) were taken to restore the value of the former calcareous grassland community but orchid species have not returned. No monitoring information on wildflower grassland provided to POPE. Areas of calcareous grassland noted on chalk cuttings on new A2.

Post Opening Project Evaluation
A2 Bean – Cobham (Phase 2) Five Years After Study
100
Aspect Predicted Impact Mitigation Measures Evaluation at OYA Evaluation at FYA
Scheme would bisect 4 hedges (generally unmanaged and in poor condition) also disturbed by HS1 work and subsequently replanted.
control of scrub and re-creation of chalky soil conditions on adjacent verges. Possible seed collection and distribution by hand.
Establish areas of calcareous grassland on suitable substrate.
and if the colony reappears collection and distribution of ripe seed and appropriate management.
Extensive areas of new wildflower grassland have been sown using a number of different seed mixes suitable for a variety of different locations. The LEAP notes that theses will be monitored twice per year (probably May & September) to assess establishment and inform ongoing maintenance. This monitoring information should be made available to POPE for the FYA evaluation.
Do
rmic
e
Survey ongoing and no Dormice recorded to date (April to August 2004) but expectation that they may be found in woodland at eastern end scheme due to existing records.
Loss of potential Dormouse habitat - 20% (800m2) of smaller area of Gravelhill Wood between Thong Lane slip roads and peripheral area of woodland south side A2 near Thong Lane.
Survey to continue. New areas of suitable habitat would be created as part of the scheme and to maintain links.
Any clearance of suitable Dormouse habitat to follow Best Practice to encourage any inhabiting Dormice to move to adjoining areas rather than physical translocation (i.e. coppice during winter and grubbing up roots following summer).
Recommended long term Dormouse monitoring programme to determine fluctuation and trends in Dormouse population in habitat associated with the A2.
2004/05 detailed Dormouse nest box and tube survey indicated no presence of dormice in habitat under HA control or close to the scheme boundary.
No further dormouse monitoring undertaken during FYA period. New habitat planting through woodland area establishing as expected.
Invert
eb
rate
s Minor loss of invertebrate
habitat. New habitat creation designed and managed to maximise potential benefits for a diversity of invertebrates. Some landscape areas to be left uncut over winter to encourage over-wintering of invertebrate species.
New landscape areas provided although no information available to POPE relating to invertebrates within these areas.
Considered to be as expected.
Bir
ds
Minor losses of vegetation would result in minor loss of bird breeding and feeding habitat. Slight increases in overall extent of lighting and noise.
Extensive habitat creation proposals would offset any minor habitat losses and provide medium to long term positive benefit to birds. Rough tussock grassland suitable for reptiles would also be suitable for birds of prey with 17.8ha new wildflower grassland habitat created on verges and along the redundant carriageway.
Not evaluated at OYA Rough tussock and wildflower grassland now established so effects likely to be as expected.
Bats
2004 survey indicated no roosting bat sites affected and no bat activity associated with any building to be demolished or the two subways. Low level of bat foraging or other activity within the area.
Positive effects on bats due to provision of new linear woodland planting, grassland, and a number of new balancing ponds and reed bed water treatment areas.
No presence of bat roosts in any of the buildings demolished or mature trees removed. LEAP notes that bat activity within route corridor is low. Potential bat roosts in mature trees in wooded belt at eastern end of the scheme. The H&S file notes that bat boxes have been provided on retained mature trees although the LEAP does not make reference to any bat boxes. Information on the location of bat boxes should be provided to POPE for the FYA evaluation.
Bat boxes observed at wooded section but no monitoring information provided to POPE at FYA.

Post Opening Project Evaluation
A2 Bean – Cobham (Phase 2) Five Years After Study
101
Aspect Predicted Impact Mitigation Measures Evaluation at OYA Evaluation at FYA
Ott
ers
/ W
ate
r
Vo
les
No survey for ES due to HS1 construction works. However even if water voles present in the River Ebbsfleet there would be no direct effects and no adverse indirect effects on the watercourse.
Bad
gers
One main breeding sett lost to the scheme and 3 outlier setts in sporadic use lost or disturbed depending on detailed construction methods.
Foraging area reduced for active setts south of existing A2 already disturbed by HS1 works (HS1 line fenced). Bridges over HS1 line allows territorial badger use of the wider countryside to the south.
Would be important that the scheme did not inadvertently facilitate public access to areas in which existing and artificial setts located
Sett would be closed under licence with artificial sett provided. Existing main sett already adversely affected by traveller’s community so opportunity to move colony to safer location could have some long term benefit.
Monitoring artificial sett and badger population during construction and post construction.
Provision of badger fencing and possibly badger deflectors. Not appropriate for tunnels under new offline section as land to the north significantly affected by human disturbance.
Area between new offline section and HS1 good potential badger habitat and would be enhanced and managed as ‘safe’ badger territory.
The LEAP notes that an artificial badger sett was provided and monitored during construction, and that it is occupied by a small but active badger clan. The LEAP also notes that there are other active badger setts local to the route corridor. Badger fencing has been provided at specific locations along the route and a badger tunnel installed south of Ifield Court footbridge. The LEAP mentions that badger reflectors are provided close to the Cobham (south) services. This area was not viewed as part of the POPE visit.
The LEAP notes that it will be necessary for quarterly checks of the known badger setts and artificial sett and to undertake 6 monthly monitoring of badger mitigation measures including badger reflectors, fencing and gates and this monitoring information should be made available to POPE for the FYA evaluation.
Badger fencing and tunnel at Ifield Court footbridge still in place with some evidence of use of tunnel. Artificial sett area now overgrown with new vegetation and noted as in use at handover. No monitoring information available to POPE at FYA.
Rep
tile
s/
Am
ph
ibia
ns
No losses or direct effects upon any GCN breeding ponds. GCN breeding ponds in Shorne and Ashenbank Woods SSSI within 500m of proposed A2 verge affected by the scheme and minor losses of terrestrial habitat due to footpath works over 150m from ponds.
Smooth newts in pond west of Cobham Services (south) scheme would decrease distance between A2 and pond by 8m to 20m.
Positive benefits to reptiles in the long term by provision of extensive areas of suitable reptile habitat including provision of hibernacula and basking sites.
GCN – newt exclusion fencing to be provided prior to construction, with terrestrial search and capture.
Retained habitat within HA verges and adjoining areas Shorne and Ashenbank SSSI subject to sympathetic management to improve quality of habitats for GCN to compensate for minor loss of habitat, and new habitat creation in critical territorial zone to create suitable terrestrial habitat for GCN.
Measures were put in place during construction to avoid disturbance to GCN.
The LEAP notes that pre-scheme surveys indicated low levels of reptiles within the study area (2 common lizards on verge to west Cobham services) and the LEAP notes that the majority of the scheme is currently unsuitable for habitation by reptiles. However, it is understood that ongoing management will aim to encourage development of suitable habitat. Dead wood piles will be retained in areas with no public access (e.g. in vicinity of artificial badger sett near Tollgate) or areas of existing or new woodland towards eastern end of the scheme. Specific locations of dead wood piles are not known to POPE.
Management of some grassland areas will be biennially or less frequent to encourage development of relatively undisturbed rough grass habitat.
As the drainage ponds need to remain fully functional they will be maintained in a sterile condition with contained reed growth only in Pond B.
No monitoring carried out to inform presence or absence of reptiles or amphibians. Grassland habitat appeared to be unmanaged so suitable for these species. No evidence of dead wood log piles on site visit. Drainage ponds, apart from Pond B are maintained free of reeds.