Embed Size (px)
Citation preview

Post-Retirement Risks
1. Longevity
2. Family issues
3. Health and long-term care
4. Business and public policy
5. Investment
1. Longevity Risk
• Outliving your resources
• Problems created when death occurs
• Death of a spouse– First-to-die life insurance
One Way to Plan?
• Use life expectancy to plan– Many expect to outlive average– Many underestimate what is average
• Add 5 or 10 years to the average life expectancy
• Annuitize certain assets to provide lifetime income
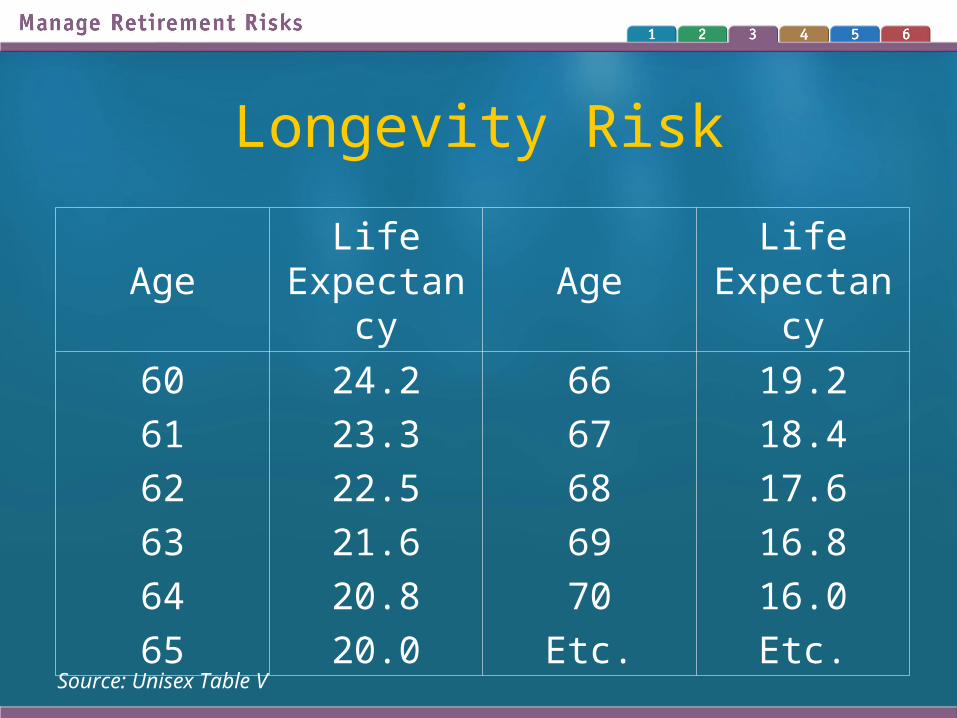
Longevity Risk
AgeLife
ExpectancyAge
Life Expectancy
60
61
62
63
64
65
24.2
23.3
22.5
21.6
20.8
20.0
66
67
68
69
70
Etc.
19.2
18.4
17.6
16.8
16.0
Etc.
Source: Unisex Table V
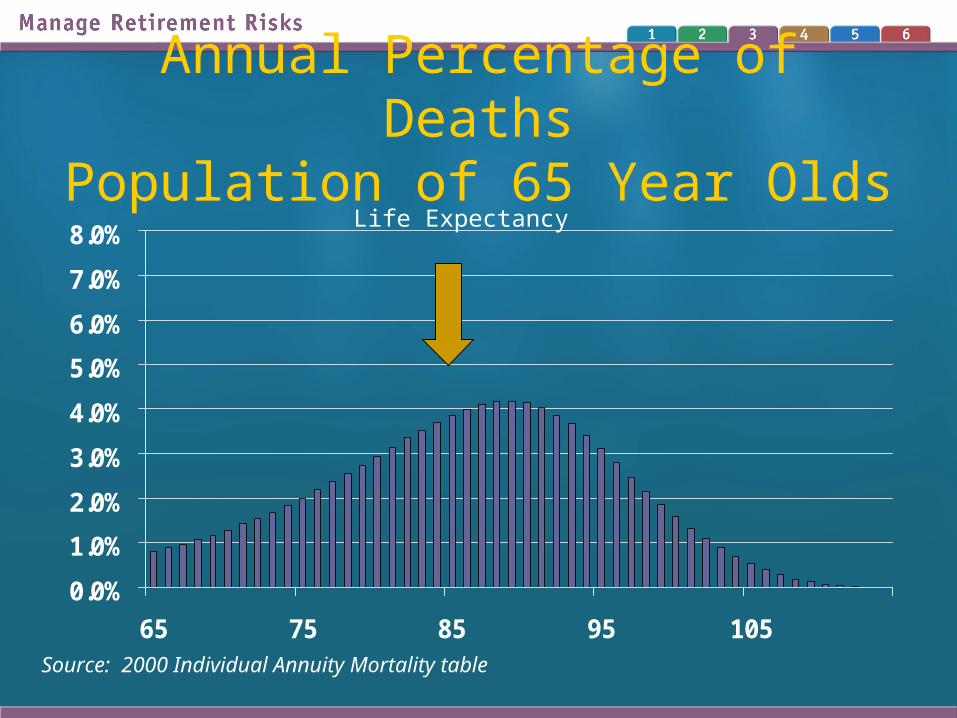
Annual Percentage of DeathsPopulation of 65 Year Olds
0.0%
1.0%
2.0%
3.0%
4.0%
5.0%
6.0%
7.0%
8.0%
65 75 85 95 105
Source: 2000 Individual Annuity Mortality table
Life Expectancy
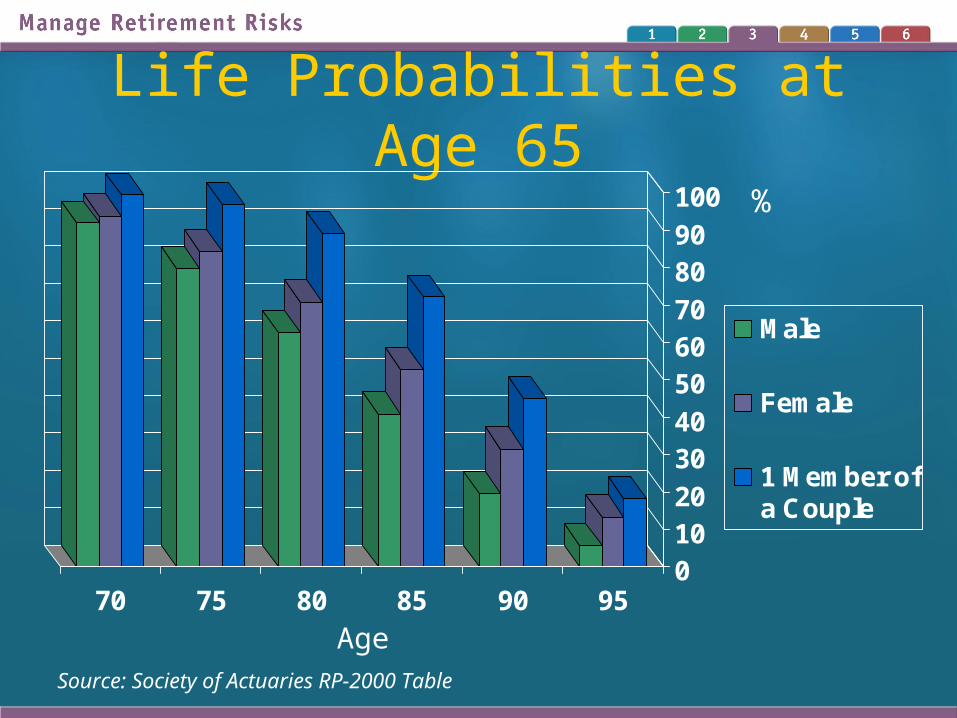
Life Probabilities at Age 65
01020
3040
506070
8090
100
70 75 80 85 90 95
Male
Female
1 Member ofa Couple
Source: Society of Actuaries RP-2000 Table
Age
%
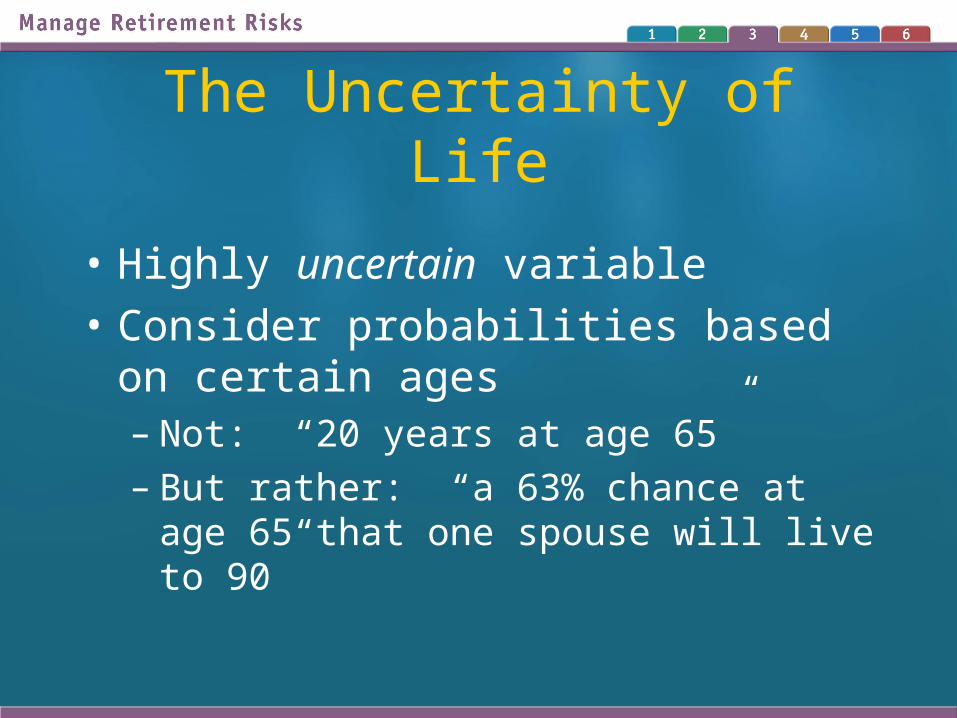
The Uncertainty of Life
• Highly uncertain variable
• Consider probabilities based on certain ages– Not: “20 years at age 65”– But rather: “a 63% chance at age 65 that
one spouse will live to 90”
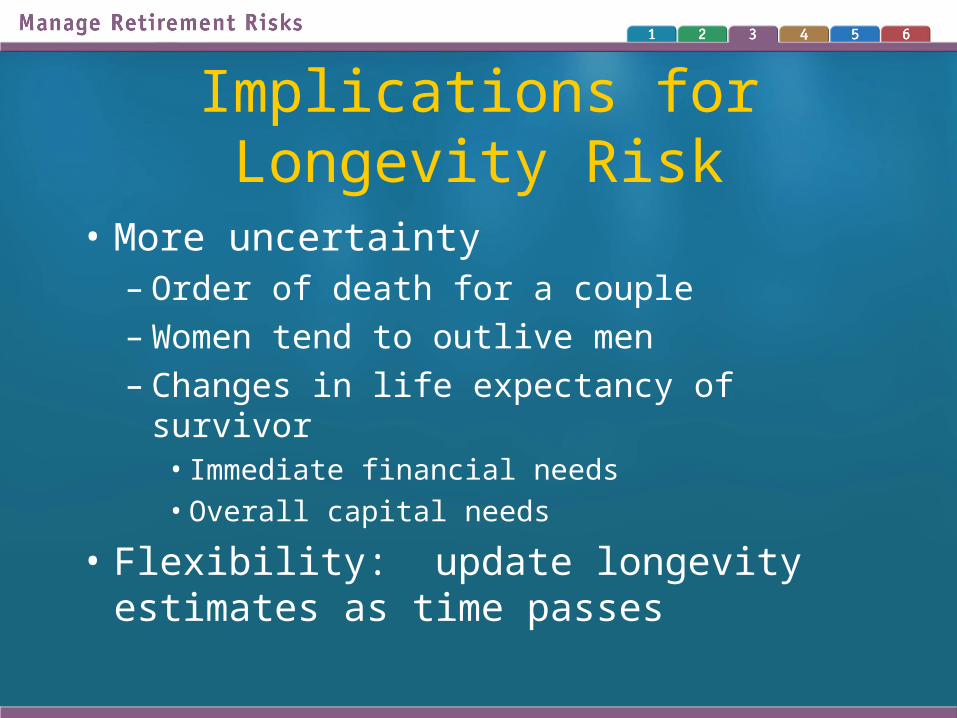
Implications for Longevity Risk
• More uncertainty– Order of death for a couple– Women tend to outlive men – Changes in life expectancy of survivor
• Immediate financial needs• Overall capital needs
• Flexibility: update longevity estimates as time passes
Managing Longevity Risk
• Social Security
• Annuities
• Reverse mortgages
2. Family Issues
• Divorce and remarriage
• Unexpected death of the retiree or an adult child with dependents
• Job loss of the retiree, a spouse, or an adult child
Other Family Matters
• Care of a grandchild or other dependent
• Elder care for retiree parents
• Paying for college while in retirement
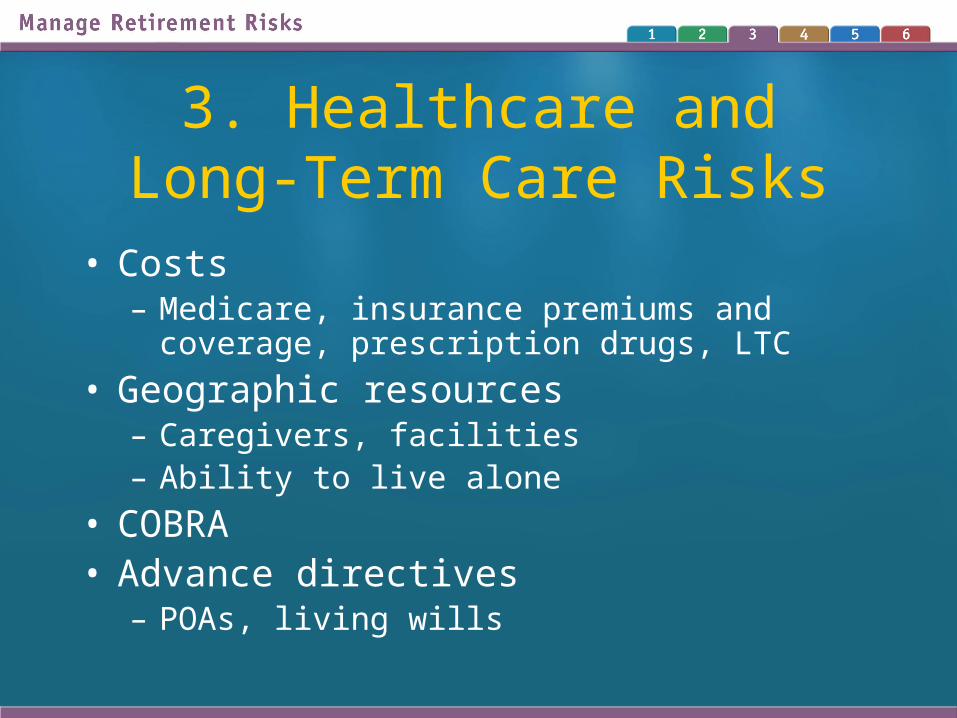
• Costs– Medicare, insurance premiums and coverage,
prescription drugs, LTC
• Geographic resources– Caregivers, facilities– Ability to live alone
• COBRA• Advance directives
– POAs, living wills
3. Healthcare and Long-Term Care Risks
LTC Needs & Issues
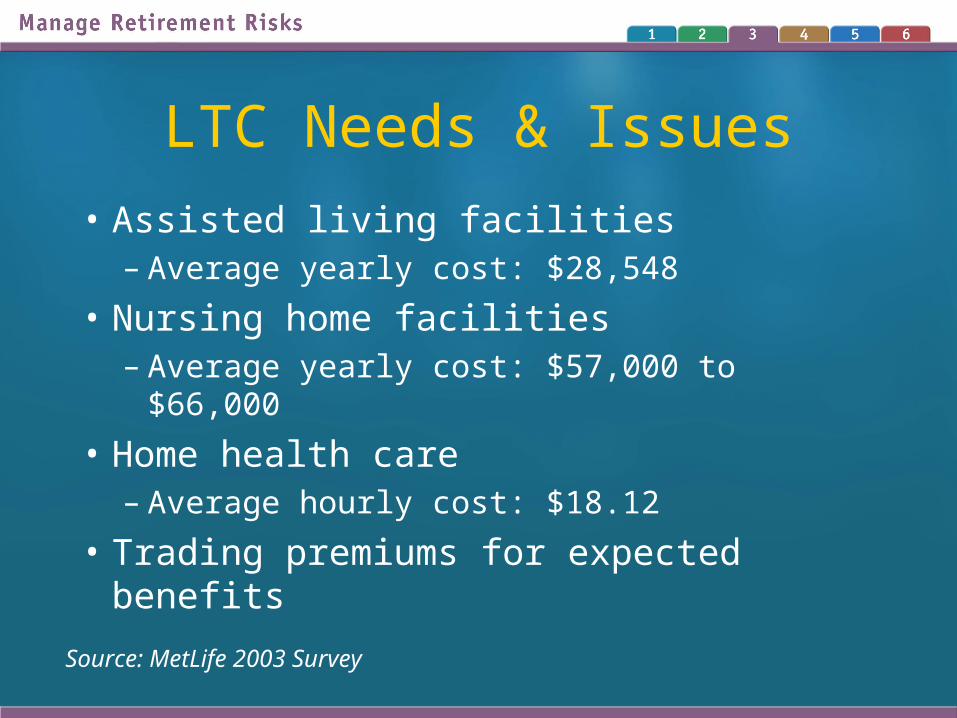
• Assisted living facilities– Average yearly cost: $28,548
• Nursing home facilities– Average yearly cost: $57,000 to $66,000
• Home health care– Average hourly cost: $18.12
• Trading premiums for expected benefits
Source: MetLife 2003 Survey
Types of LTC Insurance
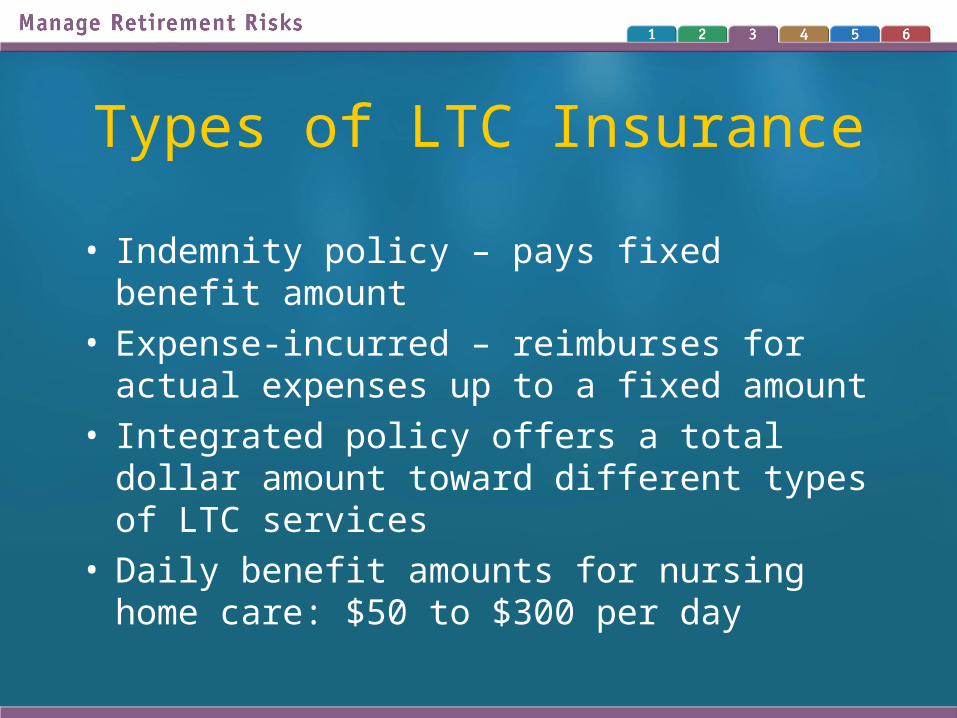
• Indemnity policy – pays fixed benefit amount• Expense-incurred – reimburses for actual
expenses up to a fixed amount• Integrated policy offers a total dollar amount
toward different types of LTC services• Daily benefit amounts for nursing home care:
$50 to $300 per day
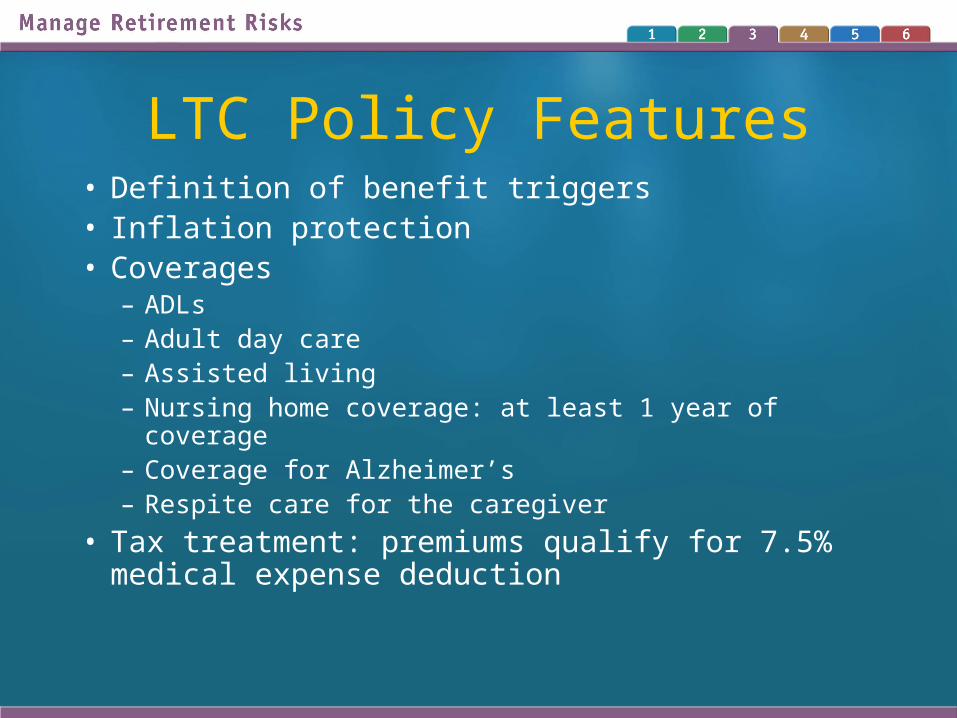
LTC Policy Features• Definition of benefit triggers• Inflation protection• Coverages
– ADLs– Adult day care– Assisted living– Nursing home coverage: at least 1 year of coverage– Coverage for Alzheimer’s – Respite care for the caregiver
• Tax treatment: premiums qualify for 7.5% medical expense deduction
Housing Needs
• Downsizing for early retirees
• Relocation issues
• Retiree expectations
• Home as an asset– Natural disasters (e.g., earthquake or flood)

4. Business & Public Policy Risk
• Employer bankruptcy• Employee benefits reduced or eliminated• Insurer solvency• Employment risk
– Physical ability– Job availability
• Diversification– Employer stock concentrations– Annuity insurer diversification
Legislative Changes
• Social Security– Later start ages for boomers
• Medicare
Tax Rate Change Risk
• Rate/rule changes– Income tax– Estate tax
• Imagine making a retirement income plan in 2000– Then EGTRRA 2001– Sunset provisions
Need to monitor proposals
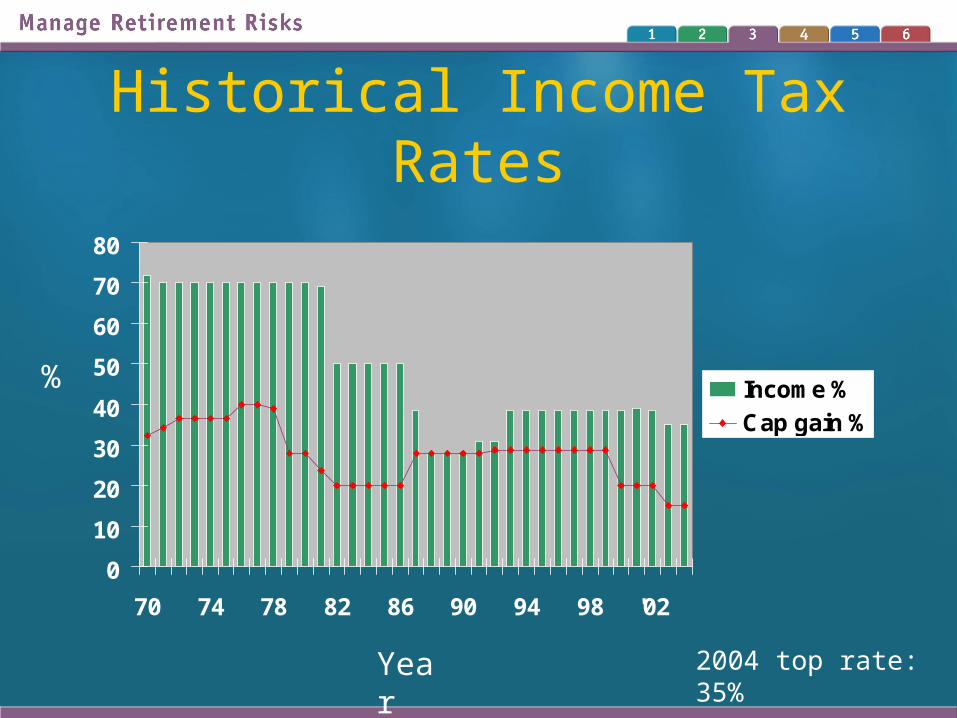
Historical Income Tax Rates
0
10
20
30
40
50
60
70
80
70 74 78 82 86 90 94 98 '02
Income %
Cap gain %
Year
%
2004 top rate: 35%
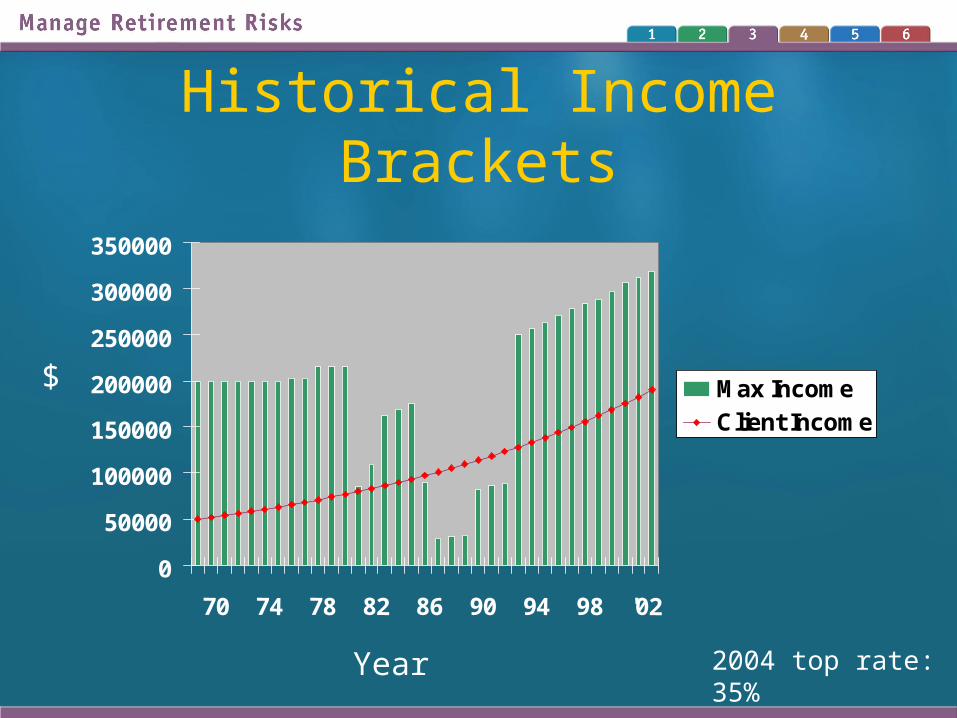
Historical Income Brackets
0
50000
100000
150000
200000
250000
300000
350000
70 74 78 82 86 90 94 98 '02
Max Income
Client Income
Year
$
2004 top rate: 35%

More Income Tax Rate Variables
• “Assumed” lower tax rate in retirement– Match the tax bracket to the retiree’s
income need
• Bracket change due to death of a spouse– Lower expenses for the surviving spouse– From married filing joint to single
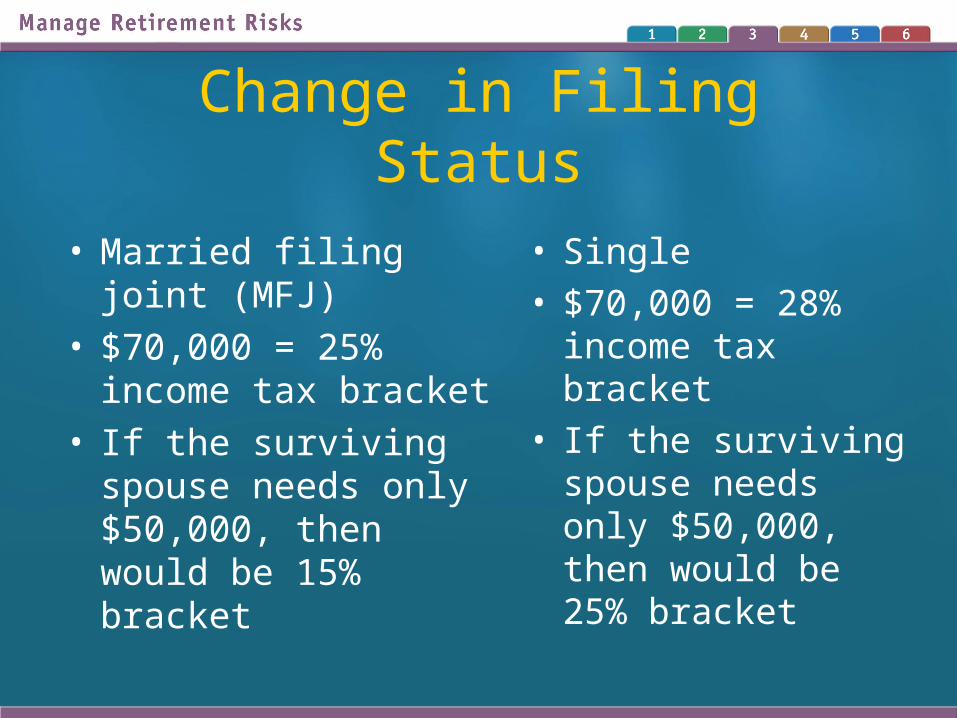
Change in Filing Status
• Married filing joint (MFJ)
• $70,000 = 25% income tax bracket
• If the surviving spouse needs only $50,000, then would be 15% bracket
• Single• $70,000 = 28%
income tax bracket• If the surviving
spouse needs only $50,000, then would be 25% bracket
The Best Tax Income
• Capital gains
• Which spends better: $1 of ordinary income or $1 of capital gain income?
• The challenge: overcoming the “I don’t want to spend principal” mindset
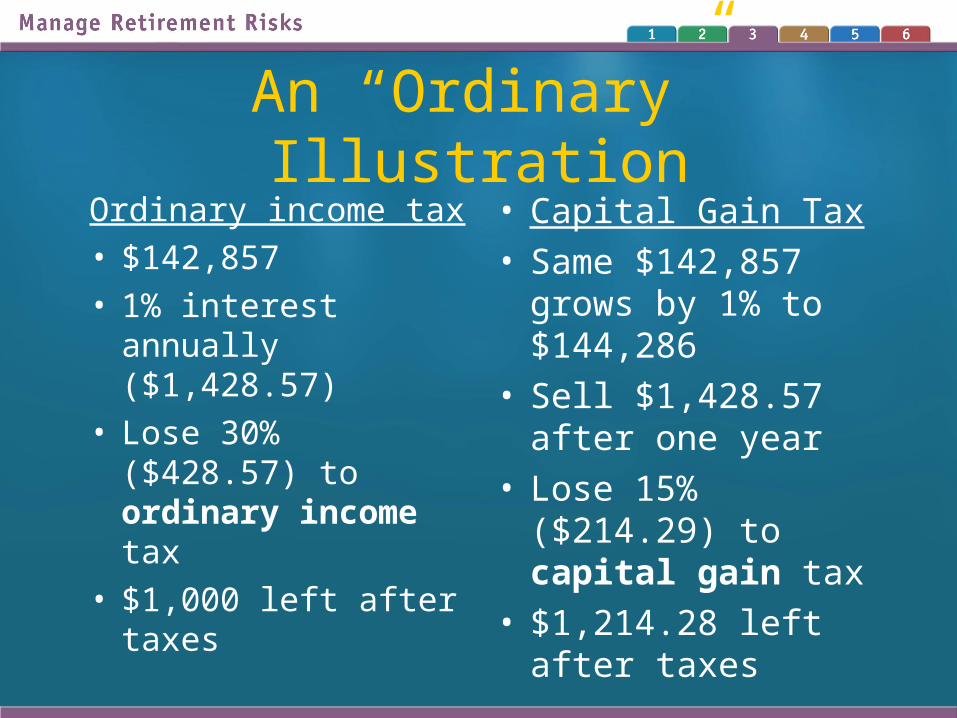
An “Ordinary” IllustrationOrdinary income tax• $142,857• 1% interest annually
($1,428.57)• Lose 30% ($428.57)
to ordinary income tax
• $1,000 left after taxes
• Capital Gain Tax• Same $142,857
grows by 1% to $144,286
• Sell $1,428.57 after one year
• Lose 15% ($214.29) to capital gain tax
• $1,214.28 left after taxes
5. Investment Risk
• Inflation risk
• Interest rate risk
• Market risk
Inflation Risk
• Not of major concern right now
• How you define it matters
• Any fixed income stream is exposed
• Interest in products with cost of living adjustments is low at present
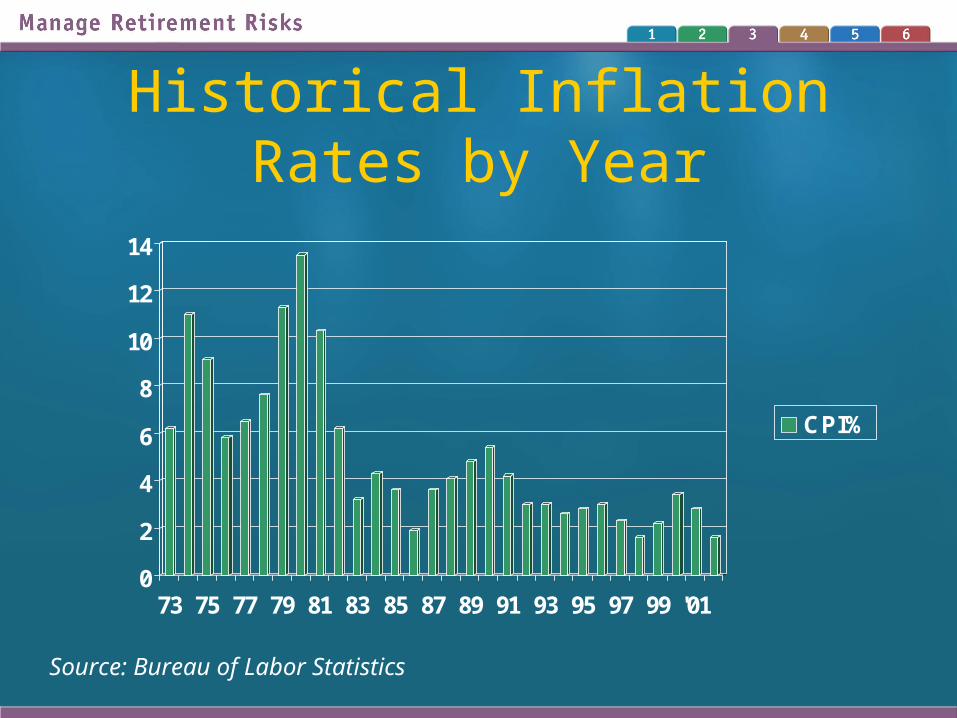
Historical Inflation Rates by Year
0
2
4
6
8
10
12
14
73 75 77 79 81 83 85 87 89 91 93 95 97 99 '01
CPI%
Source: Bureau of Labor Statistics
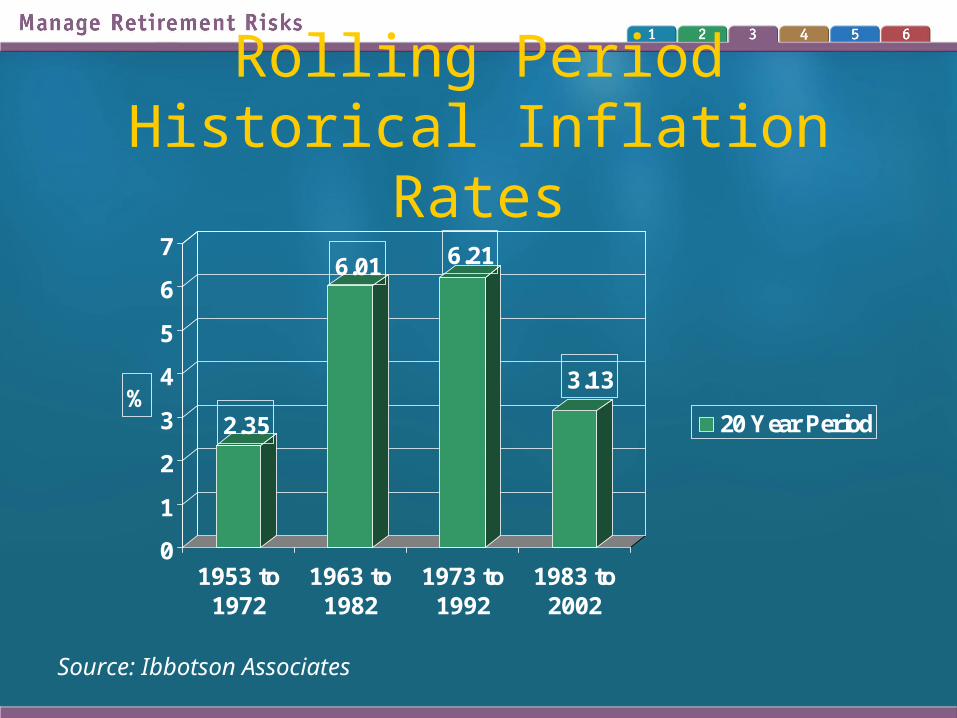
Rolling Period Historical Inflation Rates
2.35
6.01 6.21
3.13
0
1
2
3
4
5
6
7
%
1953 to1972
1963 to1982
1973 to1992
1983 to2002
20 Year Period
Source: Ibbotson Associates
Defining Inflation for a Retiree
• One rate: CPI
• By expense type– Healthcare– Food/utility– Home value– College– Others
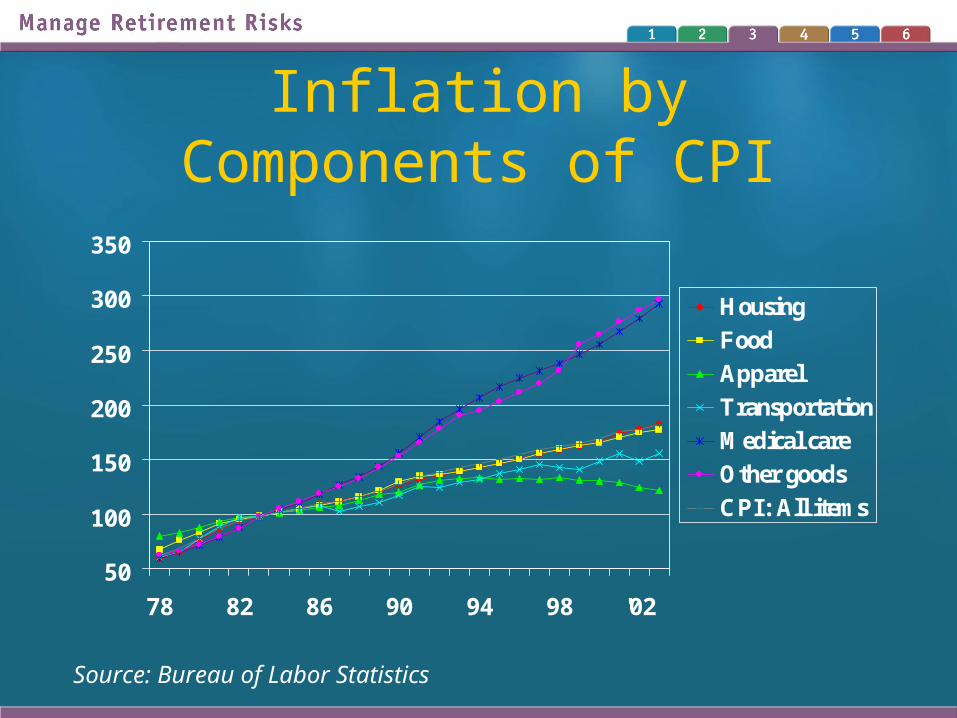
Inflation by Components of CPI
50
100
150
200
250
300
350
78 82 86 90 94 98 '02
Housing
Food
Apparel
Transportation
Medical care
Other goods
CPI: All items
Source: Bureau of Labor Statistics
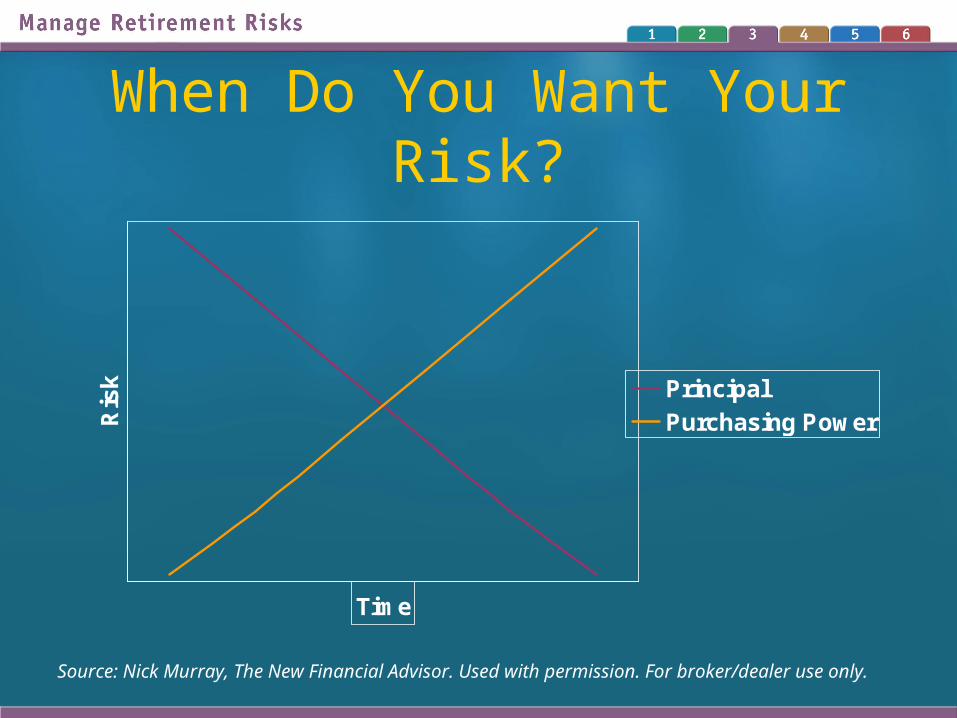
When Do You Want Your Risk?
Time
Ris
k Principal
Purchasing Power
Source: Nick Murray, The New Financial Advisor. Used with permission. For broker/dealer use only.
Strategies for Handling Inflation Risk
• Control expenses over time• Certain resources are/can be protected
– Social Security– I bonds– Variable annuities– COLA annuities– Real estate and/or REITs– Stocks
Interest Rate Risk
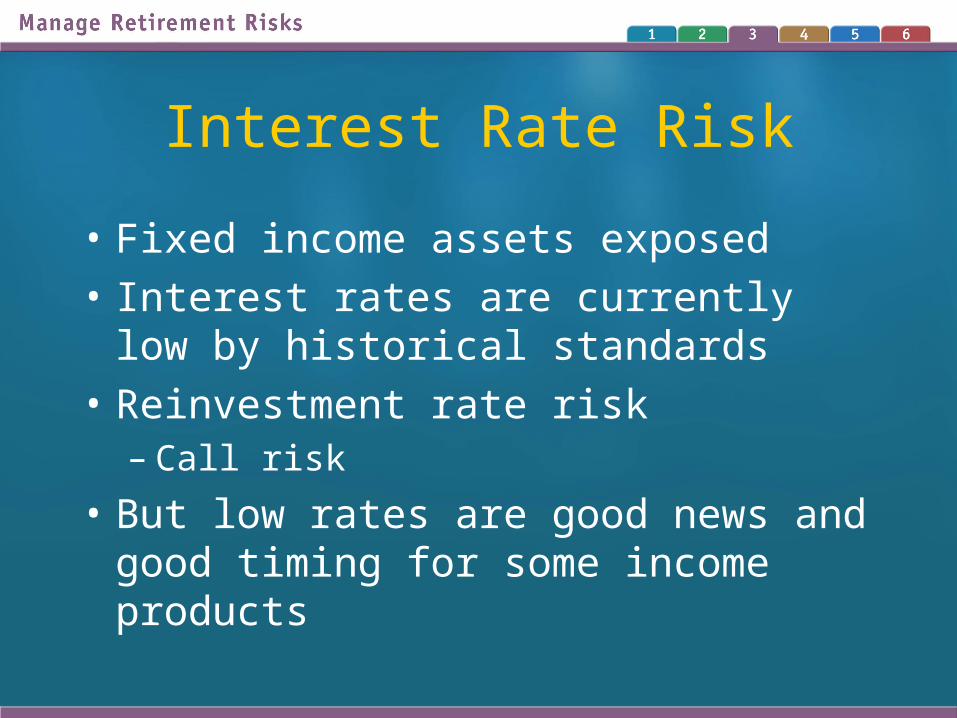
• Fixed income assets exposed
• Interest rates are currently low by historical standards
• Reinvestment rate risk– Call risk
• But low rates are good news and good timing for some income products
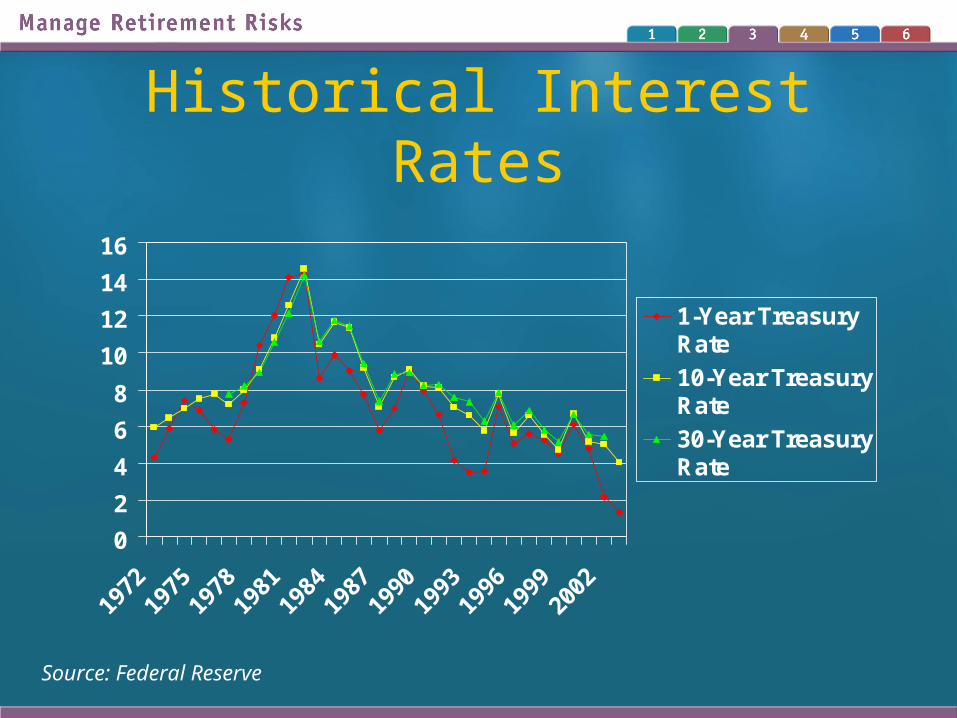
Historical Interest Rates
0
2
4
6
8
10
12
14
16
1972
1975
1978
1981
1984
1987
1990
1993
1996
1999
2002
1-Year TreasuryRate
10-Year TreasuryRate
30-Year TreasuryRate
Source: Federal Reserve
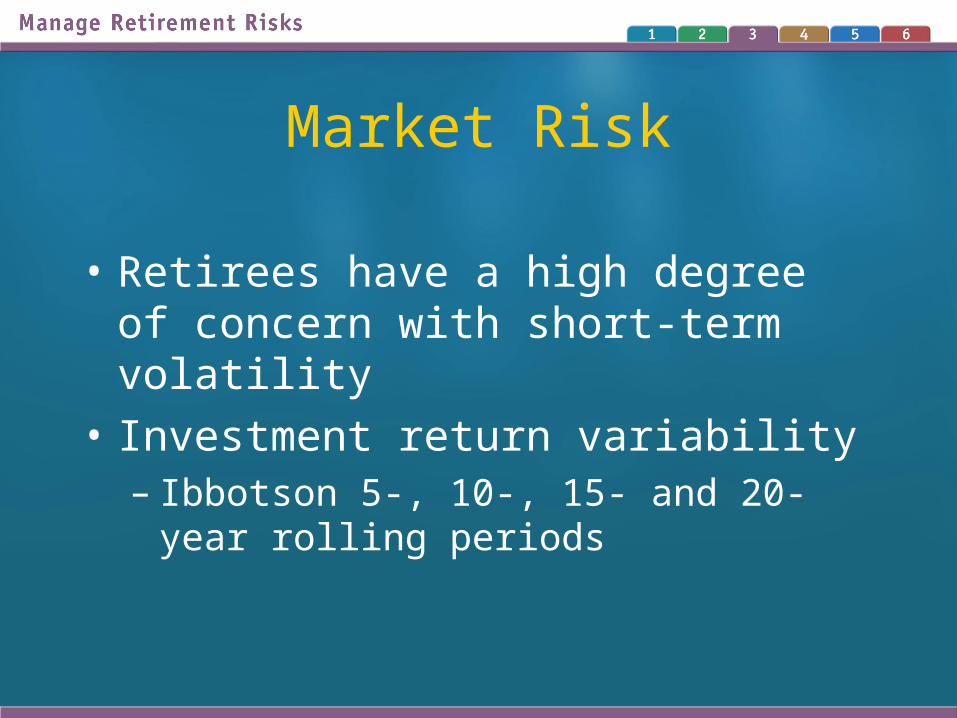
Market Risk
• Retirees have a high degree of concern with short-term volatility
• Investment return variability– Ibbotson 5-, 10-, 15- and 20-year rolling
periods
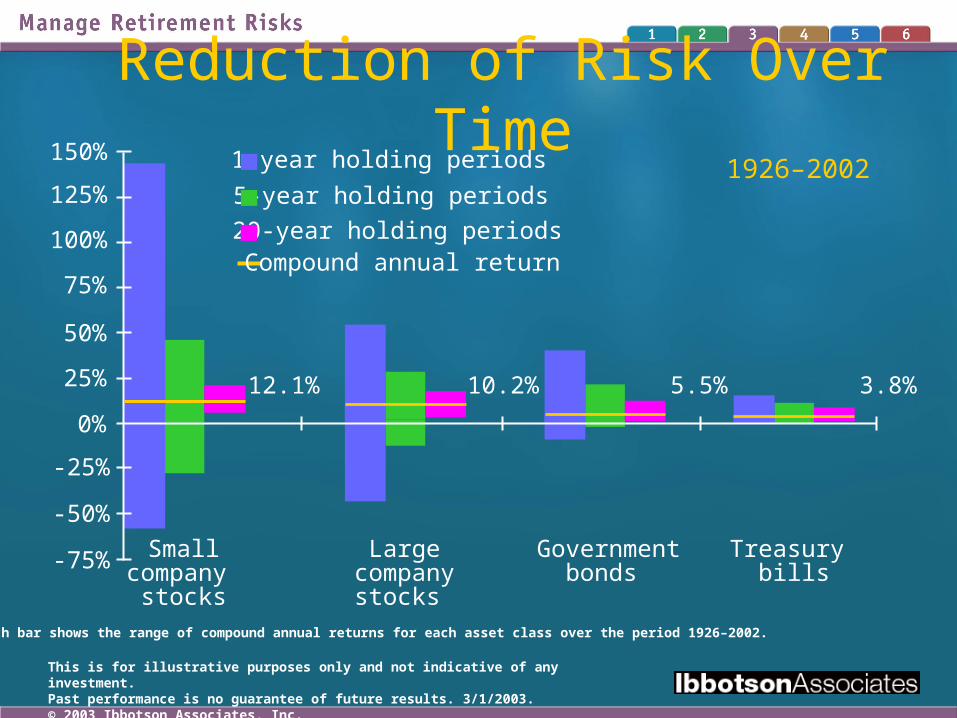
5-year holding periods
1-year holding periods
Each bar shows the range of compound annual returns for each asset class over the period 1926–2002.
Smallcompany
stocks
Largecompanystocks
Governmentbonds
Treasury bills-75%
-50%
-25%
0%
25%
50%
75%
100%
125%
150%
20-year holding periods
10.2%12.1% 5.5% 3.8%
Compound annual return
Reduction of Risk Over Time1926–2002
This is for illustrative purposes only and not indicative of any investment.Past performance is no guarantee of future results. 3/1/2003. © 2003 Ibbotson Associates, Inc.

Spot the Pattern
Market Risk Going Forward
• Future expectations– Equity risk premium
• Predictions & debates
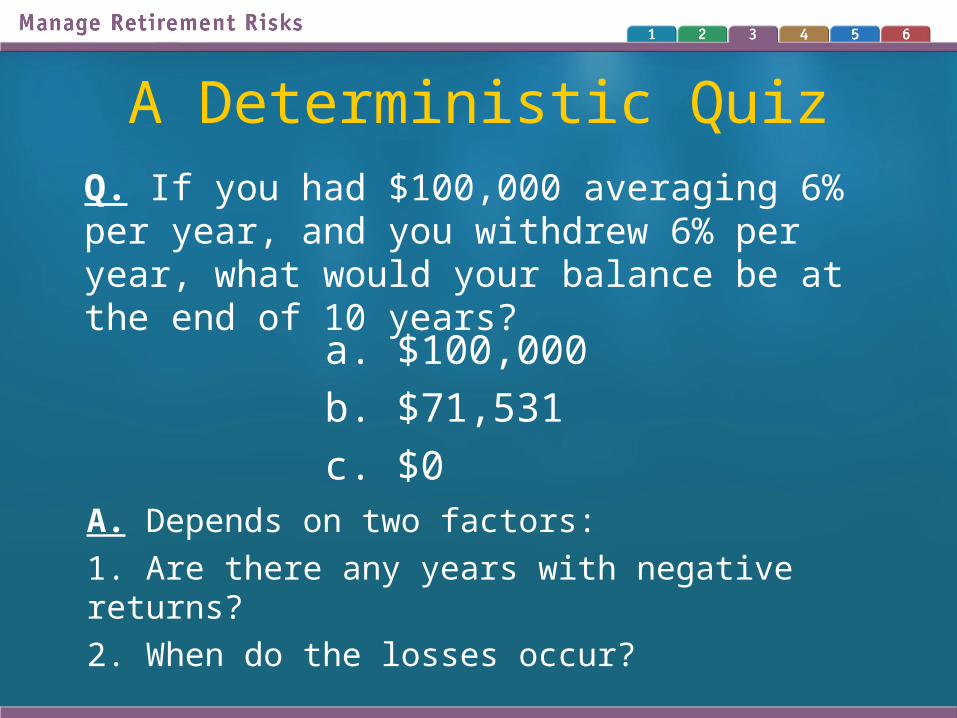
A Deterministic QuizQ. If you had $100,000 averaging 6% per year, and you withdrew 6% per year, what would your balance be at the end of 10 years?
a. $100,000
b. $71,531
c. $0
A. Depends on two factors:
1. Are there any years with negative returns?
2. When do the losses occur?
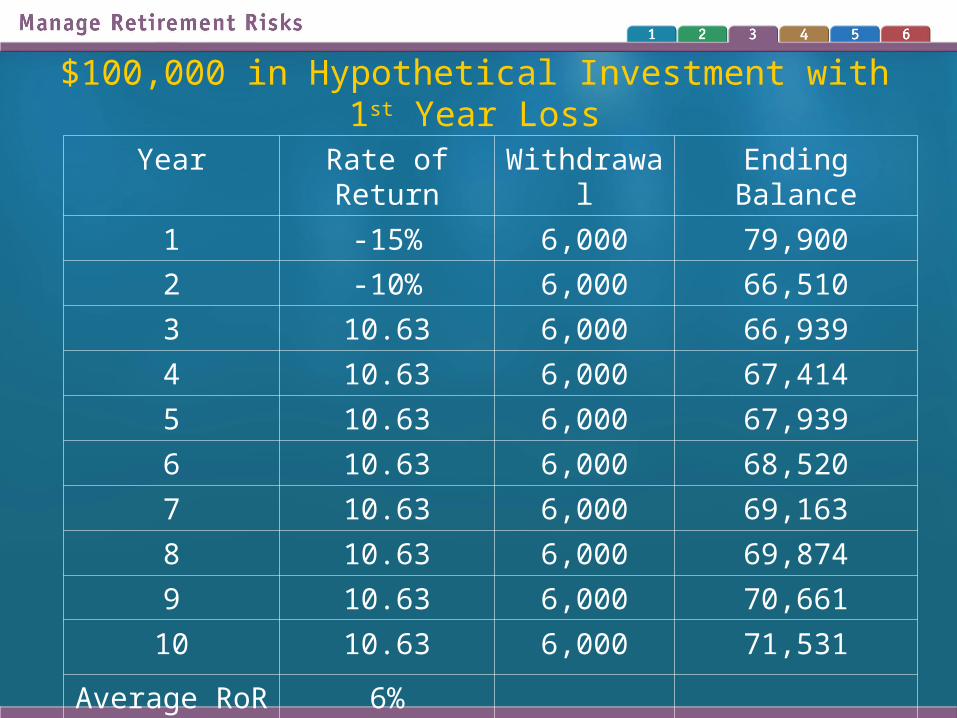
$100,000 in Hypothetical Investment with 1st Year Loss
Year Rate of Return Withdrawal Ending Balance
1 -15% 6,000 79,900
2 -10% 6,000 66,510
3 10.63 6,000 66,939
4 10.63 6,000 67,414
5 10.63 6,000 67,939
6 10.63 6,000 68,520
7 10.63 6,000 69,163
8 10.63 6,000 69,874
9 10.63 6,000 70,661
10 10.63 6,000 71,531
Average RoR 6%
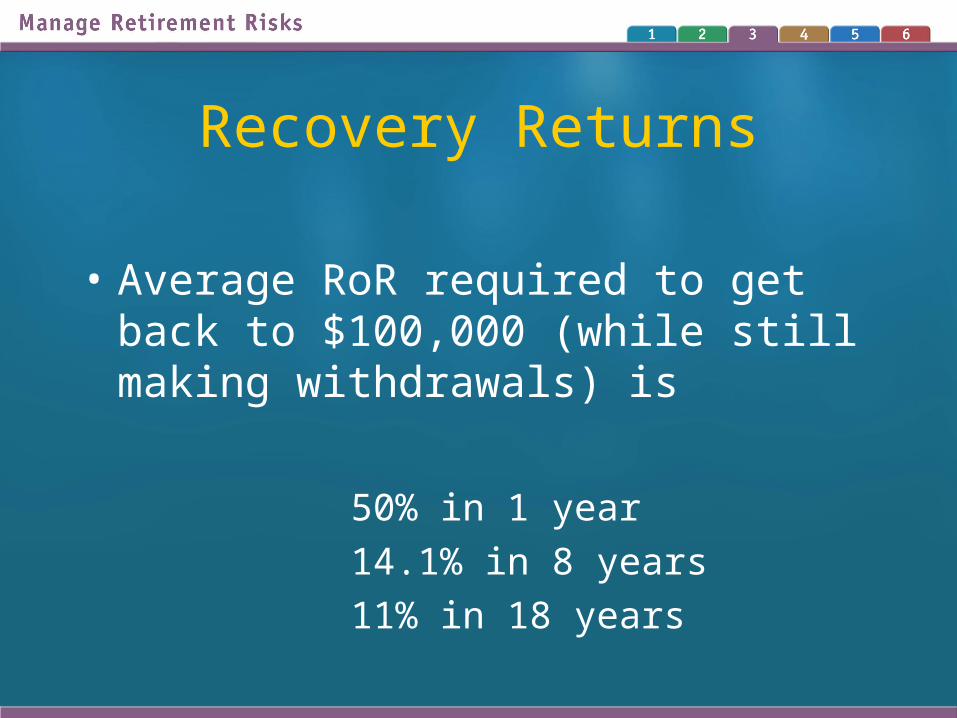
Recovery Returns
• Average RoR required to get back to $100,000 (while still making withdrawals) is
50% in 1 year
14.1% in 8 years
11% in 18 years
Lessons Learned
• Returns aren’t linear in the securities markets
• Major asset allocation changes (more price/market risk) may be necessary to make up for a bad year early in the distribution years
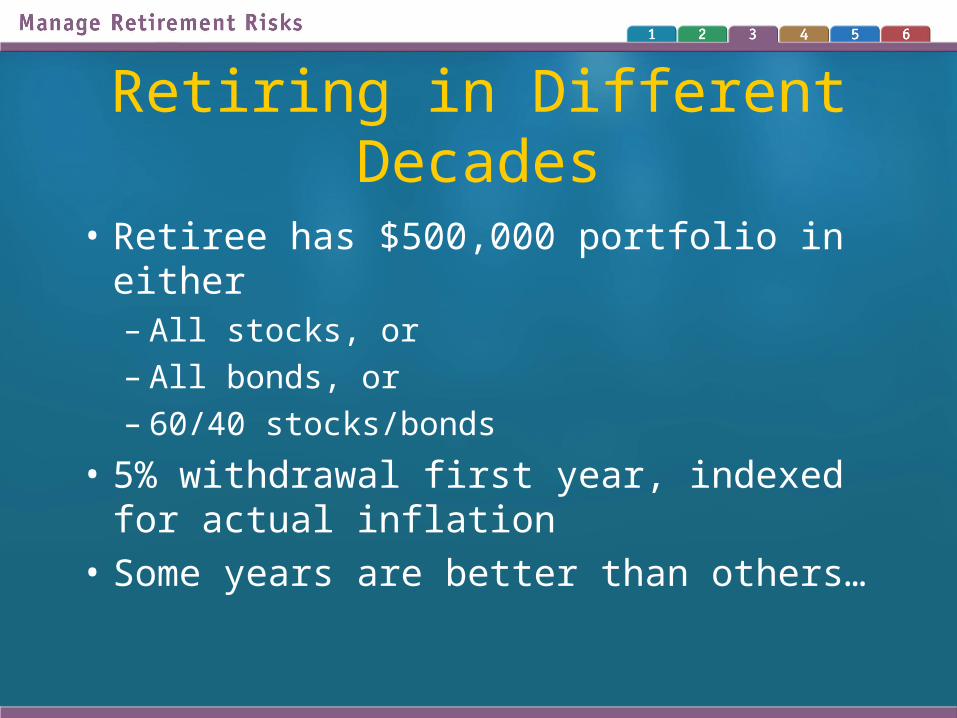
Retiring in Different Decades
• Retiree has $500,000 portfolio in either– All stocks, or– All bonds, or– 60/40 stocks/bonds
• 5% withdrawal first year, indexed for actual inflation
• Some years are better than others…
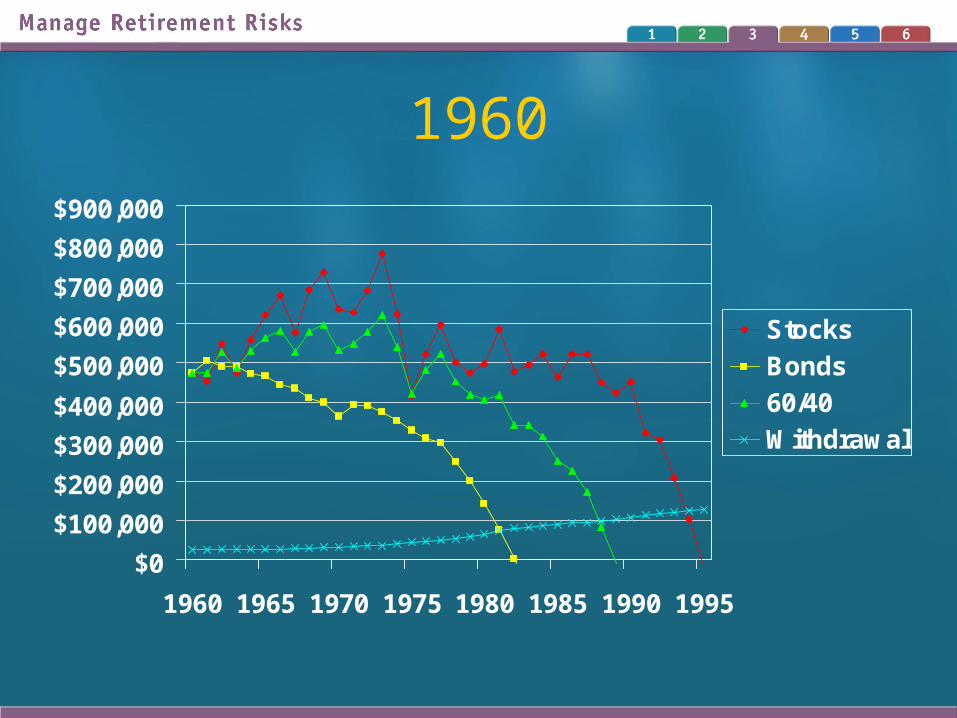
1960
$0
$100,000
$200,000
$300,000
$400,000
$500,000
$600,000
$700,000
$800,000
$900,000
1960 1965 1970 1975 1980 1985 1990 1995
Stocks
Bonds
60/40
Withdrawal
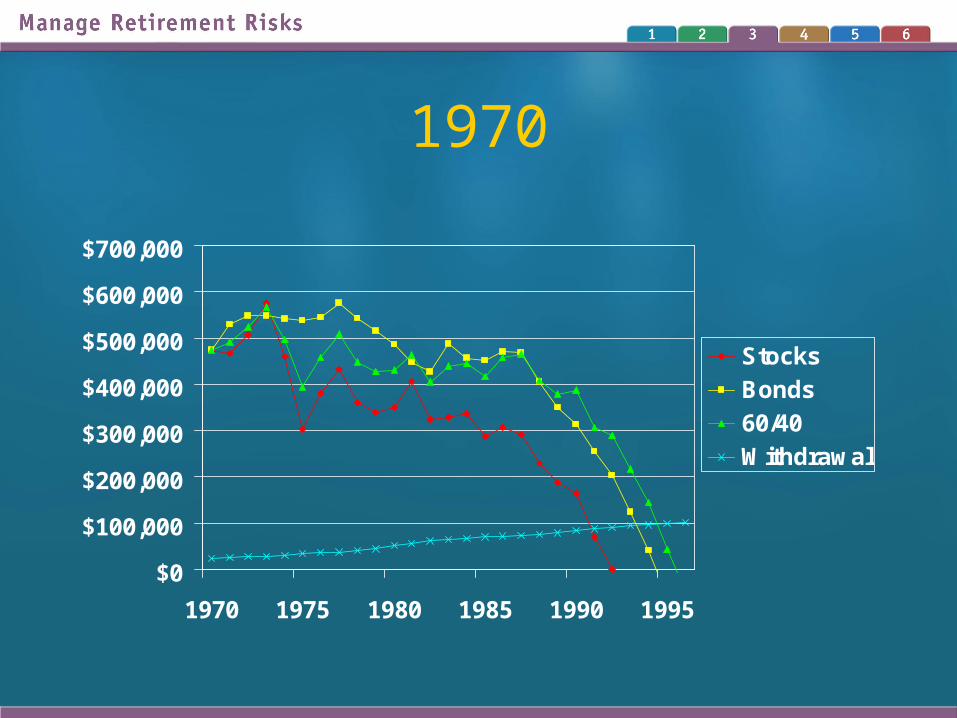
1970
$0
$100,000
$200,000
$300,000
$400,000
$500,000
$600,000
$700,000
1970 1975 1980 1985 1990 1995
Stocks
Bonds
60/40
Withdrawal
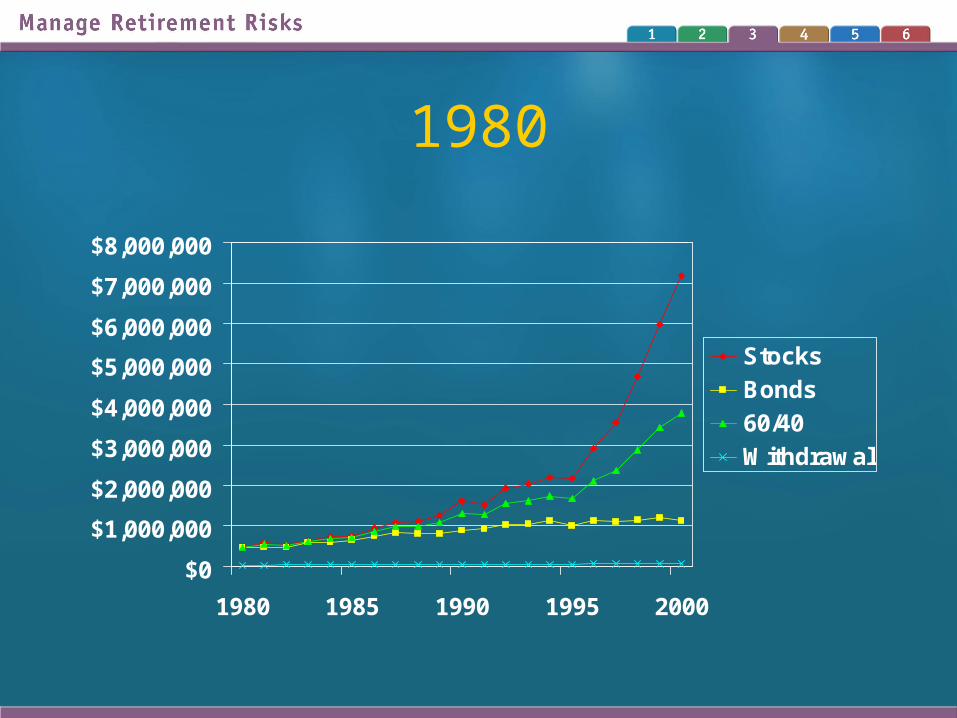
1980
$0
$1,000,000
$2,000,000
$3,000,000
$4,000,000
$5,000,000
$6,000,000
$7,000,000
$8,000,000
1980 1985 1990 1995 2000
Stocks
Bonds
60/40
Withdrawal
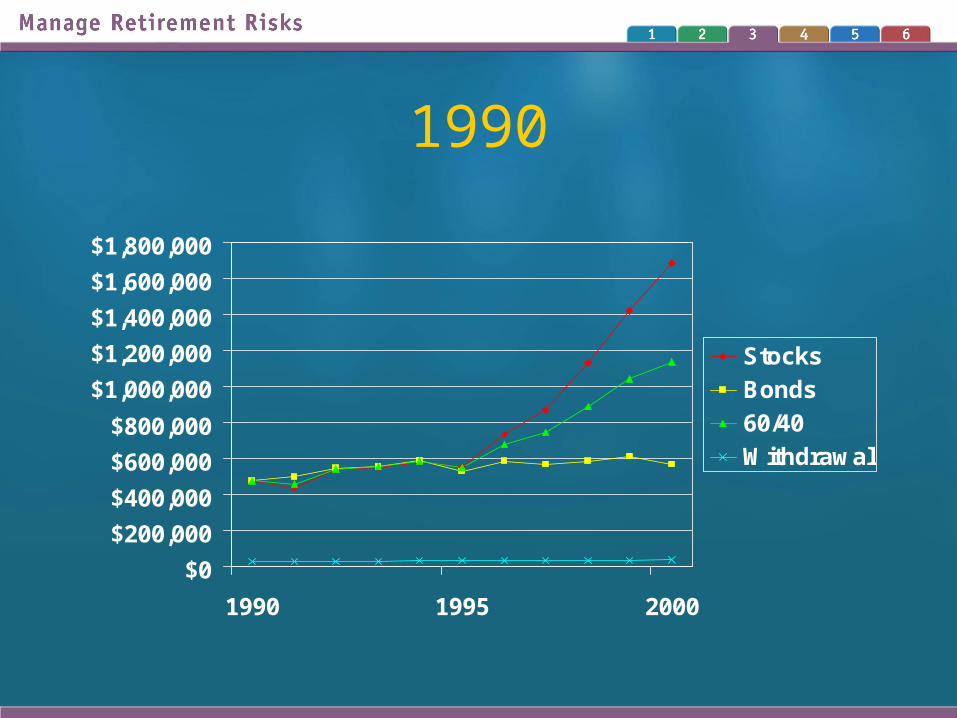
1990
$0
$200,000
$400,000
$600,000
$800,000
$1,000,000
$1,200,000
$1,400,000
$1,600,000
$1,800,000
1990 1995 2000
Stocks
Bonds
60/40
Withdrawal
More Lessons Learned
• The sequence of returns matters—a lot!
• Linear assumptions (x% per year for 25 years) are unrealistic and dangerous to a portfolio’s health
• We can know the past with precision, but the future is unknown
• Monte Carlo simulations

Asset Allocation
• The accumulation years are different from the distribution years.– Conventional wisdom: go more conservative– For a “die broke” mentality, go conservative– For an inheritance mentality, go more
aggressive• More time• Multigenerational investment policy
Investor Characteristics
• Age
• Investment experience
• Risk tolerance
• Personal financial factors
• Risk capacity

Managing Portfolio Risk
• Rebalancing
• Diversification
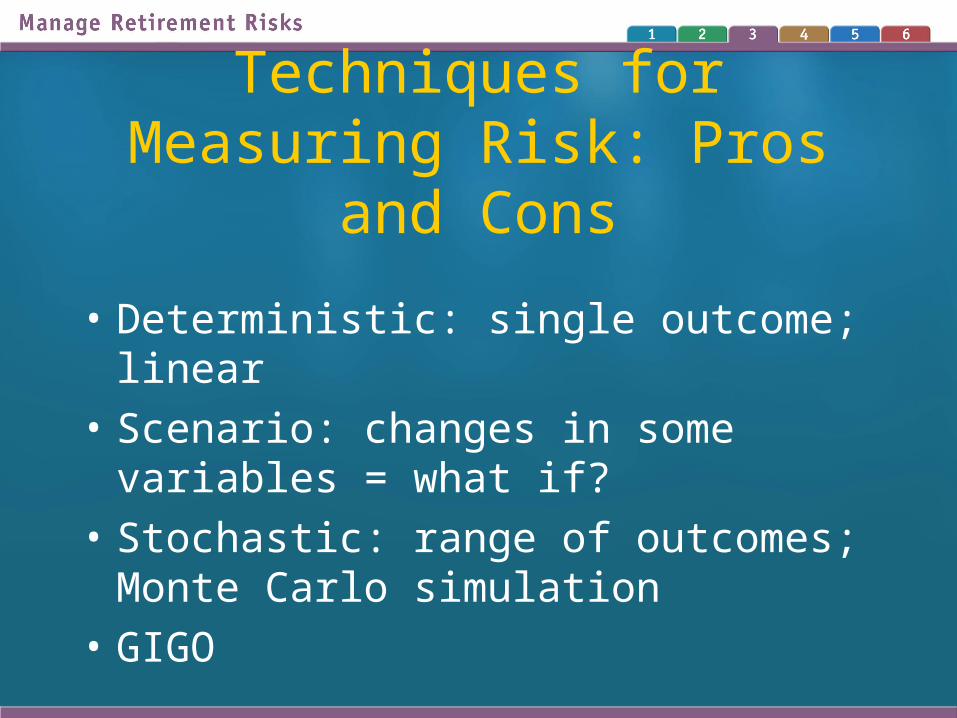
Techniques for Measuring Risk: Pros and Cons
• Deterministic: single outcome; linear
• Scenario: changes in some variables = what if?
• Stochastic: range of outcomes; Monte Carlo simulation
• GIGO

Monte Carlo Basics
• Considers multiple risk variables at one time– Returns, volatility, correlation, return order,
longevity– Roll the dice
• Produces portfolio values and probabilities
• Monte Carlo illustrated: The iMulator game (courtesy of Financeware)

The iMulator Game• Get into small groups of six• One person is the scorekeeper, aka the financial
advisor, who uses the Scorecard• Another person is the mortician, who uses the
Mortality Table• Another person is the market, who uses the Growth
Factor Table• Two people are the dice; you will be choosing
numbers between 1 and 6 randomly and independently
• One person is the client!
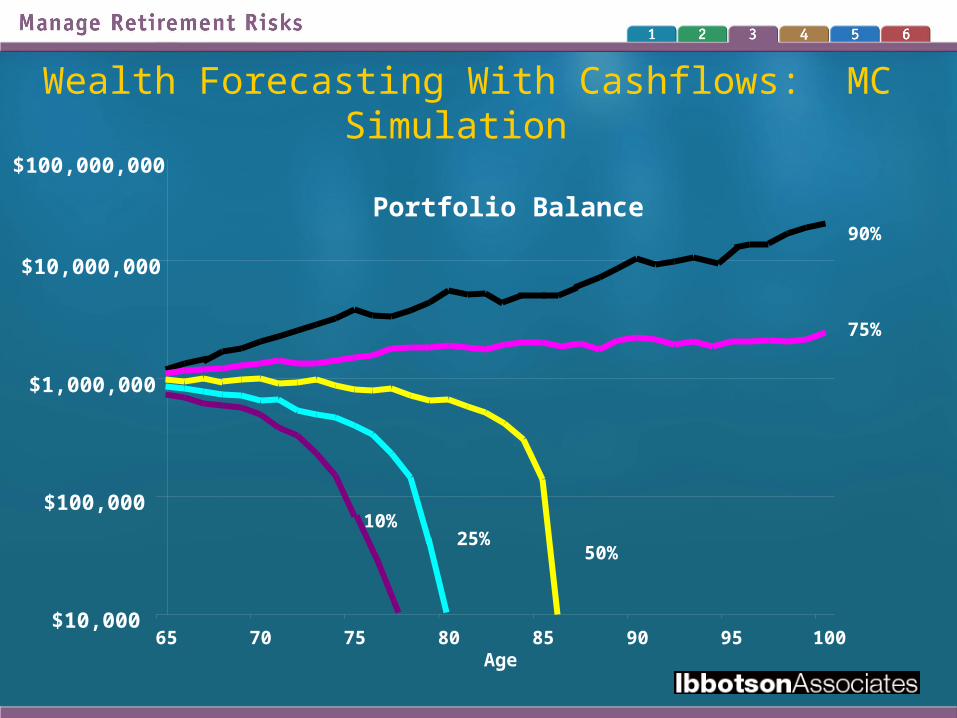
Wealth Forecasting With Cashflows: MC Simulation
Portfolio Balance
$10,000
$100,000
$1,000,000
$10,000,000
$100,000,000
65 70 75 80 85 90 95 100Age
75%
90%
50%25%
10%
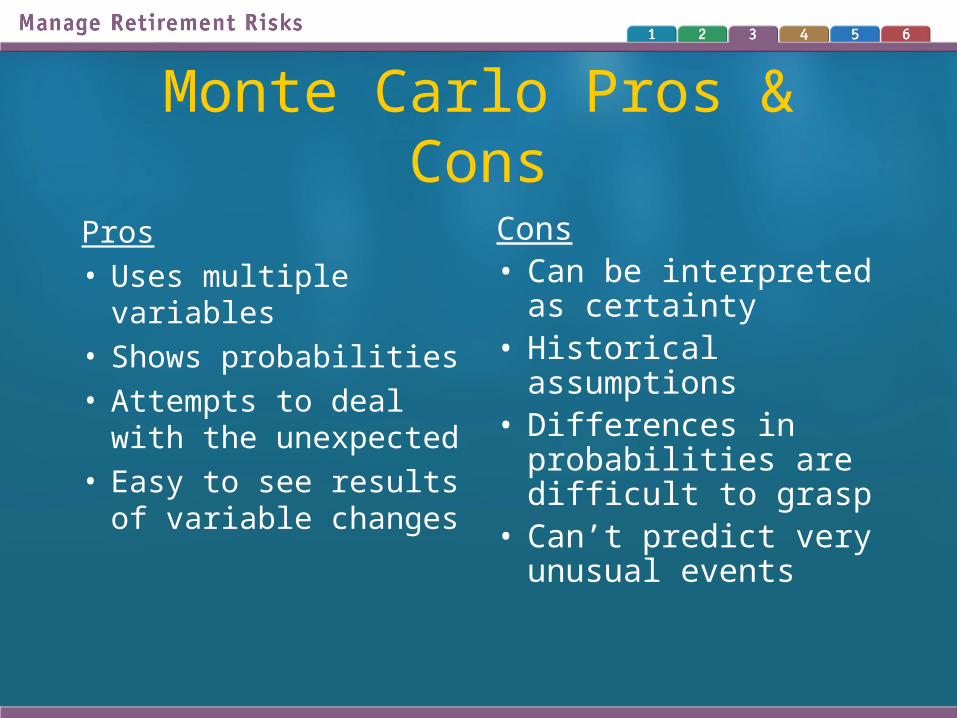
Monte Carlo Pros & Cons
Pros• Uses multiple
variables• Shows probabilities• Attempts to deal
with the unexpected• Easy to see results
of variable changes
Cons• Can be interpreted
as certainty• Historical
assumptions• Differences in
probabilities are difficult to grasp
• Can’t predict very unusual events
![[hal-00768526, v1] Partial Splitting of Longevity and ...docs.isfa.fr/labo/2013.16.pdf · Partial splitting of longevity and financial risks : the longevity nominal choosing swaptions](https://img.pdfslide.net/doc/110x75/5abb9d687f8b9a567c8cd4f3/hal-00768526-v1-partial-splitting-of-longevity-and-docsisfafrlabo201316pdfpartial.jpg)