Embed Size (px)
Citation preview
Post-School Education and Training and National Development
1
Commissioner Malegapuru Makgoba
Evidence to the Commission of Inquiry into Higher
Education and Training
3 October 2016
Overview
1. Policy Framework: The NDP & PSET
2. PSET targets in the NDP: Strategic Levers
3. Issues of costing & financing
Policy Framework –The NDP & PSET
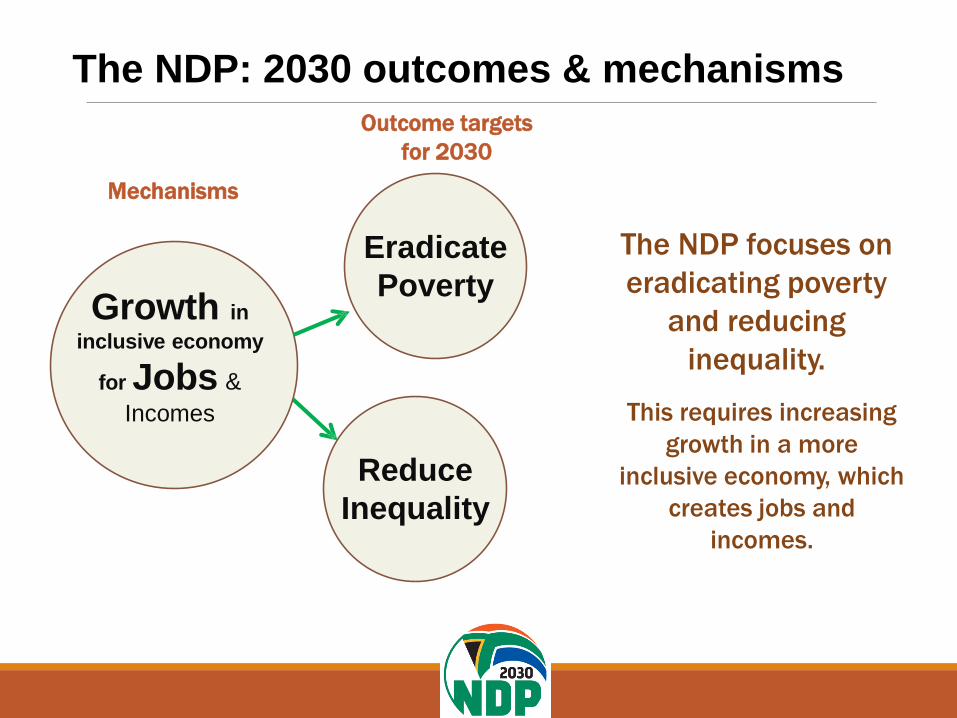
The NDP: 2030 outcomes & mechanisms
The NDP focuses on
eradicating poverty
and reducing
inequality.
This requires increasing
growth in a more
inclusive economy, which
creates jobs and
incomes.
Growth in
inclusive economy
for Jobs &
Incomes
Reduce
Inequality
Eradicate
Poverty
Outcome targets
for 2030
Mechanisms
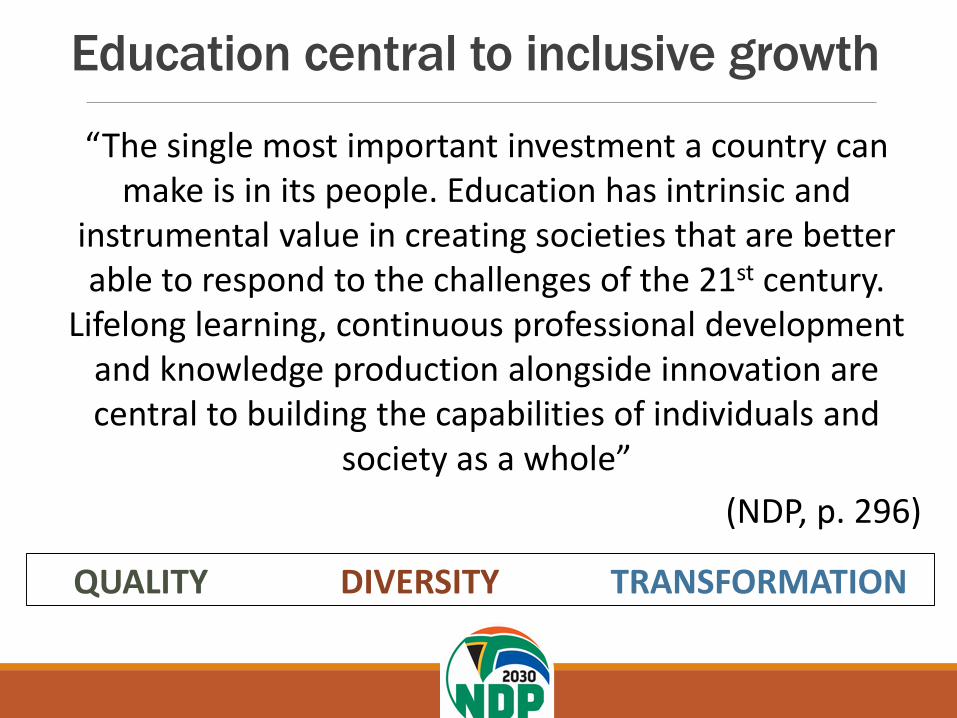
Education central to inclusive growth
“The single most important investment a country can make is in its people. Education has intrinsic and
instrumental value in creating societies that are better able to respond to the challenges of the 21st century.
Lifelong learning, continuous professional development and knowledge production alongside innovation are central to building the capabilities of individuals and
society as a whole”
(NDP, p. 296)
QUALITY DIVERSITY TRANSFORMATION
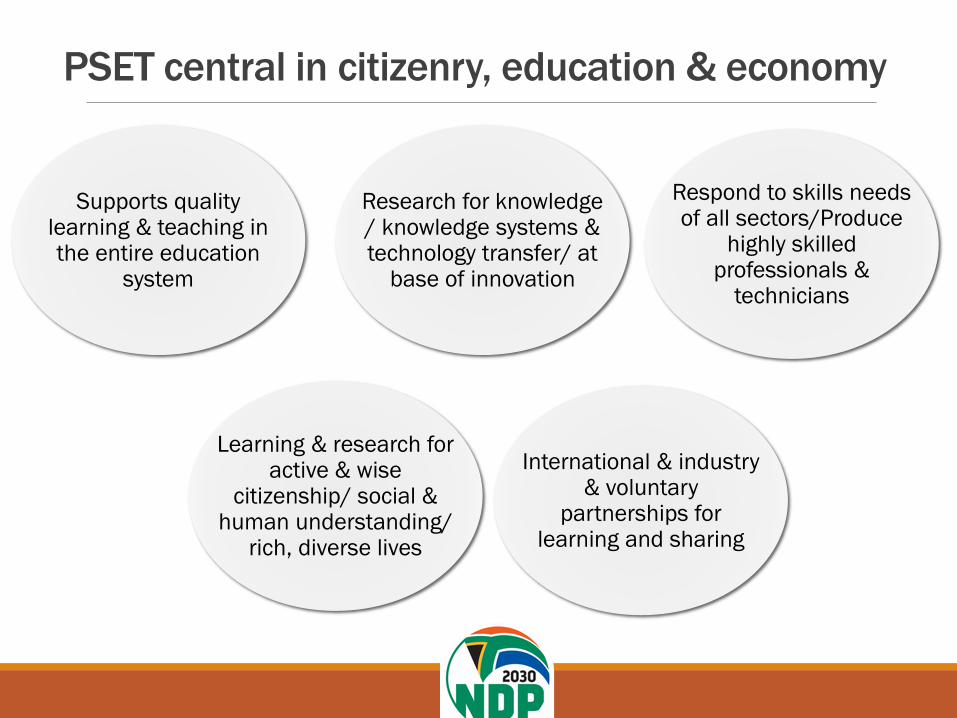
PSET central in citizenry, education & economy
Respond to skills needs of all sectors/Produce
highly skilled professionals &
technicians
Research for knowledge / knowledge systems & technology transfer/ at
base of innovation
Supports quality learning & teaching in the entire education
system
International & industry & voluntary
partnerships for learning and sharing
Learning & research for active & wise
citizenship/ social & human understanding/
rich, diverse lives

Underlying Policy Documents1. Education White Paper 3: A programme for the
Transformation of Higher Education, 1997.
2. White Paper on Science & Technology – Preparing for the
21st Century, 1996.
3. Report of the National Working Group – Restructuring of
the Higher Education System in South Africa, 2002
4. Ministerial Review Committee on Science, Technology &
Innovation Landscape in South Africa, 2012
5. Green Paper on Post-School Education and Training, 2012
(Now the White Paper, 2014)
6. Global Trends in Higher Education (University rankings;
BRICS trends; World Bank studies on world class
universities)
PSET Targets in the NDP - The Strategic Levers
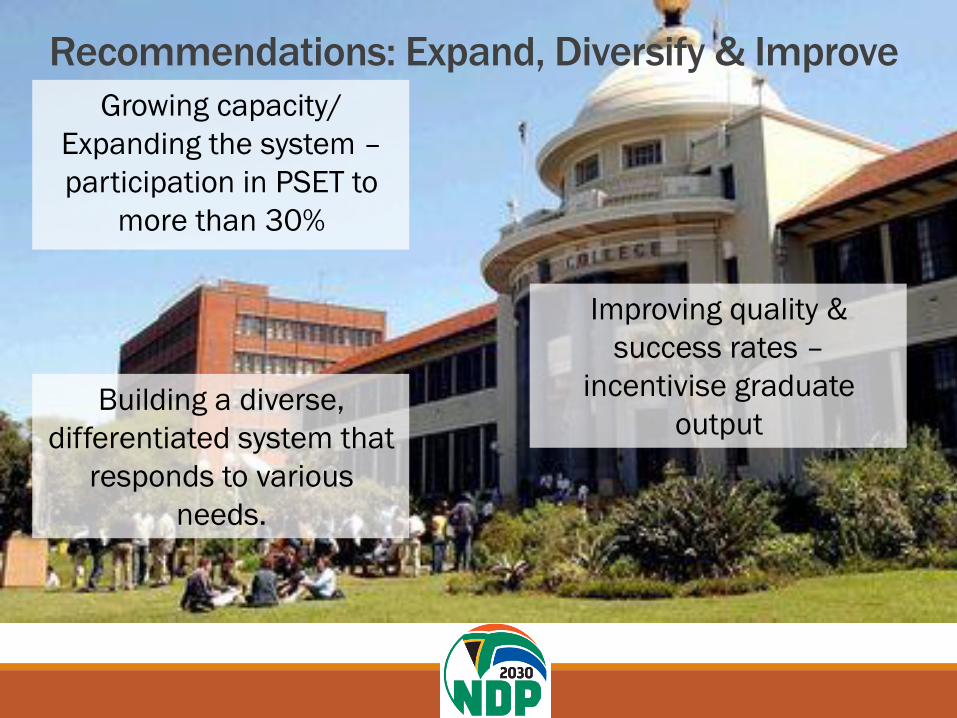
Recommendations: Expand, Diversify & Improve
Growing capacity/
Expanding the system –
participation in PSET to
more than 30%
Improving quality &
success rates –
incentivise graduate
outputBuilding a diverse,
differentiated system that
responds to various
needs.
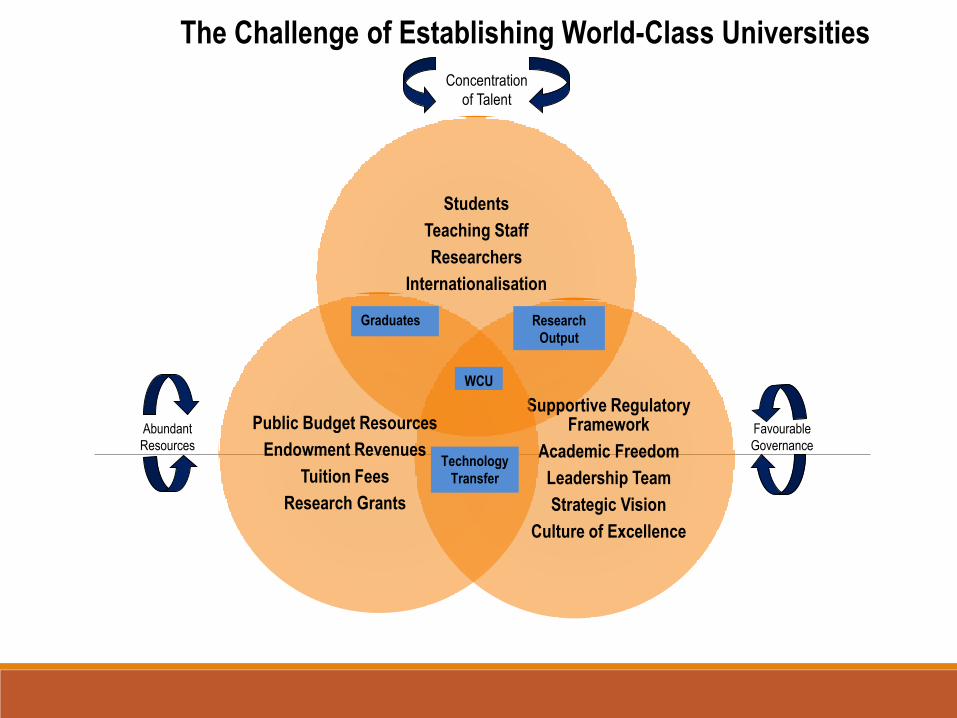
Students
Teaching Staff
Researchers
Internationalisation
Supportive Regulatory Framework
Academic Freedom
Leadership Team
Strategic Vision
Culture of Excellence
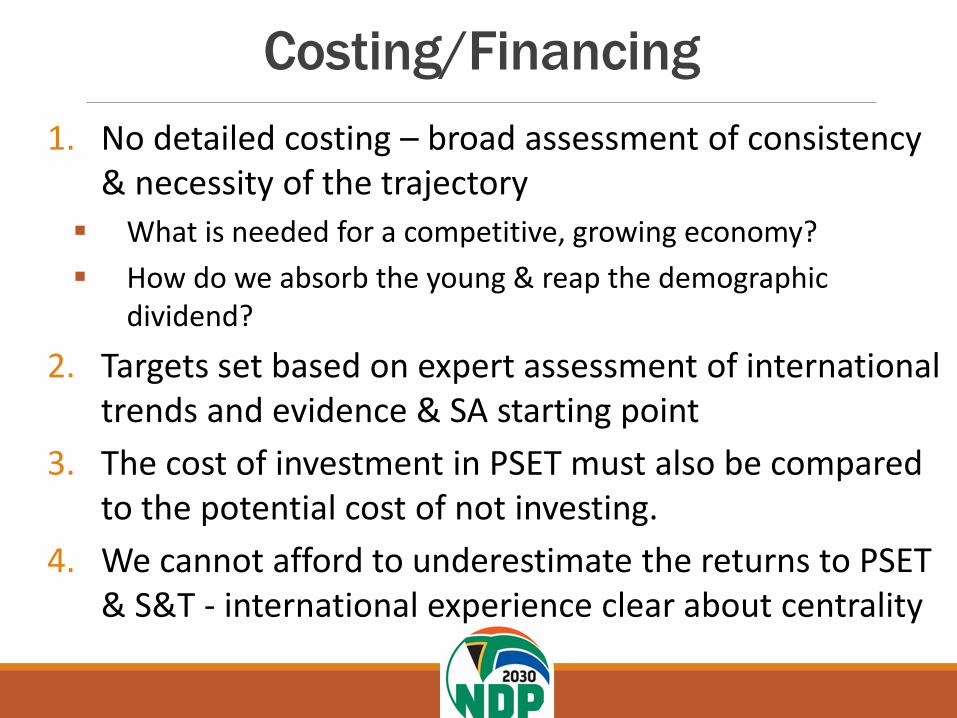
Public Budget Resources
Endowment Revenues
Tuition Fees
Research Grants
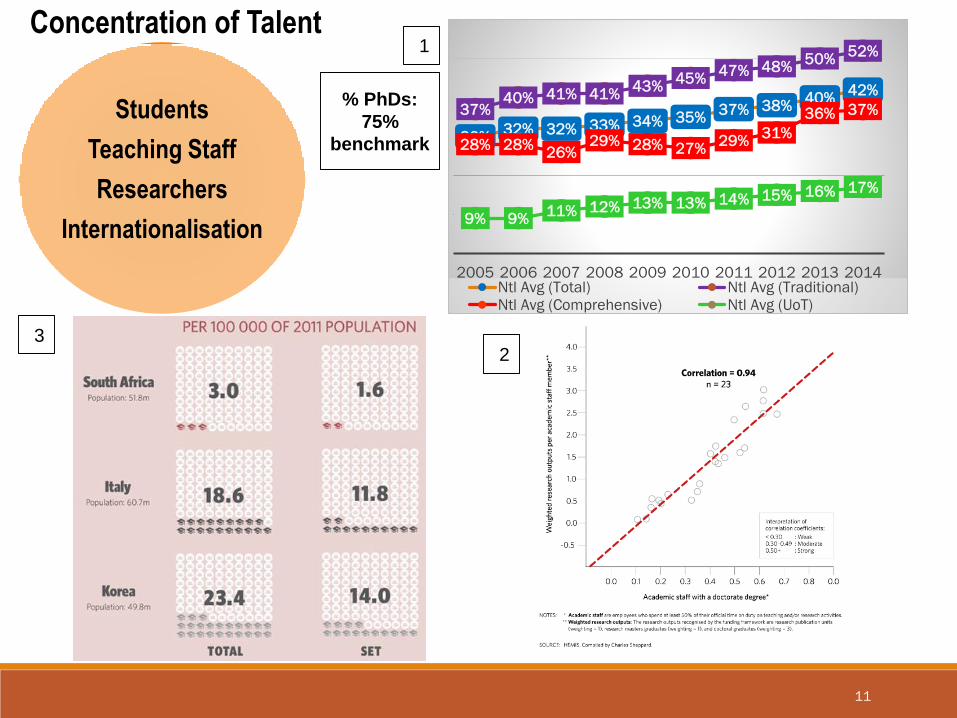
Concentration
of Talent
Favourable
Governance
Abundant
Resources
Graduates Research
Output
WCU
Technology
Transfer
The Challenge of Establishing World-Class Universities
11
Students
Teaching Staff
Researchers
Internationalisation
Concentration of Talent
30%32% 32% 33% 34% 35%
37% 38%40%
42%
37%40% 41% 41%
43%45%
47% 48%50%
52%
28% 28%26%
29% 28% 27%29%
31%
36% 37%
9% 9%11% 12% 13% 13% 14% 15% 16% 17%
2005 2006 2007 2008 2009 2010 2011 2012 2013 2014Ntl Avg (Total) Ntl Avg (Traditional)Ntl Avg (Comprehensive) Ntl Avg (UoT)
1
23
% PhDs:
75%
benchmark
12
Public Budget Resources
Endowment Revenues
Tuition Fees
Research Grants 4.47
2.182.04
1.76
1.44 1.39 1.381.24 1.20 1.15
0.95 0.930.71
0.00
0.50
1.00
1.50
2.00
2.50
3.00
3.50
4.00
4.50
5.00
Cu
ba
Fin
lan
d
No
rwa
y
Ma
lays
ia
Gh
an
a
US
A
Se
ne
ga
l
Au
str
alia
Ind
ia
Arg
en
tin
a
Bra
zil
Ch
ile
So
uth
Afr
ica
Abundant Resources
4 Expenditure on higher education as % of GDP, 2012

13
Supportive Regulatory Framework
Academic Freedom
Leadership Team
Strategic Vision
Culture of Excellence
Governance
Excellence & Throughput:
Complex issue; different approaches
Need to understand better but some numbers raise concern
University Througput Rates - 2005 New Entrants
Dropped
out after
6 years
Graduated
after 6
years
3-year National Diploma 60% 40%
3-year Degree 48% 52%
4-year Degree 51% 49%
Masters Degree (2003 new entrants) 54% 46%Source: DHET (2013), Report of Ministerial Committee for the Review of the
Funding of Universities, pp. 109-112.
Costing & Financing Issues
Costing/Financing
1. No detailed costing – broad assessment of consistency & necessity of the trajectory
What is needed for a competitive, growing economy?
How do we absorb the young & reap the demographic dividend?
2. Targets set based on expert assessment of international trends and evidence & SA starting point
3. The cost of investment in PSET must also be compared to the potential cost of not investing.
4. We cannot afford to underestimate the returns to PSET & S&T - international experience clear about centrality

Conclusion
1. Expansion and quality of higher education indispensable for national development, identity & cohesion, competitiveness and growth
2. Need to maintain our competitive advantage in higher learning & knowledge generation
3. Investment in teaching & research staff for future crucial: level of qualifications and composition/ representivity
4. Critical not to underinvest but also to have an efficient system

Thank you
17
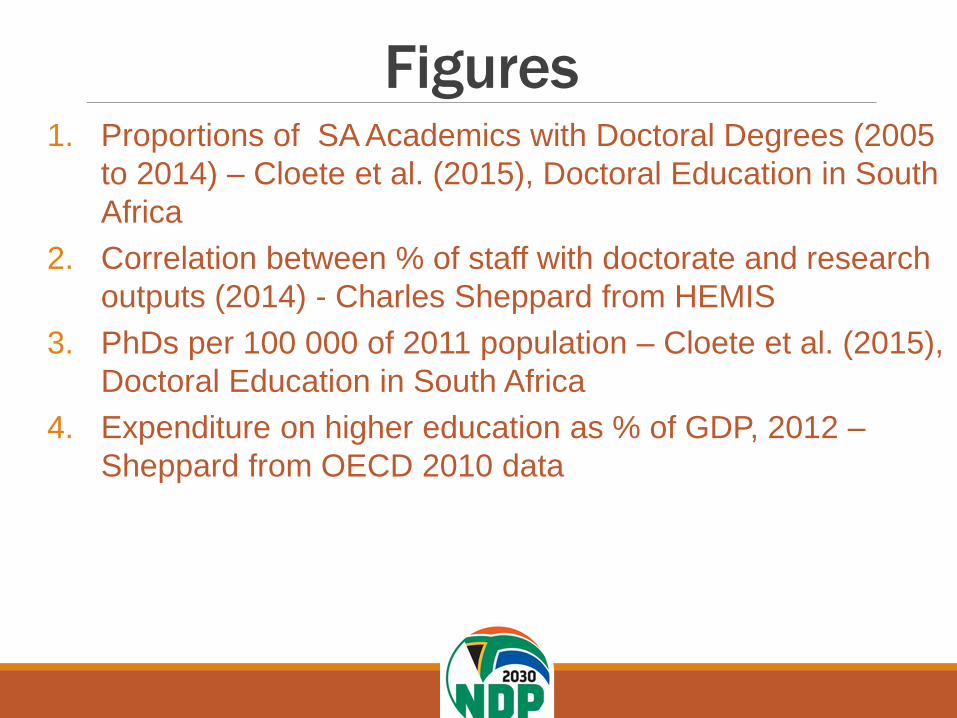
Figures1. Proportions of SA Academics with Doctoral Degrees (2005
to 2014) – Cloete et al. (2015), Doctoral Education in South
Africa
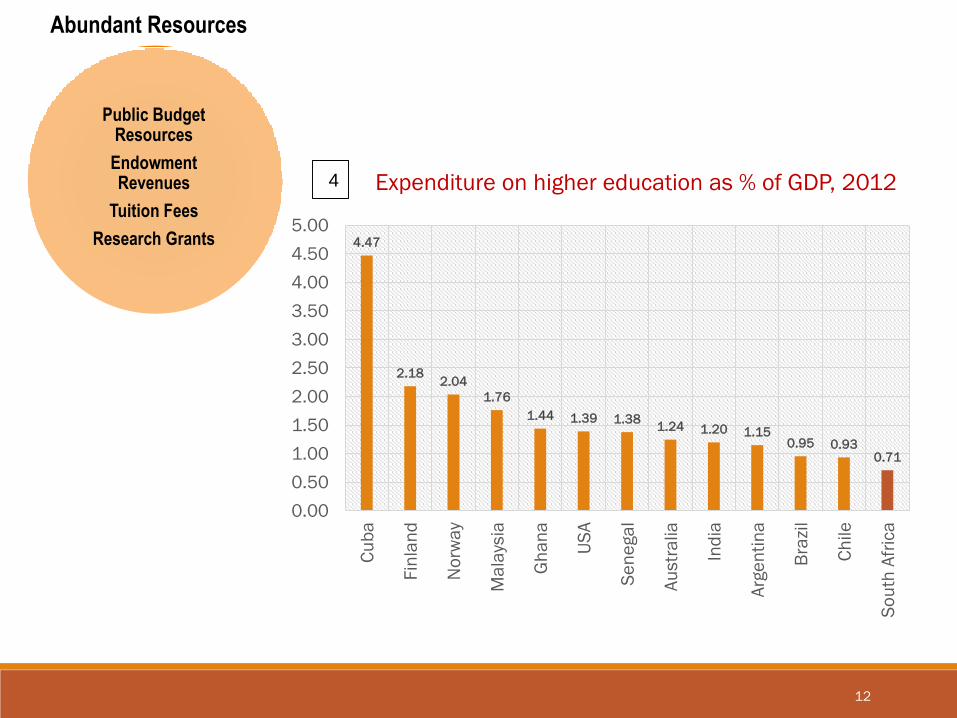
2. Correlation between % of staff with doctorate and research
outputs (2014) - Charles Sheppard from HEMIS
3. PhDs per 100 000 of 2011 population – Cloete et al. (2015),
Doctoral Education in South Africa
4. Expenditure on higher education as % of GDP, 2012 –
Sheppard from OECD 2010 data


![Post Harvest Training [Compatibility Mode]](https://img.pdfslide.net/doc/110x75/577d26f61a28ab4e1ea2a88c/post-harvest-training-compatibility-mode.jpg)