Embed Size (px)
Citation preview
Post-tectonic landscape evolution of a coupled basin and range
Geological Society of America Bulletin, v. 128, no. 3/4 469
Post-tectonic landscape evolution of a coupled basin and range: Pinaleño Mountains and Safford Basin, southeastern Arizona
Matthew C. Jungers1,2,† and Arjun M. Heimsath1,†
1 School of Earth and Space Exploration, Arizona State University, ISTB4, Room 795, 781 E. Terrace Road, Tempe, Arizona 85287, USA2Department of Geology, Oberlin College, 52 W Lorain Street, Oberlin, Ohio 44074, USA
ABSTRACT
The Pinaleño Mountains and adjacent Safford Basin are a landscape defined by the extensional tectonics of the Basin and Range physiographic province. However, over the last ~4 m.y., this coupled basin and range have been actively degrading in the absence of widespread regional extension. While rates of relief generation and upland erosion during active subsidence ca. 12–5 Ma are reflected in the geometry of the basin’s structure and the stratigraphy it contains, rates of post-tectonic landscape evolution from the Pliocene to the present have been heretofore unknown. We combined topo-graphic analyses of the Pinaleño Mountains with cosmogenic nuclide–derived catchment-averaged erosion rates and burial dates of axial and piedmont deposits to quantify rates of post-tectonic landscape evolution and de-fine a chronology for the last stages of depo-si tion and subsequent incision in Safford Basin. In addition to constraining the timing of a deposit’s formation, cosmogenic nuclide burial dates provide paleo-upland erosion rates at the time of deposition. Erosion rates in the Pinaleño Mountains have been gener-ally moderate over the past 4 m.y., ranging between ~30 and 60 m/m.y. with no strong relationship to the drainage basins’ modern topography. A potential acceleration of ero-sion rates to 100–250 m/m.y. between 3.5 and 2 Ma correlates with an inferred period of enhanced precipitation as well as the arrival from upstream of the Gila River in Safford Basin sometime shortly before 2.8 Ma. Wide-spread incision of Safford Basin was under way by ca. 2 Ma, as recorded by the dissec-tion of piedmont basin highstand deposits (Frye Mesa) and two intermediate Gila River terraces on the northeast margin of Safford
Basin (dated to 1.8 Ma and 0.64 Ma). Gila River incision rates have ranged from 30 to 60 m/m.y. over the past 3 m.y. Paleo-upland erosion rates and modern millennial-scale upland erosion rates fall within the same range as incision rates of the Gila River in Safford Basin, suggesting that upland erosion rates are predominantly a function of base-level fall driven by axial incision. However, based on similarities between catchment-averaged erosion rates and topography from basins draining into the integrated Safford Basin and the still internally drained Sulphur Springs Basin to the south, it appears that upland erosion rates during the Quaternary are not being driven exclusively by regional incision rates.
INTRODUCTION
The Basin and Range physiographic province of the North American Cordillera is a region defined by extensional tectonics (e.g., Menges and Pearthree, 1989; Dickinson, 1991, 2004). Rugged mountain ranges stand in stark relief adjacent to muted structural basins filled with sediment. In simplest terms, this topography resulted from uplift along normal faults that drove erosion of sediment from the uplands to be deposited into subsiding basins. These basins often remained internally drained for much of their tectonic development, such that their stra-tigraphy could preserve a nearly full history of upland response to tectonic forcing. The deep sedimentary deposits—often thousands of meters thick at the depocenter of the basins—can also host economic deposits such as cop-per, and they are fundamentally important to the groundwater resources of the water-stressed American Southwest. Additionally, there is active investigation into the potential for these basins to serve as reservoirs for carbon seques-tration (Gootee, 2012).
While the defining period of Basin and Range development is inarguably structural in nature,
it remains unclear how these basins transition to post-tectonic landscape evolution. How quickly do upland erosion rates slow in response to waning subsidence? What is the current rate at which high-relief ranges are decaying? What are the respective roles of Quaternary climate and internal sedimentary system dynamics—e.g., drainage integration between adjacent basins, and subsequent incision and lateral migration of evolving axial systems—in terms of erod-ing mountain ranges and degrading basin-fill deposits? An understanding of these post-tec-tonic processes and their rates is of fundamental importance to quantifying how quickly tectonic signals may be overprinted or degraded once extensional tectonics have ceased, as well as exploring the lag time to slower erosion rates in the absence of active subsidence.
Here, we apply an integrated approach of field observations, topographic analyses, and terrestrial cosmogenic nuclide (TCN) analyses to interrogate the post-tectonic landscape evo-lution of a paired basin and range in southeast-ern Arizona. Cosmogenic nuclide abundances in sediment provide both geochronologic con-straints and process rates for our study. We pre sent TCN-derived burial dates of late-stage sedimentary basin fill along the northern pied-mont of the Pinaleño Mountains and burial dates for sediments deposited on a flight of ter-races of the Gila River inset into basin fill along the northeast margin of Safford Basin (Fig. 1). These dates not only constrain the timing of post-tectonic landscape evolution, but they also allow the quantification of regional incision rates. Burial dates also allow the quantification of paleo–erosion rates for the upland drainage basins that are the sources for the dated sedi-ment. We compare these paleo–erosion rates to modern millennial-scale erosion rates derived from 10Be abundances in fluvial sediment col-lected in drainage basins along both the north and the south margins of the Pinaleño Moun-tains. Drainage basins on the north side of the Pinaleño Mountains are all tributaries
GSA Bulletin; March/April 2016; v. 128; no. 3/4; p. 469–486; doi: 10.1130/B31276.1; 10 figures; 1 table; Data Repository item 2015315; published online 28 September 2015.
†E-mails: jungersm@ wlu .edu; arjun .heimsath@ asu .edu.
For permission to copy, contact [email protected] © 2015 Geological Society of America

Jungers and Heimsath
470 Geological Society of America Bulletin, v. 128, no. 3/4
to the Gila River (a tributary to the Colorado River), while most of the basins on the south side drain into the still-closed Sulphur Springs Basin. This juxtaposition of base-level condi-tions allows the possibility of distinguishing the effects of regional drainage integration on upland erosion rates.
BACKGROUND
Gilbert (1875) conducted the earliest surveys of the geology and resource potential for south-eastern Arizona’s Basin and Range physio-graphic province. Indeed, for a century after his work, his broad classification of late-stage basin fill as the Gila Conglomerate persisted in the literature (e.g., Heindl, 1958, 1962). By the mid-twentieth century, geologists began to more fully consider the impacts of climate on the Quaternary development of the Basin and Range (Tuan, 1962; Melton, 1965), relating the transitions between glacial and interglacial periods to late-stage piedmont deposition and incision. More recently, the modern topography of the Pinaleño Mountains was considered in the context of biogeochemical dynamics set up by
the climate gradient that exists from the mod-ern basin floor to the summit of Mount Graham (Pelletier et al., 2013).
Geology
The Pinaleño Mountains are a gneissic metamorphic core complex exhumed during early stages of regional low-angle extensional tectonics during the middle-to-late Oligocene (Spencer and Reynolds, 1989). The current physiography of Arizona’s Basin and Range is predominantly the result of subsequent, high-angle normal faulting associated with the Basin and Range Disturbance, which initiated at ca. 8–12 Ma (Scarborough and Peirce, 1978) and ceased within a poorly defined window ranging from 5 to 2 Ma, with some regional variation (Menges and Pearthree, 1989). Safford Basin, immediately to the northeast of the Pinaleño Mountains, is divided into two structural sub-basins, Bear Springs Subbasin to the north and 111 Ranch Subbasin to the east, based on Bou-guer gravity anomalies (Wynn, 1981; Houser et al., 2002). Safford Basin is a half graben with maximum subsidence occurring along a basin-
bounding fault system on the north side of the Pinaleño Mountains (Thorman, 1981; Houser and Pearthree, 2002). At its deepest, the basin is filled with up to 4600 m of sedimentary basin fill (Kruger, 1991; Houser and Pearthree, 2002). The sedimentary basin fill is divided into upper and lower stratigraphic units. The purely syn-tectonic Midnight Canyon Conglomerate began deposition at 17 Ma, and its upper bound is at ca. 10 Ma (Richter et al., 1983; Houser et al., 1985). The upper basin fill is divided into two subunits in accordance with the subbasin that contains the sediment, the 111 Ranch Forma-tion and the Bear Springs formation. Both for-mations are inferred to be Pliocene based on the biostratigraphy of deposits at 111 Ranch ( Galusha et al., 1984).
The very latest stage of basin fill is exposed throughout Safford Basin, but perhaps most spectacularly at Frye Mesa on the northeast side of the Pinaleño Mountains. No numerical or rel-ative dates for this fill existed prior to our study, but the sediment was roughly correlated with the Gardner Canyon Alloformation of Sonoita Creek Basin (sensu stricto; Morrison, 1985), with an approximate age of 2–1 Ma (Menges
111°00′W 110°30′W 110°00′W 109°30′W
33°00′N
32°30′N
32°00′N
31°30′N
Figure 1. Overview of southeast-ern Arizona’s Basin and Range. This region is the southeastern extent of the larger Basin and Range physiographic province of North America. The Gila River flows northwest through the Safford Basin within this re-gion. Primary areas of interest for this study are the Pinaleño Mountains, Safford Basin, and Sulphur Springs Basin.
Post-tectonic landscape evolution of a coupled basin and range
Geological Society of America Bulletin, v. 128, no. 3/4 471
and McFadden, 1981) for the final stages of basin-fill deposition within Safford Basin prior to regional drainage integration of the Gila River. Regional extensional tectonics are inac-tive in southeastern Arizona, but there is evi-dence for mid-to-late Pleistocene surface-rup-turing earthquakes along fault systems roughly parallel to the topographic front of the northeast Pinaleño Mountains (Pearthree, 1986). Dis-placement along these faults is not more than several meters, while incision of the Gila River system within Safford Basin is over 100 m, underscoring the importance of base-level fall and climate variations, rather than faulting, in driving basin-fill dissection and erosion of this fill during the post-tectonic landscape evolution of this basin (Houser and Pearthree, 2002).
Climate
The Pinaleño Mountains are characterized as an ecological “sky island,” at the northern extent of the Madrean “archipelago,” due to the isolated ecosystems that developed at high elevations because of the stark contrast in tem-peratures and annual precipitation from the surrounding Sonoran Desert (Warshall, 1995). Total relief of nearly 2500 m produces a steep gradient in mean annual temperature (MAT) and mean annual precipitation (MAP) as a func-tion of increasing elevation from basin floor to the summit of the range. MAT ranges from 5 °C to 18 °C from the highest elevations to the valley floor, respectively. Mitchell and Ober (2013) reported a lapse rate for average maxi-mum temperatures in southeastern Arizona of –7.6 °C/km of elevation gain. Importantly, this difference of greater than 10 °C in average tem-perature occurs across a horizontal distance of only 10–15 km between the Safford Basin and the upper elevations of the Pinaleño Mountains. MAP also differs dramatically between the val-ley floor and upper elevations, increasing from 0.25 m/yr to 1.1 m/yr. These gradients of tem-perature and precipitation set up a succession of ecosystems from the Sonoran-Chihuahuan Desert at lowest elevations, grading into scrub and grassland, then oak and pine, then conifer, and finally spruce and fir at the highest eleva-tions (Halvorsen et al., 2001; Mitchell and Ober, 2013). In the Pinaleño Mountains, endemic spe-cies such as the Mount Graham squirrel inhabit only the highest elevations, having potentially evolved in isolation since the last time that the regional climate was cool and wet enough to allow dispersal of populations across basin floors between sky islands (Mitchell and Ober, 2013). The most recent period of significantly cooler and wetter climate conditions for the Pinaleño Mountains is believed to be during
the Younger Dryas at ca. 12.7–11.5 ka (Pigati et al., 2009).
The paleoclimate record for southeastern Arizona is best known for the late Pleistocene through the Holocene (e.g., Martin, 1963; Waters, 1989; Van Devender, 1990; Zhu et al., 1998; Allen, 2005; Holmgren et al., 2006; Pigati et al., 2009; Wagner et al., 2010; Mitchell and Ober, 2013), but some coarser-resolution records do exist into the early Pliocene (Smith et al., 1993; Smith, 1994). Soil carbonates from the St. David Formation of the Upper San Pedro Basin, ~120 km to the southwest of Safford Basin and the Pinaleño Mountains, yield a paleoclimate record of precipitation from ca. 0.5 to 4.0 Ma (Smith et al., 1993; Smith, 1994). The precipita-tion record inferred from stable 18O in paleosol carbonates at St. David suggests a higher total annual precipitation, with a higher proportion of that moisture arriving in the winter months from ca. 3.5 to 2.0 Ma. With the transition into the Pleistocene, total precipitation decreased, as did the proportion of winter precipitation, suggest-ing increasing aridity and an increased impor-tance of the North American Summer Monsoon (NASM; Smith, 1994). Paleoclimate records for the Quaternary come from a number of proxies, including packrat middens, lake cores, lake highstands, and speleothems (Martin, 1963; Waters, 1989; Van Devender, 1990; Zhu et al., 1998; Allen, 2005; Holmgren et al., 2006; Pigati et al., 2009; Wagner et al., 2010; Mitchell and Ober, 2013). In summary, it was cooler and wetter than today from 115 to 110 ka, but the coolest and wettest conditions occurred during the Last Glacial Maximum (LGM) at 24–21 ka (Menking et al., 2004; Allen, 2005; Mitchell and Ober, 2013).
A speleothem record from the Cave of the Bells in Arizona suggests highly variable mois-ture availability for the southwestern United States throughout the late Pleistocene, likely a result of variable sea-surface temperatures of both the Pacific Ocean and Atlantic Ocean (Wag-ner et al., 2010). This moisture variability is per-haps also reflected in a series of highstands from 18 to 10 ka for pluvial Lake Cochise, centered near modern-day Willcox Playa (Waters, 1989). Willcox Playa is 65 km south of Safford Basin, and it is the modern-day base level for Sulphur Springs Basin and much of the south side of the Pinaleño Mountains. Sulphur Springs Basin is the most significant internally drained basin in southeastern Arizona that remains uninte grated with the Gila River. The likely effect of cooler and wetter climates in the Pinaleño Mountains is a shift of the modern ecosystem boundaries to lower elevations, greater annual precipitation, and perhaps enhanced physical weathering due to frost-cracking at upper elevations and poten-
tially even periglacial processes at the high-est elevations (Melton, 1965). We address the geomorphic implications for these periods of enhanced cooling and moisture in the following sections.
Geomorphology
The range-scale relief of nearly 2500 m from the modern Gila River near Safford, Arizona, to the summit of Mount Graham is a product primarily of Basin and Range tectonics. How-ever, ~500 m of relief at the lower elevations, e.g., between Frye Mesa and the modern Gila River, developed more recently by incision of the Gila River following downstream drain-age integration of the Gila with the Lower San Pedro Basin. It is important to note that while incision on the north side of the Pinaleño Moun-tains produced 20% of the total relief, the south side of the range drains primarily to the inter-nally drained Sulphur Springs Basin, and the total relief is accordingly 500–600 m less. Only a small fraction of the drainage basins on the west side of the range drain into Aravaipa Creek Basin, a tributary of the San Pedro River, which flows into the Gila River just 19 km downstream from the Aravaipa Creek confluence (Fig. 2; see GSA Data Repository Item for color version of Fig. 21).
The relief structure of the Pinaleño Moun-tains has the added complexity of a lower-relief patch of the landscape above elevations of ~2700 m. Upper elevations are characterized by gentler hillslopes of only 10°–15°; below eleva-tions of 2700 m, hillslopes steepen to threshold angles (~35°) where soil is present, but there are abundant rocky patches and steeper cliffs. The upper low-relief landscape is predominantly soil-mantled; however, there is a small area of steeper terrain at high elevations within the headwaters of Grant Creek. This patch of the landscape roughly corresponds with the mapped extent of a gneiss body with a slightly different composition than the surrounding lithology. The steep hillslopes within the upper Grant Creek basin extend beyond the mapped extent of the isolated unit, so lithology alone may not explain this variation of morphology. The transi-tion from low relief and low hillslope angles at higher elevations to the rocky, steep landscape below ~2700 m is reflected in the longitudinal profiles of channels draining both the north and south sides of the Pinaleño Mountains (Fig. 2). At lower elevations, just upstream of the range
1GSA Data Repository item 2015315, figures 2, 5, 9, and 10 in color format, is available at http:// www .geosociety .org /pubs /ft2015 .htm or by request to editing@ geosociety .org.

Jungers and Heimsath
472 Geological Society of America Bulletin, v. 128, no. 3/4
110°00′W
32°30′N
<500–15°15–25°25–35°35–45°>45° >250
50–100100–150150–200200–250
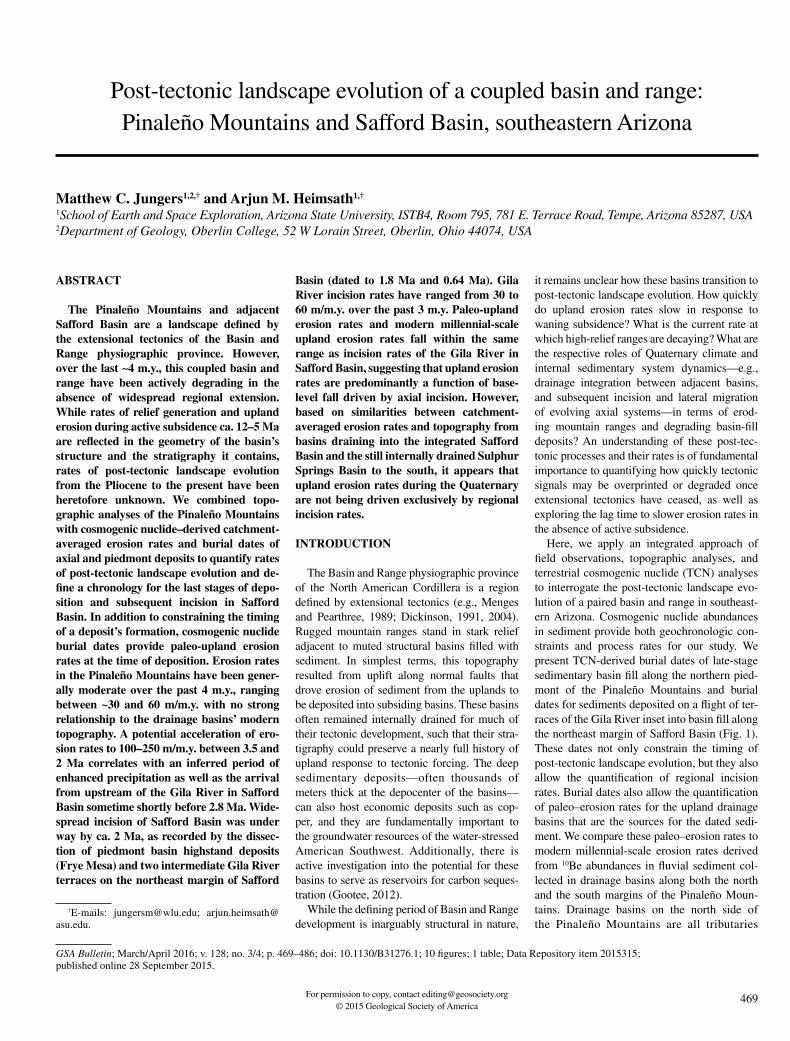
Figure 2. The Pinaleño Mountains and Safford Basin. (A) Drainage basins sampled for detrital terrestrial cosmogenic nuclide (TCN) analyses are highlighted by arrows, as are Frye Mesa and Gila River terraces sampled for TCN burial dates. Catchments on the north side of the Pinaleño Mountains drain to the Gila River, which in turn is integrated with the Colorado River. The majority of catchments on the south side of the range—including Post Creek and Grant Creek—drain to Willcox Playa (see Fig. 1) within the internally drained Sulphur Springs Basin. Base map is 10 m digital elevation model (DEM) draped over shaded relief. (B) Steep hillslope angles dominate the range below an elevation of ~2700 m, while the upper elevations have gentler slopes. (C) Local relief calculated in a moving window with 1.5 km radius captures the low-relief patch of the Pinaleño Mountains at high elevations. Local relief is highest on the north and south flanks of the range, and there is subtle decrease in local relief at the northwest and southeast tips of the range. (D) Normalized channel steepness index (Wobus et al., 2006) draped on top of a DEM with shaded relief; drainage basins of interest are outlined in black. The highest channel steepness values track well with areas of high local relief.
Post-tectonic landscape evolution of a coupled basin and range
Geological Society of America Bulletin, v. 128, no. 3/4 473
front, valley bottoms are often filled with debris-flow deposits (e.g., Grant Creek, Jacob-son Canyon, Taylor Canyon, and Tripp Creek), with many generations of debris-flow lobes underscoring the importance of mass wasting in the long-term landscape evolution of the high-relief portion of the Pinaleño Mountains. We did not observe recent landslide deposits dur-ing our field work in the area, but debris flows have recently been active in the Santa Catalina Mountains, another sky island with similar lithology 90 km to the west of the Pinaleño Mountains, suggesting that debris flows remain an active process within the steeper portions of the Pinaleño Mountains (Youberg et al., 2008).
In tectonically active landscapes, abrupt transitions between low-relief and high-relief landscapes used in concert with nonequilibrium stream profiles may be evidence for a transient stage of landscape response to changes in uplift (e.g., Wobus et al., 2006; DiBiase et al., 2010). In such a setting, with climate held relatively con-stant, an acceleration in uplift will force streams to steepen until a new equilibrium between uplift and erosion is achieved. During this tran-sient readjustment, a propagating wave of inci-sion sweeps up system, and hillslopes steepen as upland erosion rates increase in response to incision. Portions of the landscape that have not yet been affected by the propagating incision are characterized by less steep channels and gentler hillslope angles, which reflect a slower, relict erosion rate. It is possible that the upper eleva-tions of the Pinaleño Mountains represent such a relict landscape, and this possibility is one of the motivating questions for our study.
In contrast, recent work focusing on the eco-pedo-geomorphology of the Pinaleño Mountains by Pelletier et al. (2013) emphasized the potential that this transition from steep to gentle slopes as a function of elevation is driven by temperature and precipitation gradients rather than transient response to tectonics. Cooler tem-peratures and enhanced precipitation at higher elevations are inferred to promote the feedbacks between vegetation and soil development, which in turn produce and maintain a low-relief land-scape with soil-mantled hillslopes. Patchy soils and rocky slopes at lower elevations are attrib-uted to less suitable conditions for vege tation to take hold and modify the landscape.
Relict landscapes notwithstanding, the feed-backs between climate and surface processes in the uplands of the Pinaleño Mountains are unde-niably important, especially for the post-tec-tonic landscape evolution of the range. Some of the earliest work relating alluvial fans to paleo-climate in the American Southwest used Frye Mesa on the north side of the Pinaleño Moun-tains as a key example of landscape response
to glacial-interglacial cycles (Melton, 1965). Melton hypothesized that most of the mass of Frye Mesa was deposited during a cooler, wetter Illinoian glacial period, ca. 190–130 ka, and that the deep, red soil on the deposit’s surface devel-oped during a subsequent interglacial. He envis-aged that the final lobe of very coarse, boulder-filled alluvium deposited near the fan’s proximal end was the product of renewed upland erosion during the Wisconsinan glacial due to enhanced frost-wedging at high elevations under a cooler climate. Houser and Pearthree (2002) agreed with Melton’s correlation of the finest-grained material at the base of Frye Mesa with late Pliocene basin fill, but they suggested that the majority of the basin-fill sediment now exposed as Frye Mesa was deposited in a period of wan-ing or absent tectonics, and any variations in grain size within the deposit were due to climate change at the Pliocene-Pleistocene boundary. Our study’s TCN burial dates constrain the tim-ing of late-stage deposition into Safford Basin (in the form of Frye Mesa) and provide a com-parison for paleo–erosion rates during that time to modern, millennial-scale erosion rates.
METHODS
Topographic Analyses
We employed a suite of digital terrain analy-ses to derive topographic metrics that divide the Pinaleño Mountains and Safford Basin into a series of geomorphic process domains. When paired with TCN-derived erosion rates, these topographic analyses allowed us to investigate the relationship between topography and ero-sion rates. Using a 10 m digital elevation model (DEM), we quantified mean basin slope and catchment-mean local relief (using a search window with a 1.5 km radius), and catchment-mean normalized channel steepness (Fig. 2).
We calculated hillslope angles for each pixel in our DEM, and then we calculated a mean basin slope for each catchment, defined simply as the average of all hillslope angles within a drainage basin. Low-slope valley fill in some drainage basins of interest may bias calculations of catchment mean slope. If present, fill was therefore excluded from such calculations.
Previous work shows that the scale used to calculate local relief is fundamentally important to quantifying topographic form (e.g., DiBiase et al., 2010). We found that local relief calcu-lated within a window with a 3 km diameter best captured the range-scale relief structure (Fig. 2). In general, local relief shows a transition to lower relief for drainage basins at the northwest and southeast tips of the range, e.g., Tripp Can-yon, Marijilda Canyon, and Jacobson Canyon.
Local relief calculated over smaller windows failed to capture the transition to lower relief at the range’s northwest and southeast tips, and larger windows failed to define the low-relief patch of the landscape at higher elevations. Essentially, we used our observations, espe-cially of the patch of low slope above 2700 m, to tune the size of the window over which we calculated local relief.
Longitudinal profiles of rivers record the extent to which a landscape is adjusted to exter-nal forcings such as tectonics and climate, potentially modulated by rock strength. The normalized channel steepness index, ksn, is use-ful as a topographic metric when considering landscape response to incision rates on chan-nels that have driven hillslopes to threshold angles (Wobus et al., 2006; Ouimet et al., 2009; DiBiase et al., 2010). Using a reference con-cavity of 0.45 and minimum drainage area of 5 km2, we extracted ksn values for every 500 m stream segment in the Pinaleño Mountains. Mean channel steepness for drainage basins is defined as the average of all the channel steep-ness values within a basin.
Cosmogenic Nuclides
Cosmogenic nuclide abundances in rock and sediment record the near-surface residence time of those Earth materials (Fig. 3). When cosmic rays hit Earth’s atmosphere, a cascade of sec-ondary particles is produced, some of which reach Earth’s surface. Most of these particles are then quickly stopped by the mass of soil and rock within the first 1–3 m of the surface (Gosse and Phillips, 2001). The accumulation of cosmogenic nuclides in rock or sediment as a function of depth and duration of exposure is expressed as:
N (z,t) = P0e−ρzΛ
λ + ρεΛ
1− e− λ+ρε
Λt
, (1)
where N is TCN concentration [atoms g–1], t is time [yr], e is erosion rate [cm yr–1], l is radio-nuclide decay constant [yr–1], z is depth below the deposit surface [cm], P0 is nuclide surface production rate [atoms g–1 yr–1], L is production rate attenuation length [g cm–2], and r is rock or sediment density [g cm–3]. This formula-tion is commonly used to determine apparent exposure ages and/or maximum surface erosion rates (e.g., Portenga and Bierman, 2011). When determining surface exposure ages for alluvial deposits or boulders, an additional term must be included to account for inherited TCN abun-dances accumulated prior to deposition (e.g., Anderson et al., 1996):
Jungers and Heimsath
474 Geological Society of America Bulletin, v. 128, no. 3/4
N (z,t) = N0e−λt +N (z,t) = P0e
−ρzΛ
λ + ρεΛ
1− e− λ+ρε
Λt
, (2)
where N0 is the inherited concentration of the cosmogenic nuclide [atoms g–1], and other terms are as in Equation 1. We used Equation 2 when calculating apparent exposure ages of boulders deposited on top of Frye Mesa, and it also serves as the foundation for our calcula-tions of both catchment-averaged erosion rates and burial dates for sedimentary basin fill. Note that any assumption of no inheritance, N0, leads
to an older apparent exposure age, while impos-ing a nonzero erosion rate, e, leads to a younger apparent exposure age.
For an upland drainage basin that is steadily
eroding, i.e., t λ + ρεΛ
−1�
, cosmogenic nuclide
concentrations (N) in sediment eroded from the catchment may be expressed as (Lal, 1991):
N = P0
λ + ρεΛ
, (3)
which, rearranging to solve for erosion rate, yields:
ε = Λρ
ρ0
N− λ
. (4)
Equation 4 is commonly used to invert cosmo-genic nuclide concentrations in detrital samples for upland erosion rates (e.g., Brown et al., 1995; Bierman and Steig, 1996; Granger et al., 1996). Balco et al. (2008, their fig. 8) showed, however, that in some cases (e.g., low-elevation, high-ero-sion-rate sites), erosion rates will be underesti-mated by a few percent to several tens of percent if only Equation 4 is used. This results from not taking into account subsurface nuclide produc-tion by muons (Heisinger et al., 2002a, 2002b).
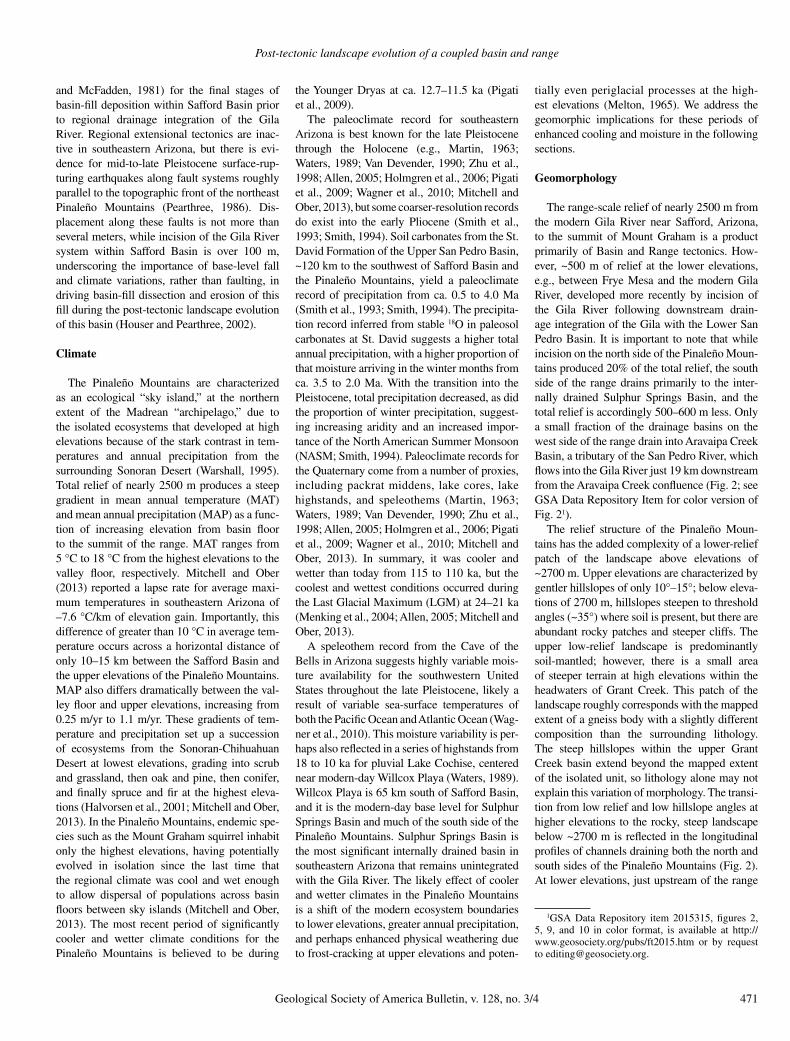
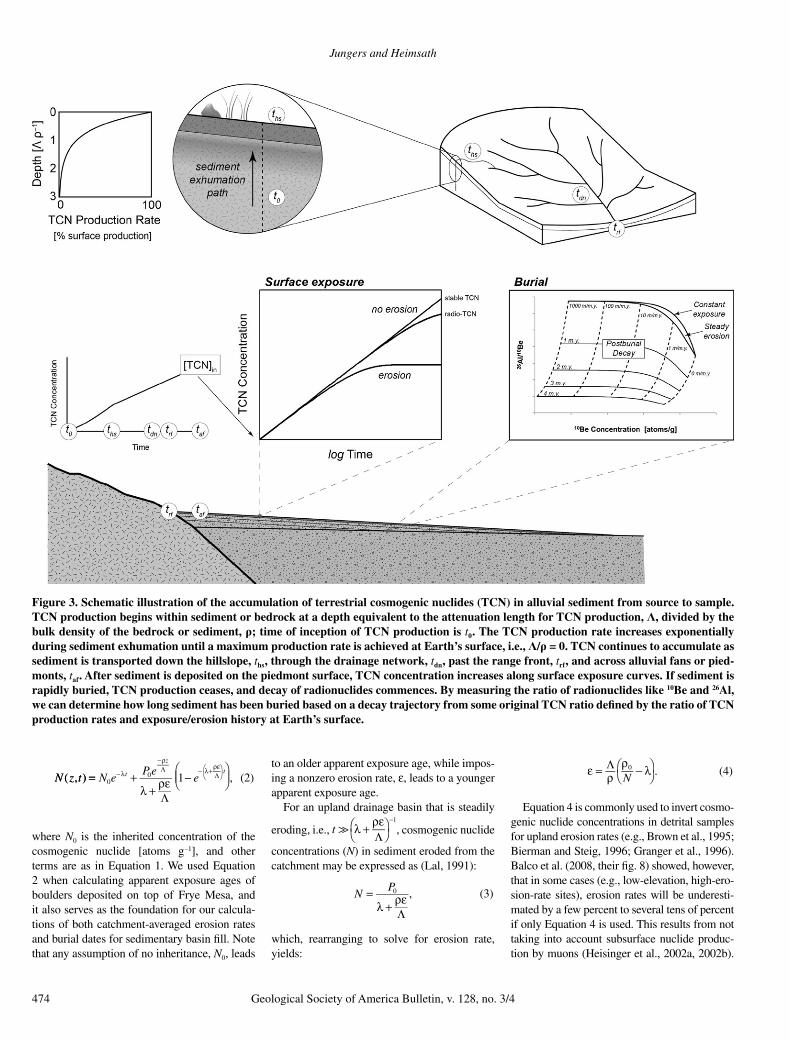
Figure 3. Schematic illustration of the accumulation of terrestrial cosmogenic nuclides (TCN) in alluvial sediment from source to sample. TCN production begins within sediment or bedrock at a depth equivalent to the attenuation length for TCN production, Λ, divided by the bulk density of the bedrock or sediment, ρ; time of inception of TCN production is t0. The TCN production rate increases exponentially during sediment exhumation until a maximum production rate is achieved at Earth’s surface, i.e., Λ/ρ = 0. TCN continues to accumulate as sediment is transported down the hillslope, ths, through the drainage network, tdn, past the range front, trf, and across alluvial fans or pied-monts, taf. After sediment is deposited on the piedmont surface, TCN concentration increases along surface exposure curves. If sediment is rapidly buried, TCN production ceases, and decay of radionuclides commences. By measuring the ratio of radionuclides like 10Be and 26Al, we can determine how long sediment has been buried based on a decay trajectory from some original TCN ratio defined by the ratio of TCN production rates and exposure/erosion history at Earth’s surface.
Post-tectonic landscape evolution of a coupled basin and range
Geological Society of America Bulletin, v. 128, no. 3/4 475
We avoided this problem by determining an “effective elevation” for each drainage basin of interest, following the methods of Portenga and Bierman (2011), and then calculating catchment-averaged erosion rates using the CRONUS-Earth online calculator (Balco et al., 2008; http:// hess .ess .washington .edu/), which implements Heisinger et al.’s (2002a, 2002b) equations for muon-induced cosmogenic nuclide production. Essentially, calculating an “effective elevation” according to Portenga and Bierman (2011) pro-vides an input elevation for CRONUS that will ensure that each drainage basin’s cosmo genic nuclide production rates will be scaled consis-tently by the online calculator.
Cosmogenic nuclide abundances in sediment eroded from upland basins and deposited in downstream fill terraces, lakes, or sedimentary basins record both a paleo-upland erosion rate and a burial duration since deposition (Granger et al., 1997; Granger and Muzikar, 2001). As a result, inversion of measured TCN concentra-tions into a burial date requires the measurement of two cosmogenic nuclides to solve for those two unknowns. Importantly, at least one nuclide measured must be a radionuclide to determine burial duration and, therefore, deposition tim-ing. For this study, we used two cosmogenic radionuclides, 26Al and 10Be, both of which have well-established production rates and half-lives. A full formulation for 26Al and 10Be abun-dances in buried sediment combines Equations 1, 2, and 3 (adapting the notation of Balco and Rovey, 2008):
N10 = P10
λ10+ ρεΛ
e−λ10tb + P10e−ρz
Λ
λ10+ ρεΛ
1− e− λ10 +ρε
Λtb
, (5)
N26 = P26
λ26+ ρεΛ
e−λ26tb + P26e−ρz
Λ
λ26+ ρεΛ
1− e− λ26+ρε
Λtb
, (6)
where 10 and 26 subscripts denote 10Be and 26Al, respectively, and tb is burial duration in years. We refer to burial dates that use 26Al/10Be ratios in one sample to directly solve Equations 5 and 6 for the two unknowns, paleo–erosion rate, e, and burial duration, tb, as conventional burial dating.
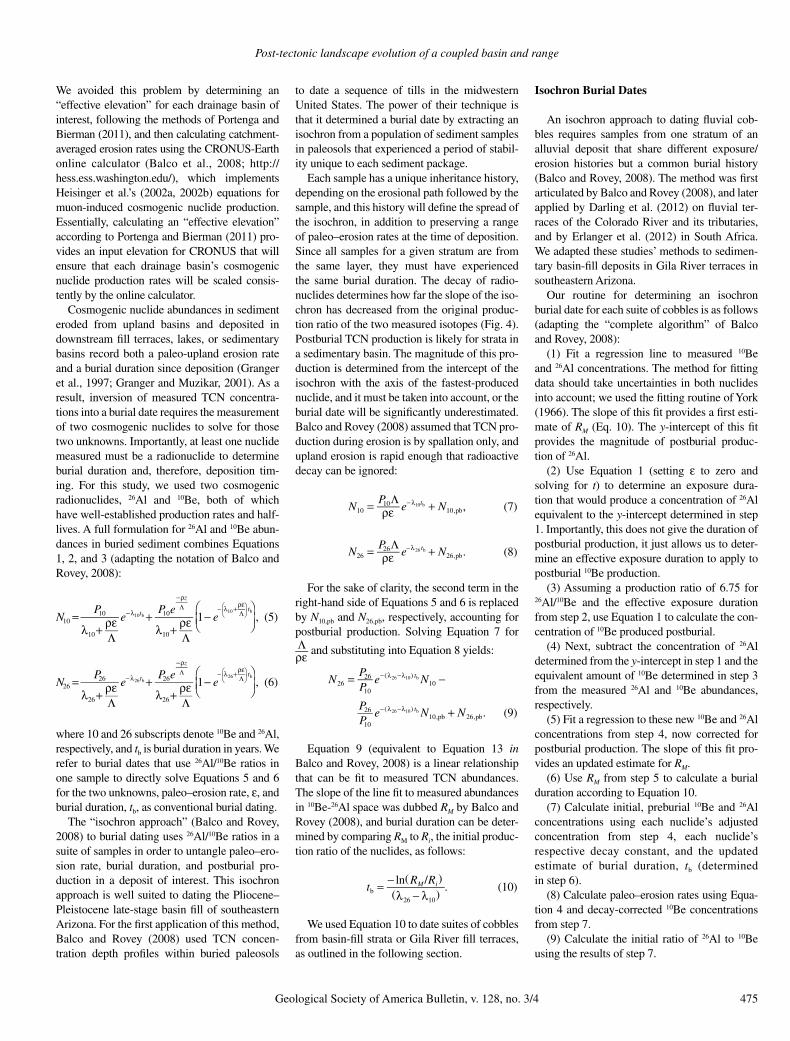
The “isochron approach” (Balco and Rovey, 2008) to burial dating uses 26Al/10Be ratios in a suite of samples in order to untangle paleo–ero-sion rate, burial duration, and postburial pro-duction in a deposit of interest. This isochron approach is well suited to dating the Pliocene–Pleistocene late-stage basin fill of southeastern Arizona. For the first application of this method, Balco and Rovey (2008) used TCN concen-tration depth profiles within buried paleosols
to date a sequence of tills in the midwestern United States. The power of their technique is that it determined a burial date by extracting an isochron from a population of sediment samples in paleosols that experienced a period of stabil-ity unique to each sediment package.
Each sample has a unique inheritance history, depending on the erosional path followed by the sample, and this history will define the spread of the isochron, in addition to preserving a range of paleo–erosion rates at the time of deposition. Since all samples for a given stratum are from the same layer, they must have experienced the same burial duration. The decay of radio-nuclides determines how far the slope of the iso-chron has decreased from the original produc-tion ratio of the two measured isotopes (Fig. 4). Postburial TCN production is likely for strata in a sedimentary basin. The magnitude of this pro-duction is determined from the intercept of the isochron with the axis of the fastest-produced nuclide, and it must be taken into account, or the burial date will be significantly underestimated. Balco and Rovey (2008) assumed that TCN pro-duction during erosion is by spallation only, and upland erosion is rapid enough that radioactive decay can be ignored:
N10 = P10Λρε e−λ10tb + N10,pb, (7)
N26 = P26Λρε e−λ26 tb + N26,pb. (8)
For the sake of clarity, the second term in the right-hand side of Equations 5 and 6 is replaced by N10,pb and N26,pb, respectively, accounting for postburial production. Solving Equation 7 for Λρε and substituting into Equation 8 yields:
N26 = P26
P10
e−(λ26 −λ10) tb N10 −
P26
P10
e−(λ26 −λ10) tb N10,pb + N26,pb. (9)
Equation 9 (equivalent to Equation 13 in Balco and Rovey, 2008) is a linear relationship that can be fit to measured TCN abundances. The slope of the line fit to measured abundances in 10Be-26Al space was dubbed RM by Balco and Rovey (2008), and burial duration can be deter-mined by comparing RM to Ri, the initial produc-tion ratio of the nuclides, as follows:
tb = − l /n(RM Ri)
(λ26 − λ10). (10)
We used Equation 10 to date suites of cobbles from basin-fill strata or Gila River fill terraces, as outlined in the following section.
Isochron Burial Dates
An isochron approach to dating fluvial cob-bles requires samples from one stratum of an alluvial deposit that share different exposure/erosion histories but a common burial history (Balco and Rovey, 2008). The method was first articulated by Balco and Rovey (2008), and later applied by Darling et al. (2012) on fluvial ter-races of the Colorado River and its tributaries, and by Erlanger et al. (2012) in South Africa. We adapted these studies’ methods to sedimen-tary basin-fill deposits in Gila River terraces in southeastern Arizona.
Our routine for determining an isochron burial date for each suite of cobbles is as follows (adapting the “complete algorithm” of Balco and Rovey, 2008):
(1) Fit a regression line to measured 10Be and 26Al concentrations. The method for fitting data should take uncertainties in both nuclides into account; we used the fitting routine of York (1966). The slope of this fit provides a first esti-mate of RM (Eq. 10). The y-intercept of this fit provides the magnitude of postburial produc-tion of 26Al.
(2) Use Equation 1 (setting e to zero and solving for t) to determine an exposure dura-tion that would produce a concentration of 26Al equivalent to the y-intercept determined in step 1. Importantly, this does not give the duration of postburial production, it just allows us to deter-mine an effective exposure duration to apply to postburial 10Be production.
(3) Assuming a production ratio of 6.75 for 26Al/10Be and the effective exposure duration from step 2, use Equation 1 to calculate the con-centration of 10Be produced postburial.
(4) Next, subtract the concentration of 26Al determined from the y-intercept in step 1 and the equivalent amount of 10Be determined in step 3 from the measured 26Al and 10Be abundances, respectively.
(5) Fit a regression to these new 10Be and 26Al concentrations from step 4, now corrected for postburial production. The slope of this fit pro-vides an updated estimate for RM.
(6) Use RM from step 5 to calculate a burial duration according to Equation 10.
(7) Calculate initial, preburial 10Be and 26Al concentrations using each nuclide’s adjusted concentration from step 4, each nuclide’s respective decay constant, and the updated estimate of burial duration, tb (determined in step 6).
(8) Calculate paleo–erosion rates using Equa-tion 4 and decay-corrected 10Be concentrations from step 7.
(9) Calculate the initial ratio of 26Al to 10Be using the results of step 7.
Jungers and Heimsath
476 Geological Society of America Bulletin, v. 128, no. 3/4
(10) If this initial ratio is less than 6.75 (due to low paleo-upland erosion rates at the time of deposition, for example), then adjust 10Be values to a Ri of 6.75 by multiplying 10Be values from
step 7 by the ratio: (Step 9Ri )
6.75.
(11) Next, fit a final regression to 10Be con-centrations from step 10 and 26Al concentrations from step 4. The slope of this line is the final value for RM.
(12) Finally, use Equation 10 and RM from step 11 to calculate the isochron burial date.
Sample Collection and Preparation
We collected samples for detrital TCN analy-sis from drainage basins ranging from 2 to 37 km2, with the smallest basins nested within both Ash Creek and Grant Creek. The goal of the nested samples was to isolate the erosion rate signal of the low-relief surface in the basins’ headwaters. We then sieved samples of river sand to extract the 250–1000 mm fraction. For Frye Mesa and Gila River terrace burial dates, sample collection depended on what approach
to burial dating we planned to use. For samples where postburial production was inferred to be minimal, we used a conventional approach to burial dating (AZ49 and AZ50sand). If post-burial production seemed significant, we used an isochron approach to burial dating (AZ29, AZ32, AZ51, and AZ52). We used road cuts on Frye Mesa to minimize recent re-exposure of sediment to TCN production. For the Gila River terraces, we sampled within a quarry and a recently excavated gully to minimize recent re-exposure of the sediments. For the two highest-
C
B
A
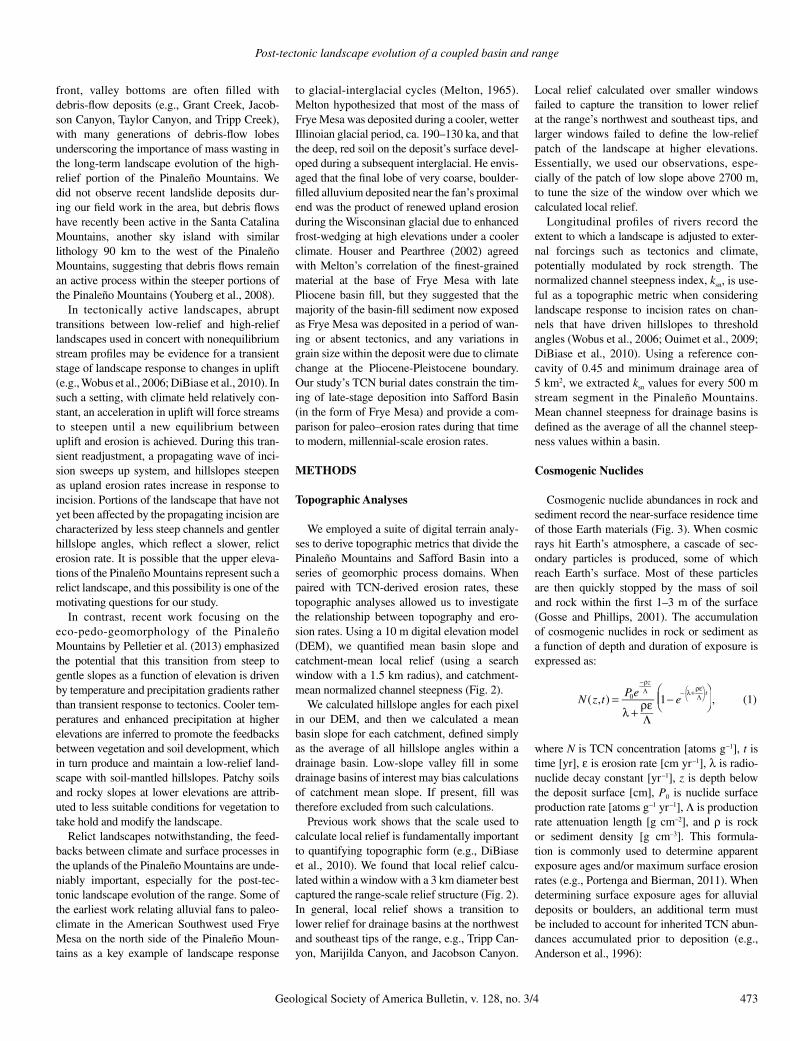
Figure 4. Summary of isochron approach to terrestrial cosmogenic nuclide (TCN) burial dating. Samples for a given stratum should ideally be individual quartz-rich cobbles that will have different initial TCN concentra-tions due to disparate exposure/erosion histories (A). The slope of a TCN ratio (26Al/10Be for this paper) for unburied samples will be equal to the ratio of the production rate for the paired nuclides. When sediment is shielded from TCN production, one or both nuclides begin to decay according to their individual exponential decay constants; at least one TCN must be a radionuclide when determining a burial duration. The ratio of TCN changes as decay continues and production is fully or significantly shielded. As a result, the slope of the isochron decreases, and this new slope allows the calculation of a burial duration (B). If sediment is not fully shielded from TCN production, then some nuclides will accumulate during burial. This postburial production will increase the intercept of the isochron with the axis belonging to the nuclide with the higher production rate, 26Al for this study’s samples (C).
Post-tectonic landscape evolution of a coupled basin and range
Geological Society of America Bulletin, v. 128, no. 3/4 477
elevation samples on Frye Mesa, observations in the field (no paleosol development and both sample sites located within largely unsorted debris flow–like strata) suggested that postburial production was likely low due to rapid sedimen-tation and consequent shielding, so we sampled sand that was then sieved to the 250–1000 mm target fraction. If there was significant postburial production at these sample sites, then our dates represent an underestimate of the deposits’ true ages. We quantified the rest of the burial dates using the isochron approach, so we sampled 3–5 cobbles per site, which we then crushed and sieved to 250–1000 mm. For the boulders atop Frye Mesa, we collected several 100 g samples of quartz-rich material from the upper centime-ter of each boulder using a hammer and chisel. We then crushed and sieved these samples to our target grain size and analyzed them for surface exposure ages.
We isolated quartz using standard methods (Kohl and Nishiizumi, 1992) via cleaning in aqua regia and subsequent etching in HF and HNO3. We extracted 10Be and 26Al through col-umn chromatography (Ditchburn and White-head, 1994), and nuclide ratios were measured by accelerator mass spectrometry (AMS) at the Purdue Rare Isotope Measurement (PRIME) Laboratory at Purdue University. Samples ana-lyzed for 10Be analysis were spiked with either a commercial 1000 ppm Be carrier or a carrier produced at Arizona State University (ASU) containing lower levels of background 10Be. We measured native Al concentrations for each sample using a Thermo iCAP6300 inductively coupled plasma–optical emission spectrom-eter (ICP-OES) at Arizona State University’s Goldwater Environmental Laboratory. Table 1 reports our analytical results.
RESULTS AND DISCUSSION
Upland Erosion Rates from the Pliocene to the Present
Quaternary Upland Erosion Rates versus Modern Topography
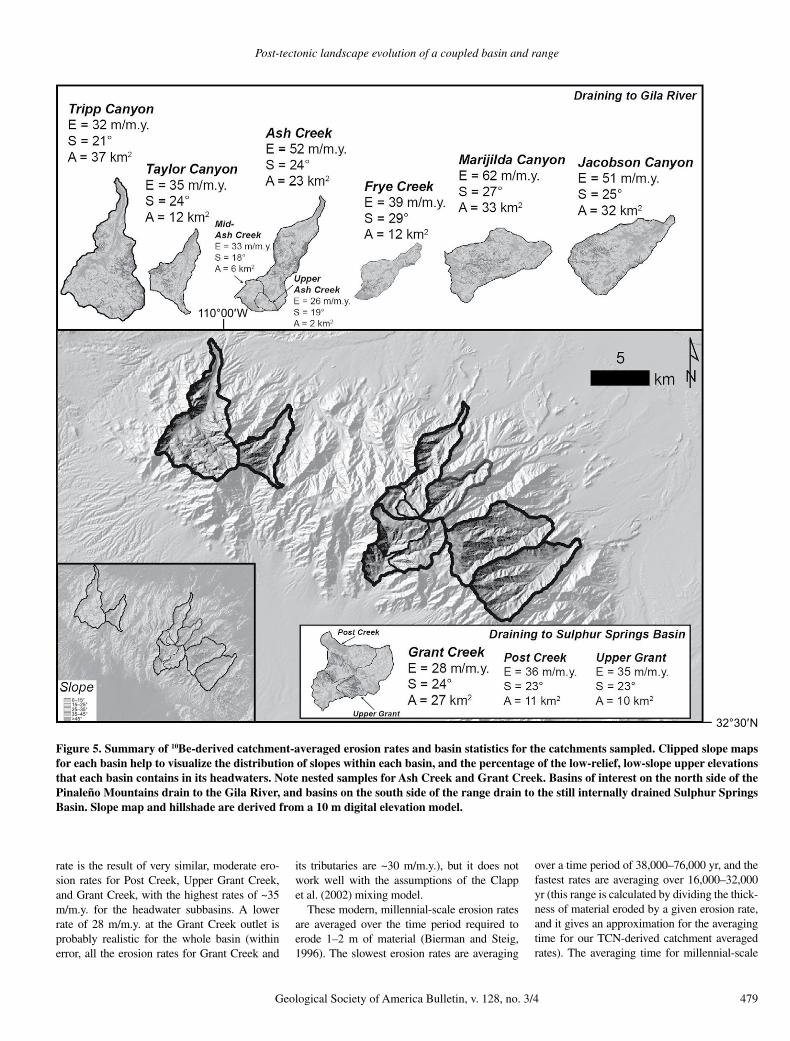
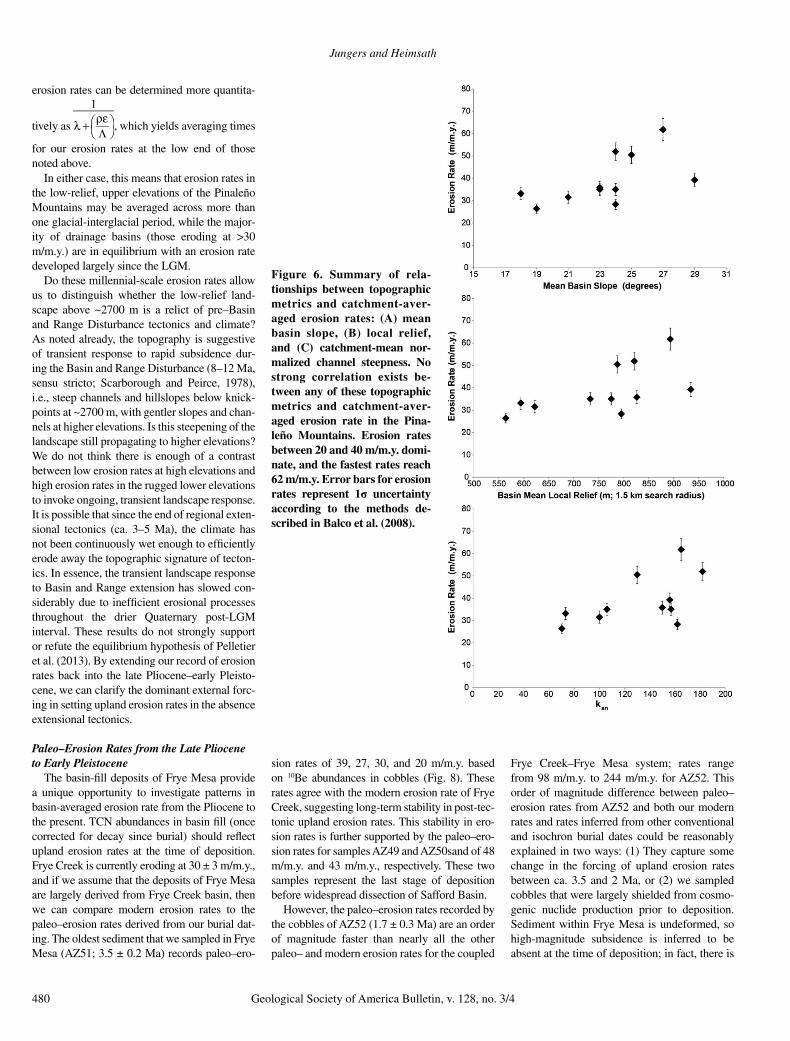
Despite their rugged appearance, the Pina-leño Mountains are not eroding as quickly as high-relief ranges in active tectonic settings (e.g., DiBiase et al., 2010). Erosion rates in the Pinaleño Mountains range from 26 ± 2 m/m.y. to 62 ± 5 m/m.y. (Fig. 5). The lowest rates are from the small catchments draining the low-relief topography of Ash Creek’s headwaters. No strong correlation exists between catchment-averaged erosion rate and mean basin slope, local relief, or catchment-mean ksn (Fig. 6). A similar range of mean basin slopes and ksn in the San Gabriel Mountains of California is charac-
teristic of erosion rates that span three orders of magnitude, with catchment-averaged erosion rates ranging from tens to hundreds to thousands of meters per million years (DiBiase et al., 2010). In the San Gabriel Mountains, this range of erosion rates and the associated range of topographic metrics that characterize the land-scape are a function of an uplift gradient across the range. The lowest erosion rates in the San Gabriel Mountains are contained within a low-relief portion of the range that may preserve a relict patch of the landscape that is un adjusted to faster erosion rates that exist below the bound-ing knick zones.
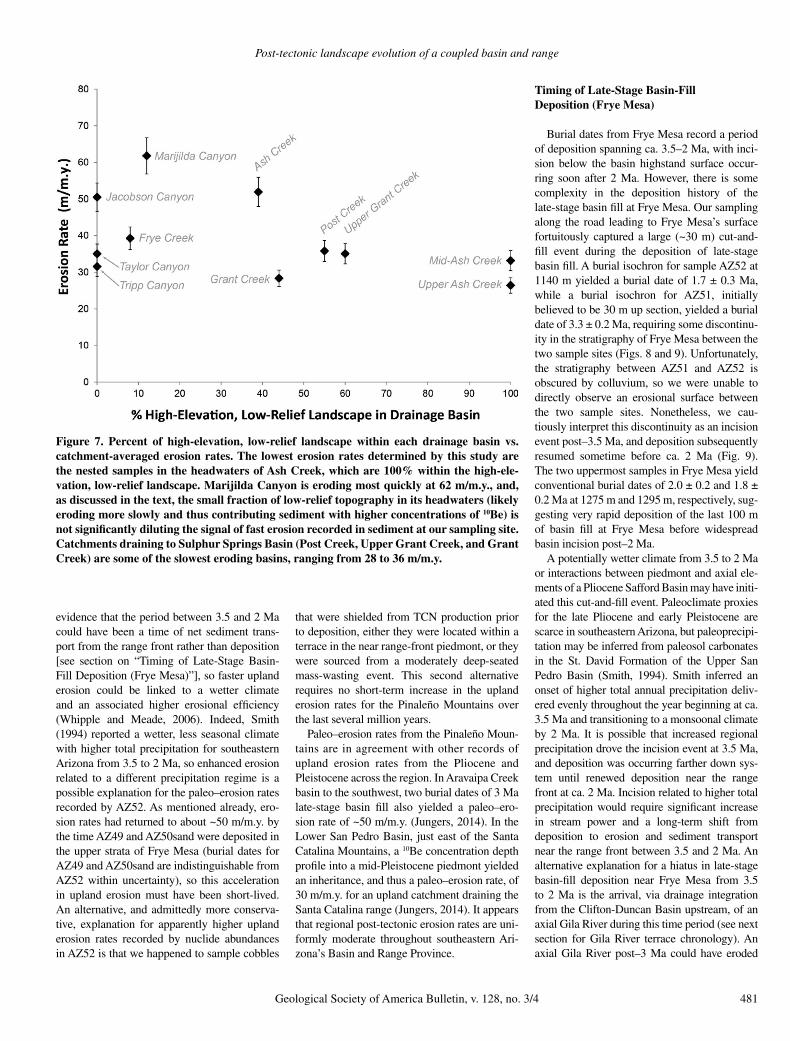
Our nested samples within the headwaters of Ash Creek and Grant Creek allow for a first-order investigation regarding whether the low-relief surface above 2700 m is a similar relict landscape preserved in the Pinaleño Mountains. In Ash Creek, our samples that capture sedi-ment shed only from the low-relief portions of the catchment are twofold slower than the ero-sion rates from the outlet sample, which also captures the lower-elevation, steeper portions of Ash Creek (Figs. 5 and 7). This difference in erosion rates may suggest a pulse of transient erosion that steepened channels and hillslopes (and accelerated erosion) below 2700 m, but which has not affected the highest elevations of the range. In contrast, there is no significant dif-ference between erosion rates in the low-relief portions of Grant Creek versus the steeper, lower sections of the catchment, lending some support to the model of Pelletier et al. (2013), which suggests that the transition to gentler, soil-mantled slopes at high elevations in the Pinaleño Mountains is a nonlinear function related to temperature and precipitation gradi-ents with increasing elevation. To fully untangle this problem of what produced the contrasting morphologies above and below ~2700 m, a high-resolution quantification of soil production rates must be undertaken within both the low-relief and high-relief portions of the Pinaleño Mountains (e.g., Heimsath et al., 2012; Larsen et al., 2014), which is beyond the scope of this study. Transient steepening in the uplands in response to base-level fall on the Gila River does not appear to be important for the morphol-ogy of the range’s bedrock core, since channels draining to the unintegrated Sulphur Springs Basin also display transient long profiles, and catchment-averaged erosion rates are compara-bly slow on both the north and south sides of the Pinaleño Mountains.
The twofold difference in erosion rates between headwater and outlet samples in Ash Creek requires an evaluation of the effect that patches of low relief above 2700 m may have on catchment-averaged erosion rates in the Pina-
leño Mountains (cf. Binnie et al., 2006). Our nested samples within Ash Creek that reveal the contrast in erosion rates also allow for a simple sensitivity analysis. Adapting the approach of Clapp et al. (2002, their Table 4), we converted our catchment-averaged erosion rates for AZ40 (mixing both low-relief headwaters and steeper lower elevations) and AZ37 (100% within lower-relief landscape above ~2700 m) into mass fluxes and solved for a 10Be erosion-weighted average nuclide concentration for the landscape between AZ37 and AZ40. Using a density of 2.5 g/cm3 to convert erosion rates to mass fluxes and then multiplying by basin or subbasin area, we find that 2.99 × 10⁶ kg/yr is expected at AZ40, over the averaging time scale of cosmogenic nuclides. Following the same approach, the basin above AZ37 delivers 4.56 × 10⁵ kg/yr to the broader Ash Creek basin, which is 15% of the total mass flux for the catchment. Multiply-ing the measured concentration for AZ37 by this percentage of total mass provides a 10Be erosion-weighted average of 1.00 × 10⁵ atoms/g for the headwater subbasin of Ash Creek. Sub-tracting this erosion-weighted average from the measured concentration at AZ40 (3.09 × 10⁵ atoms/g) yields a 10Be erosion-weighted average of 2.09 × 10⁵ atoms/g for the rugged landscape between AZ37 and AZ40. Correcting for the fact that this lower portion of Ash Creek should be providing 85% of the total mass to AZ40, we infer that, on average, the steep landscape below AZ37 is contributing sediment with an average 10Be concentration of ~2.46 × 10⁵ atoms/g. This concentration suggests an erosion rate of 60–70 m/m.y. for the steep portion of Ash Creek, i.e., slightly higher than the rate inferred from mixed 10Be concentrations for the whole catch-ment (AZ40), which incorporates sediment from the slowly eroding headwaters. Notably, this rate for the steep portion of Ash Creek is in agreement with the high end of catchment-averaged erosion rates for the Pinaleño Moun-tains determined for Marijilda Canyon (AZ35). Of the steep catchments on the north side of the range (AZ35, AZ39, AZ40, AZ42), Ash Creek has the highest percentage of upper-elevation, low-relief landscape within its drainage basin, so we can infer that the effects of higher 10Be concentration sediment delivered from low-relief headwaters in Frye Creek and Marijilda Canyon will be minimal. Jacobson Canyon does not contain an appreciable amount of the upper-elevation, low-relief landscape within its boundaries. Application of the same approach outlined here to Grant Creek and its headwater tributaries on the south side of the range requires an un realisti cally low erosion rate of between 1 and 2 m/m.y. for the steep landscape between AZ53/AZ54 and AZ55. This unrealistically low
Jungers and Heimsath
478 Geological Society of America Bulletin, v. 128, no. 3/4
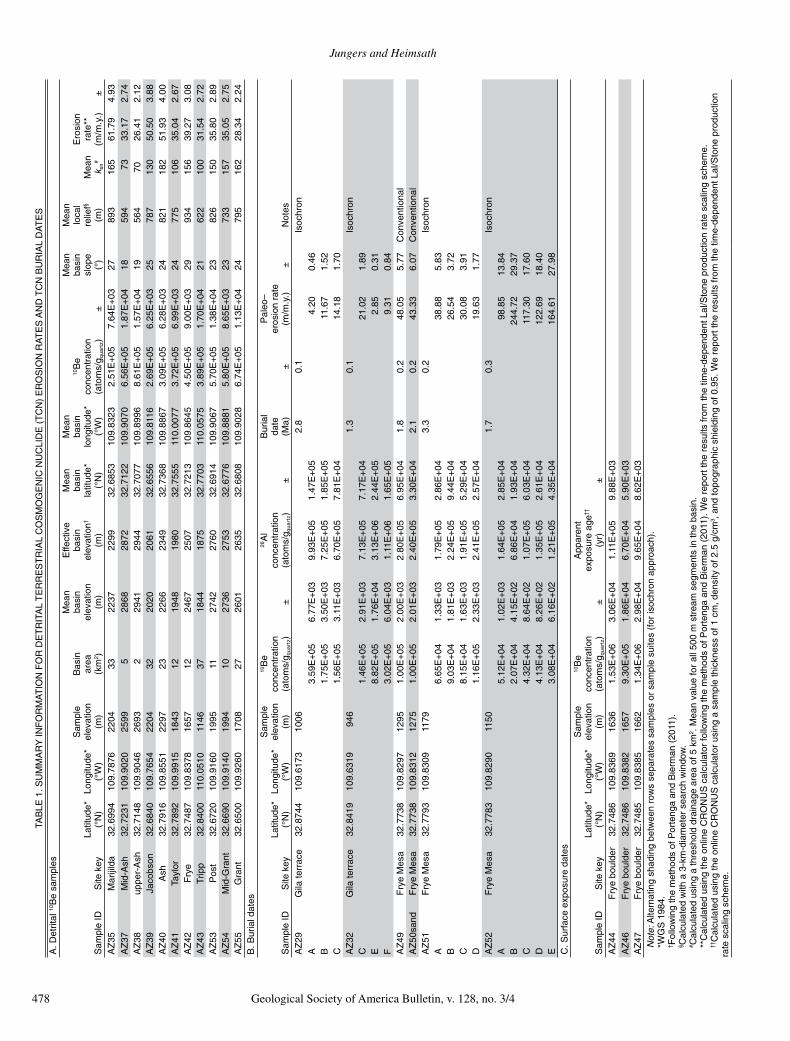
TAB
LE 1
. SU
MM
AR
Y IN
FO
RM
AT
ION
FO
R D
ET
RIT
AL
TE
RR
ES
TR
IAL
CO
SM
OG
EN
IC N
UC
LID
E (
TC
N)
ER
OS
ION
RA
TE
S A
ND
TC
N B
UR
IAL
DA
TE
S
A. D
etrit
al 10
Be
sam
ples
Sam
ple
IDS
ite k
eyLa
titud
e*(°
N)
Long
itude
*(°
W)
Sam
ple
elev
atio
n(m
)
Bas
in
area
(km
2 )
Mea
n ba
sin
elev
atio
n(m
)
Effe
ctiv
e ba
sin
elev
atio
n†
(m)
Mea
n ba
sin
latit
ude*
(°N
)
Mea
n ba
sin
long
itude
*(°
W)
10B
e co
ncen
trat
ion
(ato
ms/
g qua
rtz)
±
Mea
n ba
sin
slop
e(°
)
Mea
n lo
cal
relie
f§
(m)
Mea
n k s
n#
Ero
sion
ra
te**
(m/m
.y.)
±A
Z35
Mar
ijild
a32
.699
410
9.78
7622
0433
2237
2299
32.6
853
109.
8323
2.51
E+
057.
64E
+03
2789
316
561
.79
4.93
AZ
37M
id-A
sh32
.723
110
9.90
2025
995
2868
2872
32.7
122
109.
9070
6.56
E+
051.
87E
+04
1859
473
33.1
72.
74A
Z38
uppe
r-A
sh32
.714
810
9.90
4626
932
2941
2944
32.7
077
109.
8996
8.61
E+
051.
57E
+04
1956
470
26.4
12.
12A
Z39
Jaco
bson
32.6
840
109.
7654
2204
3220
2020
6132
.655
610
9.81
162.
69E
+05
6.25
E+
0325
787
130
50.5
03.
88A
Z40
Ash
32.7
916
109.
8551
2297
2322
6623
4932
.736
810
9.88
673.
09E
+05
6.28
E+
0324
821
182
51.9
34.
00A
Z41
Tayl
or32
.789
210
9.99
1518
4312
1948
1980
32.7
555
110.
0077
3.72
E+
056.
99E
+03
2477
510
635
.04
2.67
AZ
42F
rye
32.7
487
109.
8378
1657
1224
6725
0732
.721
310
9.86
454.
50E
+05
9.00
E+
0329
934
156
39.2
73.
08A
Z43
Trip
p32
.840
011
0.05
1011
4637
1844
1875
32.7
703
110.
0575
3.89
E+
051.
70E
+04
2162
210
031
.54
2.72
AZ
53P
ost
32.6
720
109.
9160
1995
1127
4227
6032
.691
410
9.90
675.
70E
+05
1.38
E+
0423
826
150
35.8
02.
89A
Z54
Mid
-Gra
nt32
.669
010
9.91
4019
9410
2736
2753
32.6
776
109.
8881
5.80
E+
058.
65E
+03
2373
315
735
.05
2.75
AZ
55G
rant
32.6
500
109.
9260
1708
2726
0126
3532
.680
810
9.90
286.
74E
+05
1.13
E+
0424
795
162
28.3
42.
24B
. Bur
ial d
ates
Sam
ple
IDS
ite k
eyLa
titud
e*(°
N)
Long
itude
*(°
W)
Sam
ple
elev
atio
n(m
)
10B
e co
ncen
trat
ion
(ato
ms/
g qua
rtz)
±
26A
l co
ncen
trat
ion
(ato
ms/
g qua
rtz)
±
Bur
ial
date
(Ma)
±
Pal
eo–
eros
ion
rate
(m/m
.y.)
±N
otes
AZ
29G
ila te
rrac
e32
.874
410
9.61
7310
062.
80.
1Is
ochr
onA
3.59
E+
056.
77E
+03
9.93
E+
051.
47E
+05
4.20
0.46
B1.
75E
+05
3.50
E+
037.
25E
+05
1.85
E+
0511
.67
1.52
C1.
56E
+05
3.11
E+
036.
70E
+05
7.81
E+
0414
.18
1.70
AZ
32G
ila te
rrac
e32
.841
910
9.63
1994
61.
30.
1Is
ochr
onC
1.46
E+
052.
91E
+03
7.13
E+
057.
17E
+04
21.0
21.
89E
8.82
E+
051.
76E
+04
3.13
E+
062.
44E
+05
2.85
0.31
F3.
02E
+05
6.04
E+
031.
11E
+06
1.65
E+
059.
310.
84A
Z49
Fry
e M
esa
32.7
738
109.
8297
1295
1.00
E+
052.
00E
+03
2.80
E+
056.
95E
+04
1.8
0.2
48.0
55.
77C
onve
ntio
nal
AZ
50sa
ndF
rye
Mes
a32
.773
810
9.83
1212
751.
00E
+05
2.01
E+
032.
40E
+05
3.30
E+
042.
10.
243
.33
6.07
Con
vent
iona
lA
Z51
Fry
e M
esa
32.7
793
109.
8309
1179
3.3
0.2
Isoc
hron
A6.
65E
+04
1.33
E+
031.
79E
+05
2.86
E+
0438
.88
5.83
B9.
03E
+04
1.81
E+
032.
24E
+05
9.44
E+
0426
.54
3.72
C8.
15E
+04
1.63
E+
031.
91E
+05
5.29
E+
0430
.08
3.91
D1.
16E
+05
2.33
E+
032.
41E
+05
2.57
E+
0419
.63
1.77
AZ
52F
rye
Mes
a32
.778
310
9.82
9011
501.
70.
3Is
ochr
onA
5.12
E+
041.
02E
+03
1.64
E+
052.
85E
+04
98.8
513
.84
B2.
07E
+04
4.15
E+
026.
86E
+04
1.93
E+
0424
4.72
29.3
7C
4.32
E+
048.
64E
+02
1.07
E+
056.
03E
+04
117.
3017
.60
D4.
13E
+04
8.26
E+
021.
35E
+05
2.61
E+
0412
2.69
18.4
0E
3.08
E+
046.
16E
+02
1.21
E+
054.
35E
+04
164.
6127
.98
C. S
urfa
ce e
xpos
ure
date
s
Sam
ple
IDS
ite k
eyLa
titud
e*(°
N)
Long
itude
*(°
W)
Sam
ple
elev
atio
n(m
)
10B
e co
ncen
trat
ion
(ato
ms/
g qua
rtz)
±
App
aren
t ex
posu
re a
ge††
(yr)
±A
Z44
Fry
e bo
ulde
r32
.748
610
9.83
6916
361.
53E
+06
3.06
E+
041.
11E
+05
9.88
E+
03A
Z46
Fry
e bo
ulde
r32
.748
610
9.83
8216
579.
30E
+05
1.86
E+
046.
70E
+04
5.90
E+
03A
Z47
Fry
e bo
ulde
r32
.748
510
9.83
8516
621.
34E
+06
2.98
E+
049.
65E
+04
8.62
E+
03N
ote:
Alte
rnat
ing
shad
ing
betw
een
row
s se
para
tes
sam
ples
or
sam
ple
suite
s (f
or is
ochr
on a
ppro
ach)
.*W
GS
198
4.† F
ollo
win
g th
e m
etho
ds o
f Por
teng
a an
d B
ierm
an (
2011
).§ C
alcu
late
d w
ith a
3-k
m-d
iam
eter
sea
rch
win
dow
.# C
alcu
late
d us
ing
a th
resh
old
drai
nage
are
a of
5 k
m2 .
Mea
n va
lue
for
all 5
00m
str
eam
seg
men
ts in
the
basi
n.**
Cal
cula
ted
usin
g th
e on
line
CR
ON
US
cal
cula
tor
follo
win
g th
e m
etho
ds o
f Por
teng
a an
d B
ierm
an (
2011
). W
e re
port
the
resu
lts fr
om th
e tim
e-de
pend
ent L
al/S
tone
pro
duct
ion
rate
sca
ling
sche
me.
††C
alcu
late
d us
ing
the
onlin
e C
RO
NU
S c
alcu
lato
r us
ing
a sa
mpl
e th
ickn
ess
of 1
cm, d
ensi
ty o
f 2.5
g/c
m3 ,
and
topo
grap
hic
shie
ldin
g of
0.9
5. W
e re
port
the
resu
lts fr
om th
e tim
e-de
pend
ent L
al/S
tone
pro
duct
ion
rate
sca
ling
sche
me.
Post-tectonic landscape evolution of a coupled basin and range
Geological Society of America Bulletin, v. 128, no. 3/4 479
rate is the result of very similar, moderate ero-sion rates for Post Creek, Upper Grant Creek, and Grant Creek, with the highest rates of ~35 m/m.y. for the headwater subbasins. A lower rate of 28 m/m.y. at the Grant Creek outlet is probably realistic for the whole basin (within error, all the erosion rates for Grant Creek and
its tributaries are ~30 m/m.y.), but it does not work well with the assumptions of the Clapp et al. (2002) mixing model.
These modern, millennial-scale erosion rates are averaged over the time period required to erode 1–2 m of material (Bierman and Steig, 1996). The slowest erosion rates are averaging
over a time period of 38,000–76,000 yr, and the fastest rates are averaging over 16,000–32,000 yr (this range is calculated by dividing the thick-ness of material eroded by a given erosion rate, and it gives an approximation for the averaging time for our TCN-derived catchment averaged rates). The averaging time for millennial-scale
110°00′W
32°30′N
0–15°15–25°25–35°35–45°>45°
Figure 5. Summary of 10Be-derived catchment-averaged erosion rates and basin statistics for the catchments sampled. Clipped slope maps for each basin help to visualize the distribution of slopes within each basin, and the percentage of the low-relief, low-slope upper elevations that each basin contains in its headwaters. Note nested samples for Ash Creek and Grant Creek. Basins of interest on the north side of the Pinaleño Mountains drain to the Gila River, and basins on the south side of the range drain to the still internally drained Sulphur Springs Basin. Slope map and hillshade are derived from a 10 m digital elevation model.
Jungers and Heimsath
480 Geological Society of America Bulletin, v. 128, no. 3/4
erosion rates can be determined more quantita-
tively as
1
λ + ρεΛ
, which yields averaging times
for our erosion rates at the low end of those noted above.
In either case, this means that erosion rates in the low-relief, upper elevations of the Pinaleño Mountains may be averaged across more than one glacial-interglacial period, while the major-ity of drainage basins (those eroding at >30 m/m.y.) are in equilibrium with an erosion rate developed largely since the LGM.
Do these millennial-scale erosion rates allow us to distinguish whether the low-relief land-scape above ~2700 m is a relict of pre–Basin and Range Disturbance tectonics and climate? As noted already, the topography is suggestive of transient response to rapid subsidence dur-ing the Basin and Range Disturbance (8–12 Ma, sensu stricto; Scarborough and Peirce, 1978), i.e., steep channels and hillslopes below knick-points at ~2700 m, with gentler slopes and chan-nels at higher elevations. Is this steepening of the landscape still propagating to higher elevations? We do not think there is enough of a contrast between low erosion rates at high elevations and high erosion rates in the rugged lower elevations to invoke ongoing, transient landscape response. It is possible that since the end of regional exten-sional tectonics (ca. 3–5 Ma), the climate has not been continuously wet enough to efficiently erode away the topographic signature of tecton-ics. In essence, the transient landscape response to Basin and Range extension has slowed con-siderably due to inefficient erosional processes throughout the drier Quaternary post-LGM interval. These results do not strongly support or refute the equilibrium hypothesis of Pelletier et al. (2013). By extending our record of erosion rates back into the late Pliocene–early Pleisto-cene, we can clarify the dominant external forc-ing in setting upland erosion rates in the absence extensional tectonics.
Paleo–Erosion Rates from the Late Pliocene to Early Pleistocene
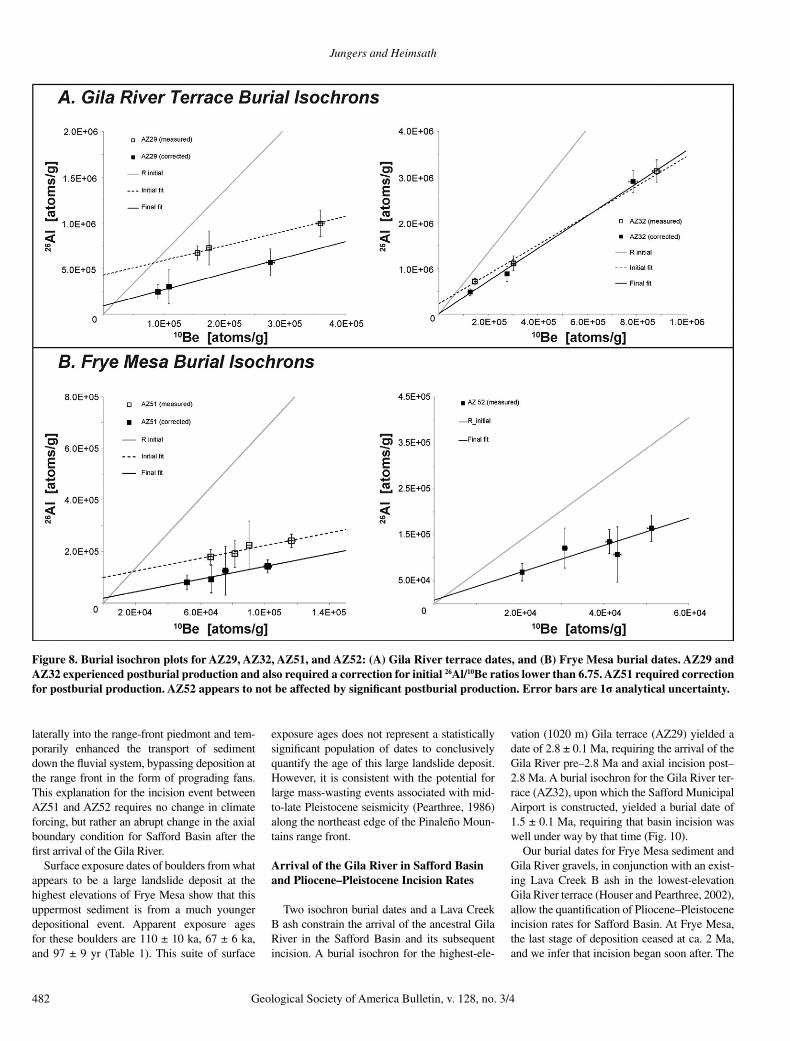
The basin-fill deposits of Frye Mesa provide a unique opportunity to investigate patterns in basin-averaged erosion rate from the Pliocene to the present. TCN abundances in basin fill (once corrected for decay since burial) should reflect upland erosion rates at the time of deposition. Frye Creek is currently eroding at 30 ± 3 m/m.y., and if we assume that the deposits of Frye Mesa are largely derived from Frye Creek basin, then we can compare modern erosion rates to the paleo–erosion rates derived from our burial dat-ing. The oldest sediment that we sampled in Frye Mesa (AZ51; 3.5 ± 0.2 Ma) records paleo–ero-
sion rates of 39, 27, 30, and 20 m/m.y. based on 10Be abundances in cobbles (Fig. 8). These rates agree with the modern erosion rate of Frye Creek, suggesting long-term stability in post-tec-tonic upland erosion rates. This stability in ero-sion rates is further supported by the paleo–ero-sion rates for samples AZ49 and AZ50sand of 48 m/m.y. and 43 m/m.y., respectively. These two samples represent the last stage of deposition before widespread dissection of Safford Basin.
However, the paleo–erosion rates recorded by the cobbles of AZ52 (1.7 ± 0.3 Ma) are an order of magnitude faster than nearly all the other paleo– and modern erosion rates for the coupled
Frye Creek–Frye Mesa system; rates range from 98 m/m.y. to 244 m/m.y. for AZ52. This order of magnitude difference between paleo–erosion rates from AZ52 and both our modern rates and rates inferred from other conventional and isochron burial dates could be reasonably explained in two ways: (1) They capture some change in the forcing of upland erosion rates between ca. 3.5 and 2 Ma, or (2) we sampled cobbles that were largely shielded from cosmo-genic nuclide production prior to deposition. Sediment within Frye Mesa is undeformed, so high-magnitude subsidence is inferred to be absent at the time of deposition; in fact, there is
Figure 6. Summary of rela-tionships between topographic metrics and catchment-aver-aged erosion rates: (A) mean basin slope, (B) local relief, and (C) catchment-mean nor-malized channel steepness. No strong correlation exists be-tween any of these topographic metrics and catchment-aver-aged erosion rate in the Pina-leño Mountains. Erosion rates between 20 and 40 m/m.y. domi-nate, and the fastest rates reach 62 m/m.y. Error bars for erosion rates represent 1σ uncertainty according to the methods de-scribed in Balco et al. (2008).
Post-tectonic landscape evolution of a coupled basin and range
Geological Society of America Bulletin, v. 128, no. 3/4 481
evidence that the period between 3.5 and 2 Ma could have been a time of net sediment trans-port from the range front rather than deposition [see section on “Timing of Late-Stage Basin-Fill Deposition (Frye Mesa)”], so faster upland erosion could be linked to a wetter climate and an associated higher erosional efficiency (Whipple and Meade, 2006). Indeed, Smith (1994) reported a wetter, less seasonal climate with higher total precipitation for southeastern Arizona from 3.5 to 2 Ma, so enhanced erosion related to a different precipitation regime is a possible explanation for the paleo–erosion rates recorded by AZ52. As mentioned already, ero-sion rates had returned to about ~50 m/m.y. by the time AZ49 and AZ50sand were deposited in the upper strata of Frye Mesa (burial dates for AZ49 and AZ50sand are indistinguishable from AZ52 within uncertainty), so this acceleration in upland erosion must have been short-lived. An alternative, and admittedly more conserva-tive, explanation for apparently higher upland erosion rates recorded by nuclide abundances in AZ52 is that we happened to sample cobbles
that were shielded from TCN production prior to deposition, either they were located within a terrace in the near range-front piedmont, or they were sourced from a moderately deep-seated mass-wasting event. This second alternative requires no short-term increase in the upland erosion rates for the Pinaleño Mountains over the last several million years.
Paleo–erosion rates from the Pinaleño Moun-tains are in agreement with other records of upland erosion rates from the Pliocene and Pleistocene across the region. In Aravaipa Creek basin to the southwest, two burial dates of 3 Ma late-stage basin fill also yielded a paleo–ero-sion rate of ~50 m/m.y. (Jungers, 2014). In the Lower San Pedro Basin, just east of the Santa Catalina Mountains, a 10Be concentration depth profile into a mid-Pleistocene piedmont yielded an inheritance, and thus a paleo–erosion rate, of 30 m/m.y. for an upland catchment draining the Santa Catalina range (Jungers, 2014). It appears that regional post-tectonic erosion rates are uni-formly moderate throughout southeastern Ari-zona’s Basin and Range Province.
Timing of Late-Stage Basin-Fill Deposition (Frye Mesa)
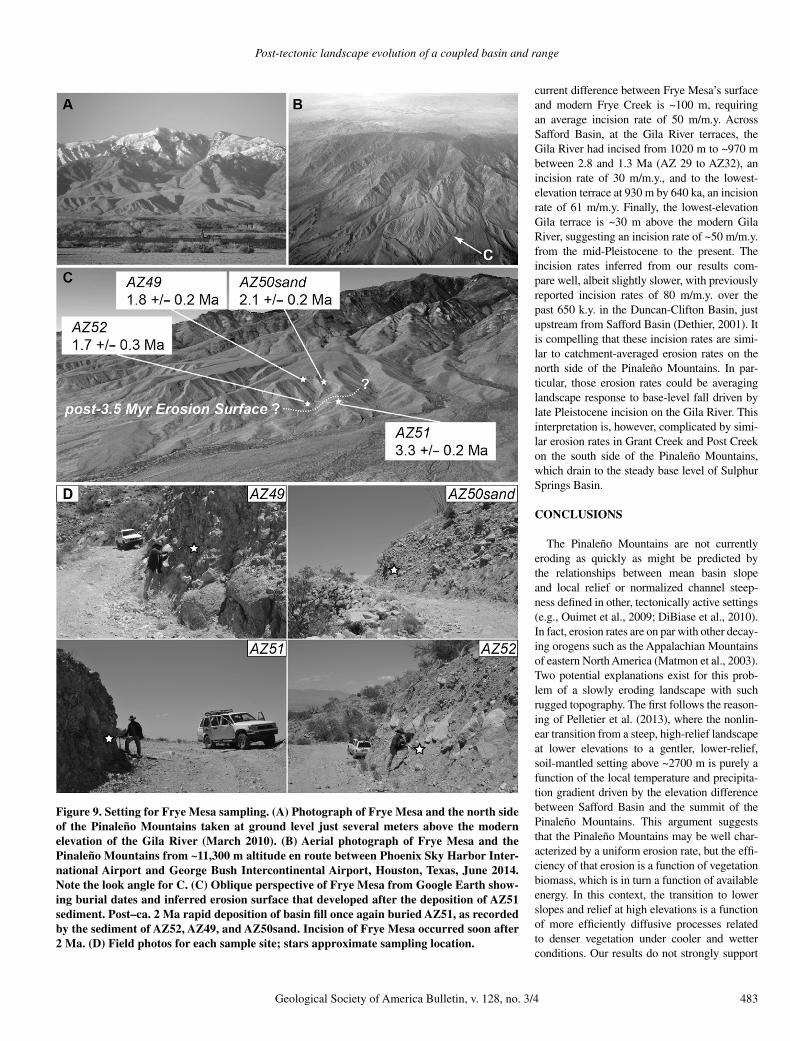
Burial dates from Frye Mesa record a period of deposition spanning ca. 3.5–2 Ma, with inci-sion below the basin highstand surface occur-ring soon after 2 Ma. However, there is some complexity in the deposition history of the late-stage basin fill at Frye Mesa. Our sampling along the road leading to Frye Mesa’s surface fortuitously captured a large (~30 m) cut-and-fill event during the deposition of late-stage basin fill. A burial isochron for sample AZ52 at 1140 m yielded a burial date of 1.7 ± 0.3 Ma, while a burial isochron for AZ51, initially believed to be 30 m up section, yielded a burial date of 3.3 ± 0.2 Ma, requiring some discontinu-ity in the stratigraphy of Frye Mesa between the two sample sites (Figs. 8 and 9). Unfortunately, the stratigraphy between AZ51 and AZ52 is obscured by colluvium, so we were unable to directly observe an erosional surface between the two sample sites. Nonetheless, we cau-tiously interpret this discontinuity as an incision event post–3.5 Ma, and deposition subsequently resumed sometime before ca. 2 Ma (Fig. 9). The two uppermost samples in Frye Mesa yield conventional burial dates of 2.0 ± 0.2 and 1.8 ± 0.2 Ma at 1275 m and 1295 m, respectively, sug-gesting very rapid deposition of the last 100 m of basin fill at Frye Mesa before widespread basin incision post–2 Ma.
A potentially wetter climate from 3.5 to 2 Ma or interactions between piedmont and axial ele-ments of a Pliocene Safford Basin may have initi-ated this cut-and-fill event. Paleoclimate proxies for the late Pliocene and early Pleistocene are scarce in southeastern Arizona, but paleoprecipi-tation may be inferred from paleosol carbonates in the St. David Formation of the Upper San Pedro Basin (Smith, 1994). Smith inferred an onset of higher total annual precipitation deliv-ered evenly throughout the year beginning at ca. 3.5 Ma and transitioning to a monsoonal climate by 2 Ma. It is possible that increased regional precipitation drove the incision event at 3.5 Ma, and deposition was occurring farther down sys-tem until renewed deposition near the range front at ca. 2 Ma. Incision related to higher total precipitation would require significant increase in stream power and a long-term shift from deposition to erosion and sediment transport near the range front between 3.5 and 2 Ma. An alternative explanation for a hiatus in late-stage basin-fill deposition near Frye Mesa from 3.5 to 2 Ma is the arrival, via drainage integration from the Clifton-Duncan Basin upstream, of an axial Gila River during this time period (see next section for Gila River terrace chronology). An axial Gila River post–3 Ma could have eroded
Figure 7. Percent of high-elevation, low-relief landscape within each drainage basin vs. catchment-averaged erosion rates. The lowest erosion rates determined by this study are the nested samples in the headwaters of Ash Creek, which are 100% within the high-ele-vation, low-relief landscape. Marijilda Canyon is eroding most quickly at 62 m/m.y., and, as discussed in the text, the small fraction of low-relief topography in its headwaters (likely eroding more slowly and thus contributing sediment with higher concentrations of 10Be) is not significantly diluting the signal of fast erosion recorded in sediment at our sampling site. Catchments draining to Sulphur Springs Basin (Post Creek, Upper Grant Creek, and Grant Creek) are some of the slowest eroding basins, ranging from 28 to 36 m/m.y.
Jungers and Heimsath
482 Geological Society of America Bulletin, v. 128, no. 3/4
laterally into the range-front piedmont and tem-porarily enhanced the transport of sediment down the fluvial system, bypassing deposition at the range front in the form of prograding fans. This explanation for the incision event between AZ51 and AZ52 requires no change in climate forcing, but rather an abrupt change in the axial boundary condition for Safford Basin after the first arrival of the Gila River.
Surface exposure dates of boulders from what appears to be a large landslide deposit at the highest elevations of Frye Mesa show that this uppermost sediment is from a much younger depositional event. Apparent exposure ages for these boulders are 110 ± 10 ka, 67 ± 6 ka, and 97 ± 9 yr (Table 1). This suite of surface
exposure ages does not represent a statistically significant population of dates to conclusively quantify the age of this large landslide deposit. However, it is consistent with the potential for large mass-wasting events associated with mid-to-late Pleistocene seismicity (Pearthree, 1986) along the northeast edge of the Pinaleño Moun-tains range front.
Arrival of the Gila River in Safford Basin and Pliocene–Pleistocene Incision Rates
Two isochron burial dates and a Lava Creek B ash constrain the arrival of the ancestral Gila River in the Safford Basin and its subsequent incision. A burial isochron for the highest-ele-
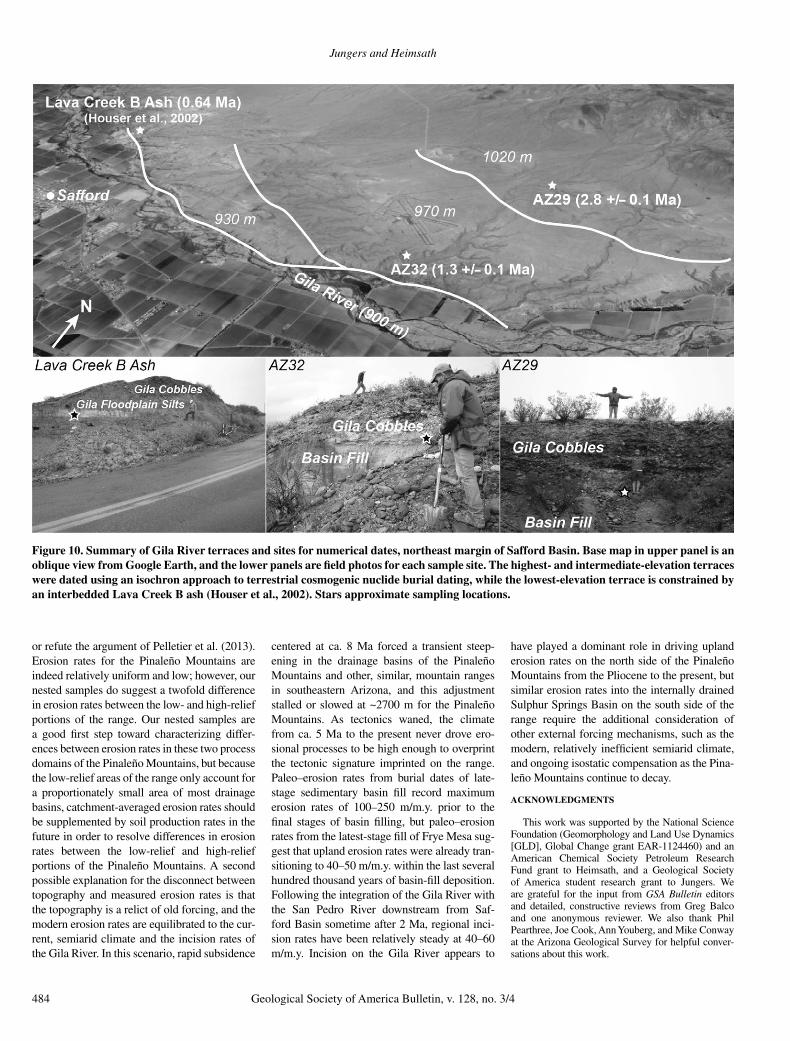
vation (1020 m) Gila terrace (AZ29) yielded a date of 2.8 ± 0.1 Ma, requiring the arrival of the Gila River pre–2.8 Ma and axial incision post–2.8 Ma. A burial isochron for the Gila River ter-race (AZ32), upon which the Safford Municipal Airport is constructed, yielded a burial date of 1.5 ± 0.1 Ma, requiring that basin incision was well under way by that time (Fig. 10).
Our burial dates for Frye Mesa sediment and Gila River gravels, in conjunction with an exist-ing Lava Creek B ash in the lowest-elevation Gila River terrace (Houser and Pearthree, 2002), allow the quantification of Pliocene–Pleistocene incision rates for Safford Basin. At Frye Mesa, the last stage of deposition ceased at ca. 2 Ma, and we infer that incision began soon after. The
Figure 8. Burial isochron plots for AZ29, AZ32, AZ51, and AZ52: (A) Gila River terrace dates, and (B) Frye Mesa burial dates. AZ29 and AZ32 experienced postburial production and also required a correction for initial 26Al/10Be ratios lower than 6.75. AZ51 required correction for postburial production. AZ52 appears to not be affected by significant postburial production. Error bars are 1σ analytical uncertainty.
Post-tectonic landscape evolution of a coupled basin and range
Geological Society of America Bulletin, v. 128, no. 3/4 483
current difference between Frye Mesa’s surface and modern Frye Creek is ~100 m, requiring an average incision rate of 50 m/m.y. Across Safford Basin, at the Gila River terraces, the Gila River had incised from 1020 m to ~970 m between 2.8 and 1.3 Ma (AZ 29 to AZ32), an incision rate of 30 m/m.y., and to the lowest-elevation terrace at 930 m by 640 ka, an incision rate of 61 m/m.y. Finally, the lowest-elevation Gila terrace is ~30 m above the modern Gila River, suggesting an incision rate of ~50 m/m.y. from the mid-Pleistocene to the present. The incision rates inferred from our results com-pare well, albeit slightly slower, with previously reported incision rates of 80 m/m.y. over the past 650 k.y. in the Duncan-Clifton Basin, just upstream from Safford Basin (Dethier, 2001). It is compelling that these incision rates are simi-lar to catchment-averaged erosion rates on the north side of the Pinaleño Mountains. In par-ticular, those erosion rates could be averaging landscape response to base-level fall driven by late Pleistocene incision on the Gila River. This interpretation is, however, complicated by simi-lar erosion rates in Grant Creek and Post Creek on the south side of the Pinaleño Mountains, which drain to the steady base level of Sulphur Springs Basin.
CONCLUSIONS
The Pinaleño Mountains are not currently eroding as quickly as might be predicted by the relationships between mean basin slope and local relief or normalized channel steep-ness defined in other, tectonically active settings (e.g., Ouimet et al., 2009; DiBiase et al., 2010). In fact, erosion rates are on par with other decay-ing orogens such as the Appalachian Mountains of eastern North America (Matmon et al., 2003). Two potential explanations exist for this prob-lem of a slowly eroding landscape with such rugged topography. The first follows the reason-ing of Pelletier et al. (2013), where the nonlin-ear transition from a steep, high-relief landscape at lower elevations to a gentler, lower-relief, soil-mantled setting above ~2700 m is purely a function of the local temperature and precipita-tion gradient driven by the elevation difference between Safford Basin and the summit of the Pinaleño Mountains. This argument suggests that the Pinaleño Mountains may be well char-acterized by a uniform erosion rate, but the effi-ciency of that erosion is a function of vegetation biomass, which is in turn a function of available energy. In this context, the transition to lower slopes and relief at high elevations is a function of more efficiently diffusive processes related to denser vegetation under cooler and wetter conditions. Our results do not strongly support
Figure 9. Setting for Frye Mesa sampling. (A) Photograph of Frye Mesa and the north side of the Pinaleño Mountains taken at ground level just several meters above the modern elevation of the Gila River (March 2010). (B) Aerial photograph of Frye Mesa and the Pinaleño Mountains from ~11,300 m altitude en route between Phoenix Sky Harbor Inter-national Airport and George Bush Intercontinental Airport, Houston, Texas, June 2014. Note the look angle for C. (C) Oblique perspective of Frye Mesa from Google Earth show-ing burial dates and inferred erosion surface that developed after the deposition of AZ51 sediment. Post–ca. 2 Ma rapid deposition of basin fill once again buried AZ51, as recorded by the sediment of AZ52, AZ49, and AZ50sand. Incision of Frye Mesa occurred soon after 2 Ma. (D) Field photos for each sample site; stars approximate sampling location.
Jungers and Heimsath
484 Geological Society of America Bulletin, v. 128, no. 3/4
or refute the argument of Pelletier et al. (2013). Erosion rates for the Pinaleño Mountains are indeed relatively uniform and low; however, our nested samples do suggest a twofold difference in erosion rates between the low- and high-relief portions of the range. Our nested samples are a good first step toward characterizing differ-ences between erosion rates in these two process domains of the Pinaleño Mountains, but because the low-relief areas of the range only account for a proportionately small area of most drainage basins, catchment-averaged erosion rates should be supplemented by soil production rates in the future in order to resolve differences in erosion rates between the low-relief and high-relief portions of the Pinaleño Mountains. A second possible explanation for the disconnect between topography and measured erosion rates is that the topography is a relict of old forcing, and the modern erosion rates are equilibrated to the cur-rent, semiarid climate and the incision rates of the Gila River. In this scenario, rapid subsidence
centered at ca. 8 Ma forced a transient steep-ening in the drainage basins of the Pinaleño Mountains and other, similar, mountain ranges in southeastern Arizona, and this adjustment stalled or slowed at ~2700 m for the Pinaleño Mountains. As tectonics waned, the climate from ca. 5 Ma to the present never drove ero-sional processes to be high enough to overprint the tectonic signature imprinted on the range. Paleo–erosion rates from burial dates of late-stage sedimentary basin fill record maximum erosion rates of 100–250 m/m.y. prior to the final stages of basin filling, but paleo–erosion rates from the latest-stage fill of Frye Mesa sug-gest that upland erosion rates were already tran-sitioning to 40–50 m/m.y. within the last several hundred thousand years of basin-fill deposition. Following the integration of the Gila River with the San Pedro River downstream from Saf-ford Basin sometime after 2 Ma, regional inci-sion rates have been relatively steady at 40–60 m/m.y. Incision on the Gila River appears to
have played a dominant role in driving upland erosion rates on the north side of the Pinaleño Mountains from the Pliocene to the present, but similar erosion rates into the internally drained Sulphur Springs Basin on the south side of the range require the additional consideration of other external forcing mechanisms, such as the modern, relatively inefficient semiarid climate, and ongoing isostatic compensation as the Pina-leño Mountains continue to decay.
ACKNOWLEDGMENTS
This work was supported by the National Science Foundation (Geomorphology and Land Use Dynamics [GLD], Global Change grant EAR-1124460) and an American Chemical Society Petroleum Research Fund grant to Heimsath, and a Geological Society of America student research grant to Jungers. We are grateful for the input from GSA Bulletin editors and detailed, constructive reviews from Greg Balco and one anonymous reviewer. We also thank Phil Pearthree, Joe Cook, Ann Youberg, and Mike Conway at the Arizona Geological Survey for helpful conver-sations about this work.
Figure 10. Summary of Gila River terraces and sites for numerical dates, northeast margin of Safford Basin. Base map in upper panel is an oblique view from Google Earth, and the lower panels are field photos for each sample site. The highest- and intermediate-elevation terraces were dated using an isochron approach to terrestrial cosmogenic nuclide burial dating, while the lowest-elevation terrace is constrained by an interbedded Lava Creek B ash (Houser et al., 2002). Stars approximate sampling locations.
Post-tectonic landscape evolution of a coupled basin and range
Geological Society of America Bulletin, v. 128, no. 3/4 485
REFERENCES CITED
Allen, B.D., 2005, Ice age lakes in New Mexico, in Lucas, S.G., Morgan, G.S., and Zeigler, K.E., eds., New Mex-ico’s Ice Ages: New Mexico Museum of Natural His-tory and Science Bulletin 28, p. 107–114.
Anderson, R.S., Repka, J.L., and Dick, G.S., 1996, Explicit treatment of inheritance in dating depositional surfaces using in situ Be-10 and Al-26: Geology, v. 24, no. 1, p. 47–51, doi: 10 .1130 /0091 -7613 (1996)024 <0047: ETOIID>2 .3 .CO;2 .
Balco, G., and Rovey, C.W., 2008, An isochron method for cosmogenic-nuclide dating of buried soils and sedi-ments: American Journal of Science, v. 308, no. 10, p. 1083–1114, doi: 10 .2475 /10 .2008 .02 .
Balco, G., Stone, J.O., Lifton, N.A., and Dunai, T.J., 2008, A complete and easily accessible means of calculating surface exposure ages or erosion rates from 10Be and 26Al measurements: Quaternary Geochronology, v. 3, no. 3, p. 174–195, doi: 10 .1016 /j .quageo .2007 .12 .001 .
Bierman, P., and Steig, E.J., 1996, Estimating rates of de-nudation using cosmogenic isotope abundances in sediment: Earth Surface Processes and Landforms, v. 21, no. 2, p. 125–139, doi: 10 .1002 / (SICI)1096 -9837 (199602)21: 2 <125: : AID -ESP511>3 .0 .CO;2 -8 .
Binnie, S.A., Phillips, W.M., Summerfield, M.A., and Keith Fifield, L., 2006, Sediment mixing and basin-wide cosmo genic nuclide analysis in rapidly eroding moun-tainous environments: Quaternary Geochronology, v. 1, no. 1, p. 4–14, doi: 10 .1016 /j .quageo .2006 .06 .013 .
Brown, E.T., Stallard, R.F., Larsen, M.C., Raisbeck, G.M., and Yiou, F., 1995, Denudation rates determined from the accumulation of in situ–produced Be-10 in the Luquillo Experimental Forest, Puerto Rico: Earth and Planetary Science Letters, v. 129, no. 1–4, p. 193–202, doi: 10 .1016 /0012 -821X (94)00249 -X .
Clapp, E.M., Bierman, P.R., and Caffee, M., 2002, Using Be-10 and Al-26 to determine sediment generation rates and identify sediment source areas in an arid re-gion drainage basin: Geomorphology, v. 45, no. 1–2, p. 89–104, doi: 10 .1016 /S0169 -555X (01)00191 -X .
Darling, A.L., Karlstrom, K.E., Granger, D.E., Aslan, A., Kirby, E., Ouimet, W.B., Lazear, G.D., Coblentz, D.D., and Cole, R.D., 2012, New incision rates along the Colorado River system based on cosmogenic burial dating of terraces: Implications for regional controls on Quaternary incision: Geosphere, v. 8, no. 5, p. 1020–1041, doi: 10 .1130 /GES00724 .1 .
Dethier, D.P., 2001, Pleistocene incision rates in the western United States calibrated using Lava Creek B tephra: Geology, v. 29, no. 9, p. 783–786.
DiBiase, R.A., Whipple, K.X., Heimsath, A.M., and Ouimet, W.B., 2010, Landscape form and millennial erosion rates in the San Gabriel Mountains, CA: Earth and Planetary Science Letters, v. 289, no. 1, p. 134–144, doi: 10 .1016 /j .epsl .2009 .10 .036 .
Dickinson, W., 1991, Tectonic Setting of Faulted Tertiary Strata Associated with the Catalina Core Complex in Southern Arizona: Geological Society of America Spe-cial Paper 264, 115 p., doi: 10 .1130 /SPE264 -p1 .
Dickinson, W.R., 2004, Evolution of the North American Cordillera: Annual Review of Earth and Planetary Sci-ences, v. 32, p. 13–45, doi: 10 .1146 /annurev .earth .32 .101802 .120257 .
Ditchburn, R.G., and Whitehead, N.E., 1994, The separa-tion of 10Be from silicates, in Third Workshop of the South Pacific Environmental Radioactivity Associa-tion: South Pacific Environmental Radioactivity Asso-ciation, p. 4–7.
Erlanger, E.D., Granger, D.E., and Gibbon, R.J., 2012, Rock uplift rates in South Africa from isochron burial dating of fluvial and marine terraces: Geology, v. 40, p. 1019–1022, doi: 10 .1130 /G33172 .1 .
Galusha, T., Johnson, N.M., Lindsay, E.H., Opdyke, N.D., and Tedford, R.H., 1984, Biostratigraphy and magneto-stratigraphy, late Pliocene rocks, 111 Ranch, Ari-zona: Geological Society of America Bulletin, v. 95, p. 714–722.
Gilbert, G., 1875, Report on the Geology of Portions of Ne-vada, California, and Arizona, Examined in the Years 1871 and 1872, in Wheeler, G.M., ed., U.S. Army Engineer Department, Report upon geographical and
geological explorations and surveys west of the one hundredth meridian, in charge of First Lieut. Geo. M. Wheeler: Volume 3, Geology. Washington, D.C.: U.S. Government Printing Office, 681 p.
Gootee, B.F., 2012, Geologic Evaluation of the Safford Basin for Carbon Dioxide Sequestration Potential: Ari-zona Geological Survey Open-File Report 12–01, 71 p.
Gosse, J.C., and Phillips, F.M., 2001, Terrestrial in situ cosmo-genic nuclides: Theory and application: Quaternary Science Reviews, v. 20, no. 14, p. 1475–1560, doi: 10 .1016 /S0277 -3791 (00)00171 -2 .
Granger, D.E., and Muzikar, P.F., 2001, Dating sediment burial with in situ–produced cosmogenic nuclides: Theory, techniques, and limitations: Earth and Plan-etary Science Letters, v. 188, no. 1–2, p. 269–281.
Granger, D.E., Kirchner, J.W., and Finkel, R., 1996, Spa-tially averaged long-term erosion rates measured from in situ–produced cosmogenic nuclides in alluvial sedi-ment: The Journal of Geology, v. 104, no. 3, p. 249–257, doi: 10 .1086 /629823 .
Granger, D.E., Kirchner, J.W., and Finkel, R.C., 1997, Qua-ternary downcutting rate of the New River, Virginia, measured from differential decay of cosmogenic 26Al and 10Be in cave- deposited alluvium: Geology, v. 25, no. 2, p. 107–110, doi: 10 .1130 /0091 -7613 (1997)025 <0107: QDROTN>2 .3 .CO;2 .
Halvorsen, W.L., Thomas, K., and Graham, L., 2001, Ari-zona Gap Project Final Report: USGS Sonoran Desert Field Station: Tucson, Arizona, University of Arizona, 166 p.
Heimsath, A.M., DiBiase, R.A., and Whipple, K.X., 2012, Soil production limits and the transition to bedrock-dominated landscapes: Nature Geoscience, v. 5, no. 3, p. 210–214, doi: 10 .1038 /ngeo1380 .
Heindl, L., 1958, Cenozoic Alluvial Deposits of the Upper Gila River Area, New Mexico and Arizona [Ph.D. dis-sertation]: Tucson, Arizona, University of Arizona, 249 p.
Heindl, L.A., 1962, Should the term, “Gila Conglomerate” be abandoned?: Arizona Geological Society Digest, v. 5, p. 73–88.
Heisinger, B., Lal, D., Jull, A., Kubik, P., Ivy-Ochs, S., Knie, K., and Nolte, E., 2002a, Production of selected cosmogenic radionuclides by muons: 2. Capture of negative muons: Earth and Planetary Science Letters, v. 200, no. 3, p. 357–369, doi: 10 .1016 /S0012 -821X (02)00641 -6 .
Heisinger, B., Lal, D., Jull, A., Kubik, P., Ivy-Ochs, S., Neu-maier, S., Knie, K., Lazarev, V., and Nolte, E., 2002b, Production of selected cosmogenic radionuclides by muons: 1. Fast muons: Earth and Planetary Science Letters, v. 200, no. 3, p. 345–355, doi: 10 .1016 /S0012 -821X (02)00640 -4 .
Holmgren, C.A., Betancourt, J.L., and Rylander, K.A., 2006, A 36,000-yr vegetation history from the Peloncillo Mountains, southeastern Arizona, USA: Palaeogeogra-phy, Palaeoclimatology, Palaeoecology, v. 240, no. 3, p. 405–422, doi: 10 .1016 /j .palaeo .2006 .02 .017 .
Houser, B.B., Richter, D.H., and Shafiqullah, M., 1985, Geologic Map of the Safford Quadrangle, Graham County, Arizona: U.S. Geological Survey Miscella-neous Investigation Map I-1617, scale 1:48,000.
Houser, B.B., Pearthree, P.A., Homburg, J.A., and Thrasher, L.C., eds., 2002, Friends of the Pleistocene, Rocky Mountain Cell 46th Field Conference, and Arizona Geological Society Fall Field Trip: 83 p.
Jungers, M.C., 2014, Post-Tectonic Landscape Evolution of Sedimentary Basins in Southeastern Arizona and Northern Chile [Ph.D. dissertation]: Tempe, Arizona, Arizona State University, 192 p.
Kohl, C., and Nishiizumi, K., 1992, Chemical isolation of quartz for measurement of in situ– produced cosmo-genic nuclides: Geochimica et Cosmochimica Acta, v. 56, no. 9, p. 3583–3587, doi: 10 .1016 /0016 -7037 (92)90401 -4 .
Kruger, J.M., 1991, Seismic Crustal Structure beneath the Safford Basin and Pinaleño Mountains: Implications for Cenozoic Extension and Metamorphic Core Com-plex Uplift in SE Arizona [Ph.D. dissertation]: Tucson, Arizona, University of Arizona, 158 p.
Lal, D., 1991, Cosmic-ray labeling of erosion surfaces—In situ nuclide production-rates and erosion models:
Earth and Planetary Science Letters, v. 104, no. 2–4, p. 424–439, doi: 10 .1016 /0012 -821X (91)90220 -C .
Larsen, I.J., Almond, P.C., Eger, A., Stone, J.O., Mont-gomery, D.R., and Malcolm, B., 2014, Rapid soil production and weathering in the Southern Alps, New Zealand: Science, v. 343, no. 6171, p. 637–640, doi: 10 .1126 /science .1244908 .
Martin, P.S., 1963, Geochronology of pluvial Lake Cochise, southern Arizona. II. Pollen analysis of a 42-meter core: Ecology, v. 44, p. 436–444, doi: 10 .2307 /1932522 .
Matmon, A., Bierman, P.R., Larsen, J., Southworth, S., Pavich, M., and Caffee, M., 2003, Temporally and spatially uniform rates of erosion in the southern Appa-lachian Great Smoky Mountains: Geology, v. 31, no. 2, p. 155–158, doi: 10 .1130 /0091 -7613 (2003)031 <0155: TASURO>2 .0 .CO;2 .
Melton, M., 1965, The geomorphic and paleoclimatic sig-nificance of alluvial deposits in southern Arizona: The Journal of Geology, v. 73, no. 1, p. 1–38, doi: 10 .1086 /627044 .
Menges, C., and McFadden, L., 1981, Evidence for a lat-est Miocene to Pliocene transition from Basin-Range tectonic to post-tectonic landscape evolution in south-eastern Arizona: Arizona Geological Society Digest, v. 13, p. 151–160.
Menges, C., and Pearthree, P., 1989, Late Cenozoic tec-tonism in Arizona and its impact on regional landscape evolution: Geologic evolution of Arizona: Arizona Geological Society Digest, v. 17, p. 649–680.
Menking, K.M., Anderson, R.Y., Shafike, N.G., Syed, K.H., and Allen, B.D., 2004, Wetter or colder during the Last Glacial Maximum? Revisiting the pluvial lake question in southwestern North America: Quaternary Research, v. 62, no. 3, p. 280–288, doi: 10 .1016 /j .yqres .2004 .07 .005 .
Mitchell, S.G., and Ober, K.A., 2013, Evolution of Scaphi-notus petersi (Coleoptera: Carabidae) and the role of climate and geography in the Madrean sky islands of southeastern Arizona, USA: Quaternary Research, v. 79, no. 2, p. 274–283, doi: 10 .1016 /j .yqres .2012 .11 .001 .
Morrison, R., 1985, Pliocene/Quaternary geology, geomor-phology, and tectonics of Arizona, in Weide, D.L., ed., Soils and Quaternary Geology of the Southwestern United States: Geological Society of America Special Paper 203, p. 123–146, doi: 10 .1130 /SPE203 -p123 .
Ouimet, W.B., Whipple, K.X., and Granger, D.E., 2009, Beyond threshold hillslopes: Channel adjustment to base-level fall in tectonically active mountain ranges: Geology, v. 37, p. 579–582, doi: 10 .1130 /G30013A .1 .
Pearthree, P.A., 1986, Late Quaternary Faulting and Seismic Hazard in Southeastern Arizona and Adjacent Portions of New Mexico and Sonora, Mexico: Arizona Bureau of Geology and Mineral Technology Open-File Report 86–8, 22 p.
Pelletier, J.D., Barron-Gafford, G.A., Breshears, D.D., Brooks, P.D., Chorover, J., Durcik, M., Harman, C.J., Huxman, T.E., Lohse, K.A., and Lybrand, R., 2013, Coevolution of nonlinear trends in vegetation, soils, and topography with elevation and slope aspect: A case study in the sky islands of southern Arizona: Journal of Geophysical Research–Earth Surface, v. 118, no. 2, p. 741–758.
Pigati, J.S., Bright, J.E., Shanahan, T.M., and Mahan, S.A., 2009, Late Pleistocene paleohydrology near the bound-ary of the Sonoran and Chihuahuan Deserts, southeast-ern Arizona, USA: Quaternary Science Reviews, v. 28, no. 3, p. 286–300, doi: 10 .1016 /j .quascirev .2008 .09 .022 .
Portenga, E.W., and Bierman, P.R., 2011, Understanding Earth’s eroding surface with 10Be: GSA Today, v. 21, no. 8, p. 4–10, doi: 10 .1130 /G111A .1 .
Richter, D.H., Houser, B.B., and Damon, P.E., 1983, Geo-logic Map of the Guthrie Quadrangle, Graham and Greenlee Counties, Arizona: U.S. Geological Survey Miscellaneous Investigations Series Map I-1455, scale 1:48,000.
Scarborough, R.B., and Peirce, H.W., 1978, Late Ceno-zoic basins of Arizona, in Callender, J.F., Wilt, J.C., and Clemons, R.E., eds., Land of Cochise, South-eastern Arizona: Socorro, New Mexico Geological Society, Twenty-Ninth Field Conference Guidebook, p. 253–259.
Jungers and Heimsath
486 Geological Society of America Bulletin, v. 128, no. 3/4
Smith, G.A., 1994, Climatic influences on continental depo-sition during late-stage filling of an extensional basin, southeastern Arizona: Geological Society of America Bulletin, v. 106, no. 9, p. 1212–1228, doi: 10 .1130 /0016 -7606 (1994)106 <1212: CIOCDD>2 .3 .CO;2 .
Smith, G.A., Wang, Y., Cerling, T.E., and Geissman, J.W., 1993, Comparison of a paleosol- carbonate isotope record to other records of Pliocene–early Pleistocene climate in the western United States: Geology, v. 21, no. 8, p. 691–694, doi: 10 .1130 /0091 -7613 (1993)021 <0691: COAPCI>2 .3 .CO;2 .
Spencer, J.E., and Reynolds, S.J., 1989, Middle Tertiary tec-tonics of Arizona and adjacent areas, in Jenney, J.P., and Reynolds, S.J., eds., Geologic Evolution of Ari-zona: Arizona Geological Society Digest, v. 17.
Thorman, C.H., 1981, Geology of the Pinaleño Mountains, Arizona—A preliminary report: Arizona Geological Society Digest, v. 13, p. 5–11.
Tuan, Y., 1962, Structure, climate, and basin land forms in Arizona and New Mexico: Annals of the Association of American Geographers, v. 52, no. 1, p. 51–68, doi: 10 .1111 /j .1467 -8306 .1962 .tb00395 .x .
Van Devender, T.R., 1990, Late Quaternary vegetation and climate of the Chihuahuan Desert, United States and Mexico, in Betancourt, J.L., Van Devender, T.R., and Martin, P.S., eds., Packrat Middens: The Last 40,000 Years of Biotic Change: Tucson, Arizona, University of Arizona Press, p. 104–133.
Wagner, J.D.M., Cole, J.E., Beck, J.W., Patchett, P.J., Hen-derson, G.M., and Barnett, H.R., 2010, Moisture vari-ability in the southwestern United States linked to abrupt glacial climate change: Nature Geoscience, v. 3, no. 2, p. 110–113, doi: 10 .1038 /ngeo707 .
Warshall, P., 1995, The Madrean sky island archipelago: A planetary overview, in DeBano, L.H., et al., technical coordinators, Biodiversity and Management of the Madrean Archipelago: The Sky Islands of Southwest-ern United States and Northwestern Mexico: Rocky Mountain Forest and Range Experiment Station Gen-eral Technical Report RM-GTR-264, p. 6–18.
Waters, M.R., 1989, Late Quaternary lacustrine his-tory and paleoclimatic significance of pluvial Lake Cochise, southeastern Arizona: Quaternary Re-search, v. 32, no. 1, p. 1–11, doi: 10 .1016 /0033 -5894 (89)90027 -6 .
Whipple, K.X., and Meade, B.J., 2006, Orogen response to changes in climatic and tectonic forcing: Earth and Planetary Science Letters, v. 243, no. 1, p. 218–228, doi: 10 .1016 /j .epsl .2005 .12 .022 .
Wobus, C., Whipple, K.X., Kirby, E., Snyder, N., Johnson, J., Spyropolou, K., Crosby, B., and Sheehan, D., 2006, Tectonics from topography: Procedures, promise, and pitfalls, in Willett, S.D., Hovius, N., Brandon, M.T., and Fisher, D.M., eds., Tectonics, Climate, and Land-scape Evolution: Geological Society of America Spe-cial Paper 398, p. 55–74.
Wynn, J.C., 1981, Complete Bouguer Gravity Anomaly Map of the Silver City 1° × 2° Quadrangle, New Mexico–Arizona: U.S. Geological Survey Miscel-laneous Investigations Series Map I-1310-A, scale 1:250,000.
York, D., 1966, Least-squares fitting of a straight line: Cana-dian Journal of Physics, v. 44, no. 5, p. 1079–1086, doi: 10 .1139 /p66 -090 .
Youberg, A., Cline, M.L., Cook, J.P., Pearthree, P.A., and Webb, R.H., 2008, Geologic Mapping of the Debris Flow Deposits in the Santa Catalina Mountains, Pima County, Arizona: Arizona Geological Survey Open-File Report 08–06, scale 1:6000.
Zhu, C., Waddell, R.K., Star, I., and Ostrander, M., 1998, Responses of ground water in the Black Mesa Basin, northeastern Arizona, to paleoclimatic changes dur-ing the late Pleistocene and Holocene: Geology, v. 26, no. 2, p. 127–130, doi: 10 .1130 /0091 -7613 (1998)026 <0127: ROGWIT>2 .3 .CO;2 .
Science editor: AAron J. cAvoSie ASSociAte editor: dAvid. r. MArchAnt
MAnuScript received 15 JAnuAry 2015 reviSed MAnuScript received 19 MAy 2015 MAnuScript Accepted 27 AuguSt 2015
Printed in the USA

Copyright of Geological Society of America Bulletin is the property of Geological Society ofAmerica and its content may not be copied or emailed to multiple sites or posted to a listservwithout the copyright holder's express written permission. However, users may print,download, or email articles for individual use.