Embed Size (px)
Citation preview

Post Tropical Cyclone Sandy Geospatial Response An Interagency Success Story and NOAA’s Role
February 26, 2014

Julia W. O’Brien February 26, 2014 2
Pre-Storm Coordination FEMA
USGS
NOAA
Civil Air Patrol (DoD)
National Geospatial-Intelligence Agency (NGA)

Julia W. O’Brien February 26, 2014
FEMA Modeling Task Force (MOTF) ran predicted surge models (SLOSH)
USGS Deployed hundreds of storm surge sensors to measure depth of water
at structural level Included real-time surge, rapid-deployment gages These sensors provided a real-time assessment as the storm made
landfall
NOAA and NGA prepared to collect imagery after storm
CAP had aircraft and crews ready to fly
3
Pre-Storm Preparation

Julia W. O’Brien February 26, 2014
NOAA overflights Used surge models to target high-
priority areas Geospatially referenced, GIS-ready
imagery High resolution Priorities:
Impacts to nautical charting and the marine transportation system
Impacts to the coastal zone MOTF priorities
First flight was posted and available within 48 hours
4
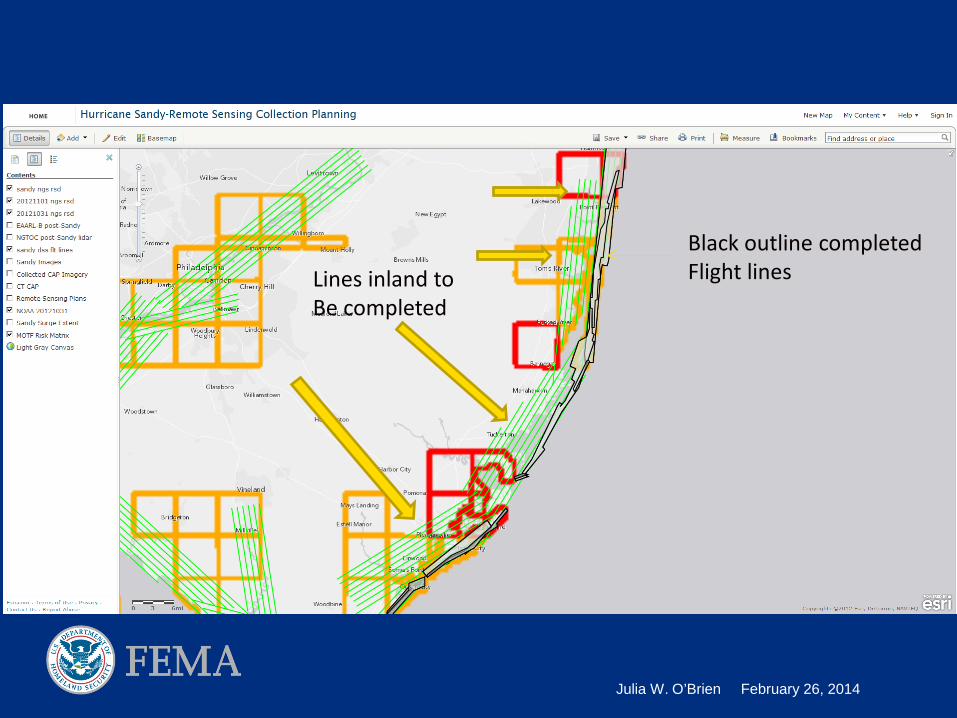
Sandy Response
Imagery collected by NOAA

Julia W. O’Brien February 26, 2014
Black outline = data collected Green lines = planned collection Blue Boxes = priority areas for 1-2 Nov
NOAA planned flight lines and collected data overlaid on MOTF Risk Matrix and Priority setting for 1-2 Nov
MOTF areas of high impact
Julia W. O’Brien February 26, 2014
Black outline completed Flight lines Lines inland to
Be completed
Julia W. O’Brien February 26, 2014
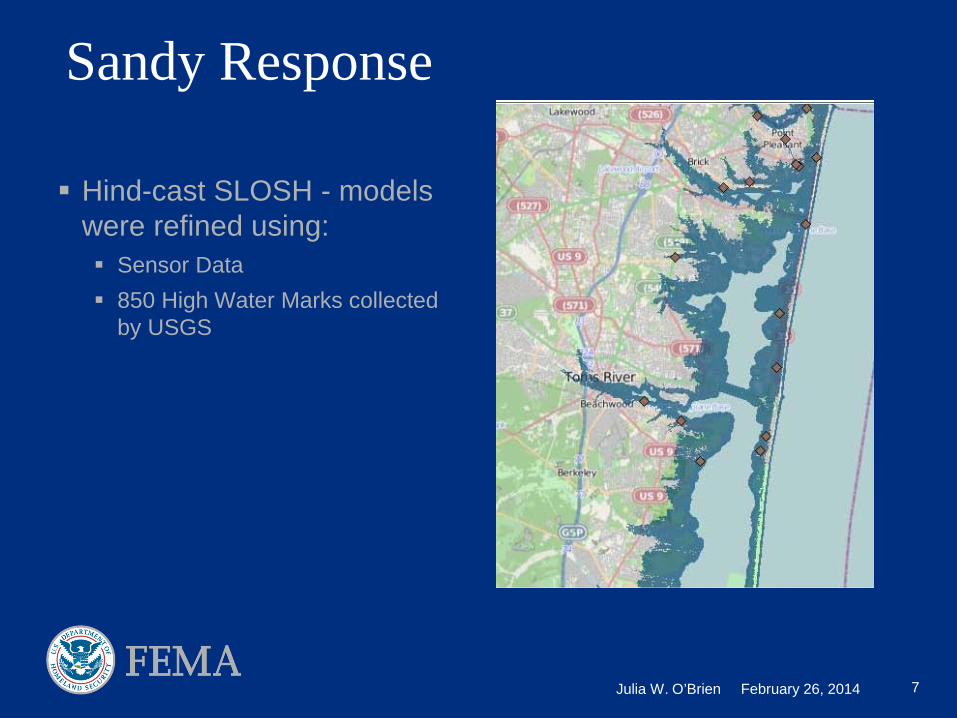
Hind-cast SLOSH - models were refined using: Sensor Data 850 High Water Marks collected
by USGS
7
Sandy Response

Julia W. O’Brien February 26, 2014
Storm Impacts
Mantoloking, NJ Barrier Island Breach
Post-Storm Before

Julia W. O’Brien February 26, 2014
Storm Impacts
Mantoloking, NJ Barrier Island Breach

Julia W. O’Brien February 26, 2014
Storm Impacts
Mantoloking, NJ Barrier Island Breach
Post-Storm Before

Julia W. O’Brien February 26, 2014
Storm Impacts
Mantoloking, NJ Barrier Island Breach

Julia W. O’Brien February 26, 2014
CAP Flights Oblique, geo-tagged
aerial of most impacted areas
Used surge model to prioritize flights
In air within 24 hours of storm
Over 157,000 geo-tagged images captured
Over 650 sorties flown Over 250 personnel,
including headquarters staff, were in support
12
Sandy Response

Julia W. O’Brien February 26, 2014
Structural Assessments by ImageCAT, using NOAA and CAP imagery and surge model 44,000 assessments delivered within 72 hours notice to proceed 147,000 individual structural assessments in total
Geospatial Structural Assessments were used to: Deliver expedited assistance to >44,000 applicants for temporary shelter
assistance Determine priorities for Housing Inspection teams Direct operational forces to be concentrated on most impacted areas allowing
a stretched response effort to maneuver without wasting man-hours or effort Determine potential long-term housing requirement priority areas to support
IA Housing planning efforts in NJ/NY
13
Sandy Response
Julia W. O’Brien February 26, 2014
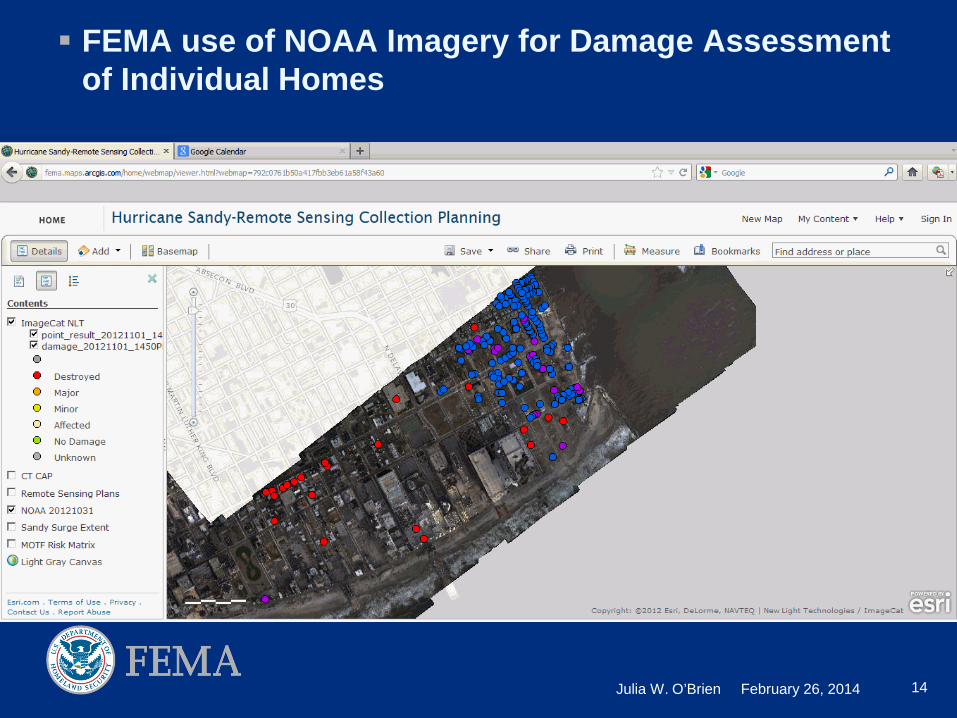
FEMA use of NOAA Imagery for Damage Assessment of Individual Homes
14

Julia W. O’Brien February 26, 2014
Image Assessments posted to FEMA GeoPlatform for use by States and other Agencies Damage Assessments compiled
by US National Grid Imagery-based Preliminary
Damage Assessments
15
Sandy Response
Julia W. O’Brien February 26, 2014
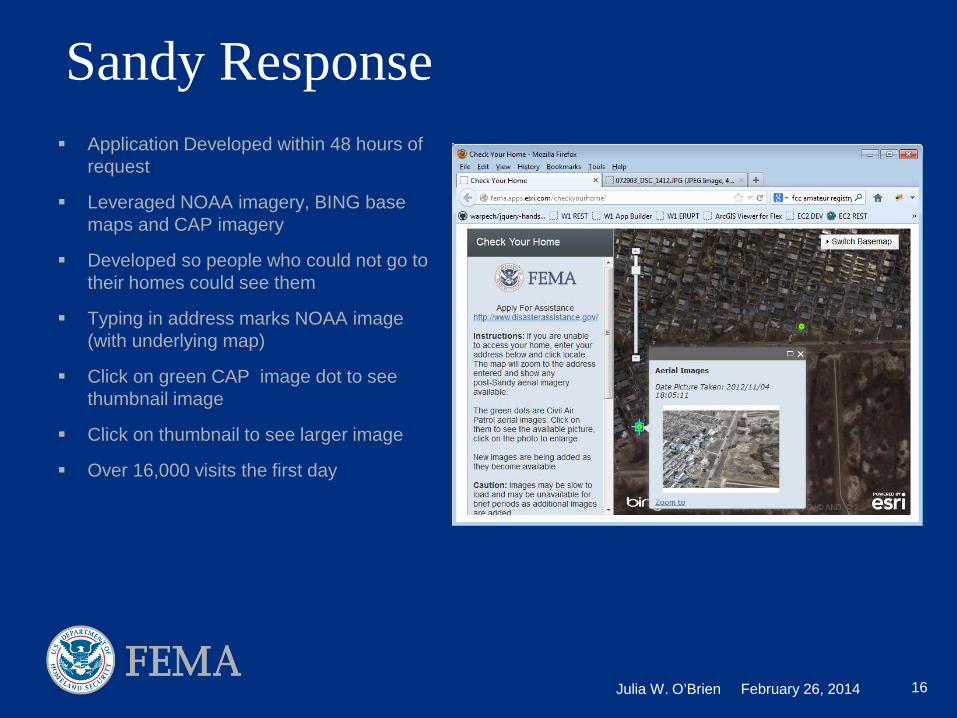
Application Developed within 48 hours of request
Leveraged NOAA imagery, BING base maps and CAP imagery
Developed so people who could not go to their homes could see them
Typing in address marks NOAA image (with underlying map)
Click on green CAP image dot to see thumbnail image
Click on thumbnail to see larger image
Over 16,000 visits the first day
16
Sandy Response

Julia W. O’Brien February 26, 2014
Post-Sandy LiDAR surveys (both topographic and topobathy) were taken of open coast sandy beaches from Cape Hatteras, NC to Montauk, NY
Was done cooperatively: USACE assets and contracts USGS assets and contracts Covered New York to Virginia NOAA will follow up with coverage from South Carolina to New York using
supplemental funding
17
Sandy Response
Julia W. O’Brien February 26, 2014
Day 3: Fuel flow into NY area was a top priority Barge deliveries were hampered by partial closure of the port Waterborne obstructions along Arthur Kill and other off-load facilities also a
problem
DHS requested maps of fuel depots and details of New York Harbor HSIP has locations of fuel depots EPA has capacity of fuel depots NOAA has nautical charts (but not GIS-compatible)
NOAA had survey vessels in the area, which were used to identify obstructions (using sonar technology) and clear areas for vessel movement
18
Sandy Response

Julia W. O’Brien February 26, 2014
In tribute to Chris Barnard, Remote Sensing Advisor for the Department of Homeland Security and a champion of geospatial
coordination and innovation in disaster response.
19
In Memoriam: Chris Barnard