Embed Size (px)
Citation preview

Energy and Environment Research; Vol. 6, No. 2; 2016 ISSN 1927-0569 E-ISSN 1927-0577
Published by Canadian Center of Science and Education
48
Post - Tsunami Damages Assessment, Relief and Rehabilitation Measures in the Kanyakumari District, Tamil Nadu, South India
C. Hentry1, S. Saravanan2, N. Chandrasekar2 & S. L. Rayar1 1 Department of Physics, St. Jude’s College, Thoothoor – 629 176, India 2 Centre for Geo-Technology, Manonmaniam Sundaranar University, Tirunelveli - 627 012, India Correspondence: N. Chandrasekar, Centre for Geo-Technology, Manonmaniam Sundaranar University, Tirunelveli - 627 012, India. Tel: 91-9994-435-416. E-mail: [email protected] Received: February 27, 2016 Accepted: June 6, 2016 Online Published: June 6, 2017 doi:10.5539/eer.v7n1p48 URL: https://doi.org/10.5539/eer.v7n1p48 Abstract The present study is based on the post tsunami survey conducted in January 2005 along the south west coast of India. This paper illustrates the variation of tsunami intensity along the coasts of Kanyakumari district and the consequent morphological changes occurred in the coastal area during tsunami. 33 coastal habitations of Kanyakumari district faced the wrath of tsunami waves. We have attempted to study shoreline modifications using beach profile survey, tsunami sand deposits, inundation distance, run up elevation and tsunami height. The coastal environment changes through online survey on human losses, housing and shelter, fisheries, agriculture and damages of infrastructure were studied in the study area. The major destructions identified in this area were 3m-4m sea water rise leading to erosion activities and changes in the beach slope variation. Many gentle slope regions have been transformed into steeply sloped regions. This unknown killer wave causes causalities and mass destruction in the coastal environment due to unaware of tsunami. The shallow waters of bays and estuaries have initiated the seizing. Maximum wave activity observed in the tsunami area closely to that of the bay, low lying areas etc. Initial relief by way of food, clothing, shelter and first-aid medical help has reached most of the affected communities by NGO’s and Government agencies were discussed. The paper also explained the innovative comprehensive long-term rehabilitation program aimed to go beyond basic restoration and rather upgrade standard of living to ensure sustained well-being and prosperity of the tsunami affected people. Keywords: Tsunami, damages, relief, restoration, rehabilitation etc. 1. Introduction Tsunamis are ocean (or sea) waves generated by large and abrupt perturbations of the ocean (or sea) floor (or surface) caused by the sudden offset of a fault, volcanic eruptions, large sub-aerial or submarine landslides, or meteor impacts. In deep waters, tsunamis can travel at speeds up to 800 km/h because their phase speed is proportional to the water depth (the phase speed equals the square root of the acceleration of gravity times the water depth). Tsunamis can travel thousands of kilometers away from their source, causing death and destruction over large areas far from the earthquake epicenter. Though the Indian subcontinent is in a seismically active region, tsunamis along the coastline of India have been rare, but not unprecedented. The coasts of Indian landmass have experienced at least four attacks of tsunamis in the last 200 years. Even though tsunami is a common phenomenon in the Pacific region, some destructive tsunamis have also occurred in the Indian and Atlantic Oceans (Altinok 2000). Oceanic waves caused by the (27th August) 1883 Krakatoa volcanic explosion in Indonesia, was the earliest record of tsunami attack in India (Murty and Bapat 1999). On 26th December 2004, a submarine earthquake occurred off northwest of Java Sumatra islands in the vicinity of seismically active zone. The earthquake epicenter was located relatively at shallow depth, about 10 km below the ocean floor. The high magnitude of 9.0 the Richter scale at 3.4° N, 95.7° E and its shallow epicenter had triggered tsunami also called seismic sea wave in the Northeast Indian Ocean Basin. These waves travelled in the open ocean of the Bay of Bengal and subsequently transformed to a train of catastrophic oscillations on the sea surface and affected a large number of countries Southeast Asian including Malaysia, Sri Lanka, India, Thailand, Myanmar, Maldives and Africa’s Somalia, etc . The tsunami waves that struck South and South- East Asia in the early hours of 26 December 2004 claimed the lives of at least 283 000 people and displaced a further 1.1 million in the region (USGS 2005). The primary measurements in the field surveys were the estimation of height
eer.ccsenet.org Energy and Environment Research Vol. 7, No. 1; 2017
49
reached by the seawater as well as for its horizontal penetration. Information on run-up height and inundation limit are important to analyze the phenomenon (Curtis 1982). A significant observation associated with the 2004 tsunami effects along the Kanyakumari coast is its localized amplification in some regions and totally subdued effect elsewhere. Understanding the spatial pattern of the tsunami and its effects on the coastal morphology has important implications for assessing future scenarios of inundation. Since most evidence left by tsunamis is perishable, it is important to carry out post-tsunami surveys to measure the run up heights, inundation limits, tsunami height and assess the impact on the coastal life and property, flora and fauna, geomorphology, etc. Such information is important for future hazard assessment, and to develop inundation models. Tsunami-mitigation strategies have to be formulated based on such database. Here, we report post-tsunami observations along the 56 km long stretch of Kanyakumari coast as well as geomorphological changes in the shores of the Pazhayar inlet region, where the effect of the tsunami was most severe. During the post-tsunami days, starting from 27 December 2004, field visits were conducted at different locations of the Kanyakumari coast. The Post-Tsunami Survey Field Guide published in the website of International Tsunami Information Centre (ITIC) was taken as a guide in the field trip. The width of the continental shelf and the interference of reflected waves from Sri Lanka and Maldives Islands with direct waves and receding waves were responsible for intense damage in Kanyakumari district. The present study is based on the post tsunami survey conducted in January 2005 along the tsunami affected the south west coast of India , whole coastline of Kanyakumari, it devastated the low-lying coastal areas of Manakudy, Azeekal – Muttom and Kotilpad - Colachel leading to the loss of life and property (Chandrasekar et al. 2007). Effects of Medu (naturally elevated landmass very close to the seashore and elongated parallel to the coast) and coastal topography on the damage pattern during the deadliest Indian Ocean tsunami of December 26, 2004 is reported along the coastal region of Tamilnadu (India) by Narayan et al. 2005. Based on surveys, the suitability of various temporary shelters provided to the tsunami victims in order to find out the appropriate approach for the development of a sustainable architecture for the victims were examined (Vasudha 2005). Although tsunami affected the whole coastline of Kerala, it devastated the low-lying coastal areas of Kollam, Alleppey and Ernakulam districts leading to the loss of life and property (Abdul Rasheed 2006). Mid-ocean atoll islands are perceived as fragile landforms being physically susceptible to climate change, sea level rise and extreme events such as hurricanes and tsunami. The Sumatran tsunami of 26 December 2004 generated waves that reached reef islands in the Maldives 2,500 km away, that were up to 2.5 m high ( Paul S.Kench et al. 2006). With the postulation of reliable hazard management system motive, the beaches along the southern coast of India have been classified into various zones of liability based upon their response to the tsunami surge of 26 December 2004 (Chandrasekar et al., 2006). The 26 December 2004 tsunami significantly affected the coastal regions of southern peninsular India. Geographic and topological features affecting tsunami behavior on the Indian mainland were observed. Many of the affected structures consisted of non engineered, poorly constructed houses belonging to the fishing community (Alpa Sheth et al. 2006). An attempt has been made here to assess the impact of the tsunami hazard on coastal landforms and the level of inundation using GIS techniques in the coastal villages of Kanyakumari District, India (Chandrasekar et al. 2007). Inundation characteristics and geomorphological changes associated with the December 2004 tsunami along the Kerala coast are presented here based on post-tsunami surveys, tide data and beach profile measurements ( Kurian et al. 2006). The coastal area of the Kanyakumari district experienced tsunami which wrought a major impact on near shore morphology forming a risk to vulnerable coastline. This vulnerability leads to a long term environmental impact along the shore and to the fisher folk community. In addition to above, the tsunami had wrecked the regular activities of coastal community and major havocs were due to the disturbances to natural environment barriers and the removal of RMS (Rubble Mount Sea) wall for local purposes. This paved the way for the major catastrophic wave to cause unprecedented damages along the entire coastal villages of the study area. This paper provides details on the factors like tsunami height, inundation distance in the backshore, sand deposits, run up elevation, economic strategic needs assessment, an attempt has been made to bring out the environmental impacts due to the tsunami from Kanyakumari to Thengapattanam, South west coast of India. Hundreds of people either lost their lives or went missing. Thousands were injured, many with multiple fractures and asphyxiation. Thousands of houses and common infrastructure like roads, electric lines, water supply, bridges and culverts, anganwadis , etc were damaged. The objective of the paper would be to build self reliant coastal communities, resilient to shocks and able to manage their livelihoods in a sustainable manner. This would be achieved via the immediate objective of developing viable enterprises and resource management systems owned and operated by poor men and women in the region affected by the Tsunami and supported by community and other appropriate institutions.

eer.ccsenet.org Energy and Environment Research Vol. 7, No. 1; 2017
50
2. Location of the Study Area Kanyakumari, the smallest District in Tamil Nadu has almost all ecosystems - forests, wetlands, freshwater resources, marine, etc. Since this District is situated at the extreme South of the Indian subcontinent. The district is bordered on the North West by Kerala state and on the North East by Tirunelveli district of Tamil Nadu. The coastal ecosystem of this District comprises of 68 Km in length and is studded with 44 coastal fishing villages. The study area coastal stretch of Kanyakumari and Thengapattanam is lying at latitude 8o4'53.9" N - 8o14'27.1"N and longitude 77o31'51.8"E - 77o10'7.3"E in Agasteeswaram, Kalkulam and Vilavancode Taluks in Kanyakumari District of Tamil Nadu State, part of erstwhile Travancore-Cochin State (Fig 1 Location map).
Figure 1. Location map of the study area
Some of the places of study area locations are measured with GPS readings are given in Table 1. It comprises a group of associated hills and hillocks forming the Southern terminus of the Western Ghats, close to the confluence of three seas, the lndian Ocean, the Arabian Sea and the Gulf of Mannar. It stretches in the South East- North West direction in the form of a narrow ridge, which is irregular in shape and jutting in the form of promontories in several places. The Pazhayar, the Southernmost river of the Indian Peninsula, originating from Mahendragiri hills and drained into the Arabian Sea through Manakudi Estuary, is flowing some kilometers away from the hill group. The study area is highly dynamic with many cyclic and random processes owing to a variety of resources and habitats. The coastal ecosystem is highly disturbed and threatened by problems like pollution, siltation, erosion, flooding, sea water intrusion, storm surges and ever-expanding human settlements. There are three important Riverine ecosystems, which converge with the Arabian Sea. They are: Thengapattanam estuary, formed by the joining of river Thamirabarani in between Thengapattanam and Eraiummanthurai. Valliyar estuary is formed by the river Valliyar near Kadiapattanam. Manakudy estuary is formed by the joining of river Pazhayar in between East and West Manakudy villages. Two minor estuaries-Pambar estuary near Colachel and Pantri estuary near Rajakkamangalam are also located in the district. These are formed by excess water in the drainage canal during monsoon and the water drained from the irrigated fields. Waterfalls in Kanyakumari District include Thiruparappu Falls, Ullakarvi Falls, Azhakiyapandiapuram and Vattaparai Falls.

eer.ccsenet.org Energy and Environment Research Vol. 7, No. 1; 2017
51
Based on an 80 years study, it is found that during the North-East monsoon, between October and December, a precipitation of 538.6 mm is received in 24 rainy days and during the South-West Monsoon 538.3 mm is received from June to September in 27 rainy days. In summer, 326.3 mm of rainfall is received in 11 rainy days between March and May. In winter, 45.4 mm of rainfall is received in 5 days in January and February months. The annual average rainfall in the district is 1448.6 mm with a maximum of around 247 mm in October and a minimum of 21 mm in February (Perumal et al., 2008). Relative humidity ranges between 60 to 100%. Generally, the area experiences strong wind due to proximity of the area to the sea. The coastal geomorphology of Kanyakumari District is mainly composed of beach ridges, rocky shores, sand dunes, swampy nature in the estuarine regions etc. The 68 km long coast is densely populated to the tune of 1, 18,387 fisher folks which constitute about 26 percent of the total fishermen of Tamil Nadu. Among the 44 coastal villages, 33 habitations of study area were highly affected by tsunami. Table 1. Details of the study area
Location Slope Angle Latitude Longitude Kanyakumari 5.546 N 8° 4.715' E 77° 32' 42" Keelamanakudi 9.928 N 8° 05.32' E 77° 29.264" Pallam 11.308 N 8° 05.931' E 77° 25.943' Rajakamangalam 4.307 N 8° 06.877' E 77° 22.68' Muttom 2.435 N 8° 7.553' E 77° 19.372' Kadiapatanam 4.612 N 8° 8.196' E 77° 18.276' Mondaikadu 3.476 N 8° 9.674' E 77° 16.693' Colachel 5.077 N 8° 10.405' E 77° 15.045' Vaniakudy 3.59 N 8° 10.825' E 77° 14.183' Midalam 3.413 N 8° 12' 29.4" E 77° 12.44.5' Enayam 2.276 N 8° 13.11.4' E 77° 9'17.6" Thengapatanam 15.371 N 8° 14'.11.6' E 77° 10.18.5"
3. Methodology and Methods 3.1 Field Observations During the post-tsunami days, starting from 27th
December, field visits were conducted at different locations of
Kanyakumari district coast. The Post-Tsunami Survey Field Guide published in the web site of International Tsunami Information Centre (ITIC) was taken as a guide in the field trip. Considering the geomorphic set up of the coast, the run-up was estimated as the elevation at the local maximum of the horizontal inundation measured relative to mean water level at each location (Page 13, ITIC Tsunami Glossary). Measurements were made of land elevation, beach slope, tsunami flow direction and distance, maximum run-up height and duration of inundation, shoreline position and status of beach vegetation. In all places, the phenomenon was also documented through systematic interviews of eyewitnesses. Altogether 33 habitations spread all over the Kanyakumari coast, reported to have been affected by the tsunami, were visited. For estimation of run-up level, field signatures such as trapped floating objects in plants/trees/ buildings, flood mark or damaged windows and doors of buildings, etc. were relied upon. The primary measurements in the field surveys were the estimation of height reached by the seawater as well as for its horizontal penetration. Information on run-up height and inundation limit are important to analyze the phenomenon (Curtis, 1982). Volunteers regardless of their caste, creed and religion came forward and helped the authorities. In addition, local people were also interviewed to collect eye-witness reports. Information such as arrival time and height of different waves, inundation characteristics, nature of damage and causalities, etc., as listed in the Field Guide was recorded. The relief and restoration activities of the Government agencies, NGOs, good hearted people and various institutions were reported in the research paper. 3.2 Beach Profile Variations In order to understand the impact of tsunami on the beach morphology, post-tsunami beach profiles were measured at 12 stations in the Kanyakumari district coast on 10th and 11th
January 2005. Beach profile survey has
been performed using leveling and surveying equipments following Stack and Horizon Method speculated by La Fond and Prasada Rao (1954) which was later simplified by Emery (1961). Beach profile studies were carried out to detect the variations in the beach slope. The study has been designed under broad spectrum of economic

eer.ccsenet.org Energy and Environment Research Vol. 7, No. 1; 2017
52
vulnerability; coastal geomorphologic changes, beach morphodynamics, sediment distribution etc. have been attempted. An attempt has also been made to measure a level marks on the building debris. Interviewing eye witnesses was an important tool for this study to bring out the environmental impacts in this region. The height of the tsunami wave in the hinterland region has been studied with the debris brought to the hinterland. The level of the water mark on the building located in tsunami affected area has also been measured. Government records on the impact assessment especially damages to coastal community has also been taken into account and duly cross checked with local community. The tsunami intensity measurement for all the areas is based on the Tsunami Intensity Scale (Ambrasey 1962). The inundation length has been calculated for all the inundated regions following the method of Mader and Hill (1997). 4. Results and Discussion 4.1 Tsunami Sand Deposits The catastrophic killer wave had carried sand and pebbles from the beach and ocean floor which deposited in the buildings, on top of roofs and also on the ground along the coast of this district. Tsunami pebble deposits had been widely glimpsed in all parts of the study area. The sandy deposits of the coastal tract had been eroded and transported from both foreshore and backshore. Tsunami pebble deposits have been noticed in Colachel, Kotilpadu, Muttom, Midalam, Azheekal, Manakudi, Keelamanakudy and Kanyakumari extending from 50 meters to 700 meters in the hinterland with the thickness of about 12 cm to 4cm thickness respectively (Plate 1). The huge catastrophic wave not only washed away but also had the ability of transporting larger materials including car, household items and even concrete buildings. Just on the mouth of the Manakudy estuary, the bridge connecting Manakudy and Keezhamanakudy has been dispositional toward either side of the banks each block is weighing about few tones and a catholic church totally demolished in Keezhamanakudy (Plates 2a and 2b).
Plate 1. Tsunami sand deposits in the hinterland of Midalam up to 500m from the coast
Plate 2a. The Dispositional Bridge connecting Manakudy and Keelamanakudy

eer.ccsenet.org Energy and Environment Research Vol. 7, No. 1; 2017
53
Plate 2b. The demolished Catholic Church in Keezhamanakudy village
4.2 Inundation Distance It is defined as the distance from the shore line to the limit of tsunami penetration. The inundation distance in the study area varied from less than 50 meters to more than 700m and varied from place to place. The variability was promoted by a number of factors like slope of the land, underwater topography (bathymetry), orientation of the coastline and Rubble Mount Sea (RMS) walls/Groins. (Hentry et al. 2010). The inundation was very low from Thengapatanam to Enayam where RMS walls with a height of 10 m and a series of rocks (Offshore hillocks) have been located. This part of the region is situated in the north west of the study area experiences only less intensity of the tsunami waves. Tsunami inundation was greater in the estuaries, low lying areas and deeper zones in the off shore region. The tsunami inundation distances along the study area are given in Table 2. The three important riverside ecosystems debouches with Arabian sea which are Thengapatinam estuary, Valliyar estuary (Kadiapatanam) and Manakudy estuary have been witnessed with inundation of water for more than 3 kms. The minor channels like Pampar estuary near Colachel and Pantri estuary near Rajakkamangalam witnessed inundation of water of about 0.5 km to 1.0 km. Rajakkamangalam area is an elevated place. But, it experienced inundatation on the either side of the Pantri estuary. In Colachel, the water has inundated through the Pampar estuary and entered through the AVM canal leading to major causalities with heavy human loss (Plate 3). The low lying areas like Keezhamanakudy, Chothavilai and Azheekal beach were reported to have experience large inundation distances. The natural harbour with greater depths of Colachel and Kotilpadu areas have also been reported with an extensive inundation. Since the estuary is exposed to ebb tide, floods came with violent eddies and turbulence of their front leading to a much damage in the nearby regions (Shuto 1991).
Plate 3. AVM canal caused as death trap in Kotilpad

eer.ccsenet.org Energy and Environment Research Vol. 7, No. 1; 2017
54
Table 2. Inundation distance and run up elevation of tsunami affected places
S.No Location Inundation Altitude Runup Elevation Distance (m) (m) (m)
1 Kanyakumari 200 12 3 to 4 2 Keezhamanakudy 1000 9.2 5 to 6 3 Pallam 400 17.4 2 to 3 4 Rajakkamangalam 150 14.4 1 to 2 5 Muttom 200 10.2 3 to 4 6 Kadiapatanam 100 18.9 2 to 3 7 Mondaikadputhoor 100 16.6 2 to 3 8 Colachel 500 16 4 to 5 9 Vaniakudy 100 16 2 to 3 10 Midalam 300 16.6 2 to 3 11 Enayam 130 15 2 to 3 12 Thengapatnam 200 13.33 2 to 3
4.3 Run-Up Elevation Run-up elevation is defined as the elevation above mean sea level of a tsunami at the limit of penetration. The run up elevation had varied from less than 2 meters to 10 meters. Run up elevation has more values between Kanyakumari to Chotavilai , Azeekal to Muttom and Kotilpad to Colachel regions. The variability of run up distance depends on the same factors as in the inundation distances. The run up elevation depends upon the inundation distances of the nearshore bathymetry of study area. This has been witnessed around Colachel and other regions to an altitude of about 6 m where the water level have been traced down in the buildings and other civil constructions. In the eastern areas, particularly at Keezhamanakudy and Azheekal run up elevation has been extended to an altitude of about 10 meters (Plate 4).
Plate 4. All houses were damaged in Singaravelar Colony
4.4 Tsunami Height The tsunami height is defined as the height extending from the bottom topography in the nearshore environment to the top surface of the wave. The change in tsunami height gave with distance from the shoreline gives

eer.ccsenet.org Energy and Environment Research Vol. 7, No. 1; 2017
55
information for determining how the tsunami lost energy as it moved inland. Casualties and major disasters are strongly related to the height of tsunami. In the study area, height of the catastrophic wave altitude had gradually decreased from eastern end to western end i.e. from Kanyakumari to Thengapatanam. But the major disasters are highly reciprocated when compared to the height of the tsunami wave. Even though Kanyakumari coast has been witnessed with greater tsunami wave heights which extends to the height of the Thiruvalluvar statue at an altitude of 171 feet from mean sea level have been reported with less impacts. But from Manakudy to Sothavilai , Azeekal to Kadiapatanam and Kotilpad to Colachel regions witnessed heavy damages and more causality. This is due to high variability in the nearshore bathymetry, the orientation of coastline and diffraction pattern of the tsunami waves. 4.5 Human Losses Because of lack of knowledge regarding tsunami unlike Pacific Ocean region people, heavy casualty took place in Kanyakumari district. 801 people died in the study area and the main victims were children. Many people have been drowned in the sea and swallowed the sediments. The low lying areas such as Colachel, Kotilpad, Manakudy, and Azheekal had large number of victims. In spite of RMS wall and high altitude at Manakudy, the sea water has inundated from the adjacent area of Chothavilai flew towards eastward direction and damaged the western part of Manakudi. The number of persons were died and missed by killer wave at the wake of the tsunami in each location have shown in the Table 3. Among the 801 dead, 334 were children and 17 were from other districts and states. Table 3. Causalities occurred during Tsunami
S.No Location Total death Total Missing 1 Kanyakumari 0 2 2 Keezhamanakudy 34 3 3 Manakudy 123 4 4 Pallam 6 0 5 Kesavanputhenthurai 1 0 6 Rajakkamangalam 2 0 7 Azeekkal 57 6 8 Muttom 52 5 9 Kadiapatanam 31 4 10 Chinnavilai 3 0 11 Periavilai 4 0 12 Mondaikadputhoor 24 2 13 Kotilpadu 215 12 14 Colachel 227 20 15 Vaniakudy 3 1 16 Enayam 1 0 17 Other Dist 6 5 18 Other State 6 5 19 Unidentified 6 0 20 Chotavilai 0 3
Total 801 72 4.6 Housing and Shelter In many of the affected villages, all types of houses were totally destroyed in tsunami waves. Huts, tiled houses, mud houses and concrete buildings were totally collapsed in the catastrophic event. All household items like vessels, furniture, etc were washed away by tsunami. The houses that were located parallel to coast have been more affected than the houses were located perpendicular to the coast. The newly constructed houses also uprooted in the high inundated areas. The total number of houses in each hamlet fully damaged, partially damaged and minor damages are shown in Table.4. The colony houses constructed by the Government were completely washed away in Kotilpadu, Colachel etc. 4.7 Fisheries The fisheries sector, one of the primary producers since most of the people habitation have plunged with fishing

eer.ccsenet.org Energy and Environment Research Vol. 7, No. 1; 2017
56
activities in the 68 km long coast line and brought a greater economy of this district. December 26th 2004 was a holiday for all the fishermen since that day was Sunday. All Vallams worth of Rs.1.5 lakh with Yamaha Engine worth of Rs.75 thousands and catamarans from 12 ft to 20 ft with lambodi engine worth of Rs.75 thousands were rested on the beaches. Different varieties of nets to catch different types of fishes have been spread on the beaches and the near the houses. Due to lack of knowledge about the seismic sea waves, all of them were placed perpendicular to tsunami sea waves. Catamarans, nets and instruments were swabbed off into the sea by tsunami waves and it returned large quantity of sand to the shore. The fishing equipments were shoved into 2 to 3 km inside estuaries regions and damaged. All vallams, catamarans and nets were ravaged and could not be used in future. 15,379 fishermen lost their catamarans, vallams and mechanished boats due to aggressive waves of tsunami. The whole community was forced to start their livelihood from the beginning with new equipments and nets. The damages of different types of equipments were given in Table 4. Chinnamuttom harbour, the only fishing harbor available in Kanyakumari district suffered extensive damages in the tsunami. 39 mechanished boats in the harbor got completely damaged and 347 mechanised boats got partly damaged. Table 4. Economic and Building Vulnerability
S.No Place Building Economical Fully Partly Minor Vallams Kattumarams Nets
1 Kanyakumari 200 475 900 2 Kovalam 35 25 10 12 150 250 3 Keezhamanakudy 295 60 15 21 427 200 4 Manakudy 400 200 150 140 600 400 5 Pallam 13 43 26 22 540 1000 6 Kesavanputhenthurrai 1 7 0 5 21 135 7 Pozhikarai 0 4 0 4 31 25 8 Periakad 0 0 0 0 25 10 9 R.M.Thurai 25 42 0 0 102 40 10 Azhikal 300 320 107 0 333 500 11 Muttom 187 55 207 17 374 750 12 Kadiapatanam 7 10 40 30 276 800 13 Chinnavilai 20 48 0 0 150 150 14 Periavilai 25 43 0 12 50 70 15 Puthoor 60 20 20 45 150 200 16 Kotilpad 402 14 120 400 400 17 Colachel 495 363 396 54 1200 800 18 Kodimunai 10 8 6 6 50 19 Vaniakudy 110 65 245 10 211 250 20 Kurumpanai 55 117 180 63 208 200 21 Midalam 10 5 6 7 70 50 22 Melmidalam 3 6 2 4 35 100 23 Enayam 1 1 0 75 250 200 24 En.Puthenthurai 25 100 2 25 Ramanthurai 1 0 0 15 0 26 Thengapatanam 0 0 0 7 29 0
4.8 Damages of Infrastructure The ferry service from Kanyakumari to the Vivekananda rock memorial and Thiruvalluvar statue got disrupted by tsunami. One boat was completely damaged and was washed away. Other two boats suffered extensive damages. The boat jetty got damaged severely. Sothavilai beach, which is a major tourist attraction of Kanyakumari was affected by tsunami. Various facilities like children’s park, sanitary complex, bus shelters etc were damaged. More than 123 km of road was damaged by tsunami. 4 schools, 30 anganwadis, 12 sanitary complexes, 16 public buildings and 2 churches were fully damaged by tsunami. 2601 no of electric poles, 58 km length of electric conductors, 1316 no of public lights and 27294 no of house power connections were damaged. In Manakudi village, the concrete bridge across Pazhayar connecting Melmanakudi and Keezhamanakudi was washed away by tsunami. Four spans of the bridge ( each weighing 775 metric tonnes and 140 m long) were
eer.ccsenet.org Energy and Environment Research Vol. 7, No. 1; 2017
57
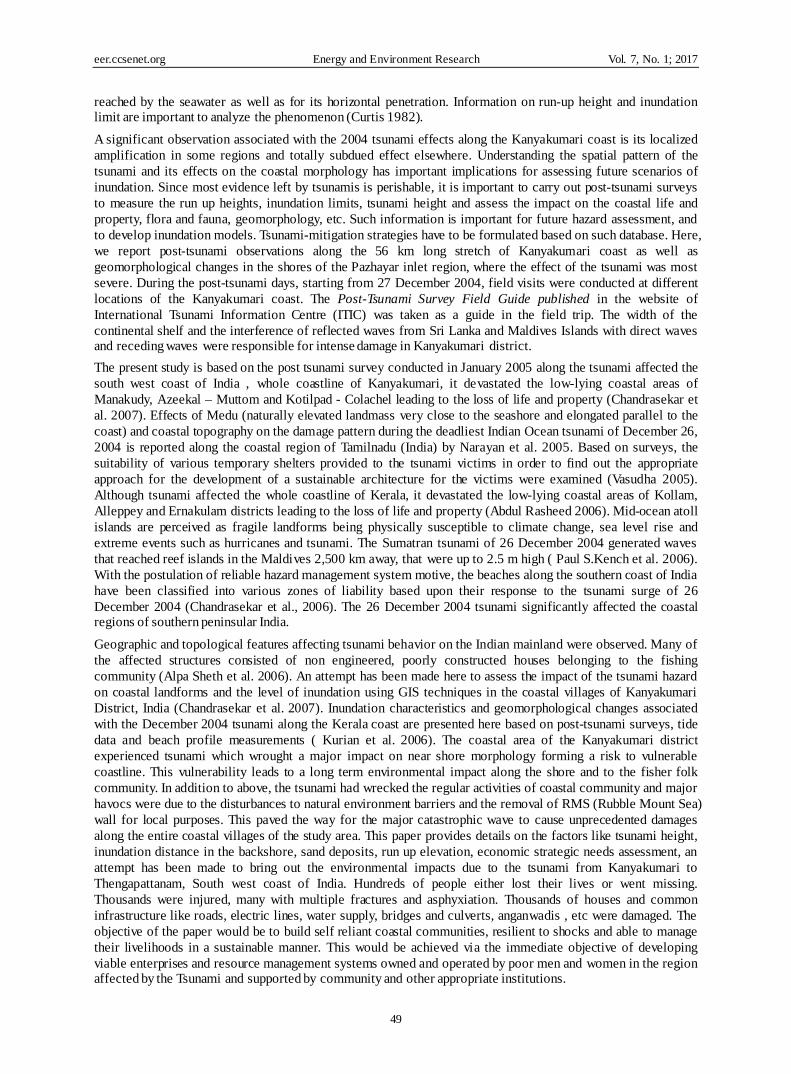
lifted from their position and carried away by tsunami waves. 23 small industries, 17 coir industries and 91 small traders were affected by the tsunami in the study area. 4.9 Agriculture Kanyakumari District is situated in a tropical region with tributaries of rivers entered into the sea, nature bounty with greenish. Due to sea water intrusion, herbs in the regions were completely destroyed. The coconut trees were dried which can yield after a long gap. In nearby coastal villages, all plantation and agricultural wet land have been completely vanished. 282.57 Ha coconut area, 6.47 Ha paddy area, 6.57 Ha banana area, 1.4 Ha Palm tree area and 0.52 Ha other crops area affected by the tsunami in the Kanyakumari district. The damages to Agricultural crops have been given in Plate 5.
Plate 5. The damaged coconut trees in Thengapatanam
5. Relief and Rehabilitation 5.1 Relief Spontaneous responses by varied nongovernmental (secular and religious) organisations and individuals as well as efforts by the Government machinery have made sure that initial relief by way of food, clothing, shelter and first-aid medical help has reached most of the affected communities. Oxfam, Unicef, CARE, Action Against Hunger, Americares, World Vision, Save the Children and many others bringing in (Or purchasing locally) supplies hundreds of thousands of tsunami victims for the weeks and months. There were 44000 families (comprising more than 1.60 lakh members ) affected by tsunami and they were accommodated in 63 relief centre’s located in community halls, churches, temples, colleges and schools. 26,921 families were given assistance of Rs 4000 cash plus kit worth Rs 912 (Total amount Rs 13.22 crore). 17170 families were given assistance of Rs 2000 cash plus kit worth Rs 912 (Total amount of Rs 4.99 crore). 44091 families were given assistance of Rs 1000 cash plus kit worth Rs 356 (Total amount of Rs 23.91 crore). For each death case, an amount of Rs one lakh was sanctioned under Chief Minister Public Relief Fund and Rs one lakh was sanctioned under Prime Minister Public Relief Fund. The Government also sanctioned Rs two lakhs assistance for each of the missing cases. With the help of Kind hearted philanthropists, the district administration settled Rs 27 lakhs to private hospitals for the treatment of injured persons during tsunami. A great deal of humanitarian aid was needed because of widespread damage of the infrastructure, shortages of food and water, and economic damage. Epidemics were of special concern due to the high population density and tropical climate of the affected areas. The main concern of humanitarian and government agencies was to provide sanitation facilities and fresh drinking water to contain the spread of diseases such as cholera, diphtheria, dysentery, typhoid and hepatitis A and B.

eer.ccsenet.org Energy and Environment Research Vol. 7, No. 1; 2017
58
5.2 Rehabilitation The Government sanctioned Rs 22.02 crore to restore, and improve by widening the roads damaged by tsunami. The government took steps for providing a temporary steel bridge at a cost of Rs 1.4 crore across Pazhayar river connecting Melamanakudi and Keezhamanakudi coastal villages which got washed away by tsunami (Plate 6). A permanent bridge has been constructed at a cost of Rs 9.00 crore. The ferry service from Kanyakumari to the Vivekananda Rock memorial was restored by repairing the boats and providing essential infrastructure at the jetty area within 40 days after the occurrence. Chinnamuttom fishing harbor repairs were taken up at a cost of Rs 72 lahks. The Government sanctioned Rs 10.66 crore as subsidy and Rs 11 crores as loan for 386 boats. The district administration took up the restoration of Sothavilai beach at a cost of Rs 24.2 lakhs and opened to the public within 8 months after the tsunami. The Government came to the rescue of fishermen who lost their fishing equipments and provided assistance of more than Rs 22.87 crore to these affected fishermen. Also loans to the tune of Rs 12.2 crore was coordinated to fishermen as part as subsidy. Various NGOs and kind hearted philanthropists supplied sufficient no of Catamarans, Vallams and nets to resume fishing in the study area. The tsunami affected farmers were given assistance of Rs 11.53 lakhs by the Government. The Government sanctioned Rs 11.65 as assistance and compensation for small businesses and industries.( Two years of tsunami relief and Rehabilitation).
Plate 6. Temporary steel bridge connecting Manakudy and Keezhamanakudy villages
The temporary shelters were constructed in 40 locations to house the displaced persons displaced in various relief centers. The Government spent Rs 2.52 crore for putting up these temporary shelters. The district administration constructed 3002 shelters and Non Government Organization 1086 shelters. These temporary shelter locations were provided with bathroom & toilet facilities, washing areas, community shelters and common kitchens. The repairable damaged houses were taken up for repair by the NGOs at a cost of four crore. A total of 3953 houses were repaired by the NGOs. When the houses got repaired, the families from the temporary shelters moved to their own houses. The state Govt. declared the payment of fees for children of affected families for half academic year of 2004-05 and full academic years of 2005-06 and 2006-07 to continue the education of tsunami affected family’s children. Also, the Govt. provided a scholarship to the tune of Rs 300 per month to children of all the affected families , studying up to 10th standard from Prime minister’s National Relief Fund. 32118 students of this district were benefited by this scheme. The assistance has been given to the self help groups under TAEP (Territorial Administration for Environmental Protection and Forestry) program of Asian Development Bank is given in table 5.

eer.ccsenet.org Energy and Environment Research Vol. 7, No. 1; 2017
59
Table 5. Assistance given through Self Help Groups
No of SHGs given Revolving Fund
Disbursement of Revolving Fund (in lakhs)
Village Panchayat 2858 754.9 Town Panchayat 899 244.1 Municipality 128 35.7 Total 3885 1034.7
One of the most important tasks in the rehabilitation program is construction of permanent houses for families whose houses got completely damaged by tsunami. Lands were acquired in 28 places. Totally an extent of 86.08 acres of land purchased at a cost of Rs 6.07 crore. 25 acres of Government land also made available in Colachel. 2578 houses have taken up for construction. The details of construction of permanent houses are given in Table 6. The newly constructed houses for the tsunami affected people are given in Plate 7.The district administration decided to develop the lands available in salt pan poramboke (Government Land) in Colachel. In order to improve the infrastructure in the coastal local bodies in the district has sanctioned road works under ADB assistance. These road works will improve the connectivity of various areas on the coast. 193 roads have been taken up for Rs 22.04 crore. Government also sanctioned Rs 27.44 crore for construction of RMS walls at 23 coastal habitations and Groins at four locations.
Plate 7. Newly constructed houses at Mondaikad Puthoor
Table 6. Construction of permanent houses in the tsunami affected habitations
S.No Location Extent of land acquired (Acre)
Total cost of Land ( Rs)
No of houses constructed
Extent of each plot (sq.ft.) Agency
1 Arokiapuram 0.54 1,80,200 19 1300 NGO Discipleship Centre Kanyakumari
2 Chinnamuttom 0.16 1,11,520 4 1300 NGO Discipleship Centre Kanyakumari
3 Puthugramam 0.97 26,10,738 18 1300 NGO Discipleship Centre Kanyakumari
4 Kovalam 4.47 23,54,859 88 1300 NGO Discipleship Centre Kanyakumari
5 Kanyakumari 1.72 30,75,169 35 1300 Salvation Army Kanyakumari Dist
6 Keezhamanakudi 7.75 22,86,725 188 1300 TATA Relief Committee

eer.ccsenet.org Energy and Environment Research Vol. 7, No. 1; 2017
60
Chennai 7 Manakudi 10.61 51,11,913 255 1300 KSSS Nagercoil 8 Annainagar 2.3 11,65,806 35 1300 KSSS Nagercoil 9 Pallam 2.02 24,30,480 35 1300 KSSS Nagercoil
10 Azhikkal 5.78 23,91,145 279 1300 World vision India Nagercoil
11 Muttom 6.53 29,90,615 301 1300 Intervida Nagercoil
12 Mondaikad puthoor 5.27 46,08,618 101 1300 KSSS Nagercoil
13 Kotilpad 7.04 1,24,23,164 251 650 KSSS Nagercoil
14 Kootumangalam 1.87 12,98,252 27 1300 Matha Amirthanantha Mayi Kollam
15 Azad Nagar 0.71 13,80,151 26 650 KSSS Nagercoil
16 Chinnavilai 0.85 14,83,333 24 1300 World vision India Nagercoil
17 Periavilai 3.17 12,20,450 58 1300 Holy Cross Sisters Karnataka
18 Sambasivapuram 0.53 9,99,000 24 650 Matha Amirthanantha Mayi Kollam
19 Singaravelan Colony 2.5 49,73,540 103 650
EFICOR Neyyoor
20 Kurumpanai 2.13 18,83,693 46 1300 World vision India Nagercoil
21 Vaniakudi 1.8 22,02,726 58 1300 World vision India Nagercoil
22 Kodimunai 5.8 35,07,050 132 1300 KSSS Nagercoil 23 Colachel 25 Govt . Land 329 1300 KSSS Nagercoil
A sum of Rs. 27.10 crore had been allocated for construction of a fishing harbour at Colachel in Kanyakumari district. The required land of 3.75 hectares was acquired from the Tamil Nadu Maritime Board. The harbour will benefit fisherfolk of Colachel, Kodimunai, Vaniyakudi, Kurumbanai, Kottilpadu, Mandaicaduputhur and Chinnavilai. Under a Centrally sponsored scheme, the Government of India has approved the construction of a fishing harbour at Thengaipattinam in Kanyakumari district at a cost of Rs.40 crore. The proposed project site is at Thengaipattinam, about 37 km from Nagercoil on the west coast of Kanyakumari district. The site is located in the estuary of the Thamirabarani River. The fishing harbour at Thengaaipattinam, being established would be able to handle 750 mechanised boats; the one at Colachel would accommodate 450 boats. The first private fishing harbour in the country will be set up at Muttom in Kanyakumari district of Tamil Nadu on the mode of build, own, operate and transfer (BOOT) is likely to cost Rs 55 crore. Marg Ltd has floated a joint venture company with a fishermen’s trust to build a Rs 45-crore modern fishing harbour in Kanyakumari District. The proposed harbor located in Rajakkamangalamthurai, 16 km west of Kanyakumari. The State government has decided to construct a fishing harbour at Manakkudi of Kanyakumari District with the participation of private sector. 6. Discussion The coastal strip of southwest Tamil Nadu is rich in minerals. There has been significant dredging in the mineral-rich Kanyakumari coast, and this has led to a change in the topology of the area by flattening some areas and making them more vulnerable to a tsunami. At Thengapatanam, RMS wall stones were thrown by seismic waves. In the Thengapatanam estuary sea water went up to 2 kms into the land. Beach width was decreased due to tsunami up to 3m. Sand deposited 7m height along the coastline is removed by the catastrophic waves. The coconut trees were affected due to intrusion of the sea waters. Due to presence of Groins and RMS wall in Enayam, the damages were less and run up elevation, inundation distance were of low values. In Midalam, Shrubs and herbs were destroyed, due to the blocking of RMS wall presence made less damages in Midalam. Groundwater was contaminated and salinity was increased in the places. Beach morphology was significantly changed leading to steep slope from gentle slope conditions. In Keezhamankudy, the catastrophic effect was very severe because the altitude was very low along with the greater depth in the offshore region. The Pazhayar
eer.ccsenet.org Energy and Environment Research Vol. 7, No. 1; 2017
61
estuary has swampy nature and large catchments area leading to high inundation. Above all, the RMS walls have been disturbed with many opening for fishing practice also another reason for high inundation. The tsunami waves with greater force entered through the low lying land Chothavilai beach in the west has turned towards the eastern direction leading to more destruction in western end of Manakudy village. Between Pallam and Sothavilai, Periakadu and Pallam beach, the effect of the killer waves have not been noticed because the wide sandy dunes and beach ridges have protected the coast. Similar type of reports has been witnessed in Queen Beach Bahu Hawai (Keating et.al. 2004). The sediments were transported from the offshore region leading to changing in the offshore topography (bathymetry). The old potential fish catch areas have been recorded using GPS (Global Positioning System) may be altered. So the impact of change in the bathymetry played a vital role in the fishing sector. The tsunami had also considerably changed coastal morphology which eroded and transported large quantity of sediments from the shore up to 1 km. with thickness from 2cm to 10cm. At the same time, which brought large quantity of sand from the offshore silt, clay, pebbles has higher thickness than sand and backwash had higher speed than incoming waves. This made a long term impact on coastal environment. Normally wave activity is very active in Arabian Sea. During the new moon day and full moon day tidal wave rises more than normal day, because of gravitational pull of the earth. When the sea water crossed high water line, and had not been retrieved back causing a serious impact to low lying coastal regions. The human settlements, agricultural lands and industries have been more affected. Our study confirmed that sea water rises 2 to 4 m in the study area due to tsunami and almost all coastal areas were eroded. Except Muttom, Kanyakumari District coastal villages were eroded year by year due to many factors mainly global warming, sea level rise etc. RMS walls were laid to protect to the coast of the entire district except few places. But tsunami had a strong hands to erode the coast substantially so that possibility of RMS walls on the shore have been submerged and huge quantity of big stones are required to safe guard coast from the coming monsoon rough weather. Even though the coastal zone regulation act implemented in 1991 but new structure were constructed within 500m from the shore without any difficulty. We found settlement, industries etc less than 100m from the shore when the seismic sea waves entered irreparable loss was obtained by the community. In Colachel, two ice plants were situated within 10m from the shore. When Tsunami attacked the gas units of ice plant were exploded. In the name of tourism, natural dunes and ridges were removed in some of the areas. In between Rajakkamangalam, Azheekal, new tourist destination was developed like Thekkurichi, and nearby children’s park when the killer wave entered in this region, and destructed Azheekal and Pillaithoppu villages. The tsunami created demand for fiberglass reinforced plastic catamarans in boatyards of Tamil Nadu. Some statistics indicate that by 2004 about 70-75 per cent of the wooden kattumaram fleet in Tamil Nadu had been replaced by FRP or fiberglass reinforced plastic. Throughout the region, more small fishing boats are being replaced than were lost, swelling fishing fleets to a size greater than they were before the disaster. Replacing boats and infrastructure is easy, compared with remaking fisheries policy and changing age-old practices of communities to ensure sustainable livelihoods. 7. Conclusions Apart from the heavy toll on human lives, the Indian Ocean tsunami has caused an enormous environmental impact which will affect the region of many years to retain it normally. It has been reported that damage has been confirmed on all ecosystems such as Coastal Wetlands, Vegetation, Sand dunes and rock formations animal and plant biodiversity and ground water. The inundation water carried the sands from the offshore have caused a major damages in the biodiversity. The main effect caused by contamination of the fresh water supplies and the soil by salt water infiltration and deposit of a salt layer over arable land. It also caused heavy casualty, the destruction of plants and important soil micro-organism a strong impact during the monsoon period from May to August. Tsunami disaster, which shook this district being a trail of death and destruction. Several significant changes followed the tsunami, influencing many facets of coastal planning and governance. In retrospect, the most striking is the scale and intensity of attention the subject of coastal management and development has since received in India. Coastal habitats and coastal communities continue to be recipients of post-tsunami local, national and international consideration. While human physical strength is nothing compared to the fury of nature, united efforts of several individuals and organizations working with determination can definitely make a difference. Government agencies, NGOs, service minded religious groups and individuals have worked hard in hand to ameliorate the suffering of the affected families and bring their life back to normal. The existing boat yards increased their capacity and old hands were recalled. Many new yards materialized along the coast to make new boats and repair damaged boats. The Government of Tamil Nadu introduced G.O. 172 on 30 March 2005 declaring that all new government-sponsored houses would only be constructed at least 200 metre from the high tide line. Those who intended to construct buildings within 200 metre would not be eligible for government

eer.ccsenet.org Energy and Environment Research Vol. 7, No. 1; 2017
62
assistance. Now the majority of the coastal people built houses and other structures beyond 200 m. A lot of progress has been made in the lives of tsunami affected people with the help of Government, NGOs and service minded individuals. The tsunami can become a positive force for change and stimulate opportunities for co-management and better collaboration with government officials, local authorities, NGOS, and local fishers. 8. Recommendations (i) Education is a fundamental aspect of tsunami hazard mitigation. Politicians, scientists, and the public, especially those who live in coastal areas, must properly perceive and understand the hazards of tsunamis before the danger can be mitigated effectively. People living in areas prone to tsunamis need to recognize the threat and learn how to respond to it. All the coastal villages are protected with RMS walls with a minimum height of 40 to 50 feet. The distance between the coastal villages covered with artificial ridges and dunes near the coast. This can be used for safe fishing activities. Mangroves and growing vegetation along the coast can give protection from the erosion and tsuami activities Like coastal zone regulation act which prohibit further construction up to 500m MSL a limit for construction near the estuaries. Acknowledgement The authors are thankful to the Joint Secretary. University Grants Commission (UGC) , SERO, Hyderabad for providing the financial assistance under Minor Project Scheme (MRP.812/05, Link No. 1812.0). References Abdul, R. K. A., Kesava, D. V., Revichandran, C., Vijayan, P. R., & Tony, J. T. (2006), Tsunami impacts on
morphology of beaches along south Kerala coast, west coast of India. Science of Tsunami Hazards, 24(1), 24 .
Alpa, S., Snigdha, S., Arvind, J., & Prathibha, G. (2006). Effects of the December 2004 Indian Ocean Tsunami on the Indian Mainland, Earthquake Spectra, 22(S3), S435–S473. https://doi.org/10.1193/1.2208562
Altinok, Y., & Ersoy, S. (2000). Tsunamis observed on and near the Turkish coast. Natural Hazards, 21,185-205. Ambrasey, N. N. (1962). Data for Investigation of the Seismic waves in the Eastern Mediterranean. Bulletin of
Seismological Society of America, 52(4), 895 – 913. Chandrasekar, N. S., Saravanan, J., Loveson, I., & Rajamanickam, M. (2006). Classification of Tsunami Hazard
along the Southern Coast of India: An Initiative to Safeguard the Coastal Environment from Similar Debacle Science of Tsunami Hazards, 24(1), p.3.
Chandrasekar, N., Jeyakodi, L. I., Jeyaraj, D. S., Manoharan, R., & Sakthivel, S. (2007). Appraisal of tsunami inundation and run-up along the coast of Kanyakumari District, India – GIS analysis. Oceanologia, 49(3), 397–412.
Curtis, G. D. (1982). Post tsunami survey procedures. JIMAR, University of Hawaii at Manoa. Dawson, A. G. (1994). Geomorphological effects of tsunami run-up and backwash. Geomorphology, 10, 83-94. Emery, K. O. (1961). A Simple Method of Measuring Beach Profiles. Limnology and Oceanography, 6, 60. Government of Tamilnadu Publication. (2006). Two years of Tsunami Relief and Rehabilitation, The
Kanyakumari Experience. Hentry, C., Chandrasekar, N., Saravanan, S., & Dajkumar, S. J. (2010). Influence of geomorphology and
bathymetry on the effects of the 2004 tsunami at Colachel, South India. Bulletin of Engineering Geology and Environment, 69, 431-442. Retrieved from http://walrus.wr.usgs.gov/tsunami/sumatra05/
Kurian, N. P., Abilash, P., Pillai, K., Rajith, B. T., Murali, K., & Kalaiarasan, P. (2006). Inundation characteristics and geomorphological impacts of December 2004 tsunami on Kerala coast. Current Science, 90(2), 25.
La Fond, E. C., & Prasada, R. R. (1954). Beach Erosion Cycles near Waltair on the Bay of Bengal, Andhra Univ., India. Memoir in Oceanography, 1, 63-77.
Mader, C. L. (1997). Modeling of the 1994 Skagway Tsunami," Science of Tsunami Hazards, 15(1), 41-48. Murty. T. S., & Bapat, A. (1999). Tsunamis on the coastlines of India. Science of Tsunami Hazards, 17(3),
167-172.

eer.ccsenet.org Energy and Environment Research Vol. 7, No. 1; 2017
63
Narayan, J. P., Sharma, M. L., & Maheshwari, B. K. (2005). Effects of medu and coastal topography on the damage pattern during the recent Indian ocean tsunami along the coast of Tamilnadu. Science of Tsunami Hazards, 23(2), p.9.
Paul, S. K., McLean, R. F., Brander, R. W., Nichol, S. L., Smithers, S. G., Ford, M. R., Parnelli, K. E., & Aslam, M. (2006). Geological effects of tsunami on mid-ocean atoll islands: The Maldives before and after the Sumatran tsunami. Geology, 34, 177-180.
Perumal, S., Bhagavathi, & Thamarai, P. (2008). Lithological studies of soils strata along the coastal area of kanyakumari to Colachel coastal belt, South Tamilnadu, India. International Journal of Applied Environmental Sciences.
Shuto, N. (1991). Historical Changes in Characteristics of Tsunami Disasters," In International Symposium on Natural Disaster Reduction and Civil Engineering, Sept. 18, 1991, Kansai Univ., Osaka, Japan, JSCE, pp 77-86.
USGS. (2005). Magnitude 9.0 – Sumatra – Andaman island earthquake, off the west coast of northern Sumatra, 2004 December 26 at 00:58:53 UTC, USGS, NEIC, World Data Center for Seismology, Denver. Retrieved from http://earthquake.usgs.gov/eqinthenews/2004/usslav
Vasudha, A. G. (2005). Analytical Study of Living Environment In The Tsunami Affected Areas Of Tamil Nadu, India ISET Journal of Earthquake Technology, Technical Note, 42(4), 219-225.
Copyrights Copyright for this article is retained by the author(s), with first publication rights granted to the journal. This is an open-access article distributed under the terms and conditions of the Creative Commons Attribution license (http://creativecommons.org/licenses/by/3.0/).


![East Japan Earthquake and Tsunami: key lessons for …unesdoc.unesco.org/images/0021/002161/216169E.pdfPreface The East Japan Earthquake and Tsunami [EJET] has brought damages to different](https://img.pdfslide.net/doc/110x75/5af9dc7e7f8b9abd588d76e4/east-japan-earthquake-and-tsunami-key-lessons-for-the-east-japan-earthquake.jpg)