Embed Size (px)
Citation preview

Progress ReviewProgress Review
North Castle Budget & Finance Advisory Task ForceSeptember 27, 2010

Tonight’s AgendaTonight s AgendaOverview and ConclusionsHi i l fi i l fHistorical financial performanceTown capital and reservesFive year outlookFive year outlookPeer review and potential for changePotential for changegInitiatives Underway and Task Force RecommendationsQuestions & Answers
Questions and Answer session – Please use question cards to be distributedquestion cards to be distributed

Overview and ConclusionsOverview and Conclusions
Alex Greene

The Town of North Castle
Armonk, Banksville & North ,White Plains
24 square miles and 98 miles of streets
12,162 population (2009 estimate)(2009 estimate)
Covers 5 school districts
4 200 Households4,200 Households

To begin…
We are your neighborsWe are independentWe are independentOur interests and yours are aligned
This is an information session We ask that itThis is an information session. We ask that it not become a political forum.

Task Force MembersName Background
William Potvin – Management Consultant / Former CEOWilliam PotvinChairman
Management Consultant / Former CEO
David Grove Globally Recognized Economist
Alex Greene Corporate Finance / Restructuring Professionalp / g
Larry Ruisi Corporate Board Member; Former CEO/CFO
Jim Stone Retired Banking Executive
i CDennis Vanson CPA
Janet Morley Municipal Finance Expert
Chris Tuzzo Investment Professional

Why the Task Force?
develop a fact based financial planning process for the Town p p g pof North Castle…
with a focus on sustainable short and longer term spending plans and budgets which are affordable for its residents…
which balances the town’s service priorities in a comprehensive manner
Adapted from the mission statement adopted by the North Castle Town Board in February 10 2010Town Board in February 10, 2010

Our process
Four phasespUnderstand the town; get behind the numbersBecome a part of and help guide the budget processProvide recommendations based on a review of town functions and observations in the budget processMonitor verify and report the resultsMonitor, verify and report the results
Where are we today?Where are we today?We’re behind the numbers (phase 1) and engaged in the budget process

Key takeaways
Operating cost structure that is unsustainablep g
Legacy obligations that are substantial and must be addressed
Infrastructure underinvested and in need of attentionInfrastructure underinvested and in need of attention
Economic environment that requires change and a community that is demanding the samethat is demanding the same
Financially strong town with the capacity, today, to support changeg

Establishing prioritiesEstablishing priorities
Services and AffordabilityAffordability
Taxes
Effi i t d ti d t bl tEfficient, productive and accountable government

Our “what if” scenarioOur what if scenarioFive Year Outlook - AssumptionsEconomy Choppy and sluggish
Assessables Decline 1% p.a.
T t t St tCan the Town affordably deliver desired services Town structure Status quo
Labor contracts Status quo
Reserve Funds Rebuild Reserves
deliver desired services without change?
Reserve Funds Rebuild Reserves
Capital Spending Resumed as needed
No 44% cumulative increase in Town tax rate over 5 yearsTown tax rate over 5 years

What “is” vs. what “if”What is vs. what if
Town Initiatives
The Town of North Castle has begun taking steps to
Town Initiatives• Departmental consolidation• Restructured labor contractshas begun taking steps to
implement change and avert the “what if” scenario
• Early retirement incentives• Shared services• Selective outsourcingSelective outsourcing• Replenishing reserves
Are the proposed changes logical, timely, can they b t d d th hbe executed and are they enough
Tonight’s AgendaTonight s AgendaOverview and ConclusionsHistorical financial performanceHistorical financial performanceTown capital and reservesFive year outlookFive year outlookPeer review and potential for changeInitiatives Underway and Task Force RecommendationsQuestions & Answers
Questions and Answer session to follow(question cards to be distributed)q

Town Financial OutlookTown Financial Outlook
Larry Ruisi / Jim Stone / Dennis Vanson

HISTORICAL FINANCIAL2005‐2010
HISTORICAL FINANCIAL PERFORMANCE

Composition of TaxesComposition of TaxesREAL ESTATE TAXES
= 66% = 18%
SCHOOL COUNTY TOWN
= 16%
SCHOOL COUNTY TOWN
SPECIAL DISTRICT TAXES
FIRE AMBULANCE WATER SEWER STREET LIGHTS

Makeup of Town SpendingMakeup of Town Spending
GENERAL GOV’T PUBLIC SAFETY HIGHWAY LIBRARYGENERAL GOV’T PUBLIC SAFETY HIGHWAY LIBRARY22% 30% 20% 7%
BUILDING/PLANNING PARKS & RECREATION TRASH CAPITAL PROJECTS5% 12% 4%
Based on 2010 Budget

Fundamentals of Real Estate TaxesFundamentals of Real Estate Taxes($ IN MILLIONS)
EXPENSES ‐ REVENUE & CASH = REAL PROPERTY TAXES
2005 ACTUAL$20 8 $7 9 0 $12 8$20.8 $7.9 0 $12.8
2010 BUDGET$23 4 $5 5 $ 4 $17 5
INCREASE (DECREASE)
$23.4 $5.5 $.4 $17.5
C S ( C S )12.5% ( 30% ) ‐ 36.7%

Calculation of Real Property Tax Ratesp y
($ in Millions except tax rate)
REAL PROPERTY TAXES TOTAL ASSESSED VALUATION REAL PROPERTY TAX RATE
2005 ACTUAL$ $ $$12.8 $113.6 $114.41 (per $1000)
2010 BUDGET$17.5 $118.7 $147.43 (per $1000)
INCREASE
$17.5 $118.7 $147.43 (per $1000)
36.7% 4.5% 28.8%

What Changed ‐ 2005 vs. 2010 BudgetWhat Changed 2005 vs. 2010 Budget
$ in Millions Tax Rate / $1,000
2005 Real Property Taxes $12.8 $114.41
Decrease in Town Revenues
Mortgage Taxes $1.9
License & Permits 0.2
Sales Taxes 0.2
Other 0.1 $2.4 $21.12
Increase in Expense
Salaries & Benefits $2 5Salaries & Benefits $2.5
Other Expenses 0.1 $2.6 $22.88
Use of Cash Holdings $(0.4) $(3.52)
Increase in Assessed Value $(7.52)
2010 Budget Real Property Tax $17.5 $147.37
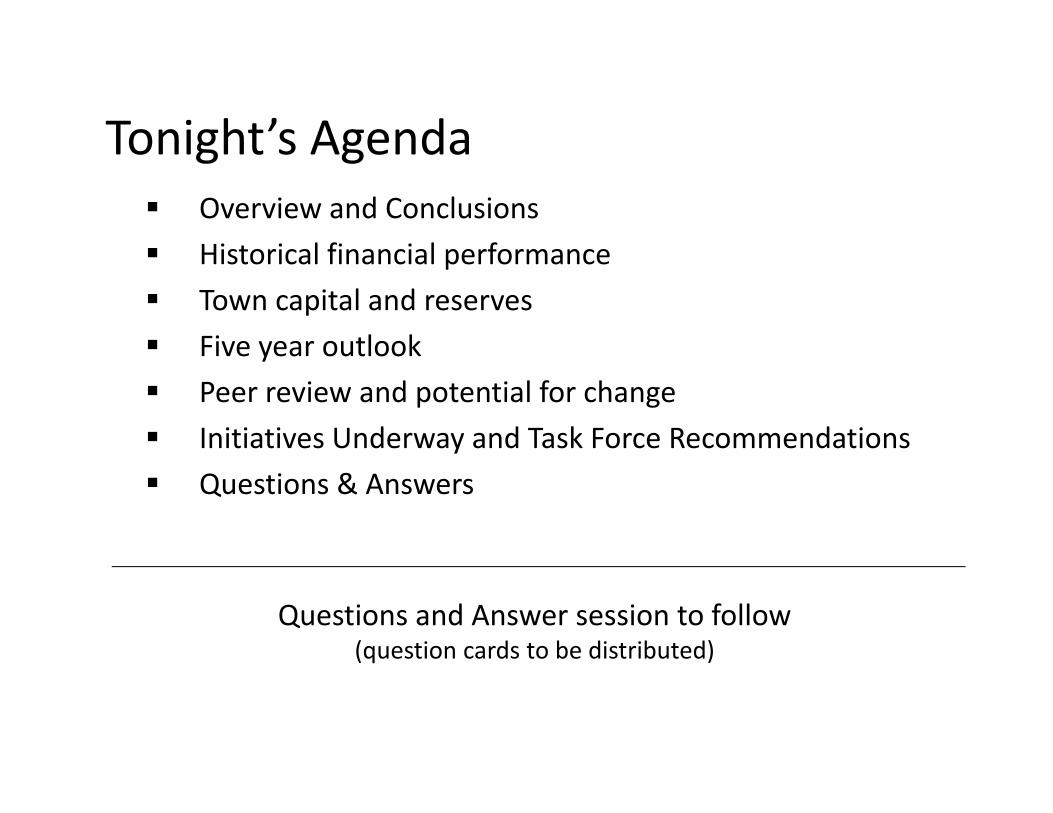
Key Metrics*: 2005 ‐ 2010Key Metrics : 2005 2010
$MM, except tax rate 2005 2010 BIncrease/
(Decrease) %Town Revenues $7.9 $5.5 ($2.4) (30%)
Salary & Benefits $14.3 $16.8 $2.5 17.5%
Total Town Expenses $20.8 $23.4 $2.6 12.5%
Real Property Taxes $12.8 $17.5 $4.7 36.7%
Assessed Value $113.60 $118.7 $5.1 4.5%
General Fund Balance $2.1 $1.0 ($1.1) (52%)
Tax Rate $114.41 147.37 $32.96 28.8%
Full Time Employees ** 142 113 (29) (20%)
Total Comp / Full Time Employee $96k $124 k $28 k 29%* General / Highway & Library Funds** Excludes Special Districts and Part Time

TOWN CAPITAL AND RESERVESAlex Greene / Janet Morley
TOWN CAPITAL AND RESERVES

Capital spendingCapital spending
Largely deferred in recent th th t /years other than water/sewer
Reduced to less than 1% of expenses in 2010 budgetPre recession (2008) spendingPre‐recession (2008) spending for towns in NYS at 16% of spendingExpected annual range forExpected annual range for North Castle of ~$1.5 –4.0MMCapital Improvement Program (CIP) i i i d f 2011 b d(CIP) initiated for 2011 budget

Capital ExpendituresCapital Expenditures
“What if” scenario includesPrincipal Expenditures
What if scenario includes $15MM five‐year estimateFinanced through BANs and 5 to 20 year financing
• DPW facility• Road repair• ADA mandated modifications20 year financing
Parking district and recreational facilities are potential revenue generators
• Repairs and improvements to town facilities and infrastructure
CIP modeled on other Westchester communitiesCIP evaluation and scoring process offers opportunity for
Debt Capacity• Credit Rating
process offers opportunity for discipline and long term planning and execution
• Cumulative tax burden with school and county taxes
• Annual debt service obligation
24
g• Plan to replenish fund reserves

ReservesReserves
Over the last 10 years, North Castle has drawn down its y ,general fund reserve to fund operationsRating Agencies expect reserves of 10% ‐ 20% for investment
d dit 2009 di 17% f A t d 50Kgrade credits. 2009 median = 17% for Aa towns under 50K population.North Castle Reserves = $3.1MM or 29% in 2000 vs. $1.2MM $ $or 7.8% in 2009Town Board has adopted a new policy to rebuild reserves to 10 15% f di10 – 15% of spendingOur “What If” scenario assumes reserves at 15% of spending

Actual Reserves vs. Standard
General, Highway, Library Fund Reserves
Actual Reserves vs. Standard
20% of Expenses$3,500
$4,000
Ge e a , g ay, b a y u d ese es
10% of Expenses$2 000
$2,500
$3,000
000
Standard Range 10% of Expenses
Actual NC Reserves
$1,000
$1,500
$2,000
$0
$0
$500
2000 2001 2002 2003 2004 2005 2006 2007 2008 2009 20102000 2001 2002 2003 2004 2005 2006 2007 2008 2009 2010

OPEBOPEB
Contractual obligation to 67 What is it?gretired and 140 active employees (2008)M di l D t l D & Vi i
What is it?Other Post Employment
Benefits (OPEB)Medical, Dental, Drugs & VisionNon‐uniform eligible: Currently 10 yrs * service/age 55
Basically, medical benefits provided to employees and their spouses throughouty / g
Uniform eligible: 10 Years Service
their spouses throughout retirement
Town contributes from 60% to 100% of total cost

OPEBOPEB
Unfunded, off‐balance sheet liability $4
s
Actuarial Forecast
$51MM present value in 2008 $$150MM total obligation; $87MM forecast to be paid through 2040
$3
t $m
illions
forecast to be paid through 20402010 budget expense of $1MM; $2.2MM in 2020…and growing
$2
Annu
al Cost
New employees increase total cost $1
2010 2030
AHow to pay legacy OPEB obligations is a national issue;
determining what benefits to provide employees is a local issue
28

FIVE YEAR OUTLOOKLarry Ruisi / Jim Stone / Dennis Vanson
FIVE YEAR OUTLOOK

5 Year Outlook – Assuming Current Practices and Policies5 Year Outlook Assuming Current Practices and Policies
Baseline to assess potential changes – not a business plan or forecastforecastOperational assumptions
Town revenues have modest but steady increaseSalaries and benefits increase at current contract ratesOPEB cash costs based on 2008 actuarial report Other expenses based on adjusted three year averagesEach year contains $500,000 contingency
C i l di d fi i iCapital spending and financing assumptionsBased on 2011 Budget CIP forms and interviews with department heads Estimated Capital Expenditures ~ $15 million over 5 yearsDPW Facility road repair and other facilities improvement programs includedDPW Facility, road repair and other facilities improvement programs includedMajor items financed with 5, 10 and 20 year maturities at earliest opportunity
Other assumptionsGeneral fund restored to15% of spending per Town policyp g p p yAssessed value decreases 1% per annum
30

Sources of Non Prop Tax RevenueSources of Non Prop Tax Revenue
13%14%Payments in Lieu of Taxes
30%
10% Sales Tax / Tax Penalties
Mortgage Tax *30%
9%
24%Departmental Income
Licenses & Pernits
Fi I O h9% Fines, Interest, Other
*NOTE ‐MORTGAGE TAX DECREASED BY 79% FROM 2005 TO 2010
2010 Budget

Composition of ExpensesComposition of Expenses2%
0.5%1%
Salaries & Benefits (incl Cash OPEB)
4%
2% 2% 4%Salaries & Benefits (incl. Cash OPEB)
Contractural Obligations
Supplies & Expenses
12%
Supplies & Expenses
Utilities
Vehicles / Fuel & Repairs72%
Vehicles / Fuel & Repairs
Principal & Interest
Furniture Fixtures & EquipmentFurniture, Fixtures & Equipment
Insurance
OtherOther
2010 Budget

Five Year OutlookFive Year Outlook($ IN MILLIONS)
& =
EXPENSES REVENUE CASH REAL PROPERTY TAXES
2010 BUDGET$23.4 $5.5 $.4 $17.5
2015 OUTLOOK
INCREASE
$30.2 $6.6 ($.4) $24.0
29% 20% ‐ 37%

Five Year Outlook: Real Property Tax RateFive Year Outlook: Real Property Tax Rate($ in Millions except tax rate)
REAL PROPERTY TAXES TOTAL ASSESSED VALUATION REAL PROPERTY TAX RATE
2010 BUDGET$17 5 $118 7 $147 37( $ )$17.5 $118.7 $147.37(per$1000)
2015 OUTLOOK$24.0 $112.9 $212.72(per$1000)
INCREASE (DECREASE)
$ $ $ (p $ )
37% ( 5% ) 44%

What Changed – 2010 Budget vs. 2015 OutlookWhat Changed 2010 Budget vs. 2015 Outlook
$ in Millions Tax Rate / $1,000
2010 Real Property Taxes $17.5 $147.37
Increase in Town Revenues $(1.1) $(9.27)
Increase in Expense
Salaries & Benefits $3.8
I t t & P i i l (C ) 1 8Interest & Principal (Capex) 1.8
Contractual Obligations 1.1 $6.8 $57.29
Increase in Reserve Balances $0 8 $6 74Increase in Reserve Balances $0.8 $6.74
5% Decrease in Assessed Value $10.59
2010 Budget Real Property Tax $24.0 $212.72

5 YEAR OUTLOOK2010 2011 2012 2013 2014 2015
Operating Expenses (GHL) $23.4 $24.4 $25.4 $26.4 $27.4 $28.4
* Excludes Special Districts
Operating Expenses (GHL) $23.4 $24.4 $25.4 $26.4 $27.4 $28.4
CAPEX – Principal & Interest 0.4 0.8 1.3 1.5 1.8
Increase in General Fund (0.4) 0.4 0.4 0.4 0.4 0.4Town Revenues (5.4) (6.0) (6.2) (6.3) (6.4) (6.6)
Total Property Tax $17.5 $19.1 $20.4 $21.8 $22.8 $24.0
A d V l 118 7 117 5 116 4 115 2 114 1 112 9Assessed Values 118.7 117.5 116.4 115.2 114.1 112.9
Tax Rate 147.37 162.52 175.31 189.23 200.00 212.72
% Rate Increase - 10% 8% 8% 6% 6%
Cumulative % Rate Increase - 10% 19% 28% 36% 44%
Potential for Change / Peer Review
William Potvin / Chris Tuzzo

Peer Review ‐MethodologyPeer Review Methodology
Selected Like Northern hWestchester Towns
Used NYS Open Book Data Base Source DataAdjusted For Comparability
Eliminated Non‐Comp Functions –Special Districts, Trash Collection, Fire etcFire etc.Added Library to New Castle & Pound RidgeConsolidated Mount Pleasant Towns / Villages
Compared Per Household and Other Performance BasesValidated Against Most Current Budgets

Peer Review ‐ Key ObservationsPeer Review Key Observations
North Castle’s Cost per Household High Compared to N i hbNeighbors.
Not explained by town size or scaleParticularly high in Public Safety and HighwayHi h l h d hiHigh real cost growth compared to town history
The Large Size of the Variations Suggest Very Different Approaches Among Towns
Results Not Prescriptive but Suggest that AlternativeResults Not Prescriptive but Suggest that Alternative Approaches are Available to North Castle
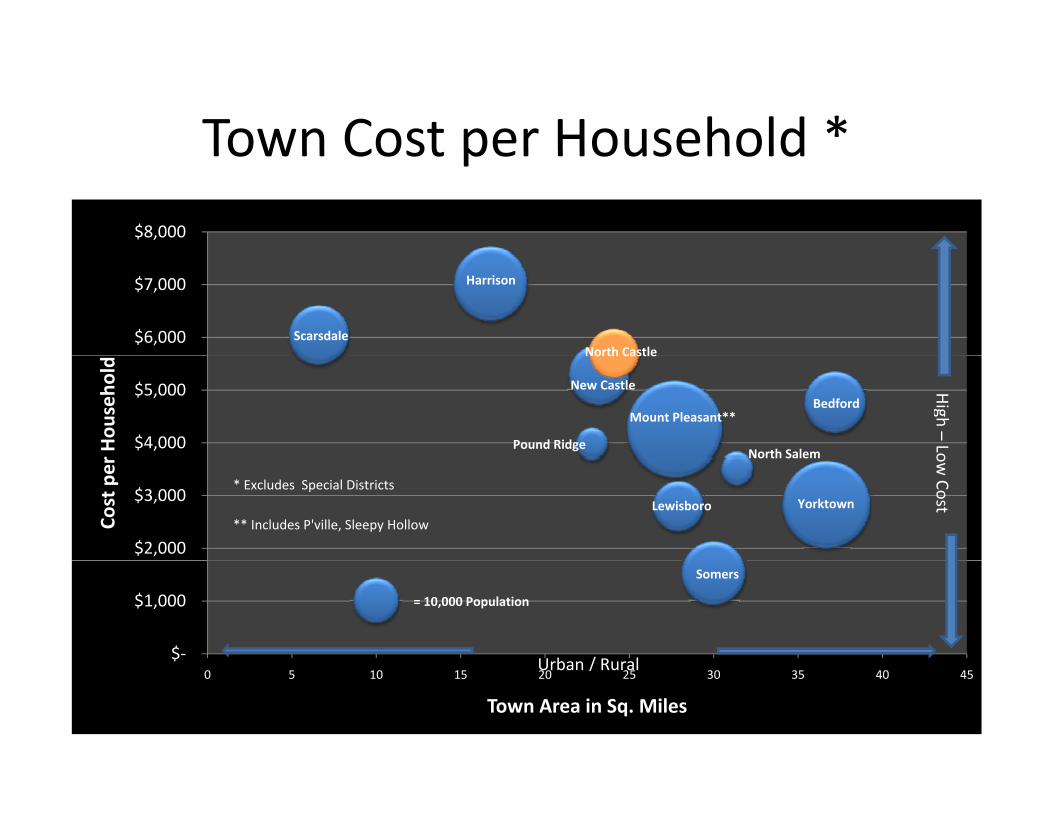
Town Cost per Household *Town Cost per Household $8,000
Harrison
North CastleScarsdale$6,000
$7,000
Bedford Mount Pleasant**
New Castle
North Castle
North SalemPound Ridge$4,000
$5,000
r Hou
seho
ldHigh –
Lo
Lewisboro
North Salem
Yorktown
$2,000
$3,000
Cost per
ow Cost
* Excludes Special Districts
** Includes P'ville, Sleepy Hollow
Somers
= 10,000 Population
$‐
$1,000
Urban / Rural0 5 10 15 20 25 30 35 40 45
Town Area in Sq. Miles
Urban / Rural

Highway / TransportationHighway / Transportation
$ 00
$1,600
Harrison
North Castle
North Salem
Pound Ridge
$1,200
$1,400
Bedford
Harrison
Lewisboro
$800
$1,000
er Hou
seho
ld
Mount Pleasant New Castle
Scarsdale Yorktown$400
$600
Cost pe
Somers Yorktown
= $1 million Expenditure$200
$400
$‐‐ 5.0 10.0 15.0 20.0 25.0 30.0 35.0 40.0 45.0
Town Area in Sq. Miles

Public Safety – Town ComparisonPublic Safety Town Comparison* Excludes Fire & Misc.
Harrison
North Castle
$1,200
$1,400
BedfordMount PleasantNew Castle
Scarsdale
$800
$1,000
Hou
seho
ld
Pound Ridge
Yorktown
$400
$600
Cost per H
Lewisboro
North Salem
Somers= 10,000 Population
$
$200
$400
$‐(5.0) ‐ 5.0 10.0 15.0 20.0 25.0 30.0 35.0 40.0 45.0
Town Area in Sq Miles

Library$600
Library
New Castle *
Scarsdale$400
$500
d
North Castle
Scarsdale
$300
$400
er Hou
seho
ld
Bedford Harrison
North Salem
Pound Ridge **
Yorktown
$200 Cost pe
Lewisboro
Mount Pleasant Somers
= $500k Expenditure$100
$‐(5.0) ‐ 5.0 10.0 15.0 20.0 25.0 30.0 35.0 40.0 45.0
Town Area Sq. Miles

Park / Rec and Elder Programs*Park / Rec and Elder Programs
$800
$900
Harrison
Scarsdale$600
$700
$800
old
Bedford
Mount Pleasant
North Castle $400
$500
$600
er Hou
seho
New Castle Somers
Yorktown$200
$300
$400
Cost pe
Lewisboro North Salem
Pound Ridge
Yorktown
=$1M Expenditures
$‐
$100
$200
* Expenses Net of Fee Income$(5.0) ‐ 5.0 10.0 15.0 20.0 25.0 30.0 35.0 40.0 45.0
Town Area in Sq. Miles

General Government & AdministrationGeneral Government & Administration
$2,000
Scarsdale $1,600
$1,800
Harrison
New Castle
North SalemPound Ridge
$1,200
$1,400
useh
old
Bedford Lewisboro
Mount Pleasant
North Castle
North Salem Pound Ridge
Yorktown
$600
$800
$1,000
Cost per Ho
Mount Pleasant
Somers
= $3 million Expenditures$200
$400
$600
$ p
$‐
$200
‐ 5.0 10.0 15.0 20.0 25.0 30.0 35.0 40.0 45.0 Town Area in Sq. Mles

Employee BenefitsEmployee Benefits
$2,000Employee Benefits ‐ Total Town Budgets
Harrison
Scarsdale $1,600
$1,800
$2,000
Harrison
North Castle
$1 000
$1,200
$1,400
ouseho
ld
Bedford
Mount Pleasant
New Castle
North Salem Pound Ridge
$600
$800
$1,000
Cost per Ho
Lewisboro
Somers
Yorktown
= $3 million Expenditure
$200
$400
$‐
8.0% 10.0% 12.0% 14.0% 16.0% 18.0% 20.0% 22.0%% of Total Town Budget

Real Growth by town Function ‘00/’0980% Adjusted for Inflation
d P l i
Real Growth by town Function 00/ 09
D bt P i i l
Debt Interest
50%
60%
70% and PopulationGrowth 2009/2000
Public SafetyHwy ‐ Transport
Debt Principal
30%
40%
50%
009 / 2000
Culture & Rec.
= $1 million10%
20%
30%
Growth 2
Town AdminEcon Development
Home / Comm Serv.
‐10%
0%‐$500 $0 $500 $1,000 $1,500 $2,000 $2,500
‐20%Cost per Household ‐ 2009

Initiatives Underway and Task Force Recommendations
Alex Greene

What “has been” vs. what “is”What has been vs. what is
Then… NowSteps taken in recent years (then) have
addressed immediate
Then…
Hiring freeze
Reduction in force
…Now
Establish DPW
Labor Consultantneeds ($$); steps in process today (now) are more forward
thinking
Reduction in services
Reserve drawdown
abo Co su a
Budget Task Force
Early retirementgDeferral of capital spending
Rebuild reserves
CIP review
Are the proposed changes logical, timely, can they b t d d th hbe executed and are they enough

Action itemsRestructure managementOutsource selected functionsDevelop shared service opportunities
Action items
Next Steps ‐Departmental Reviews
Develop shared service opportunitiesMerge operations across jurisdictions Invest in technologyAlt / b l i l lto develop well
thought out solutions
Alter / rebalance service levelsAdopt approaches in other townsVolunteer services to address peaksli i i l i i iEliminate non‐essential activitiesand, importantly…
Develop revenue opportunities
North Castle doesn’t have to reinvent the wheel to succeed

HeadwindsWeak economySubstantial reduction in revenue
Headwinds
However, very real challenges lie
Few new development projects Decline in real estate values Outdated and inefficient organizationC l l b ti tichallenges lie
aheadComplex labor negotiations Rising cost of health carePension costs mandated by NYSBorrowing to support re‐investment inBorrowing to support re‐investment in infrastructure requires credible plan
To succeed the Town must come together

Tough decisionsTough decisions
The times require change NowThe times require change. Now.Change requires new thinking and awillingness to challenge old waysNot all change is in our controlChange requires political willNorth Castle has an opportunity to lead the way in change
Efficient, productive and accountable government

Spending capsSpending caps
Good in concept, challenging in practiceTool for managing and instilling disciplineMust accommodate changing realities andThe Elephant in Must accommodate changing realities and shifts in services sought by the communityAlternative is a culture of efficiency and
bili
The Elephant in the room
accountability
For each action there should be IF IT COSTS MORE, DO IT BETTER AND
an equal and opposite reaction DO IT BETTER AND LESS EXPENSIVELY

RecommendationsRecommendations
Accelerate actions underwayConsolidate town functions through DPW initiativeRe‐balance labor cost structureUndertake departmental reviews (i e police library parks/recreation)Undertake departmental reviews (i.e., police, library, parks/recreation)
Reform town benefit policies and plansInvest in in‐depth and detailed reviewInvest in in depth and detailed review
Reform the planning and budget processesAdopt rolling five year financial planAdopt rolling five year financial planPromote decisions based upon informed and supportable analysis
Borrow responsibly to rebuild infrastructureCreate a permanent advisory/review board

Questions & AnswersQuestions & Answers
William PotvinModerator


![1 Abstract0 0 2 Introduction0 3 Requirements0 · Version:4.2.2" Effective0Date:"October"27,"2010"" " " Posted"on"theDACC"websiteon"[date]"by"[username]" Page7"of"14" " Supplementary](https://img.pdfslide.net/doc/110x75/60113ff7cca9491d3c5898ba/1-abstract0-0-2-introduction0-3-requirements0-version422-effective0dateoctober272010.jpg)